
Crypto World
Here’s why Chainlink price is a coiled spring poised for a breakout

Chainlink price is forming a major bullish reversal pattern that could ultimately lead to a potential surge to $12 over the coming weeks.
Summary
- Chainlink price rose to $9.40, up ~13% from monthly lows, as a bullish reversal pattern takes shape.
- A double bottom formation points to a potential breakout above $10, with a projected upside toward $12.
- Whale accumulation and declining exchange reserves signal growing long-term confidence and reduced selling pressure.
According to data from crypto.news, Chainlink (LINK) price rallied nearly 8% to $9.40 on Tuesday, locking in gains of nearly 13% from its lowest point over a monthly period. Despite this, the token remains down nearly 25% below from where it started this year.
The 17th largest crypto asset by market cap is showing a highly bullish reversal pattern that suggests the token could be close to a breakout soon.
On the daily chart, Chainlink price appears to be completing a double bottom pattern, which is one of the most popular bullish signs in technical analysis. A breakout from the neckline of such a pattern has historically been followed by strong upside in a related asset for multiple sessions.
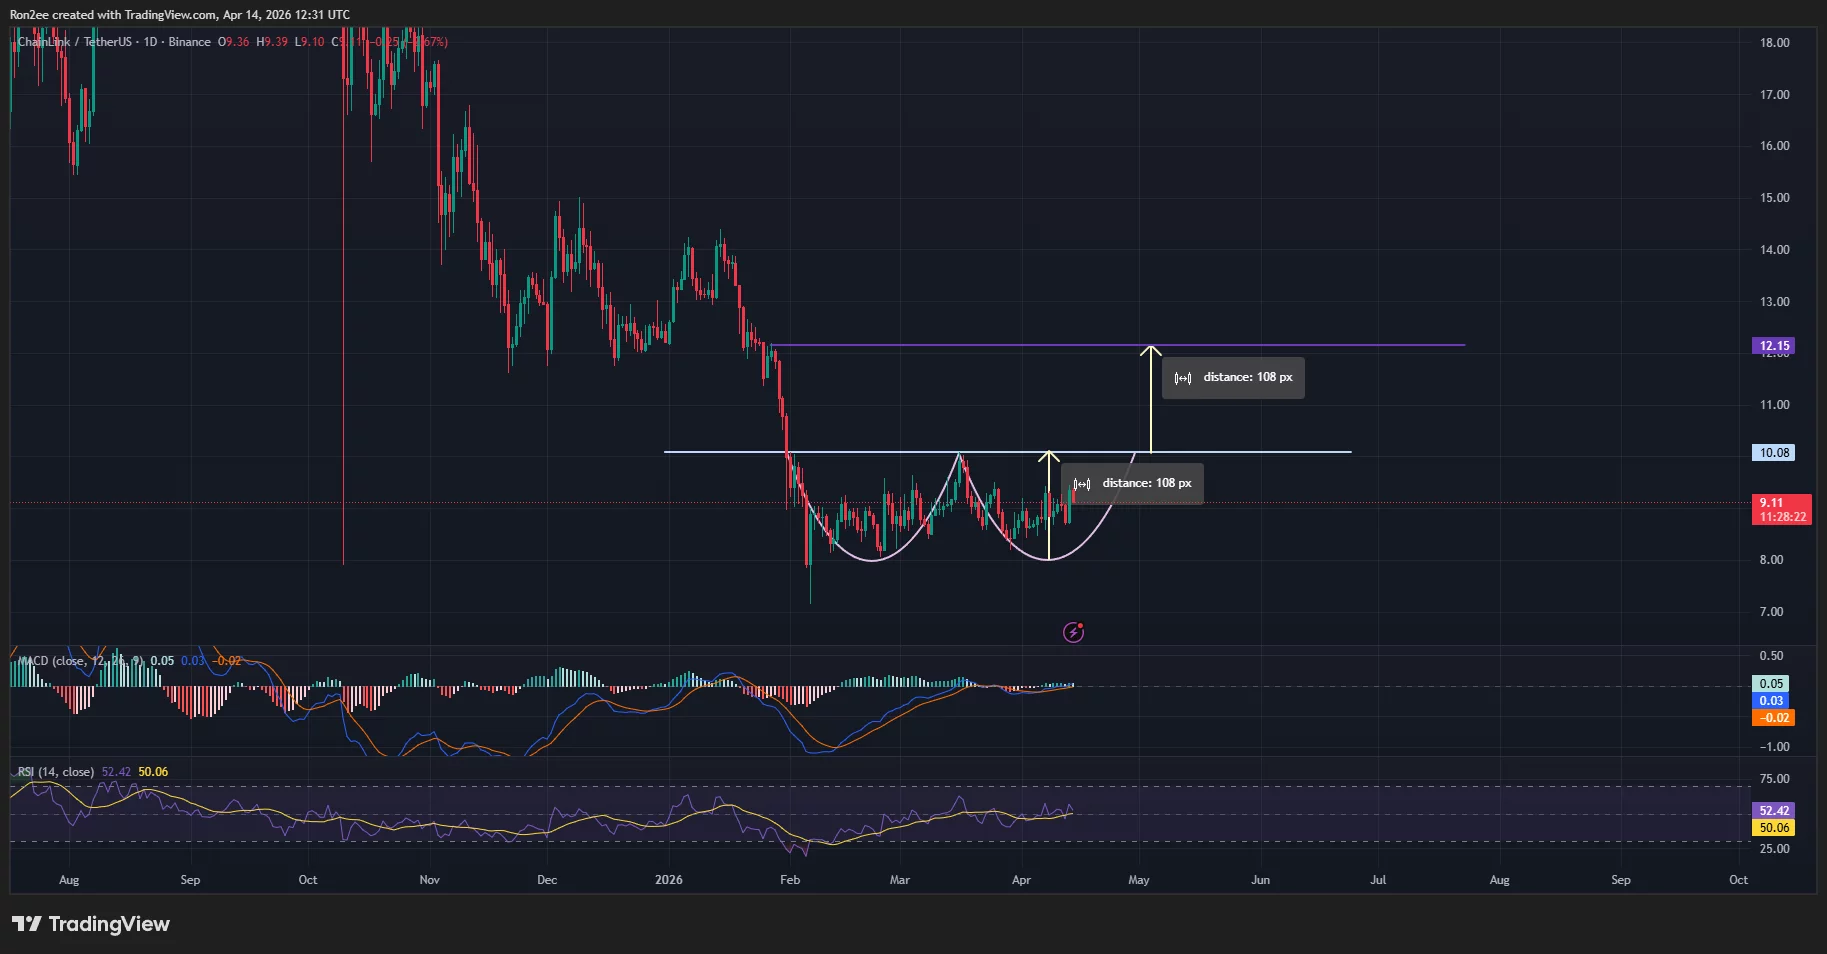
For Chainlink, a breakout from the $10 neckline of the pattern formed could push its price to above $12. This level is calculated by adding the height of the double bottom pattern to the neckline itself.
For now, the most immediate resistance sits at $10, which also serves as a key psychological resistance level. On the contrary, a drop below $8 could erode the ongoing bullish momentum and potentially invalidate the current setup.
Momentum indicators such as the MACD and RSI suggest that a recovery could already be underway. Notably, the MACD lines have moved upwards and are close to breaking out of their bearish zone, while the RSI has bounced above neutral thresholds, suggesting bulls are regaining control of the market.
A major catalyst that seems to be supporting Chainlink price has been active accumulation by whales. According to recent reports, whales have added another 1.89 million LINK tokens worth approximately $16.9 million recently, bringing total holdings by these investors to 661.9 million tokens.
What is interesting is that this large-scale purchase came alongside declining LINK reserves on exchanges, a sign that investors are moving their assets into cold storage for long-term holding.
Disclosure: This article does not represent investment advice. The content and materials featured on this page are for educational purposes only.

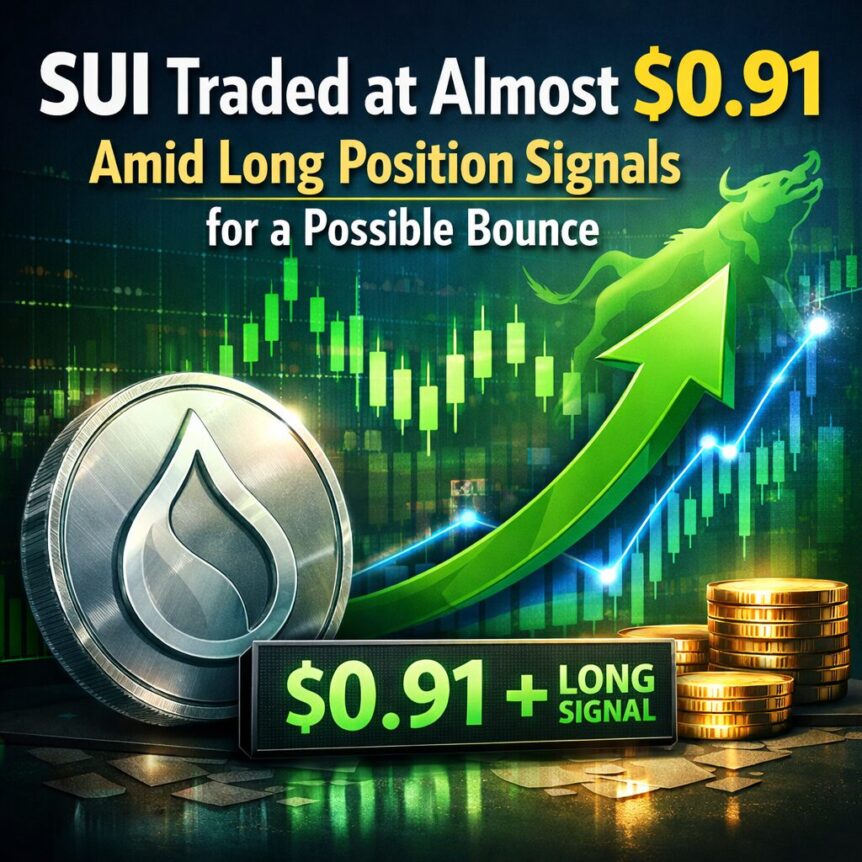
The price of SUI is currently at $0.91, with a possibility of a short-term bounce due to increasing long positions despite poor technical signals.
Key Insights
- SUI continues to trade almost around $0.91 due to increasing long positions with strong support between $0.88 and $0.89 and strong resistance at $0.94–$0.97.
- Decreasing open interest along with negative funding indicates low leverage, implying that the spot is what drives any potential bounce.
SUI Hugging Support Levels
SUI was quoted at around $0.91 on May 1, continuing its tight consolidation pattern amid increased market calmness. While general market uncertainty continues and technical indicators point towards negative performance, it is interesting to note that large players remain long, demonstrating their conviction in future growth.
The asset has been under price pressure following its fall from an all-time high level recorded in January, partly due to a network malfunction that dampened investors’ sentiment. In response, SUI saw strong selling activities in derivatives markets, resulting in more than 30% decline in its value below a crucial moving average trendline.
Support and Resistance Mark the Price Range
The present trading activity is characterized by consolidation instead of panic selling. The price of SUI keeps testing support at $0.88-$0.89 several times, indicating active defensive measures on the part of buyers. At the same time, the price fails to rise above the resistance levels at $0.94-$0.97.
Such compression of the price range suggests that a breakthrough is expected soon. Increased volatility usually precedes strong market movements, and the traders are waiting for signals that will show the further direction of the price.
In case the price breaks above the current resistance with an adequate volume, the analysts forecast a short-term increase to the $1.20 price.
Bullish Divergence in Market Sentiment
Analysis of the market’s positioning shows a significant divergence between the price movement and the sentiment of the players in the market. The large players, who are often known as the ‘smart money’, remain net long despite the inability of the price to move up. The retail traders are following suit.
Such divergences can often be followed by abrupt movements in the market, especially where the sentiment is positive but the price is still consolidating.
Nonetheless, one must always be careful because sentiments alone cannot push the prices higher without demand.
Falling Leverage Changes Market Equilibrium
From recent statistics, it can be observed that there has been a fall in open interest despite funding rates being only marginally negative. This is an indication of a decrease in leveraged trades.
Therefore, any positive momentum will have to rely on spot demand and shorts covering rather than leveraged buying. If the buyers enter into the market at critical levels, then it would make the move more sustainable and stable. In addition to this, falling leverage minimizes chances of forced liquidations.
Downside Risks Persist
Though there may be some hope of a rally, the possibility of downside risks cannot be discounted. Should SUI fail to find support near the $0.88 mark, the next level of support might come at roughly $0.85.
There is also the possibility of a further drop to $0.70 should selling momentum build up while buyers refrain from coming back into the game. There is no denying the weakness in the overall market structure due to the recent break below the 200-day simple moving average.
Traders Look for a Decisive Move
Right now, SUI finds itself at a crossroads, where important technical, as well as position in the markets, are aligning themselves. Traders are keeping an eye on liquidity, volume, and order flow for a breakthrough.
The more consolidated SUI becomes, the more conviction we can expect from the next move, whether that is above resistance or below support
World Liberty Financial filed a defamation lawsuit against Tron founder Justin Sun in Florida, escalating a legal fight between the Trump family-linked crypto platform and one of its largest investors.
The lawsuit, filed Monday in the Eleventh Judicial Circuit Court for Miami-Dade County, accused Sun of making false public statements about World Liberty and violating WLFI token-sale terms through alleged prohibited transfers, short-selling and straw purchases.
The lawsuit also accused Sun of spreading defamatory statements surrounding the crypto platform, demanding a court-ordered retraction and compensation from the founder. Sun denied the allegations in a Monday post on X, calling the lawsuit a “meritless PR stunt” and saying he looked forward to defeating the case in court.
The lawsuit comes less than two weeks after Sun sued World Liberty over the freezing of his WLFI tokens, a dispute that has intensified scrutiny of the project’s token controls and governance structure.
The escalating legal battle follows a period of growing backlash towards the crypto platform, which came under scrutiny for a proposal seeking to add a further two-year lock-up period for early investors holding the WLFI token, Cointelegraph reported on April 16.
Sun called the proposal “one of the most absurd governance scams I have ever seen.”

WLFI court filing against Justin Sun. Source: World Liberty Financial / Businesswire
US President Donald Trump and his sons, Donald Trump Jr. and Eric Trump, are listed as the co-founders of the platform, according to World Liberty’s white paper.
Related: Justin Sun presses WLFI to identify wallets behind freeze powers
Sun was fully aware of WLFI’s token freezing rights, lawsuit claims
Sun’s WLFI token address was blacklisted in September 2025 after blockchain data platforms flagged it for a roughly $9 million transfer. Sun said his presale tokens were unreasonably frozen and urged the team to unlock his investment.
However, the lawsuit claims that Sun was “fully aware of World Liberty’s right to freeze user tokens to protect its token holders and its community” and that he agreed to it in the project’s Terms of Sale.
“Rather than acting in good faith, Justin Sun chose to defame World Liberty — repeatedly, publicly, and to millions of followers,” Tom Clare, attorney for World Liberty Financial, claimed, adding that the lawsuit was a “last resort” measure seeking to protect its tokenholders and employees.
The lawsuit claims that Sun previously agreed to WLFI’s “freezing authority” before publicly calling it a hidden “trap door” in a calculated effort to “harm World Liberty while potentially benefiting his own financial positions.”
The lawsuit adds to WLFI’s prior governance concerns, after a March vote showed that 76% of voting power came from 10 wallets. Sun called that an alarming sign of concentrated influence. WLFI clapped back and accused Sun of spreading baseless allegations to cover up his own misconduct and threatened legal action.

WLFI/USD, all-time chart. Source: CoinMarketCap
The WLFI token rose 5% in the 24 hours leading up to 1:43 p.m. UTC on Monday, but is down over 80% since launch, according to CoinMarketCap data.
Magazine: Quitting Trump’s top crypto job wasn’t easy: Bo Hines


Chainlink price rose 3% on May 4, its biggest single-day gain in two weeks, as Consensus 2026 opened.
Summary
- LINK climbed alongside Bitcoin’s return above $80,000, with the broader risk-on session lifting infrastructure tokens across the board on May 4.
- Chainlink’s CCIP cross-chain protocol averaged $90 million in weekly token transfers in recent months, providing a fundamental backdrop for the price move.
- LINK had been trading in a tight range between $8.70 and $9.58 for most of April, making May 4’s move its most decisive session in two weeks.
LINK rose alongside Bitcoin’s $80,000 reclaim and the Consensus 2026 conference opening in Miami on May 4. As crypto.news reported, LINK had been consolidating near $9.23 with its RSI at 42.31, just below all three major moving averages, making May 4’s gain a breakout from a month-long stagnation period.
Exchange outflow data from Santiment had already flagged 970,430 tokens leaving centralized exchanges on April 27, the highest single-day outflow since December 2025.
The price move put LINK at approximately $9.39, with $9.50 remaining the near-term technical resistance analysts had identified as the level needed to confirm a directional shift. The $10 level represents the larger resistance that would require sustained institutional follow-through to clear.
Chainlink’s infrastructure build as a price backdrop
As crypto.news documented, Chainlink launched 24/5 US equities data streams in April, delivering sub-second pricing for major stocks and ETFs to more than 40 blockchains. The protocol is embedded in the infrastructure of institutions including Swift, Euroclear, JPMorgan, Mastercard, and Fidelity International.
As crypto.news tracked, CCIP averaged approximately $90 million in weekly token transfers in early 2026 and handled $1.3 billion in cross-chain volume in a single week during April.
The tokenised real-world asset sector hit $27 billion in 2026, with Chainlink positioned as primary oracle infrastructure for that pipeline. Yahoo Finance data confirmed LINK’s intraday range and closing price on May 4.
As crypto.news noted, Chainlink holds approximately 64% of the oracle market and has secured more than $41 billion in total value, giving any broader risk rally a fundamental anchor to pull the token higher.

World Liberty Financial has filed a defamation lawsuit in Florida against Justin Sun, the Tron founder, intensifying a public fight between the Trump-family-backed crypto platform and one of its largest investors. The Eleventh Judicial Circuit Court in Miami-Dade County is the venue for the complaint, which accuses Sun of making false public statements about WLFI and of violating the project’s token-sale terms through alleged prohibited transfers, short-selling and straw purchases. The filing seeks a court-ordered retraction and damages.
Sun responded on X, describing the lawsuit as a “meritless PR stunt” and saying he looked forward to defeating the case in court. The action comes less than two weeks after Sun sued World Liberty over the freezing of his WLFI tokens, underscoring a broader clash over token controls and governance at WLFI.
In the broader context, WLFI has faced increasing scrutiny over its governance structure and the power dynamics surrounding its token. The project previously drew attention for a governance proposal to extend the lock-up period for early investors by an additional two years, a move Sun publicly labeled as “one of the most absurd governance scams I have ever seen.”
The WLFI project also bears political connections in its branding. The platform’s white paper identifies former President Donald Trump and his sons, Donald Trump Jr. and Eric Trump, as co-founders of the project, a detail WLFI has used to frame its narrative and investor outreach.
Key takeaways
- WLFI accuses Justin Sun of disseminating false statements about the project and of violating token-sale terms, seeking a retraction and damages via a court filing in Miami-Dade County.
- Sun publicly rejects the allegations, calling the lawsuit a “meritless PR stunt” and vowing to prevail in court.
- The defamation case follows Sun’s separate suit against WLFI over the alleged freezing of his WLFI tokens, highlighting a broader dispute over token controls and governance.
- WLFI governance and central-control concerns have resurfaced after a controversial March vote that WLFI said concentrated voting power in a small number of wallets, a claim Sun criticized as risky for holders.
- Market data show WLFI’s price has been volatile: the token rose about 5% in the 24 hours before a recent session but remains more than 80% down from its launch, reflecting investor caution around the platform’s governance and legal exposure.
Legal clash sharpens WLFI-Sun confrontation
The defamation complaint contends that Sun publicly characterized WLFI in a way that harmed the project’s reputation and, by extension, its investors. WLFI’s filing states that Sun engaged in statements viewed as defamatory and that he violated terms of sale tied to WLFI’s token distribution. The document requests a formal retraction and monetary damages intended to compensate WLFI and its employees for reputational harm.
Sun rejected the allegations in a Monday post on X, framing the suit as a calculated attempt to silence him. “This is a meritless PR stunt,” Sun wrote, signaling his expectation to contest the claims in court. The public flare-up sits on the heels of Sun’s own legal action against WLFI in which he challenges what he sees as an improper freeze on his WLFI holdings.
Governance under the microscope: concentration, votes, and the two-year hook
The WLFI governance saga has been a persistent thread in the controversy surrounding the project. In a prior development, WLFI proposed extending the lock-up window for early investors by two more years, a move that drew opposition from Sun. He described the proposal as a governance scheme that undermined investor rights and transparency.
Complicating the discourse is a March governance vote that WLFI described as indicating a troubling concentration of influence: WLFI said 76% of voting power came from just ten wallets. Sun dismissed the concentration claim as a serious red flag around centralized control and potential manipulation of governance outcomes. WLFI has defended its stance, while Sun’s team has threatened legal action in response to what they describe as mischaracterizations and attempts to obscure its own conduct.
The white paper for WLFI lists Donald Trump and his sons as co-founders, a detail that feeds into the project’s branding and investor outreach. The arrangement has invited scrutiny about governance legitimacy and the degree to which the project’s leadership can be considered representative of the broader WLFI community, especially as token control and freezing rights come under public debate.
Key moments in the ongoing dispute include Sun’s acknowledgement that WLFI’s freezing authority exists as part of the project’s risk-management framework, and WLFI’s insistence that Sun was aware of this power when he participated in the presale. The lawsuit contends that Sun’s later statements about freezing as a “trap door” were defamatory attempts to harm WLFI’s standing and to influence price and market sentiment to Sun’s financial benefit.
Token controls, freezing rights, and investor implications
Sun’s WLFI address was blacklisted in September 2025 after blockchain monitoring platforms flagged a substantial transfer, a discovery Sun later framed as an unwarranted seizure of his investment. Sun has argued that his tokens were frozen improperly, urging WLFI to unlock his holdings. WLFI’s filing counters that Sun was fully aware of the platform’s right to freeze user tokens to safeguard token holders and the community, and that he had previously agreed to the project’s Terms of Sale.
Tom Clare, the attorney representing World Liberty Financial, framed the filing as a necessary measure to protect WLFI’s tokenholders and employees. He said Sun opted to defame WLFI instead of engaging in constructive discourse, describing the legal action as a “last resort” to defend the project’s governance and integrity.
The battle over freezing rights and governance decisions is not simply a civil dispute; it sits at the intersection of investor protections, platform governance, and the reputational risk that comes from association with high-profile political branding. WLFI argues that its actions were legitimate governance tools designed to protect holders, while Sun argues that the safeguards have been weaponized against him and potentially manipulated to his detriment.
Market data reflect a cautious sentiment around WLFI. According to CoinMarketCap, WLFI rose about 5% in the 24-hour window leading up to a recent session, yet the token remains down more than 80% since its launch. The price trajectory underscores the broader investor concerns about governance transparency, token utility, and the legal entanglements surrounding the project.
What to watch next for WLFI and the broader ecosystem
The unfolding legal battle will test WLFI’s governance framework, particularly its ability to balance protective controls with transparent, accountable decision-making that stands up to regulatory and investor scrutiny. The case will likely cast a long shadow over WLFI’s reputation, its relationship with high-profile backers, and the perceived legitimacy of its tokenomics and sale terms.
Observers will want to monitor whether the court orders a retraction and damages, how Sun’s defense unfolds, and whether WLFI can demonstrate a robust governance model that can withstand public scrutiny and investor risk assessments. The dynamic also raises questions for other projects with centralized control features or branding that ties to political figures, as real-world governance and legal accountability become increasingly central to investor confidence in crypto platforms.
Next steps are unclear in terms of timing, but the outcomes could influence WLFI’s token-holders, existing investors, and potential future backers. Investors should watch for court filings, responses from Sun, and any shifts in WLFI’s governance proposals or risk-management disclosures as the litigation progresses.
Sources and references for the ongoing coverage include WLFI’s court filing and public statements, Sun’s posts on X, prior Cointelegraph reporting on WLFI’s governance and token-freeze disputes, and WLFI’s white paper detailing its claimed founders and governance framework. Readers are encouraged to verify information through the linked materials as cases develop.

Key Highlights
- STKE shares climb 12.6% following the announcement of the $18M HoudiniSwap purchase
- Acquisition introduces cross-chain routing capabilities to Sol Strategies’ infrastructure portfolio
- HoudiniSwap contributed $13M in revenue with over $2.5B in historical transaction activity
- Transaction structured through cash, equity, promissory note, and performance-based earnout payments
- Move diversifies revenue beyond traditional staking operations within the Solana ecosystem
Sol Strategies Inc. (STKE) experienced significant upward movement on Monday following the official announcement of its $18 million HoudiniSwap acquisition. Trading reached $1.4525 per share, marking a 12.62% gain amid robust intraday activity. The price action reflected increasing investor confidence in the company’s strategic diversification efforts.
Sol Strategies Inc. Common Shares, STKE
Strategic Move Into Cross-Chain Transaction Infrastructure
Sol Strategies Inc. saw notable gains after unveiling a binding agreement to purchase HoudiniSwap, a platform specializing in cross-chain swap aggregation. The transaction, valued at $18 million, combines multiple payment mechanisms including cash, equity, and deferred compensation. This strategic move represents a significant pivot toward transaction-based infrastructure services.
HoudiniSwap functions as a non-custodial swap aggregator that directs digital asset transactions across various exchanges and blockchain bridges. The platform has facilitated more than $2.5 billion in aggregate trading volume spanning over 100 different blockchain networks. Its technology integrates with upwards of 18 decentralized trading venues and numerous self-custody wallet solutions.
The acquisition enables Sol Strategies to enhance its position within the Solana ecosystem by incorporating advanced cross-chain liquidity solutions. This capability facilitates greater institutional engagement and optimizes trade execution across multiple networks. Accordingly, the transaction reinforces the company’s vision of developing comprehensive transaction infrastructure.
Deal Terms And Revenue Enhancement Objectives
The acquisition framework consists of $8.25 million in immediate cash payment, complemented by a $5.75 million promissory note and $4 million in stock consideration. Additional components include warrant instruments and a performance-contingent earnout worth up to $10 million. The earnout provisions are linked to achieving an annual EBITDA threshold of $2.5 million.
HoudiniSwap generated roughly $13 million in revenue during 2025, with substantial transaction flow connected to Solana-based operations. Over half of its recent transaction volume involved the Solana network, underscoring strategic alignment. Thus, the acquisition immediately enhances revenue diversity and broadens the company’s income channels.
Sol Strategies indicated it will not divest holdings from its Solana treasury position to finance the transaction. The company plans to utilize alternative financing structures and available capital reserves instead. This approach maintains its strategic Solana exposure while funding growth into software-driven revenue models.
Strategic Vision And Competitive Positioning
This acquisition builds upon the company’s previous purchase of Darklake Labs, which brought privacy-oriented zero-knowledge proof technology into its portfolio. That integration provided advanced tools aimed at enhancing transaction quality and mitigating market manipulation vulnerabilities. Consequently, the firm is systematically assembling a comprehensive digital asset infrastructure ecosystem.
Sol Strategies presents itself as a publicly traded entity specializing in institutional-quality blockchain infrastructure and digital asset treasury management. The company now integrates validator operations, staking services, and transaction routing technology. This multifaceted strategy reinforces its standing within the rapidly developing digital finance landscape.
As Solana continues gaining adoption across financial use cases, the company advances its platform capabilities accordingly. Through the integration of liquidity solutions, privacy enhancements, and execution infrastructure, it establishes a more robust on-chain service offering. The HoudiniSwap transaction underscores its commitment to capturing value across diverse blockchain economy segments.

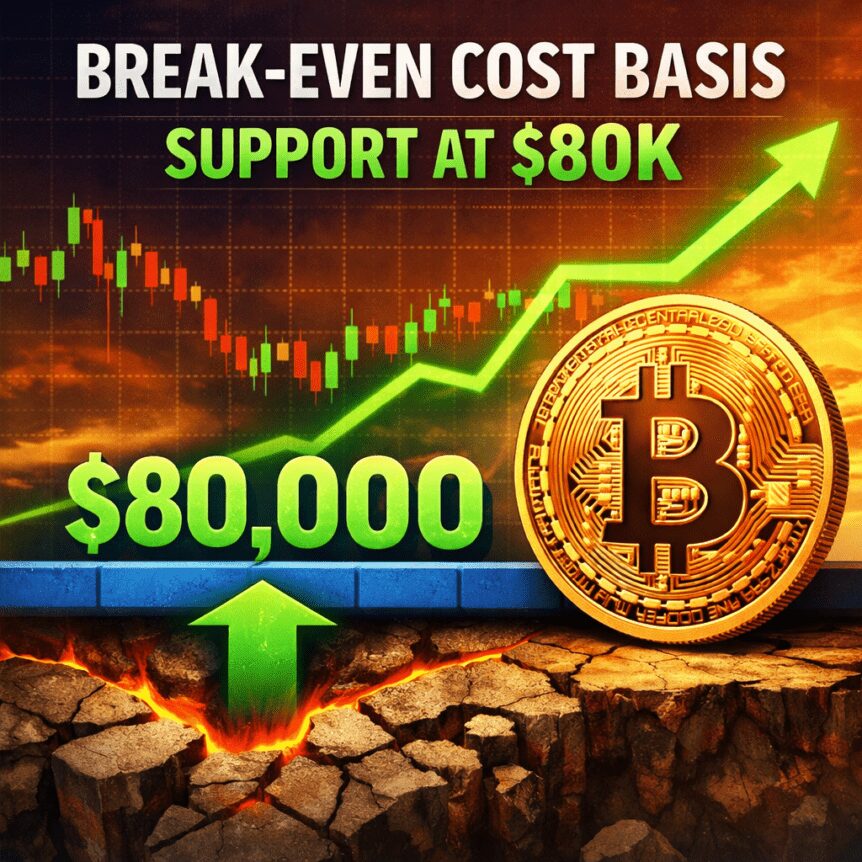
Bitcoin touched a fresh three-month high near $80,500 on Monday, testing a key resistance zone for the first time since late January. The move leaves BTC just below the short-term holder cost basis of about $81,486, a threshold many traders view as a potential accelerator for further gains if price can close above it. A daily close above roughly $81,500 would be seen as a bullish signal, potentially firming up $80,000 as a new base and opening room for the next leg toward the mid-to-upper $80,000s.
Key takeaways
- Bitcoin hits a three-month high around $80,500, with the next critical hurdle near $81,500–$81,486, the short-term holder cost basis.
- The market is showing a shift in on-chain dynamics: short-term holder losses have narrowed, and coins are increasingly moving in profit, while long-term holders remain reluctant to distribute.
- On-chain metrics point to a thinning overhead supply: SOPR has climbed above 1, indicating coins are being moved at a profit, led by long-term holders.
- Exchange flow and reserves reveal mixed pressures: inflows remain concentrated among smaller wallets, while exchange reserves rose to about 2.685 million BTC, suggesting potential supply risk if demand cools.
- Near-term trader views emphasize liquidity nearby the breakout zone, with key levels cited around $79,600 to $84,000 as the next target bands depending on price action and momentum.
On-chain signals paint a nuanced breakout picture
Bitcoin’s move toward $80k has brought the price into a zone where on-chain metrics converge around a potential shift in supply pressure. The short-term holder cost basis sits at about $81,486, a level that reflects the average cost of the most recently moved coins over roughly the last five months. In this context, a daily close above $81,500 would flip these holders back into profit, reducing immediate sell-side pressure and potentially enabling a steadier climb. CryptoQuant data, as analyzed by market observers, indicate the overhead supply is thinning as these holders remain less inclined to cash out at current levels.
The market also shows a move back into profit for long-term holders. The long-term holder (LTH) realized profit remains positive but not aggressively expanding, with LTH profits near +27% on average. In tandem, the spent-output profit ratio (SOPR) has climbed to about 1.097 from 0.99, signaling that coins are being spent in profit again, a development commonly associated with a shift from distribution to accumulation among patient holders.
These on-chain signals align with a narrowing of profit pressure on shorter timeframes. Analysts have noted a drift toward profit-taking normalization, which could support a more sustainable upside path if price can sustain above the critical cost basis and avoid renewed selling pressure.
Supply dynamics and exchange behavior remain a focal point
Looking at exchange flows, inflows in recent days show a concentration of activity among smaller holders. Approximately 97.2% of the latest deposits came from short-term holders, with wallets holding roughly 1 to 1,000 BTC contributing around 58% of that inflow. The intensity of selling pressure has cooled since late April, when net inflows spiked; peak inflows reached about 35,649 BTC on April 24, before tumbling to roughly 3,895 BTC by May 3. The compression in inflows helps limit immediate downside risk and supports a case for price consolidation near the current range, especially if the cost basis flips to profitability for a larger cohort of holders.
On the reserve side, holdings on exchanges outpaced normal turnover, with BTC reserves increasing by about 5,773 BTC week over week to 2,685,541 BTC by late April, before easing slightly after April 30. The picture is mixed: while there is no dramatic surge in selling, the presence of more coins on exchanges creates a potential supply overhang should demand weaken. Analyst commentary suggests that this dynamic could keep price action tethered to near-term liquidity at key levels, rather than spiking uncontrollably higher in the absence of fresh demand catalysts.
Independent data tracking also highlighted notable exchange net flows in late April, with spikes around April 27 and April 30 before returning toward neutral. The pattern implies that while there was some opportunistic accumulation or repositioning, the market did not experience a wholesale exodus of supply, which would have pressured prices lower. As a result, the scene remains carefully balanced around the $80,000 region, with traders watching how reserve levels and investor behavior evolve in the weeks ahead.
For traders seeking a more granular read, some commentary points to key liquidity near breakout zones. One analyst noted that BTC is retesting breakout liquidity near $79,600, and that holding above this level preserves the trajectory toward the next supply zone around $84,000. A break below $80,000, however, would shift attention to the new-money cost basis near $76,500 and could raise the odds of a failed breakout if demand does not reaccelerate.
CryptoQuant data and analysis underpin these observations, and traders continue to parse the signals for clues about whether the current move will sustain or fade into range-bound trading ahead of the next macro catalyst.
What to watch next for BTC
The immediate watchpoints remain clear. A decisive daily close above $81,500 would validate the notion that the short-term holders have flipped back into profitability and could lay the groundwork for a sustained breakout. Conversely, a failure to hold near or above $80,000—especially if selling pressure resumes as exchange inflows pick up again or reserves trigger new supply dynamics—could see BTC revisit lower bands in the mid-$70,000s to low-$80,000s range.
In the near term, traders will be watching on-chain metrics for signs of renewed selling pressure or renewed accumulation among long-term holders, as well as any shifts in exchange reserves that might indicate a change in supply dynamics. The interplay between price, SOPR, and the cost basis will likely be the most telling combination to gauge whether the breakout has staying power or remains a test of resistance with a potential pullback.
As always, investors should balance on-chain signals with macro risks and market sentiment, recognizing that even a well-supported breakout can be interrupted by broader market shifts or unforeseen catalysts. The coming days will reveal whether Bitcoin can cement above the near-term hurdle and extend its trajectory toward higher targets, or whether the balance tips back toward a consolidation phase as supply and demand dynamics adjust.
Crypto World
Bitcoin Latest News Today: Senator Lummis Promises Clarity Act in May and Pepeto Is Your Path to a Million This Year

The bitcoin latest news today has Senator Cynthia Lummis telling the Bitcoin 2026 Conference in Las Vegas that the Senate will markup the Clarity Act in May and that the bill is “99% sorted out” according to Bitcoin Magazine.
When the most vocal crypto senator in Washington sets a deadline on live television while $630 million flows into Bitcoin ETFs in a single session, the message is clear. Presale entries at ground-floor pricing are the fastest way to capture the next move before everything reprices.
Bitcoin Latest News Today: Clarity Act Targets May as ETF Inflows Hit $630M
Farside Investors confirmed BlackRock’s IBIT led with $284 million and Fidelity added $213 million on May 1 alone. April brought $1.97 billion total according to Blockonomi, the best month of 2026.
The bitcoin latest news today points to a buying phase, and from here the rotation carries presale tokens with real utility to multiples no large cap can touch. Pepeto at $9.79M raised with a full exchange is where committed capital flows right now.
Bitcoin Latest News Today and the Best Alternative Opportunities for 2026
Bitcoin Latest News Today Signals Rotation: Pepeto Is the Token to Enter Right Now
Timing decides everything in crypto. The bitcoin latest news today is showing you that the gap between a quiet market and a price expansion is exactly the moment when presale positions produce the largest outcomes.
Most people find out about a winning token after the early window already shut. The cofounder of the Pepe ecosystem, the same person who grew a token to $7 billion, built Pepeto to open that window wider and longer than anything before it.
One platform, one interface, every coin in crypto. The bridge links Ethereum, BNB Chain, and Solana so you move assets across chains for free. Zero-fee trading means your position stays whole on every swap. A risk scoring tool reads contracts and calls out traps before your capital touches them.
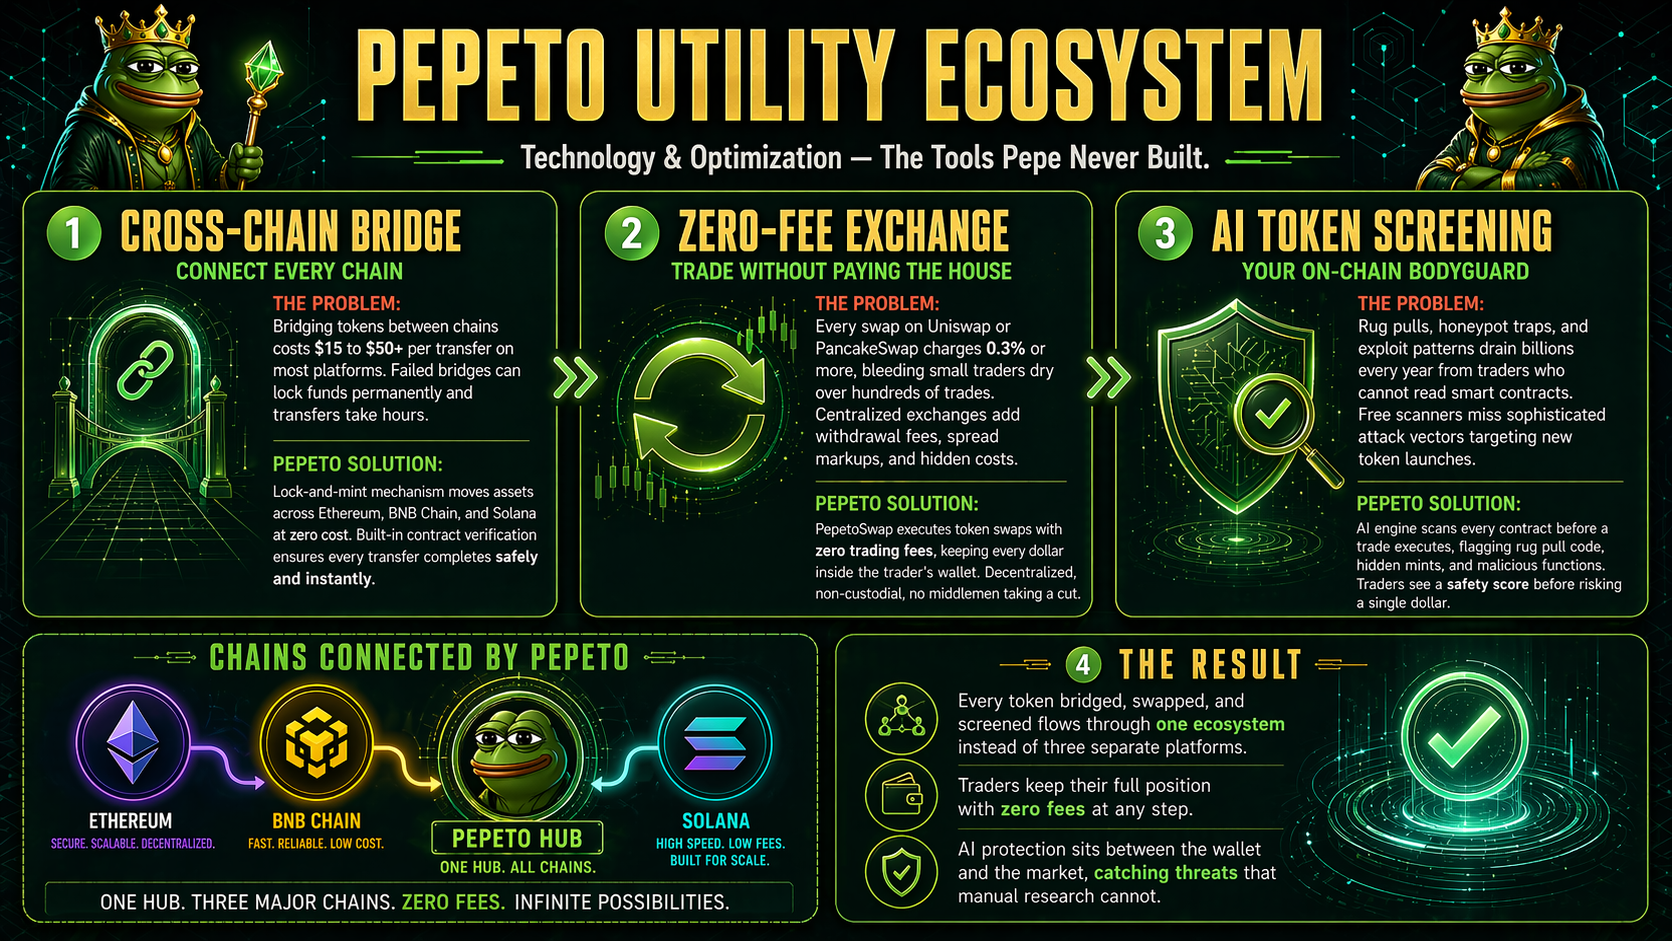
Due to the rapid growth and attention Pepeto has gained, the project’s original domain came under direct attack. The team responded immediately and secured a provisory domain to keep buyer access open. Click to visit Pepeto through the active link.
The presale sits at $9.79M raised, entry at $0.0000001868. Put $10,000 in and staking at 175% APY returns roughly $17,500 a year while the expected listing gets closer. The second trading opens, this presale price is gone and every round that came before it becomes permanent.
SolidProof audited every contract. The bitcoin latest news today confirms this cycle is turning. If one token stands out right now as the clearest path to a million this year, Pepeto is that token.
Bitcoin (BTC) Price at $78,437 as Clarity Act Heads for May Markup
Bitcoin trades at $78,437 according to CoinMarketCap after absorbing $630 million in ETF inflows on May 1. The price consolidates below the $80,000 resistance that has held for two weeks. Senator Lummis confirmed the Clarity Act markup is coming this month.
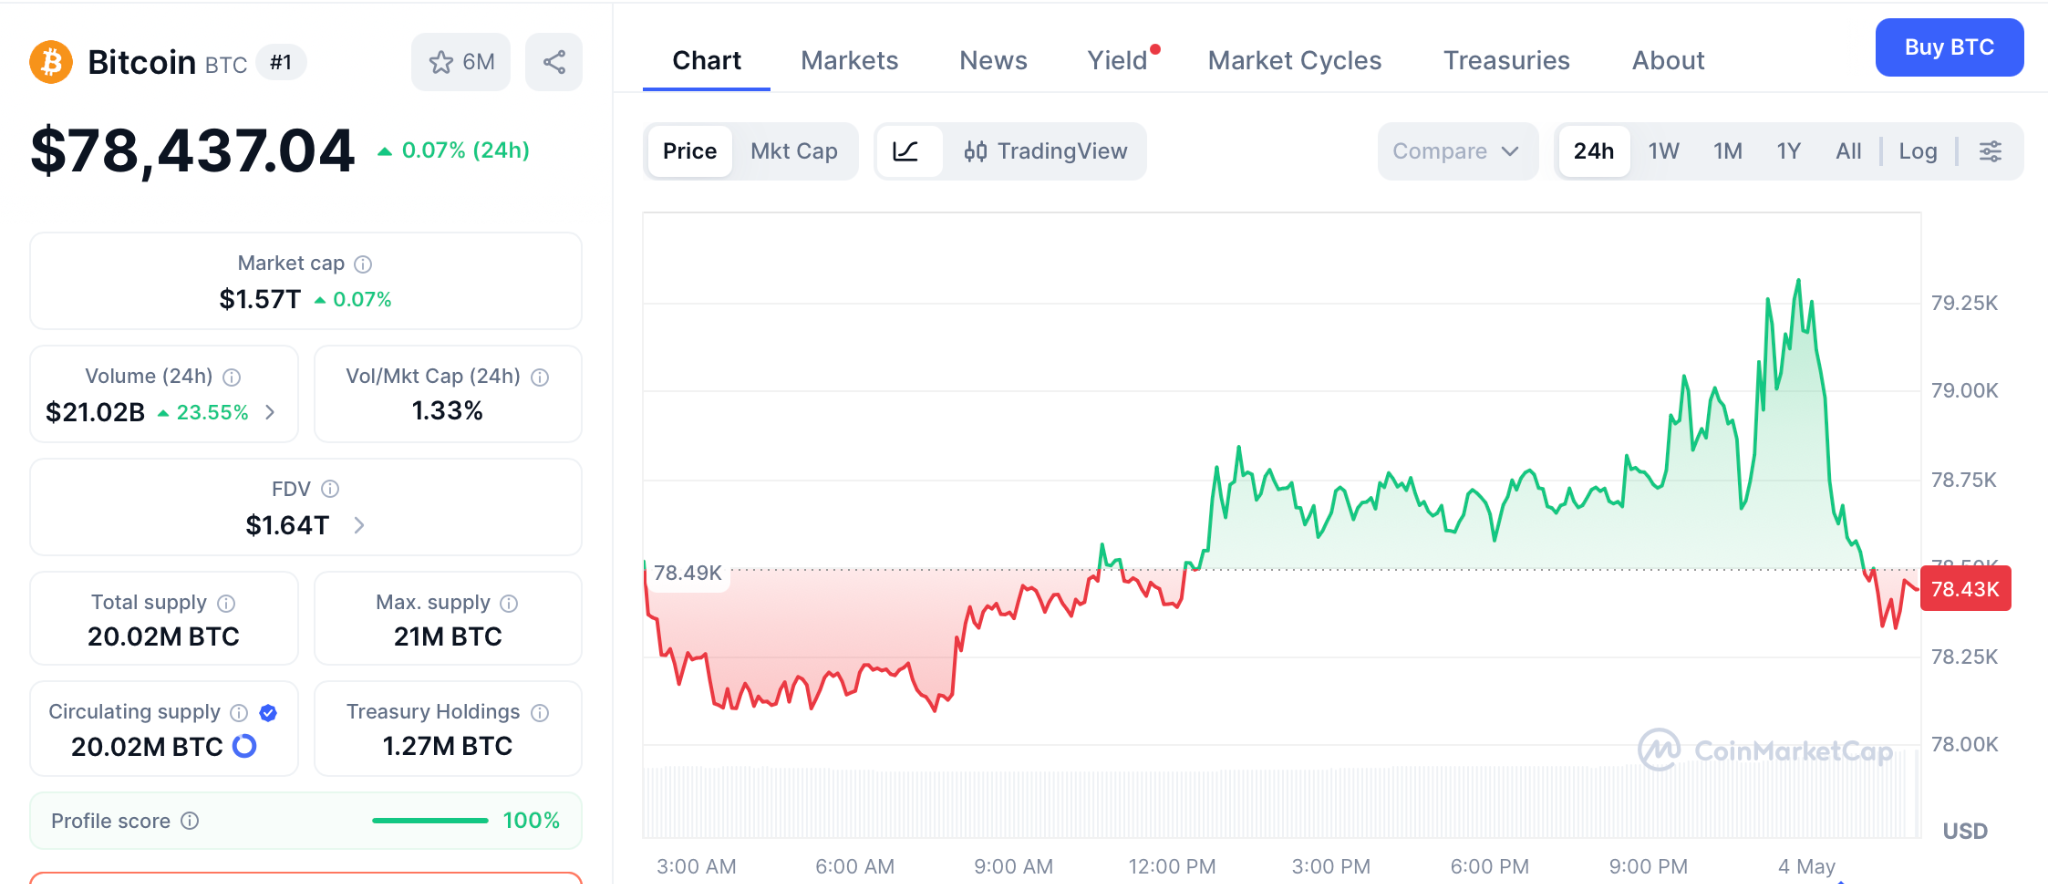
But the bitcoin latest news today confirms this is a $1.55 trillion asset, 38% below its $126,021 all-time high. The consolidation signals a slow grind rather than the sharp move presale entries deliver. Traders chasing the biggest returns this cycle are heading toward earlier positions like Pepeto where one listing event produces what BTC needs quarters to match.
Ethereum (ETH) Price at $2,321 as Market Holds Range
ETH trades at $2,321 according to CoinMarketCap, up 1% in 24 hours but locked in a range since February. Ethereum ETFs attracted over $100 million on May 1 alongside the Bitcoin inflows, and the Ethereum Foundation sold 10,000 ETH to BitMine as part of its treasury plan according to CoinDesk.
Support sits near $2,100 and resistance at $2,427. Ethereum at a $280 billion market cap needs years for the kind of returns Pepeto at presale pricing delivers in months once the expected listing arrives.
Conclusion:
Everything lines up and the signal is impossible to miss. The bitcoin latest news today with a Clarity Act markup set for May, $630 million entering ETFs in a single session, and a full exchange platform that fuses meme culture with working trading tools positioned to capture the entire wave.
This cycle will create millionaires and the only variable left is speed, because half a year from today you are either telling the story of how you reached your first million or carrying the weight of the chance you let pass. Go to Pepeto and choose which outcome is yours.
Click To Visit Pepeto Website To Enter The Presale

FAQs
What does the bitcoin latest news today mean for crypto investors?
The bitcoin latest news today shows Senator Lummis promising a Clarity Act markup in May and $630M in ETF inflows, but Pepeto at $0.0000001868 with a full exchange offers return potential that BTC cannot match. Visit Pepeto.
Is Bitcoin forming a bottom in May 2026?
Bitcoin holds at $78,437 as institutional inflows hit their strongest day of 2026 and the Clarity Act heads for a Senate markup, a combination that has historically come before major altcoin rallies and presale repricing events.
Disclaimer: This is a Press Release provided by a third party who is responsible for the content. Please conduct your own research before taking any action based on the content.


US voters ranked crypto last among election priorities in an April poll of 1,000 registered Americans.
Summary
- Just 1% of registered US voters named crypto their top concern; only 3% called it the single most important 2026 midterm issue.
- Majorities of independents, Democrat-leaning voters, and base Democrats all held unfavorable views of cryptocurrency in the poll.
- Despite low priority rankings, 22% said crypto is an important issue and 40% would vote for a candidate aligned on digital assets.
Public Opinion Strategies conducted the poll in late April on behalf of CoinDesk, surveying 1,000 randomly selected registered US voters with a credibility interval of plus or minus 3.53%.
Respondents were evenly split between Republican and Democratic identifiers at 41% each. As crypto.news reported, TD Cowen had already warned that the 2026 midterm cycle could push the CLARITY Act “off the congressional calendar until 2027,” framing voter indifference as a direct threat to industry legislative goals.
The sentiment numbers were broadly negative outside the GOP base. Independents viewed crypto unfavorably at 48% versus 27% favorably. Democratic-leaning voters were 54% unfavorable to 26% favorable.
Only Republican leaners produced a slight net positive at 41% to 39%. TraderSunion noted that 62% of respondents said they did not trust the Trump administration to oversee the crypto sector.
What the numbers mean for the industry
AI fared better in the same survey, with 46% favorable versus 45% unfavorable, a net positive that crypto has not achieved. Just 27% of respondents said they had ever invested, traded, or used cryptocurrency, while another 27% said they had not but might one day.
Digital Chamber CEO Cody Carbone has said “there are outstanding sticking points, but that shouldn’t slow down the process” on the CLARITY Act. As crypto.news documented, that sentiment sits against a political backdrop where voter indifference to crypto limits the electoral cost of blocking legislation entirely.
As crypto.news tracked, crypto groups spent roughly $120 to $130 million in the 2024 elections, with 2026 spending expected to exceed that. As crypto.news noted, Binance Research found midterm years historically produce average Bitcoin declines of roughly 56%, with a recovery typically following once election results reduce policy uncertainty.

TLDR
- World Liberty filed a defamation lawsuit against Justin Sun in a Florida state court.
- The lawsuit follows Sun’s federal case in California over frozen WLFI tokens.
- World Liberty alleged that Sun engaged in misconduct tied to WLFI token purchases.
- The company claimed Sun launched a short-selling campaign during the token’s public debut.
- The complaint linked $300 million in wallet transfers to Binance to Sun-affiliated entities.
World Liberty filed a defamation lawsuit against Tron founder Justin Sun in Florida on Monday. The company alleges Sun made false statements after it froze his WLFI tokens. The case follows Sun’s own federal lawsuit in California over the same tokens.
World Liberty Alleges Misconduct Over WLFI Token Activity
World Liberty accused Sun and related entities of “gross misconduct” tied to WLFI token purchases. The company claimed Sun used straw buyers to acquire tokens for other investors. It also alleged that Sun may have engaged in short selling during the public launch.
The complaint described “a large, deliberate, short-selling campaign designed to suppress $WLFI’s price.” It linked that campaign to Sun-affiliated wallets that moved $300 million to Binance. World Liberty stated that it froze the tokens under its contractual rights.
The lawsuit said the freeze aimed to “protect” the company and the broader $WLFI community. It argued that Sun knew about the transfer restrictions before the freeze occurred. The filing stated that Sun understood the company’s authority over token transferability.
World Liberty claimed Sun later posted tweets that contained false or defamatory information. The company said Sun knew those statements were untrue because of prior agreements. It alleged that those posts harmed its reputation and business prospects.
The complaint also alleged that Sun hired influencers and used bots to amplify his claims. World Liberty said those actions led to lost business opportunities. Several sections of the filing remain redacted, including details about token purchases.
Justin Sun Challenges Freeze as Legal Battle Escalates
Sun filed his own lawsuit against World Liberty in federal court in California. He alleged that the company unfairly froze his WLFI tokens. His complaint claimed that the freeze restricted his ability to transfer assets.
World Liberty responded in its Florida filing by emphasizing contract terms. The company stated that Sun “knew through his personal experience” about the transfer limits. It argued that Sun’s public statements ignored those agreed terms.
The Florida lawsuit seeks damages, expenses, and a retraction of Sun’s statements. World Liberty requested compensation for reputational harm and related losses. It framed the dispute as a breach of agreement and defamation issue.
The filing repeated that Sun knew about the company’s right to restrict token transfers. It stated that both Sun and the public understood that authority. The court has not yet set a hearing date in the Florida case.
World Liberty filed the complaint in a Florida state court on Monday. Sun’s separate case remains pending in a California federal court. Both cases now proceed in parallel as the dispute over WLFI tokens continues.
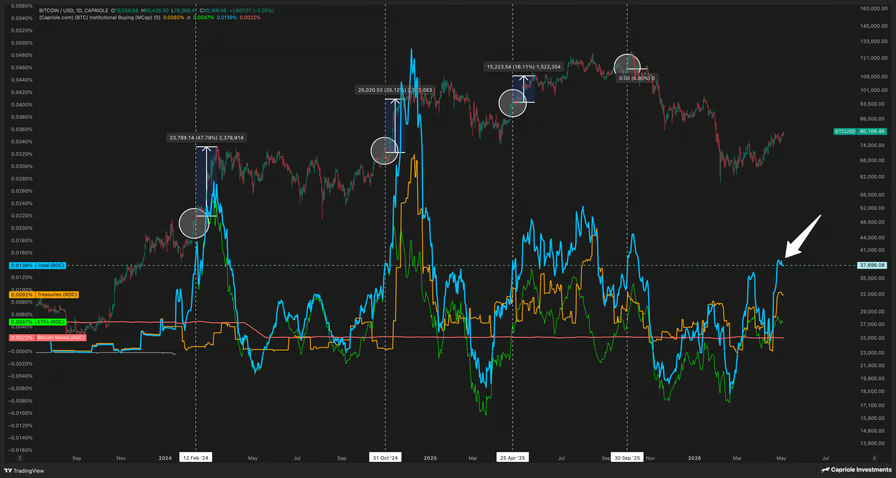
Bitcoin (BTC) may rally toward $96,000 by June as institutions absorb more than five times the daily mined BTC supply, according to Capriole Investments founder Charles Edwards.
BTC price averages 24% gains after institutional supply squeeze
In a Monday post, Edwards said institutions have been “slurping up 500%+ of Bitcoin’s daily mined supply.”

BTC/USD daily chart vs. institutional buying market cap. Source: Capriole Investments
Since the April 2024 halving, Bitcoin miners have produced roughly 450 BTC per day, keeping supply growth relatively stable, with its rate of change (ROC, the red line) hovering near 0.0022% as of Monday.
In contrast, institutional buying’s ROC (blue) stood near 0.0139%, showing demand momentum rising more than five times faster than new supply growth.
Renewed ETF inflows and steady BTC purchases by Michael Saylor’s Strategy have helped drive that demand. They added roughly 70,000 BTC in April, more than approximately 13,500 BTC mined during the same period.

US Spot Bitcoin ETF monthly net flows and Strategy’s BTC holding. Source: Glassnode, BitBo.IO
“Every time it’s been this high before, price has shot up over the next week,” said Edwards, adding:
“The average return in prior cases is +24% over the next 1 month from here, that would take us to around $96K.”
Edwards noted that when institutional absorption exceeds 500% of Bitcoin’s daily mined supply, BTC has historically delivered ~24% average gains over the following month, which would put the price around $96,000 by June.
Similar targets have also been shared by analyst Michaël van de Poppe, who said Bitcoin may “easily” reach $95,000, citing renewed demand for spot BTC ETFs and other technical factors.
Bitcoin sharks accumulate over 61,000 BTC in 30 days
Onchain data shows the supply squeeze extends beyond ETFs and corporate buyers.
Bitcoin “sharks,” entities that hold 100–1,000 BTC, have accumulated over 61,000 BTC in the past 30 days, according to data resource Glassnode.
.png?prefix=media%2Fcontent)
BTC shark net position change vs. price. Source: Glassnode
Smaller cohorts, including “fishes” holding 10–100 BTC and “crabs” holding 1–10 BTC, are also net accumulators during the same period.
.png?prefix=media%2Fcontent)
BTC fish and crab net position change vs. price. Source: Glassnode
The data shows that both mid-sized investors and retail participants are steadily absorbing supply, raising BTC’s odds of hitting $96,000 over the next few weeks if the demand persists.
Related: Strategy takes Bitcoin buying breather ahead of Q1 earnings report
Still, some analysts warrant caution, citing a prevailing bear flag setup.
In a Monday post, trader Bitbull highlighted $60,000–$62,000 as a potential downside target if BTC corrects from the flag’s upper trendline toward the lower trendline.

BTC/USD daily chart. Source: TradingView/BitBull
A breakdown below the lower trendline may send the BTC price under $50,000.

Charlotte Flair claims current WWE rivals have an “extremely bright future”

White House Considers Vetting AI Models Before They Are Released
Everything you need to know about new residents’ parking schemes in Northern Ireland
Manchester United reach agreement with Casemiro over contract clause amid transfer speculation

US brings back mandatory military draft registration

Steven Gerrard disagrees with Gary Neville over ‘shock’ Chelsea and Arsenal claim | Football


-

 Business6 days ago
Most Commercial Energy Audits Miss the Real Losses
-

 Fashion6 days ago
Kylie Jenner’s KHY Enters a New Era with ‘Born in LA’
-

 NewsBeat1 day ago
Channel 5 – All Creatures Great and Small series 7 new post
-
 Tech3 days ago
Trump’s 25% EU auto tariff breaches Turnberry Agreement that also covers semiconductors and digital trade
-

 Crypto World6 days ago
CFTC’s AI will review U.S. crypto registration applications, chairman tells CoinDesk
-
 Sports3 days ago
Paul Scholes issues Marcus Rashford reality check as agreement emerges over Man United star
-

 Business6 days ago
Barclay Brothers Avoid Bankruptcy: HSBC Drops High Court Petitions After IVA Deal
-
 Business5 days ago
Tesla Officially Registers Elon Musk’s Stock: What Investors Need to Know
-
Crypto World7 days ago
Robinhood Phishing Scam Exploits Gmail Dot Feature to Bypass Security
-

 Tech6 days ago
Get Ready for More Brain-Scanning Consumer Gadgets
-

 Crypto World7 days ago
Gmail Dot Trick Underpins Robinhood Phishing, Sending Real-Looking Emails
-

 Business4 days ago
Two Powerball Tickets Split $143 Million Jackpot in Indiana and Kansas
-

 Tech5 days ago
Texas Instruments made a new flagship graphing calculator: the TI-84 Evo
-
 Crypto World4 days ago
CoreWeave (CRWV) Stock Climbs 8% Despite $45M Insider Share Dump
-

 Crypto World7 days ago
Will Ethereum hold $2,300 or slip lower from here?
-

 Business7 days ago
Outsourced IT Support vs Internal Teams: A Complete Guide
-

 Entertainment7 days ago
How A Fantasy Flop Finally Found Success On HBO Max
-
 Business7 days ago
Global Market Today: Asian shares hold near eight-week high
-
Business1 day ago
Winning Numbers Drawn as Jackpot Resets to $20 Million
-

 Crypto World7 days ago
Saba Capital tender offers for shares are below initial expectations
You must be logged in to post a comment Login