

Crypto World
Hyperliquid (HYPE) Flashes 3 Bullish Signals as Price Hits 4-Month High
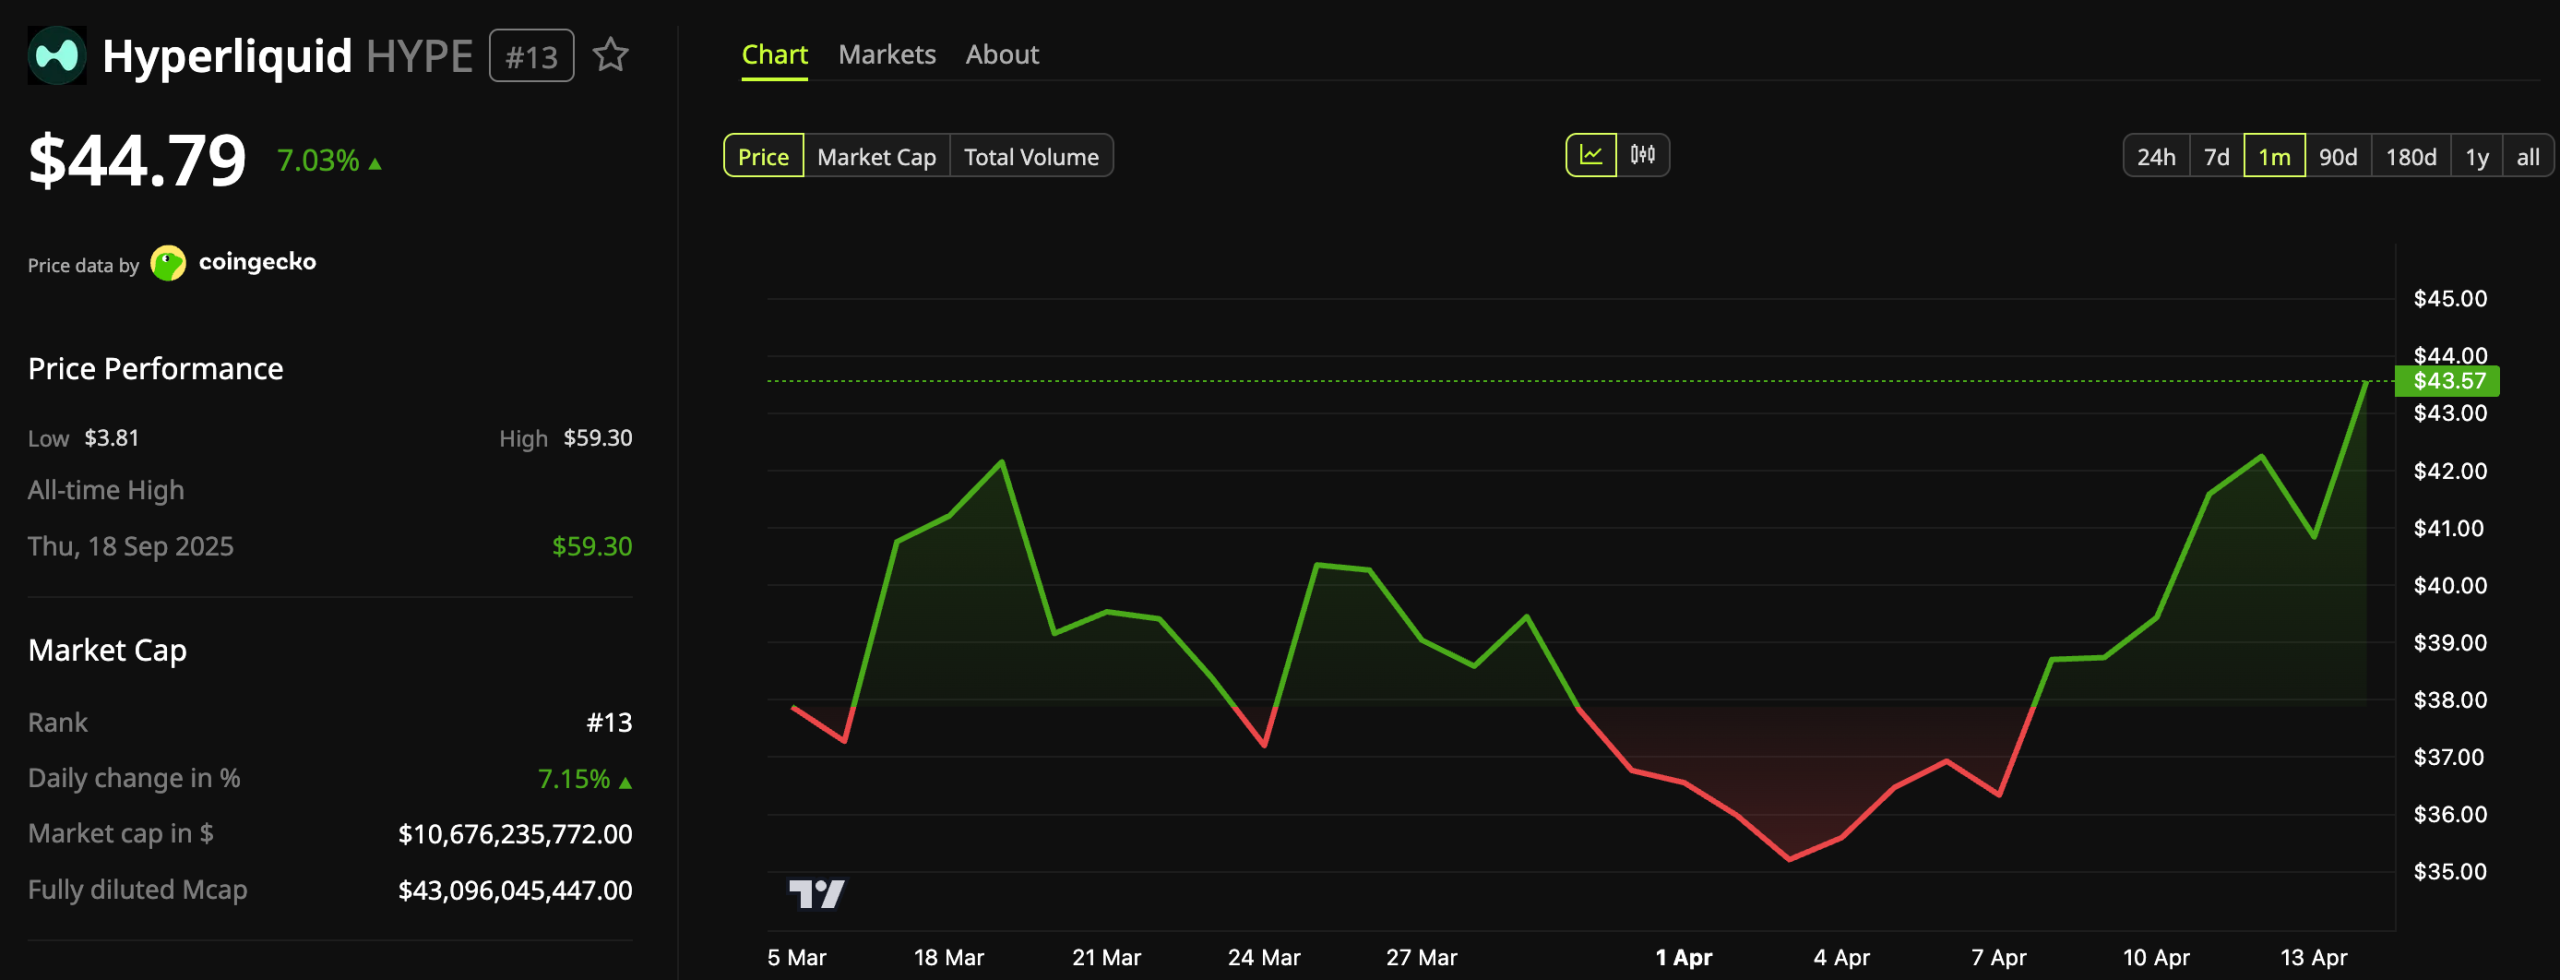
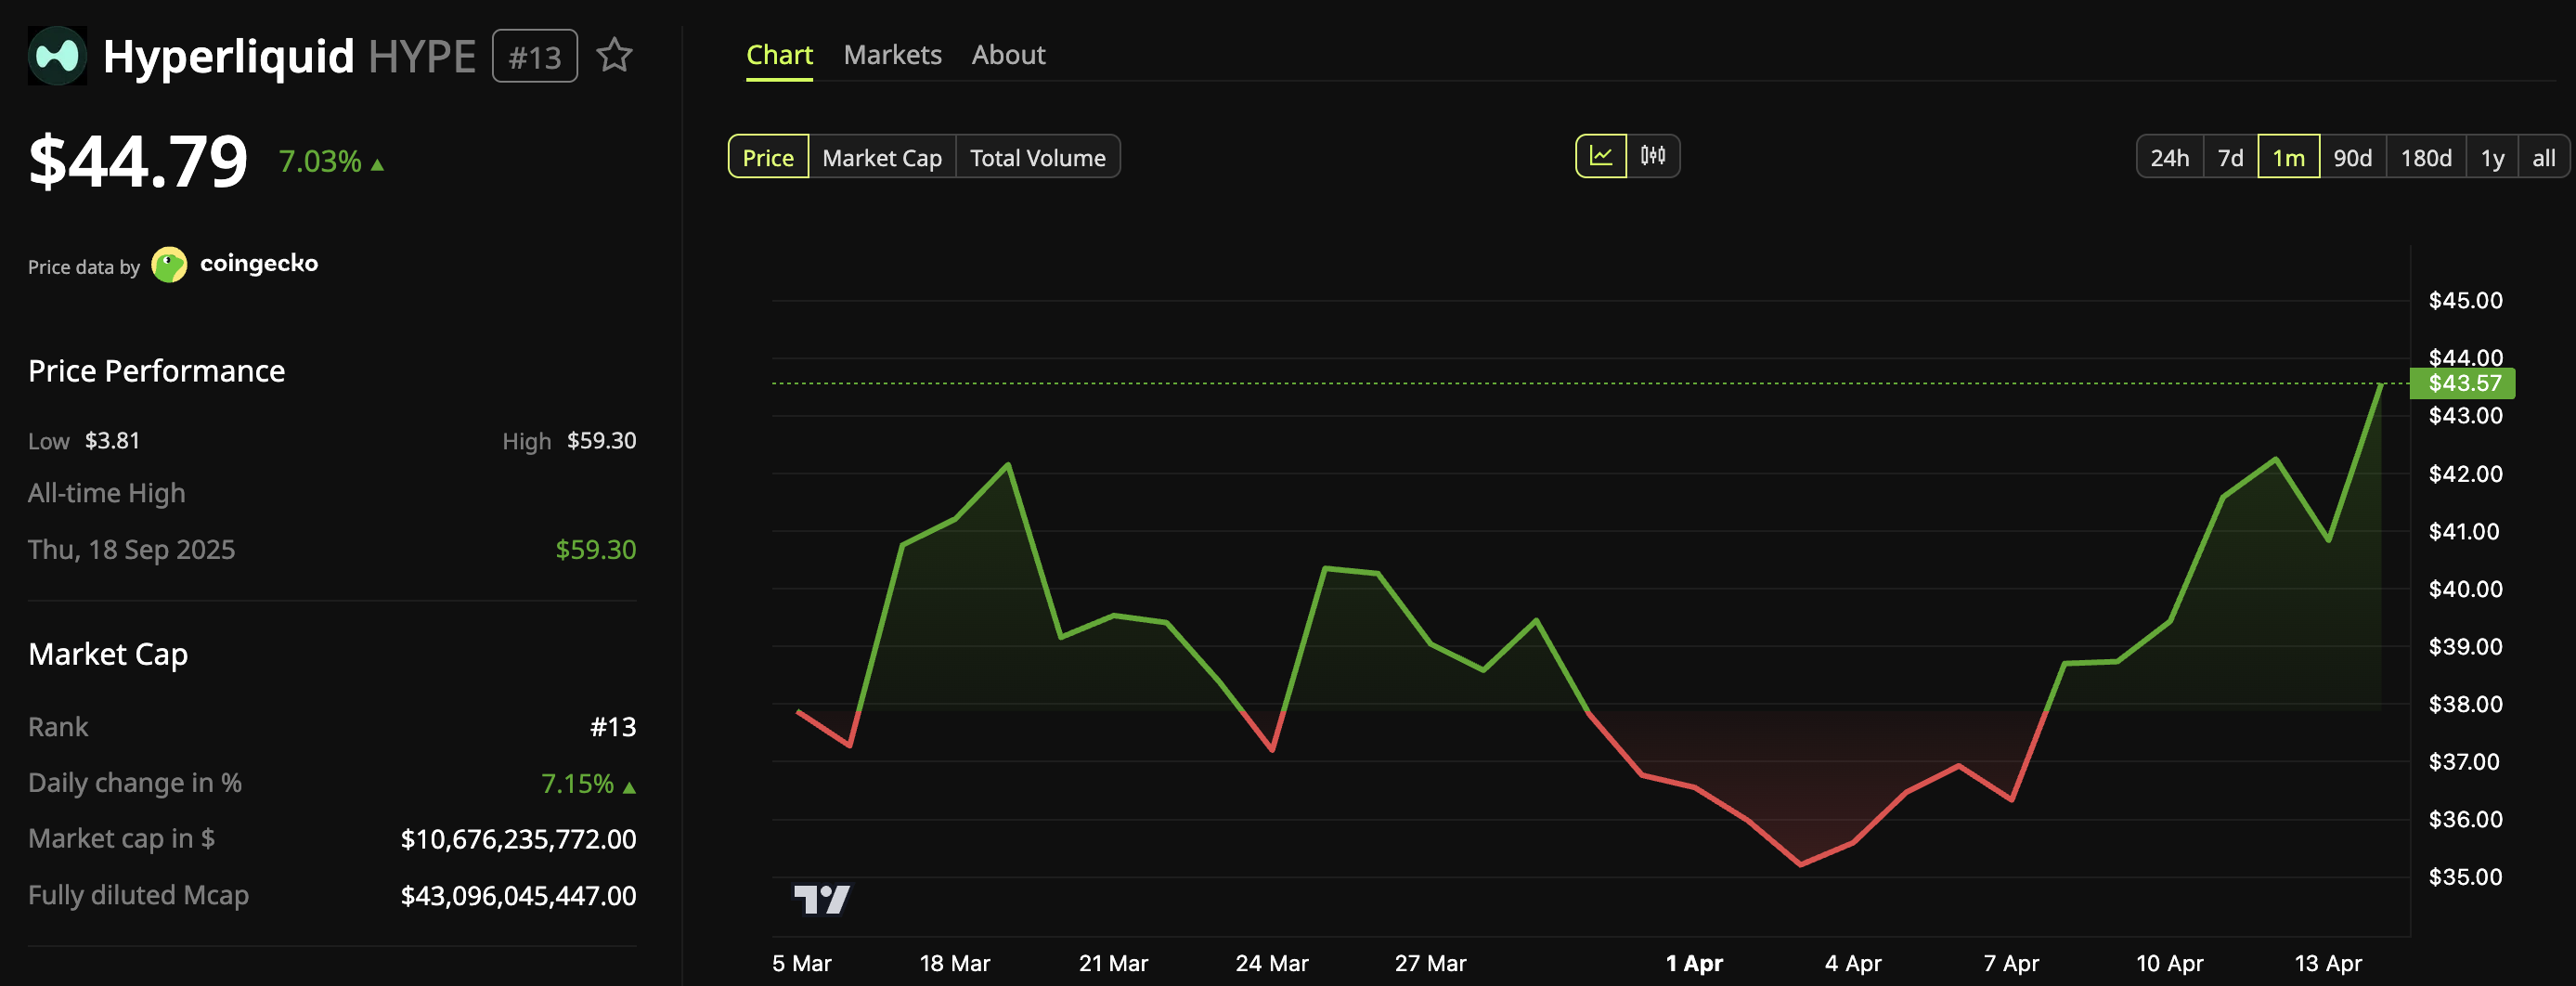
Hyperliquid (HYPE) extended its price rally to a four-month high. The altcoin climbed to $44.99 in early Asian trading, its strongest level since November 7, 2025.
At press time, HYPE was trading at $44.79, up over 7% in the past 24 hours.
The move came amid a broader market rally, with total market capitalization jumping more than 4% over the past 24 hours. Alongside improving sentiment, a range of underlying factors is further supporting the altcoin’s bullish outlook.
3 Signals Support a Positive Outlook for HYPE After Multi-Month High
First, Hyperliquid founder Jeff Yan announced that priority fees are now live on mainnet in alpha mode. The system includes Gossip (read) priority and Order (write) priority.
Follow us on X to get the latest news as it happens
Analysts are increasingly pointing to Hyperliquid’s priority fee mechanism as a potentially bullish catalyst for its native token, HYPE.
Traders pay in HYPE to gain priority, and fees for Gossip and Order priority are permanently burned. Hyperliquid Daily explained that this creates consistent demand for the token.
“The more volume and chaos on Hyperliquid (which is already massive), the more HYPE gets used and burned. Even in quiet times, those 5 gossip slots keep creating baseline demand. It’s not just ‘governance’ anymore. HYPE is becoming the fuel for speed and priority on the most sophisticated trading chain in crypto,” the post added.
Another analyst highlighted that beyond token economics, the priority fee model may also improve overall market efficiency.
“It also makes markets fairer/faster for everyone, and funnels value straight back to the token ultimately this will result in better fills for all traders as well,” analyst kook wrote.
Second, HYPE’s strength extends beyond its dollar-denominated performance, as the token recently reached all-time highs against major pairs, including Bitcoin (BTC), Solana (SOL), and BNB (BNB).
Such moves point to notable relative strength, indicating that HYPE is outperforming several large-cap assets on a pair-by-pair basis.
Sustained gains across multiple major trading pairs are often interpreted as a sign of capital rotation into a specific asset, rather than a reflection of broader market momentum alone.
Lastly, institutional momentum is building in parallel. Bitwise filed an amended registration with the SEC, adding the ticker BHYP and a 0.67% management fee. Such additions typically signal that the fund may launch soon.
An approved spot ETF could open the door for institutional capital to flow directly into HYPE, potentially amplifying demand beyond the existing retail and DeFi user base.
The convergence of a fee burn mechanism, relative strength across major trading pairs, and an advancing ETF filing creates a multi-layered bullish setup for HYPE. Whether the token can sustain momentum will likely depend on broader market conditions and any further progress on the network and regulatory fronts.
The post Hyperliquid (HYPE) Flashes 3 Bullish Signals as Price Hits 4-Month High appeared first on BeInCrypto.

Credit spreads are among the most popular strategies for generating consistent income with defined risk. The challenge is rarely understanding how they work. It is finding good candidates in a market with thousands of tickers and constantly shifting volatility. An option scanner built for multi-leg strategies changes this process entirely, replacing hours of manual searching with structured, repeatable workflows.
This guide explains how traders can use an options screener to identify credit spread opportunities that align with their outlook, risk tolerance, and income goals.
Why Credit Spreads Deserve a Screening Workflow
A credit spread involves selling one option and buying another at a different strike price, both on the same underlying and with the same expiration. The seller collects a net premium upfront and profits when the underlying stays within a defined range. The two most common types are the bull put spread, used when the outlook is neutral to bullish, and the bear call spread, used when the outlook is neutral to bearish.
The concept is straightforward, but execution depends heavily on the quality of the underlying stock, the pricing of the options, and how volatility is behaving at the time. A good-looking spread on a weak company or during a period of compressed volatility can quickly become a losing trade, even if the direction is right.
This is where using an easy to use options scanner adds value. Rather than browsing individual tickers and checking each one manually, an options screener filters the entire market based on the conditions that matter most for credit spread success: probability of profit, annualized return, spread width, volatility levels, and company quality.
What to Look for When Screening Credit Spreads
Probability of profit is often the first filter traders apply. A high probability of profit means the short strike is positioned far enough from the current price to give the trade room to work. Most options screeners allow filtering by delta or probability, letting traders set a minimum threshold before any results appear.
Annualized return matters because it normalizes the income across different expirations. A spread that returns 2% in 10 days looks different from one that returns 3% in 45 days when both are annualized. Filtering by annualized return helps compare setups on a level playing field.
Implied volatility context is equally important. Credit spreads are premium-selling strategies, and selling premium works best when implied volatility is elevated relative to its own history. Using IV Rank or IV Percentile as a filter ensures the premiums being collected are above average, not near the bottom of their range.
Liquidity and spread width round out the picture. Tight bid-ask spreads reduce slippage, and wider strike distances increase the credit received but also raise the maximum loss. An option scanner that includes these filters gives traders the ability to balance income against risk before placing any trade.
How Option Samurai Screens for Credit Spreads
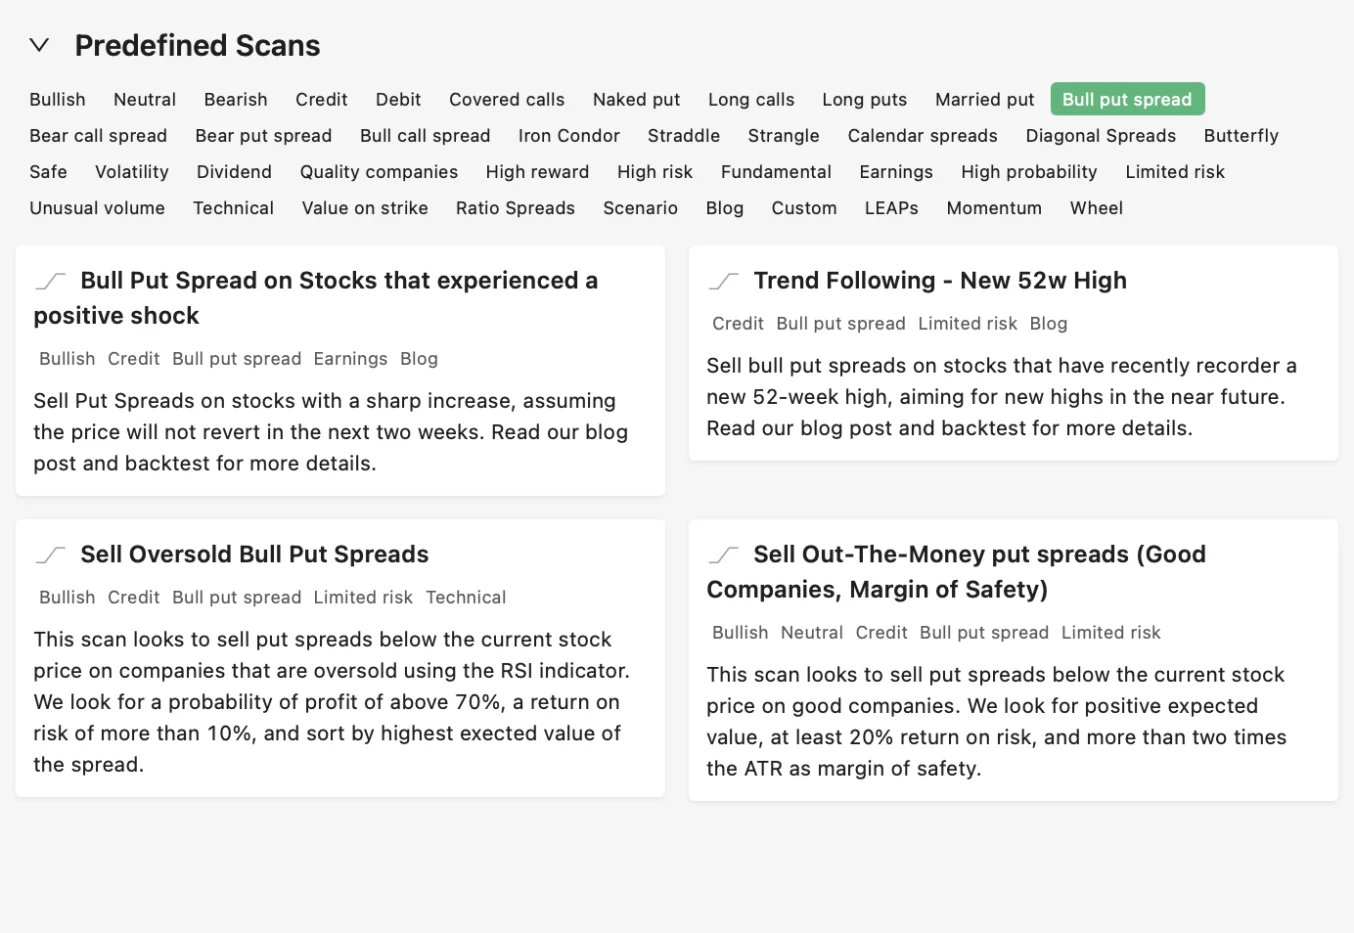
Option Samurai includes predefined scans specifically designed for credit spread strategies. These scans are pre-built with filters that target high-probability setups on quality companies, making it easy to get started without configuring dozens of parameters manually.
The Bull Put Spread scans focus on neutral to bullish setups. They filter for companies with stable fundamentals, elevated implied volatility, and puts that offer attractive premiums relative to the risk. Results are sorted by probability of profit and annualized return, giving traders a clear view of the best available opportunities.
Here are some of the available bull put spread scans on Option Samurai:
The Bear Call Spread scans apply the same logic in reverse, targeting stocks where the outlook is neutral to bearish and call premiums are rich enough to justify the trade. These scans are useful during periods of market strength when certain sectors or names appear overextended.
Again, this is a quick view of the scans users will find in Option Samurai:
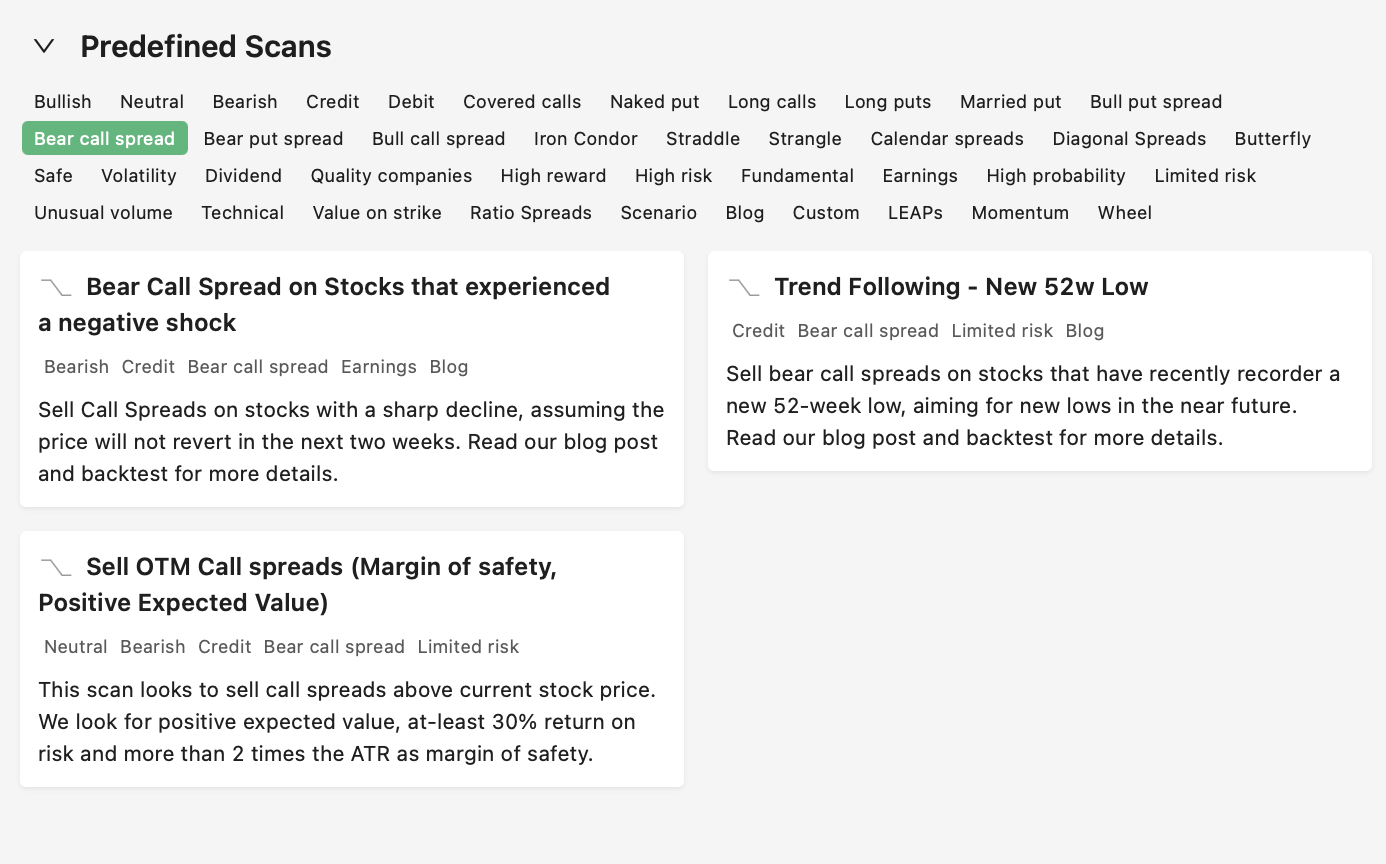
Both scan types benefit from the underlying quality filters built into Samurai’s options screener. Rather than surfacing credit spreads on low-quality or thinly traded stocks, the results are limited to names with sufficient liquidity, reasonable fundamentals, and option chains that support clean execution.
Refining Results with Volatility and Fundamentals
Once a set of credit spread candidates appears, traders can refine further by layering on volatility and fundamental filters. IV Rank is particularly useful here. A credit spread on a stock with an IV Rank above 50 means the options are priced above their median level for the past year, which generally favors premium sellers.
Comparing implied volatility to realized volatility adds another layer of insight. When IV is significantly higher than what the stock has actually been delivering in terms of movement, the market may be overpricing the risk. This creates a natural edge for credit spread sellers who are collecting premiums inflated by fear rather than by actual volatility.
Fundamental filters help avoid names that might look attractive on a volatility basis but carry hidden risks. A stock with elevated IV because of deteriorating earnings or a looming debt issue is not the same as a strong company experiencing a temporary spike in uncertainty. Filtering for quality, whether through predefined tags or custom criteria, keeps the focus on setups where assignment or adverse moves are manageable.
Managing Credit Spreads After Entry
Screening is only the first step. Once a credit spread is placed, ongoing monitoring determines whether the trade reaches its full potential or needs adjustment. The options screener can help here as well, since the same volatility and probability data used to find the trade can be used to evaluate whether conditions have changed.
If implied volatility drops after entry, the spread may reach its profit target faster than expected. If the underlying moves toward the short strike, the probability of profit decreases and a decision about rolling or closing becomes necessary. Tracking these metrics inside a structured platform avoids the common trap of holding spreads too long or exiting too early based on emotion rather than data.
Final Thoughts
Credit spreads are a core income strategy, but their effectiveness depends on finding the right setups at the right time. Screening the entire options market with structured filters removes the guesswork and ensures that each trade is backed by favorable probabilities, appropriate volatility conditions, and quality underlying companies.
An option scanner built for multi-leg strategies brings this process together in a single workflow, making it easier to identify, compare, and execute credit spreads with consistency and discipline.
Start your free trial today (no credit card required) and see how Option Samurai helps traders screen for credit spreads with greater clarity, structure, and confidence.


Key Highlights
- Susquehanna’s Mehdi Hosseini increased SNDK’s price target to $2,000 from $1,000, suggesting approximately 30% upside potential
- The stock has surged 3,685% in the past year and 554% in 2024 alone
- Multiple Wall Street firms issued upgrades following impressive Q3 results, with price targets between $1,000 and $1,800
- The company’s commitment to allocate 50% of free cash flow to stock repurchases may boost earnings by approximately 10%
- An insider transaction saw a director offload $870,300 in shares on May 8, close to the $1,600 peak
SanDisk (SNDK) shares experienced a modest decline on Monday, yet the stock continues to rank among the market’s top performers, having climbed 3,685% over a 12-month period and 554% since the start of the year.
Trading around $1,543, the stock sits just beneath its 52-week peak of $1,600.
Mehdi Hosseini from Susquehanna doubled his price objective for SNDK to $2,000 — up from his prior $1,000 forecast — while maintaining a Buy recommendation. This updated target represents approximately 29.62% potential appreciation from present price levels.
Hosseini’s adjustment followed SanDisk’s impressive fiscal third-quarter financial results, which led Susquehanna to revise its projections higher “across the board.”
Wall Street Piles On Bullish Calls
Susquehanna isn’t alone in its optimistic stance. Multiple prominent investment banks issued their own positive revisions following the earnings announcement.
BofA Securities increased its price objective to $1,550 from $1,080 with a Buy rating, noting that SanDisk exceeded both top-line and bottom-line forecasts. Cantor Fitzgerald pushed even higher to $1,800, pointing to a revised business model structure encompassing five clients that account for more than 33% of SanDisk’s projected NAND bits in 2027.
Bernstein SocGen Group established a $1,700 target, emphasizing robust earnings, forward guidance, and an advantageous pricing landscape. Jefferies adjusted its target to $1,400, emphasizing long-term customer contracts stretching past 2030. RBC Capital increased its forecast to $1,000, highlighting exceptional NAND results and gross margins nearing 80%.
Across 13 analysts surveyed, the consensus Wall Street recommendation stands at Strong Buy, with three Hold ratings. The mean price target registers at $1,409.06.
Analysts have taken particular notice of SanDisk’s strategy to allocate 50% of free cash flow toward share repurchases over the coming two years. Hosseini projects this initiative alone could generate approximately 10% earnings enhancement.
Hosseini further observed that roughly one-third of SanDisk’s fiscal 2027 revenue stream is already secured through contracts, with comparable revenue visibility anticipated for fiscal 2028.
Insider Transaction at Peak Levels
Not all stakeholders are maintaining full positions. Director Necip Sayiner disposed of 579 SNDK stock on May 8 at $1,503.11 per share, generating $870,300 in proceeds. Following this sale, he retains direct ownership of 2,900 shares, according to a Form 4 filing submitted to the SEC on May 11.
InvestingPro characterizes the stock as overvalued at present prices, noting a P/E ratio of 52.88.
Monday’s trading volume reached 7.31 million shares, falling short of the three-month daily average of 17.78 million.
The third-quarter earnings release that ignited the series of analyst upgrades demonstrated SanDisk surpassing both revenue and earnings per share projections, while its fourth-quarter outlook also exceeded Wall Street consensus — despite a sequential decline in bit shipments.
Cantor Fitzgerald drew attention to $42 billion in NAND bit commitments and $11 billion in financial assurances connected to the revised customer arrangements as additional confirmation of sustained long-term revenue streams.


Bridgewater Associates founder Ray Dalio said Bitcoin has not acted as the safe-haven asset many investors expected.
Summary
- Ray Dalio said Bitcoin lacks privacy because transactions can be monitored and possibly controlled.
- Dalio argued investors often sell Bitcoin during market stress to raise liquidity elsewhere.
- Michael Saylor pushed back, calling gold analog capital and Bitcoin digital capital for collateral.
In a May 11 post, he said Bitcoin gets heavy attention but has fallen short when compared with gold during market stress.
Dalio pointed to three issues. He said Bitcoin lacks privacy, trades with a strong link to tech stocks, and remains small compared with gold. He also said gold has a deeper role in the global financial system.
Privacy remains a key concern
Dalio wrote, “First, Bitcoin lacks privacy.” He added that transactions can be monitored and potentially controlled. In his view, that makes Bitcoin less attractive to central banks as a reserve asset.
Bitcoin’s public ledger is part of its design. All confirmed transactions are recorded on a shared blockchain, allowing the network to verify ownership and spending without a central authority. That structure supports transparency, but it also creates the privacy concern Dalio raised.
Moreover, Dalio also said Bitcoin has not behaved like gold during stress periods. He said investors often sell Bitcoin when they need cash to cover pressure elsewhere in their portfolios. He added that Bitcoin’s link to tech stocks weakens its safe-haven case.
He contrasted that with gold, which he said remains widely held and deeply established. Earlier related coverage on crypto.news noted that Bitwise analysis found gold offered stronger downside protection during market drawdowns, while Bitcoin delivered stronger gains during recovery periods.
Saylor defends Bitcoin
Strategy executive chairman Michael Saylor pushed back against Dalio’s view. He said gold is “analog capital” while Bitcoin is “digital capital.” He also said Bitcoin’s transparency is a feature, not a flaw, because it supports its use as global collateral.
Saylor added that Bitcoin has outperformed gold since Strategy adopted its Bitcoin standard in August 2020. His response showed the split between investors who see Bitcoin as a risk asset and those who view it as a long-term monetary asset.
Dalio has not fully rejected crypto. Earlier crypto.news coverage noted that he has held some cryptocurrency, but prefers gold because of Bitcoin’s volatility, traceability, and uncertain reserve role.
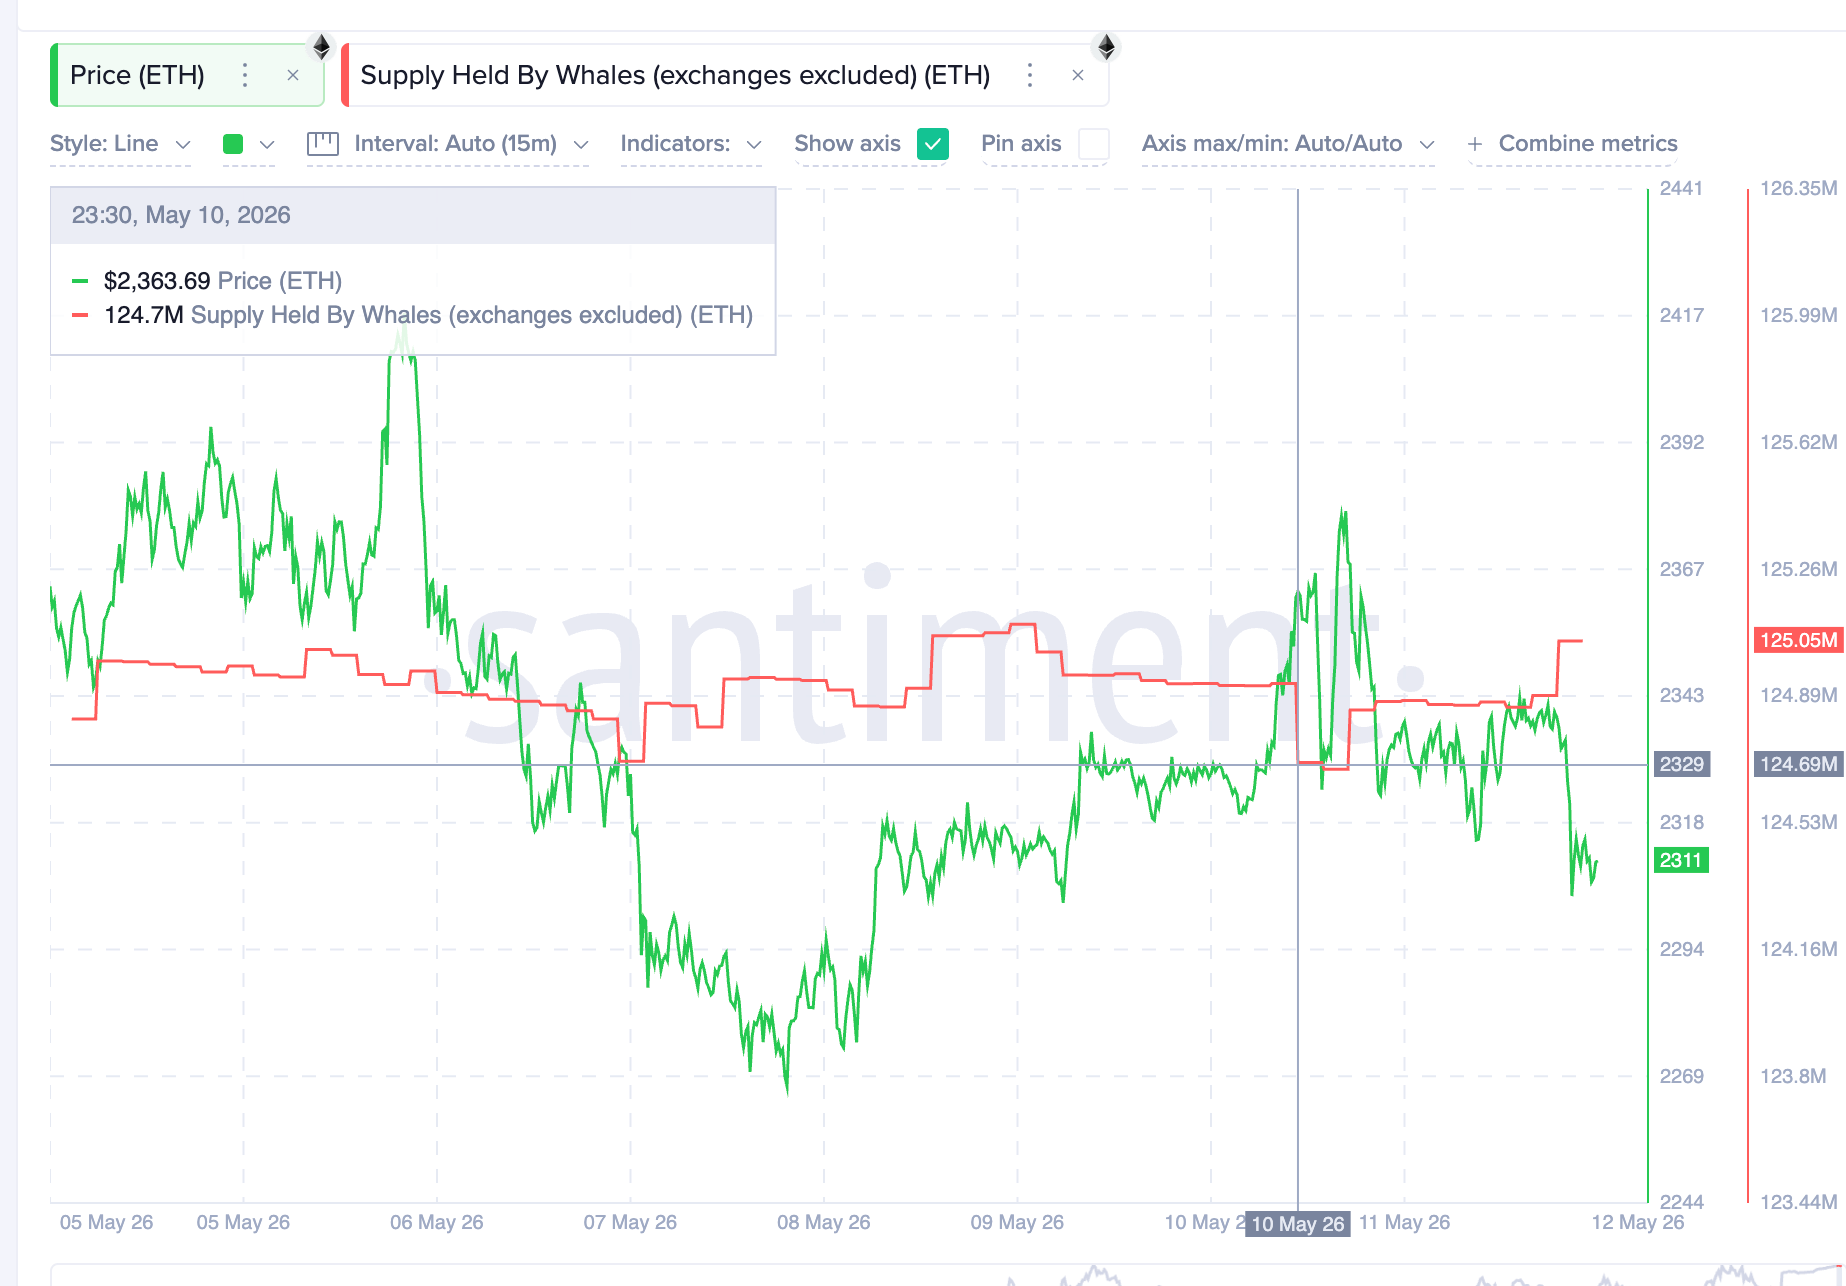
Ethereum (ETH) price has lost 3.6% since May 10, dipping significantly inside a falling channel that has held since April 17. Whales used the dip to load up on $832 million in ETH.
Derivatives positioning shows the rally that preceded the breakdown was short-covering, not new longs piling in. That hands whales a low-leverage entry. The catch sits with long-term hodlers, who have cut accumulation by nearly 80% since late April.
Whales Bought $832 Million as the Price Slid
The Ethereum whale supply, excluding exchanges, tells a story the price chart misses. Whale wallets have steadily added ETH through the recent breakdown. The metric climbed from 124.69 million ETH to roughly 125.05 million across the period, an increase of 360,000 ETH.
Want more token insights like this? Sign up for Editor Harsh Notariya’s Daily Crypto Newsletter here.
At an current ETH price, those 360,000 tokens carry a market value of about $832 million.

The timing matters. The breakdown that started May 10 took ETH down 3.6% in two days. Whales added to their positions through that dip rather than reducing exposure. This kind of behavior usually signals confidence that the chart’s bearish pattern will not resolve to the downside. Whales rarely accumulate into a setup they expect to break lower.

The bigger question is why they are so confident. The answer sits in the derivatives data.
Ethereum Derivatives Confirm the Optimism Is Not Over-Leveraged
The derivatives side explains why whales are willing to accumulate into the breakdown. Ethereum open interest in perpetual futures dropped from $12.46 billion on May 7 to $11.98 billion on May 12. That is a decline of roughly $480 million.
Ethereum funding rate, the periodic payment between perpetual swap longs and shorts, has stayed elevated at around 0.012%. The rate was 0.010% on May 7.

The combination is telling. Falling open interest with elevated funding suggests shorts closed positions, not new longs adding leverage.
In other words, the optimism is real but conservative. There is no large stack of fresh long bets sitting on top of the market, waiting to be liquidated.
That is exactly the kind of backdrop whales prefer. The leverage stack is thin enough that an external shock will not trigger a cascading flush. But not every on-chain group agrees with the whale read.
Ethereum Hodlers Cut Accumulation by Nearly 80% Since Late April
The Ethereum hodler net position change tracks the daily change in ETH held by long-term wallets. The metric typically captures wallets that have held the token for over 155 days.
The reading peaked at 383,128 ETH on April 27. By May 11, that figure dropped to 77,675 ETH, a decline of roughly 80%.
Long-term holders have not stopped accumulating outright. They are still net buying, just at a sharply slower pace. The pace of spot buying from this cohort has thinned to roughly a fifth of the late-April rate.

The likely explanation is the same elevated funding rate that signals optimism on the derivatives side. Hodlers see funding above 0.01% as a warning that the market is leaning too long. They pull back from chasing the rally. That sets up the conflict. Whales see the falling open interest and call the optimism healthy. Hodlers see the elevated funding rate and call it overheated.
Whoever is right shapes the next leg, and the chart is the decider.
Ethereum Price Holds the Floor With $2,269 as the Trapdoor
Ethereum trades at $2,311 on the daily chart, down 1.2% on the day. The structure remains contained inside a descending channel that has held since the April 17 high.
Whale support has kept the price above $2,298, the 0.5 Fibonacci retracement of the broader pullback.
A clean daily close below $2,298 exposes $2,269, the 0.618 Fibonacci, as the next floor. That is just a 2% drop on the day.

Beneath $2,269, $2,227 and $2,174 come into the picture. A break below $2,174 exposes the lower trendline of the descending channel and risks a decisive draw lower.
On the upside, a reclaim of $2,327 puts the chart back toward neutral. A move above $2,363 shifts the structure to neutral-bullish. The target then becomes $2,422 in the short term.
Ethereum price is locked between whale buying at the floor and hodler caution above. $2,298 separates a slow recovery setup from a 2% slide that exposes $2,269 next.
The post Whales Just Bet $832 Million on the Ethereum Price Dip, Here’s Why appeared first on BeInCrypto.


A federal grand jury has indicted three Tennessee men over an alleged crypto robbery spree, including one incident where a victim was forced at gunpoint to surrender $6.5 million in digital assets.
Elijah Armstrong, Nino Chindavanh, and Jayden Rucker face conspiracy and kidnapping charges.
Tennessee Trio Hunted Crypto Holders
According to the press release, the defendants traveled from Tennessee and posed as delivery workers to enter victims’ homes. Investigators say the crew used guns, zip ties, and duct tape to restrain occupants.
“Armstrong, 21, of Tennessee; Chindavanh, 21, of Tennessee; and Rucker, 25, of Tennessee, are alleged to have conspired to kidnap and rob individuals in San Francisco, San Jose, Sunnyvale, and Los Angeles in efforts to steal cryptocurrency from the victims,” the press release read.
Follow us on X to get the latest news as it happens
Prosecutors detailed one incident where the alleged attackers forced one victim to log into his cryptocurrency accounts at gunpoint. A co-conspirator then transferred roughly $6.5 million from those wallets to addresses controlled by the group.
Armstrong and Rucker were arrested in Los Angeles on December 31. Chindavanh was detained earlier that month in Sunnyvale. All three remain in federal custody.
US Attorney Craig H. Missakian commented in the indictment announcement.
“These individuals, as alleged, terrorized their victims in the hopes of stealing vast sums of cryptocurrency. The scheme was not only sophisticated, it was brazen, violent, and dangerous,” he said.
If convicted, the defendants could face up to 20 years in prison and $250,000 in fines for charges including Conspiracy to Commit Hobbs Act Robbery, Attempted Hobbs Act Robbery, and Attempted Kidnapping. The Conspiracy to Commit Kidnapping charge carries a potential life sentence.
The development comes amid a sharp rise in physical crimes targeting cryptocurrency holders. Blockchain security firm CertiK documented 34 verified physical attacks on cryptocurrency holders between January and April 2026, a 41% rise year-over-year. CertiK projects that 2026 will close with around 130 wrench attacks if the current pace holds.
Subscribe to our YouTube channel to watch leaders and journalists provide expert insights
The post Three Tennessee Men Indicted Over $6.5 Million Crypto Robbery Spree appeared first on BeInCrypto.


Michael Saylor has defended Strategy’s ability to sell limited amounts of Bitcoin while continuing to expand its BTC treasury, arguing the company should avoid becoming a net seller rather than follow an absolute “never sell” stance.
Summary
- Strategy said limited Bitcoin sales could still support a larger BTC accumulation plan rather than reduce its treasury exposure.
- Michael Saylor described STRC and MSTR as part of a Bitcoin-backed capital structure built around digital credit and equity products.
According to comments shared by Saylor on May 10 and statements made during his recent appearance at Consensus in Miami, Strategy’s Bitcoin strategy now revolves around using its holdings to support a layered capital structure tied to preferred stock products and equity financing.
Saylor said any future Bitcoin sale would only happen within a larger accumulation cycle.
“Even if we were to sell one Bitcoin, we’d be buying 10 to 20 more Bitcoin,” he said while responding to concerns that Strategy could eventually reduce its exposure to BTC.
Recent debate around the company’s treasury model intensified after Strategy disclosed that its preferred stock products carry roughly $1.5 billion in annual dividend obligations.
Crypto.news previously reported that the company posted a $12.54 billion net loss during Q1 2026 while holding 818,334 BTC as of May 3, acquired at an average purchase price of $75,537.
Speaking with CoinDesk senior analyst James Van Straten at Consensus, Saylor described fears surrounding potential Bitcoin sales as economically insignificant.
He said Strategy could still buy roughly 20 BTC for every one Bitcoin sold if dividends were entirely funded through BTC sales. Saylor also argued the scale of any such sale would remain small compared with Bitcoin’s daily market liquidity, which he estimated at between $20 billion and $50 billion.
Strategy expands Bitcoin financing model
During his Bitcoin 2026 keynote and subsequent posts on X, Saylor described Strategy’s structure as a three-part capital system built around Bitcoin reserves.
In Saylor’s framework, Bitcoin functions as “digital capital,” STRC operates as “digital credit,” and MSTR represents the leveraged equity layer tied to the company’s BTC treasury.
He said Strategy is “converting digital capital Bitcoin into digital credit (STRC) and digital equity (MSTR).”
STRC, also called “Stretch,” is Strategy’s perpetual preferred stock product designed to maintain a price close to its $100 par value.
According to Saylor’s Bitcoin 2026 presentation and Strategy’s digital credit dashboard, the company adjusts STRC’s monthly dividend rate while using an at-the-market issuance program to sell new shares when the product trades at or above par.
Cash raised through those sales is then used to purchase more Bitcoin for the company’s reserve balance.
During the same presentation, Saylor said STRC had grown to roughly $8.5 billion in assets under management within about nine months. He also described the product as targeting the private credit market, which he estimated at $3.5 trillion.
Meanwhile, KuCoin’s summary of the Bitcoin 2026 conference noted that STRC’s design channels Bitcoin-related returns into monthly income products.
The report added that the instrument was structured around an 11% yield assumption tied to Bitcoin’s 38% annualized return and a 5:1 collateral ratio intended to absorb steep BTC price declines.
On the equity side, MSTR continues to function as Strategy’s public-market Bitcoin exposure vehicle.
A recent BitcoinTreasuries profile noted that the company now holds more than 800,000 BTC, while Yahoo Finance reported that roughly 85% of a recent $2.5 billion Bitcoin purchase by Strategy was financed through STRC issuance.
Elsewhere in the discussion, Saylor rejected criticism from gold advocate Peter Schiff, who argued that Strategy’s financing structure could face pressure during periods of Bitcoin weakness or rising dividend obligations.
Saylor responded that critics who do not accept Bitcoin as “digital capital” are unlikely to support financial products built around it.


Aptos plans to launch a native encrypted mempool to protect transaction intent at the protocol layer.
Summary
- Aptos says its encrypted mempool will hide transaction details during block ordering before execution.
- The feature still needs governance approval before Aptos can roll it out to users.
- Aptos Labs says batched threshold encryption can limit latency while keeping network trust assumptions.
The network said the feature will keep pending transaction details hidden during block ordering, then reveal them before execution.
The feature still depends on governance approval. Aptos said, “Pending governance approval, Aptos will be the first L1 to offer a native encrypted mempool.” The project says users will be able to send protected transactions with one click, without changing the normal on-chain record after confirmation.
Aptos keeps transaction intent hidden
Aptos Labs said most blockchains expose pending transactions before they reach a block. That visibility can let validators, bots, or other actors delay, reorder, copy, or censor trades before confirmation.
The encrypted mempool is designed to reduce that risk. Aptos Labs said transaction details remain confidential until execution, protecting users from frontrunning, censorship, and order-flow manipulation while confirmed transactions remain public on-chain as usual.
Moreover, Aptos Labs said the system uses batched threshold encryption. Under the design, validators can collectively decrypt batches of transactions in one operation, reducing communication and computing overhead compared with decrypting each transaction separately.
The team said this approach can work inside the Aptos consensus process while keeping the same trust assumptions as the network. Aptos Labs added that users should be able to submit encrypted transactions with “no impact to latency” once the system is live.
Institutional market push grows
Aptos framed the encrypted mempool as part of a wider push for large on-chain markets. The network said the feature can help protect large transactions from censorship and frontrunning, which remain common concerns in decentralized trading.
The move also follows wider ecosystem spending. Earlier reports noted that Aptos Foundation and Aptos Labs committed more than $50 million to support trading, AI agents, research, and protocol infrastructure. That plan includes Decibel, an on-chain order book and perpetuals exchange that Aptos said had crossed $1 billion in cumulative volume.
Aptos has also been adding privacy-focused features for institutional use. Related coverage noted that Confidential APT launched in April, allowing concealed transfer data while keeping verifiability. The encrypted mempool would add another layer by protecting transaction intent before execution.
TLDR
- President Trump dismissed Iran’s peace proposal as “totally unacceptable,” declaring the ceasefire is on “massive life support”
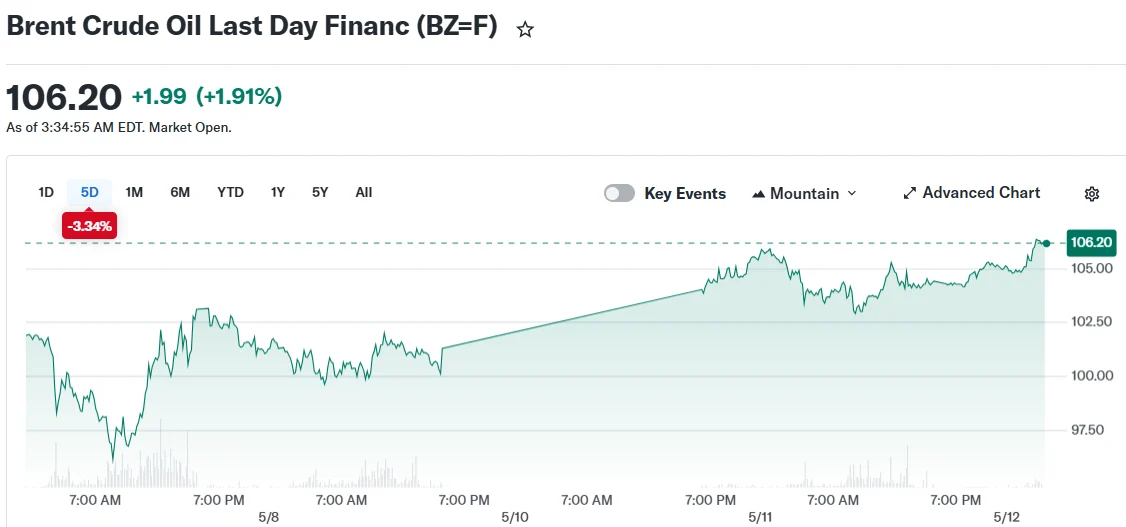
- Oil prices surged with Brent crude reaching approximately $105 per barrel and WTI approaching $99
- Tehran’s demands included ending the US naval blockade, sanctions relief, and maintaining partial authority over Strait of Hormuz operations
- Aramco’s chief executive stated global markets are hemorrhaging 100 million barrels weekly due to the strait closure
- Market participants are monitoring upcoming inflation reports and Trump’s Beijing meeting with President Xi for market direction
President Trump dismissed Iran’s most recent peace proposal on Monday, branding it “totally unacceptable” and referring to it as a “piece of garbage.” Speaking to the press, he characterized the ceasefire as being on “massive life support,” amplifying concerns that the conflict entering its tenth week could reignite.
[[EMBED_0]]
Oil markets responded sharply on Tuesday, with Brent crude advancing to approximately $105 per barrel, extending gains of nearly 3% from the previous trading session. West Texas Intermediate similarly climbed to roughly $99 per barrel.

The military confrontation commenced approximately ten weeks ago, with a tenuous ceasefire established in early April. However, continued maritime attacks throughout the region have sustained elevated geopolitical tensions.
Tehran’s counter-proposal to Washington’s peace framework contained multiple conditions: termination of the American naval blockade, comprehensive sanctions relief, restoration of Iranian petroleum exports, compensation for war-related damages, and preservation of partial oversight regarding maritime traffic through the Strait of Hormuz.
The Strait of Hormuz represents a critical artery for global energy transportation. Approximately 20% of the world’s oil and refined fuel products transit through this strategic waterway.
Supply Chain Impact of the Strait Blockade
Amin Nasser, chief executive of Saudi Aramco, revealed that global energy markets are forfeiting 100 million barrels of oil supply weekly while the strait remains inaccessible. While Aramco has redirected certain shipments through its Red Sea facilities, crude prices remain historically elevated and major purchasers like China have significantly reduced their import volumes.
Domestic gasoline prices across America have spiked considerably, creating substantial political pressure on President Trump and congressional Republicans as the November midterm elections approach. The administration has authorized strategic petroleum reserve releases in efforts to stabilize consumer fuel costs.
Analysts at Bloomberg Economics assessed that comprehensive peace negotiations appear improbable. Their outlook suggests hostilities may resume but would potentially stabilize into sporadic, lower-intensity confrontations, characterizing this scenario as “the new normal.”
Axios has reported that Trump is convening his national security advisors to evaluate potential resumption of military operations. In a Fox News interview, the President indicated he’s reconsidering a proposal to provide naval escorts for commercial vessels traversing the strait.
Market Focus Points Going Forward
Financial markets are intensely focused on Tuesday’s US Consumer Price Index release. Economic forecasters anticipated the headline inflation metric would accelerate to 3.7% from the prior 3.3% year-over-year reading, partially attributable to elevated energy expenses stemming from the Middle East crisis.
Wednesday’s producer price index figures are similarly projected to reveal mounting cost pressures from increased gasoline and transportation expenses throughout the supply chain.
Accelerating inflation could complicate Federal Reserve policy decisions and potentially sustain elevated interest rates for an extended period.
Market participants are simultaneously monitoring President Trump’s scheduled diplomatic engagement with Chinese President Xi Jinping in Beijing. The bilateral discussions are anticipated to address Iran policy, commercial relations, and energy security frameworks. China maintains its position as Iran’s largest petroleum customer and exercises considerable diplomatic leverage with Tehran.
The Treasury Department imposed additional sanctions Monday targeting entities facilitating Iranian oil sales to Chinese buyers. Market observers suggested the Trump-Xi summit outcome could prove decisive in determining the conflict’s trajectory.
Technical market strength indicators have deteriorated in recent trading sessions as certain refineries have reduced their purchasing activity.
The American Bankers Association is lobbying US senators ahead of this week’s Senate Banking Committee markup of crypto legislation, warning that proposed stablecoin rules could incentivize consumers to move deposits out of banks.
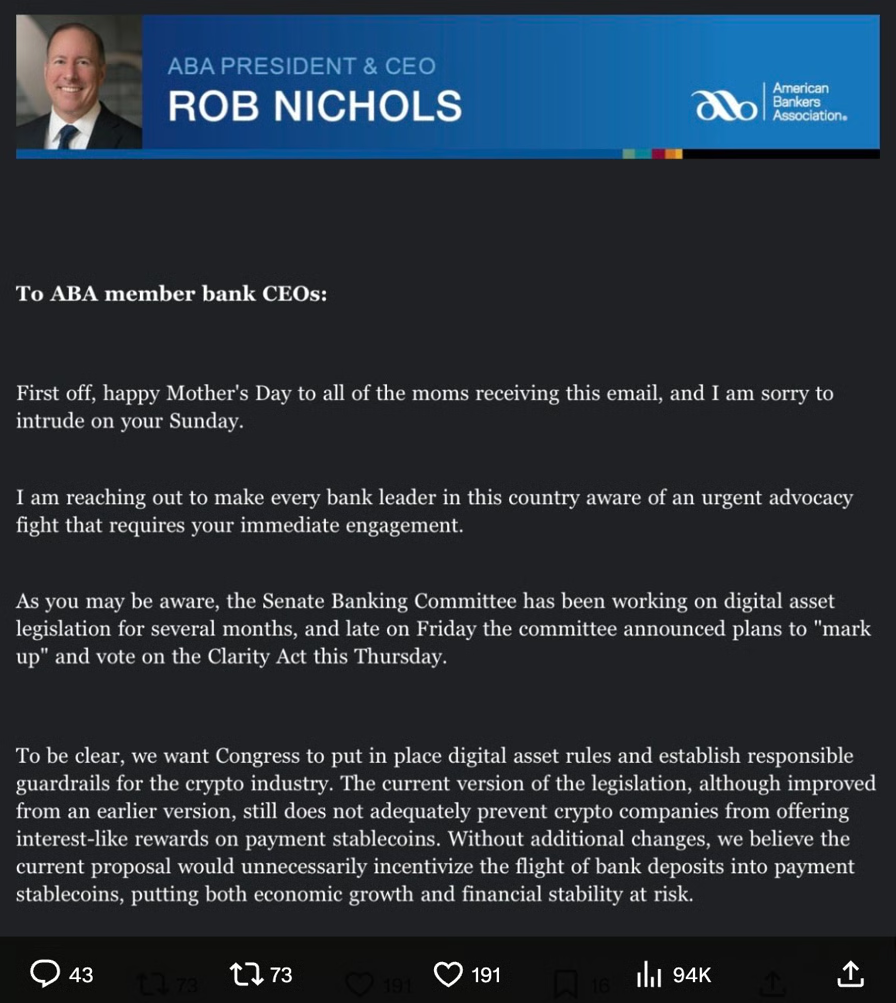
In a Sunday message to member bank CEOs shared on X by Punchbowl News reporter Brendan Pedersen, ABA president and CEO Rob Nichols said the current version of the CLARITY Act does not adequately prevent crypto companies from offering interest-like rewards tied to payment stablecoins.
Nichols urged bankers to contact senators and encourage employees to do the same before Thursday’s committee markup, describing the issue as an “urgent advocacy fight” for the banking industry.
“The legislation would permit stablecoin issuers and associated business partners to pay interest or interest-like incentives to stablecoin holders,” Nichols wrote, adding that the provision could create “a digital asset loophole” that would allow deposits to migrate outside the traditional banking system.

Source: Brendan Pederson
Nichols said the ABA had been “working hard behind the scenes for months” on the issue and warned that allowing non-bank stablecoin issuers to offer interest-like incentives could threaten “economic growth and financial stability.”
The latest lobbying effort follows a Friday letter from the ABA and other major US banking associations urging Senate lawmakers to strengthen the bill’s stablecoin yield restrictions, arguing the current language still allows structures that could incentivize users to move deposits out of banks.
Related: 7 Democrats seen as ‘key’ to advancing CLARITY Act: Galaxy
CLARITY Act stablecoin yield fight continues ahead of Senate vote
The CLARITY Act, which aims to establish a federal regulatory framework for digital assets and is scheduled for a Senate Banking Committee vote on Thursday, has fueled months of debate between banks and the crypto industry over stablecoin yield provisions.
In April, the ABA criticized a White House report that said banning stablecoin yield would have only a limited impact on bank lending, while Bank of America CEO Brian Moynihan warned earlier this year that such products could pull as much as $6 trillion out of the banking system.
Crypto companies, meanwhile, have pushed back against the banking industry’s position, with Coinbase CEO Brian Armstrong among the most vocal critics of banks for offering near-zero interest rates on customer deposits while opposing yield-bearing stablecoin products.

X post Sept. 29, 2025. Source: Brian Armstrong
Earlier this month, lawmakers attempted to strike a compromise by publishing updated stablecoin yield provisions prohibiting crypto companies from offering interest or yield solely for holding payment stablecoins while still permitting rewards tied to “bona fide activities.” However, some banking groups argued the revised restrictions did not go far enough.
While debate over stablecoin yield provisions continues, recent polling suggests support for broader crypto legislation is growing across party lines.
A HarrisX survey of 2,008 registered US voters found that 52% support the CLARITY Act, while 47% said they would consider voting across party lines for a candidate who backed the legislation.
Prediction market Polymarket at last look gives the CLARITY Act a 65% chance of being signed into law before the end of the year, up from around 46% at the end of April. Platform users have staked $672,289 on the outcome, at last look.

Source: Polymarket
Magazine: XRP ‘probably going to $12,’ Bitcoin ETFs add $1B: Market Moves
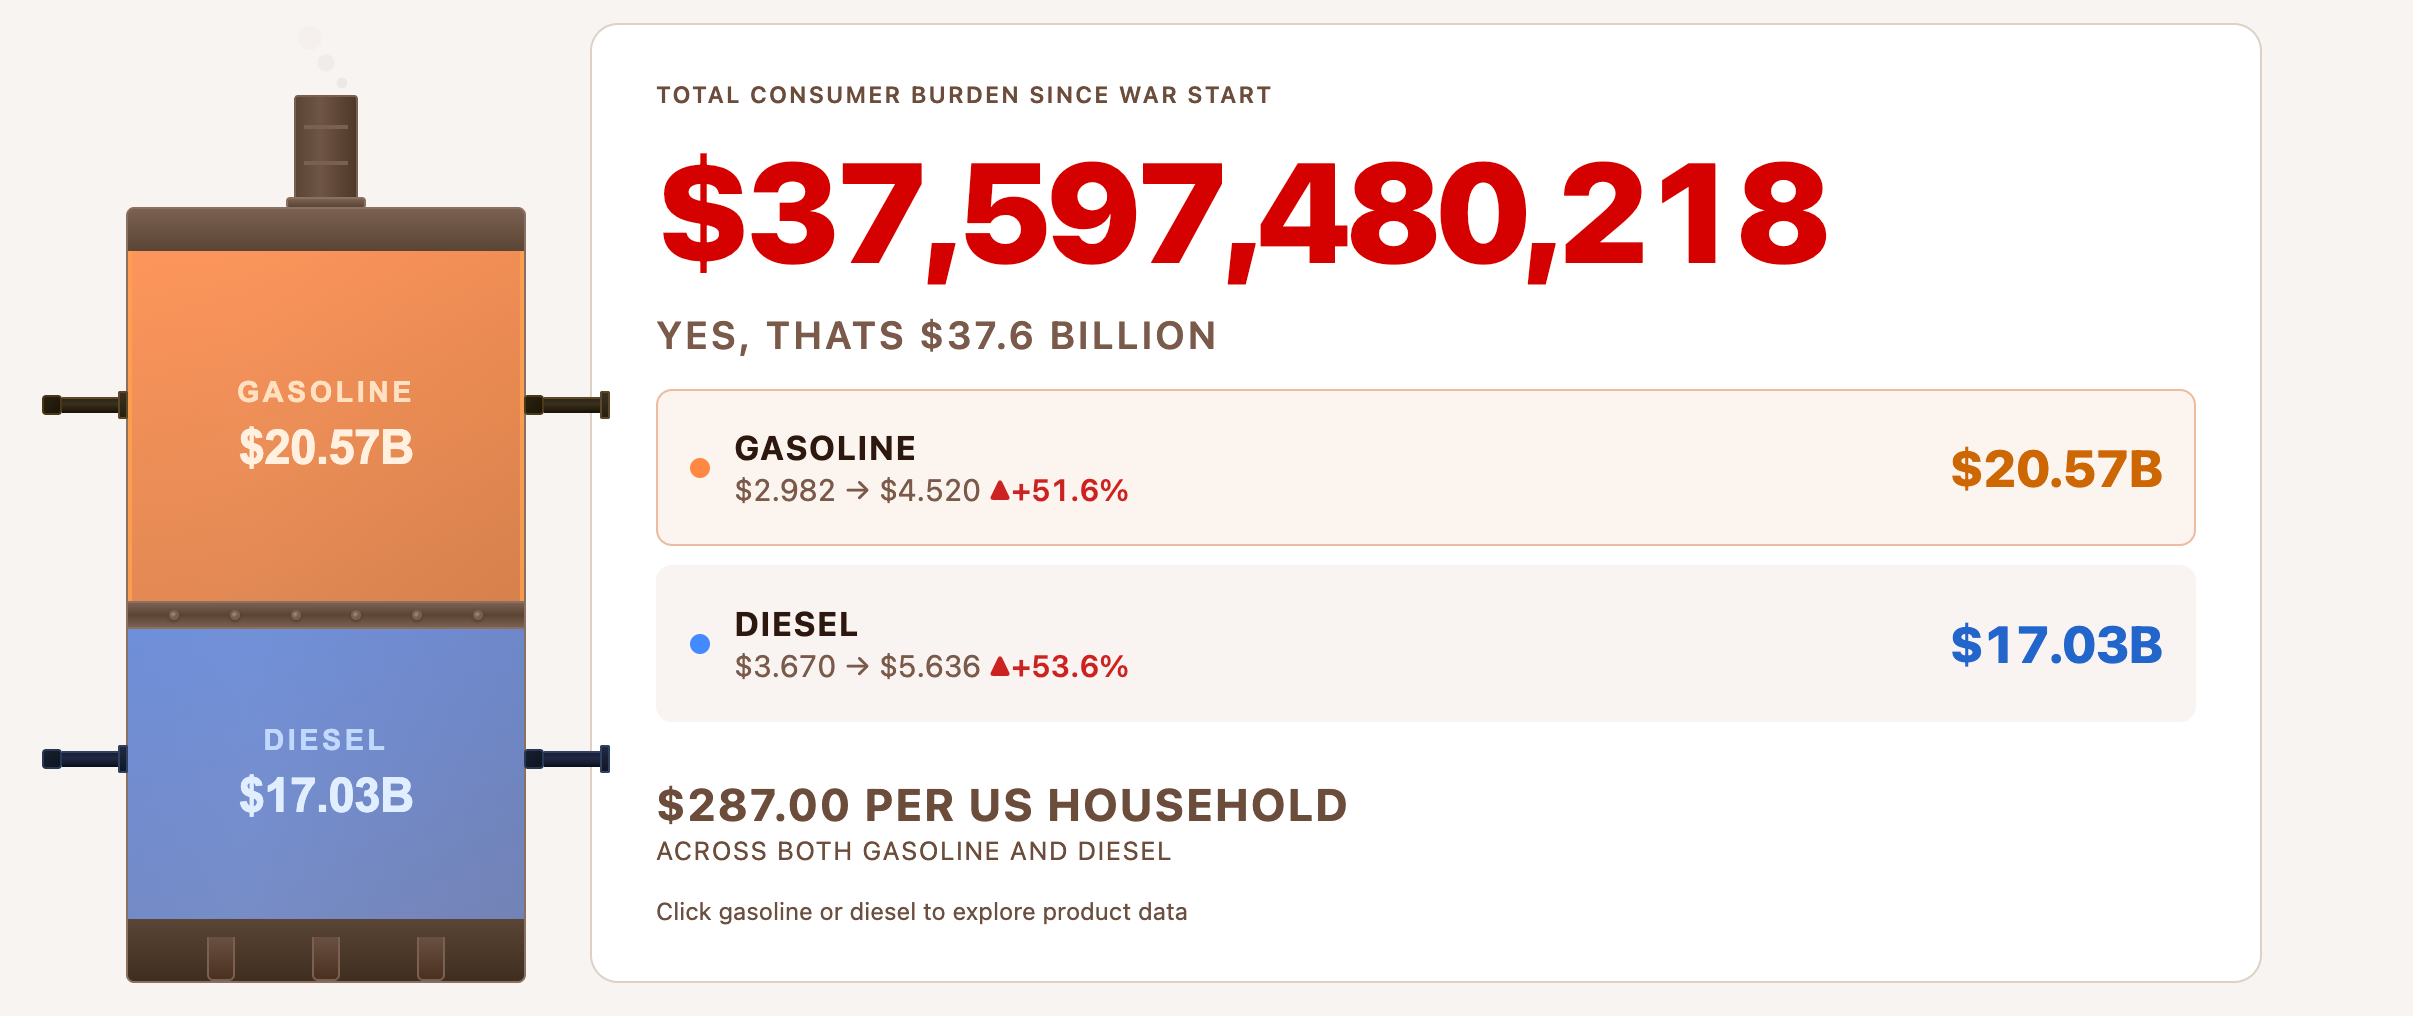
Americans have spent $37.6 billion more on gasoline and diesel since the Iran war erupted on February 28.
This data comes from a live tracker from Brown University’s Watson School of International and Public Affairs.
The Iran War Has Cost Every American Household $287 in Extra Fuel So Far
The figure breaks down to about $287 per US household, with national gas prices now averaging $4.52 a gallon. The price marks a 51.6% jump from the pre-war level of $2.98 over just 72 days.
“Fuel costs are just one part of a war’s consequences, but they come directly out of Americans’ pockets. These costs are rising everyday,” the website reads.
Follow us on X to get the latest news as it happens

The Iran War Energy Cost Tracker is led by Jeff Colgan, director of the Climate Solutions Lab at Brown’s Watson School.
The model compares fuel data from the American Automobile Association with estimated levels had the conflict not occurred. The gap between actual and counterfactual prices forms the cost calculation.
“This is an expense coming directly out of the pockets of American consumers, and consumers,” Colgan said.
It’s not just the households. BeInCrypto previously reported that US airlines spent $5.06 billion on jet fuel in March. That was a 56% jump from February as the conflict disrupted global supply.
Hormuz Closure Drives the Squeeze at the Pump
This highlights the broader economic impact of the conflict, which has led to the closure of the Strait of Hormuz, a critical passage for nearly 20% of global energy shipments.
The impact has also extended beyond energy markets. Inflation among US food and beverage companies rose 7.9% year-over-year in March, marking the sharpest increase in at least a year.
Meanwhile, public sentiment has also turned. A Generation Lab survey of Americans found 77% believe the strikes against Iran were the wrong call.
Subscribe to our YouTube channel to watch leaders and journalists provide expert insights
The post This Is How Much the Iran War Is Adding to Every American’s Fuel Bill appeared first on BeInCrypto.
Rebecca Black claps back at “Michael” star Jaafar Jackson's 15-year-old criticism that invoked Kanye West

How to Scan the Market for Credit Spreads Using an Options Screener

The Bahamas to temporarily ban the sale of alcohol this week
Manchester United reach agreement with Casemiro over contract clause amid transfer speculation

US brings back mandatory military draft registration

Steven Gerrard disagrees with Gary Neville over ‘shock’ Chelsea and Arsenal claim | Football


-
 Crypto World4 days ago
HarrisX Poll Found 52% of Registered Voters Support the CLARITY Act
-

 Fashion4 days ago
Weekend Open Thread: Marianne Dress
-

 Crypto World5 days ago
Upbit adds B3 Korean won pair as Base token gains Korea access
-
 NewsBeat5 days ago
NCP car park operator enters administration putting 340 UK sites at risk of closure
-

 Fashion15 hours ago
Coffee Break: Travel Steam Iron
-

 Tech2 days ago
Auto Enthusiast Carves Functional Two-Stroke Engine from Solid Metal
-

 Fashion1 day ago
What to Know Before Buying a Curling Wand or Curling Iron
-

 Politics10 hours ago
What to expect when you’re expecting a budget
-

 Politics3 days ago
Politics Home Article | Starmer Enters The Danger Zone
-
 Business3 days ago
Ignore market noise, India’s long-term story intact, say D-Street bulls Ramesh Damani and Sunil Singhania
-

 Crypto World7 days ago
UAE Free Zone Deploys Blockchain IDs to Verify Registered Firms
-

 Tech1 day ago
GM Agrees To Pay $12.75 Million To Settle California Lawsuit Over Misuse Of Customers’ Driving Data
-

 Crypto World6 days ago
BlackRock CEO Larry Fink Discusses a New Asset Class
-

 Entertainment5 days ago
Sarah Paulson Called Out For Met Gala ‘Hypocrisy’
-

 Crypto World5 days ago
Robinhood says Wall Street is building onchain
-
 Sports6 days ago
NBA playoff winners and losers: Austin Reaves is not loving Lakers vs. Thunder matchup, but Chet Holmgren is
-

 Entertainment5 days ago
General Hospital: Ric & Ava Bombshell – Ric’s Massive Secret Exposed!
-

 Entertainment6 days ago
Bold and Beautiful Early Spoilers May 11-15: Steffy Revolted & Liam Overjoyed!
-

 Tech6 days ago
Apple and Samsung are dominating smartphone sales so thoroughly that only one other company makes the top 10
-

 Fashion5 days ago
The Best Work Pants for Women in 2026
You must be logged in to post a comment Login