
Crypto World
Is a crypto token actually cheap?



A token can look cheap by market cap and be catastrophically expensive by fully diluted valuation, and the gap between the two numbers is where most crypto losses quietly begin. This guide explains market cap and FDV, why the difference matters more than either number alone, how token unlocks turn FDV into future selling pressure, the low-float high-FDV trap that defined a market cycle, and how to read both numbers before you buy.
Two traders look at the same token. The first checks its market capitalization, sees a modest number, and concludes the token is cheap with room to grow. The second checks its fully diluted valuation, sees a figure ten times larger, and concludes the token is a time bomb of future selling. They are looking at the same asset, and they are both reading real numbers. The gap between what they see is one of the most important and least understood concepts in crypto valuation, and misreading it has cost more retail money than almost any other single mistake.
Market capitalization and fully diluted valuation, FDV, are the two headline ways to size a token, and each answers a different question. Market cap asks what the tokens in circulation right now are worth. FDV asks what all the tokens that will ever exist would be worth at today’s price. When most of a token’s supply is already circulating, the two numbers are close and the distinction barely matters. When most of the supply is still locked, waiting to be released over years, the two numbers diverge enormously, and the space between them is a map of future selling pressure that the market cap alone completely hides.
This guide explains both numbers and the relationship that matters more than either. It covers what market cap and FDV actually measure, why circulating supply is trickier than it sounds, how the unlock schedule turns FDV into a calendar of future dilution, the low-float high-FDV trap that defined the 2024 token cycle and its aftermath, the specific ways these numbers mislead, and the practical checklist for reading a token’s valuation before the locked supply reads it to you.
The two numbers, precisely
Market capitalization is the simplest valuation in crypto: circulating supply multiplied by current price. A token trading at $2 with 100 million coins in circulation has a $200 million market cap. It answers the question, what is the market currently valuing this token at, based on the coins actually available, and it is the number that appears first on every tracker and the one most people mean when they call a token large or small.
Fully diluted valuation multiplies the same price by the total supply that will ever exist, not just what circulates today. If that same $2 token has a maximum supply of one billion coins, of which only 100 million circulate, its FDV is $2 billion, ten times its market cap. FDV answers a different question, what would this token be worth if every coin that will ever exist traded at today’s price, and it is, in effect, the valuation the market is implicitly assigning to the entire project if you assume the price holds as the rest of the supply arrives.
The relationship between the two is the whole game, and it is captured by one ratio: circulating supply divided by total supply, the float. A token with 90% of its supply circulating has a market cap close to its FDV, the two numbers nearly agree, and there is little hidden supply to worry about. A token with 10% of its supply circulating has an FDV ten times its market cap, and 90% of its eventual supply is sitting locked somewhere, scheduled to enter the market over time. The lower the float, the wider the gap, and the wider the gap, the more the market cap flatters the token by hiding what is coming.
Circulating supply is trickier than it looks
Before trusting either number, it is worth knowing that circulating supply, the input to market cap, is itself a slippery figure. It is meant to count the coins genuinely available to trade, excluding locked, reserved, and unreleased tokens, but the accounting varies by source and can be gamed. Projects sometimes report circulating supply generously, counting tokens that are technically unlocked but held in foundation or team wallets that will not actually sell, or excluding tokens in ways that flatter the market cap. Different data providers apply different methodologies, which is why the same token can show slightly different market caps on different trackers.
This matters because market cap inherits every ambiguity in circulating supply. A token whose reported circulating supply is artificially low will show an artificially low market cap, making it look cheaper than it is, while its FDV, based on the harder-to-fudge total supply, tells the less flattering truth. The discipline is to treat circulating supply as a claim to be checked rather than a fact, and to always read it alongside total supply and the unlock schedule, because the gap between circulating and total is not empty space, it is a queue.
The unlock schedule: FDV as a calendar
Here is the insight that turns FDV from an abstract number into a practical warning: the difference between circulating supply and total supply does not stay locked forever. It is released on a schedule, the vesting or unlock schedule, and that schedule is a calendar of future selling pressure written years in advance.
When a project launches, it typically sells or allocates only a fraction of its tokens, keeping the rest locked for the team, investors, treasury, and ecosystem, released gradually over months or years. Each release, an unlock, converts locked tokens into circulating ones, expanding the supply that can be sold. The tokens existed all along, they were always counted in FDV, but they become sellable only when they unlock, the anticipatory dynamic that governs every large scheduled release. This is why FDV matters: it is not a hypothetical, it is a preview of the supply that is contractually scheduled to arrive, and the unlock calendar tells you exactly when.
The mechanical consequence is relentless. A low-float token with a high FDV faces a headwind that a high-float token does not: a steady stream of newly unlocked tokens, often released to insiders sitting on large gains, entering a market that must absorb them just to keep the price flat. If demand does not grow at least as fast as supply unlocks, the price falls, not because anything went wrong with the project, but because the supply side of the equation was scheduled to overwhelm the demand side from the start. Reading a token’s unlock schedule is reading its future selling pressure, and a token whose FDV dwarfs its market cap is a token whose price chart is fighting its own supply calendar for years, the same supply-versus-demand scissors that shapes entire market cycles.
The low-float, high-FDV trap
The gap between the two numbers is not just a technical curiosity; it defined an entire market cycle and taught a brutal lesson. In the 2024 token era, a wave of projects launched with very low floats and very high FDVs: a small fraction of supply circulating, valuations that looked reasonable by market cap, the fair-launch platforms industrializing exactly this structure at scale, as their own house token’s supply cliff showed but enormous by FDV, and long vesting schedules loading the future with unlocks.
The pattern worked, briefly, because low float is a price accelerant in both directions. With few tokens available to trade, modest demand produces dramatic price gains, thin supply amplifies buying the way it amplifies everything, the same launch-curve dynamic that prices earliness into every memecoin, and the early charts looked spectacular, drawing in buyers who checked the market cap, saw room to grow toward the FDV, and bought. Then the unlocks began. Wave after wave of locked supply, much of it held by insiders who had bought far lower, entered the market, and the same thin float that amplified the rise now had to absorb a rising tide of new supply against fading demand. The result was a cohort of tokens that spent the following period grinding relentlessly lower, not from any failure of their projects but from the arithmetic they launched with: valuations set at the top, supply scheduled to arrive into weakness, and a float too thin to defend the price on the way down. The lesson the cycle burned into the market was that a low market cap next to a high FDV is not a bargain waiting to grow, it is frequently a warning that the price you see was manufactured by scarcity that is scheduled to end.
A worked comparison: two tokens, same market cap
Set two tokens side by side to see the gap do its work. Token A trades at $1 with 800 million of its 1 billion total supply circulating: an 80% float, a market cap of $800 million, and an FDV of $1 billion. The two numbers nearly agree, only 200 million tokens remain to unlock, and whatever selling pressure they represent is modest against the supply already trading. Token B also has an $800 million market cap, at $4 with 200 million of a 1 billion total supply circulating: a 20% float and an FDV of $4 billion. Same market cap, radically different situations. Token B has four times the eventual supply still locked, 800 million tokens queued to arrive, and its price must climb a supply escalator running the other way for as long as those unlocks continue.
A buyer comparing the two by market cap alone sees a tie and might pick Token B for its higher price and apparent momentum. A buyer reading float and FDV sees that Token A is most of the way through its dilution while Token B has barely begun, and that Token B’s $4 price is being held up by a float one-quarter the size, exactly the scarcity that will reverse as supply unlocks. Neither token is automatically good or bad, but they are not remotely the same investment, and only the second reading reveals it. The market cap said they were equal; the FDV and the float said one had a tailwind and the other a four-year headwind.
What responsible vesting looks like
Because the guide has dwelt on the trap, fairness requires describing the healthy version, since a high FDV is not inherently a red flag. Responsible token design vests supply in ways that align insiders with long-term holders rather than setting them up to dump: meaningful cliffs before any team or investor tokens unlock at all, long linear release schedules that spread supply over years instead of dropping it in cliffs, allocations weighted toward ecosystem and community rather than concentrated in early investors, and transparent, published schedules that let the market price the dilution in advance instead of being surprised by it. A project with a high FDV but a slow, transparent, community-weighted unlock schedule and genuine demand growth can absorb its supply gracefully, and many legitimate networks have.
The distinction that matters is therefore not high FDV versus low FDV but scheduled dilution versus demonstrable demand. A token whose users, revenue, or adoption are growing fast enough to soak up its unlocks can carry a high FDV comfortably; a token whose only source of price support was a thin float, facing large near-term unlocks to insiders already in profit, cannot. Reading valuation well means holding the FDV and the unlock schedule in one hand and the demand trajectory in the other, and asking the only question that ultimately sets the price: is real demand growing at least as fast as scheduled supply. When the answer is yes, a high FDV is a sign of ambition; when it is no, the same number is a countdown.
How the numbers mislead, in both directions
Each number lies in its own way, and knowing how is the point of reading them together. Market cap misleads by hiding the future: it makes low-float tokens look cheap and small, showing only the tokens that circulate today and silently omitting the locked supply queued to dilute them, which is exactly why the low-float trap works, buyers who anchor on market cap are reading a number designed, whether intentionally or not, to look better than the token’s real valuation. FDV misleads by ignoring time and probability: it values every future token at today’s price as if all supply existed now, which overstates the case for tokens whose locked supply may be burned, may never fully release, or may be years away, and it treats distant, uncertain dilution as if it were present, which can make a healthy long-vesting project look scarier than it is.
The truth lives in reading both against the unlock schedule. A high FDV is not automatically damning, plenty of legitimate projects launch with most supply locked and vest it responsibly, but a high FDV with imminent, large unlocks to insiders sitting on gains is a specific and readable danger. A low market cap is not automatically a bargain, it may simply be the visible tip of a much larger diluted valuation. The numbers are inputs to a judgment, not verdicts on their own, and the judgment requires the third document neither number contains: the vesting schedule that says how much supply arrives, when, and to whom.
The practical checklist
Reading a token’s valuation honestly comes down to a short sequence. First, check the float: circulating supply divided by total supply, because it tells you at a glance how much of the story the market cap is hiding, a float near 100% means the two numbers agree, a float near 10% means the market cap is showing you a tenth of the eventual supply. Second, read the gap: compare market cap to FDV, and treat a large gap as a flag to investigate, not a verdict, but never a number to ignore. Third, pull the unlock schedule: find out how much locked supply exists, when it releases, and to whom, because that calendar is the future selling pressure the FDV only summarizes, and imminent large unlocks to early investors are the specific danger the low-float trap is built on. Fourth, weigh demand against supply: ask whether the project’s growth in users, revenue, or adoption is plausibly fast enough to absorb the scheduled unlocks, because that race, demand growth against supply release, is what actually sets the price over time.
The deeper habit, beneath the checklist, is refusing to let a single number make the decision. Crypto’s most expensive lesson is that a token can be simultaneously cheap by one honest measure and dangerously expensive by another, and that the two measures diverge precisely in the tokens most aggressively marketed as opportunities. Market cap tells you what the market pays for what exists. FDV tells you what it is implicitly paying for what is coming. Neither is the truth alone; the truth is in the space between them, on the unlock calendar, and the traders who read that space before they buy are reading the one part of a token’s valuation that the price chart, the marketing, and the market cap are all designed to keep them from seeing until it is too late.
A closing note on where these numbers come from, because trusting a tracker blindly reintroduces the very ambiguity the guide warns against. Market cap and FDV are computed from supply figures that projects self-report and aggregators standardize imperfectly, total supply can change if a project mints or burns tokens, maximum supply is sometimes uncapped entirely, which makes FDV undefined or meaningless, and circulating supply, as covered above, is the softest input of all. The disciplined reader treats the headline numbers as starting points and verifies the underlying supply mechanics: is there a hard cap, is supply inflationary, are tokens being burned, and does the unlock schedule match what the tracker implies. These checks take minutes and routinely overturn the first impression, a token with an uncapped supply has no true FDV, a token with aggressive burns may see supply shrink instead of grow, and a token whose emissions never end is diluting holders forever regardless of any headline ratio. The two numbers are tools for asking better questions, not answers to be trusted on sight, and the space between them, mapped against the real supply schedule, is where a token’s honest valuation actually lives.
Disclaimer: This article is for educational purposes only and does not constitute investment advice. Digital asset markets are volatile and you can lose your entire investment. Details are current as of July 9, 2026. Always do your own research.
Frequently asked questions
What is the difference between market cap and FDV?
Market capitalization is circulating supply times price: the value of the tokens available to trade right now. Fully diluted valuation is total supply times price: the value of every token that will ever exist at today’s price. When most supply already circulates, the two are close; when most supply is locked, FDV can be many times larger than market cap, revealing hidden future supply the market cap conceals.
Why does a high FDV matter if those tokens are not circulating yet?
Because the locked tokens are scheduled to enter circulation over time through unlocks, and each unlock adds sellable supply the market must absorb. A high FDV relative to market cap means large amounts of supply are queued to arrive, often to insiders holding gains, creating persistent selling pressure. FDV is a preview of that scheduled dilution, which is why it can matter more than the current market cap.
What is a low-float, high-FDV token?
It is a token with only a small fraction of its total supply circulating and a fully diluted valuation many times its market cap. The thin float makes the price easy to move up early, attracting buyers, while the huge locked supply is scheduled to unlock over time. Many such tokens from the 2024 cycle rose sharply then fell relentlessly as unlocks flooded the market, making the pattern a well-known trap.
Is a low market cap always a good buying opportunity?
No. A low market cap can simply be the visible tip of a much larger fully diluted valuation, with most supply locked and scheduled to dilute holders over years. A token can look cheap by market cap and be expensive by FDV at the same time. Reading market cap without checking FDV and the unlock schedule is exactly the mistake the low-float trap exploits.
How do I find a token’s unlock schedule?
Token unlock and vesting schedules are published by projects and aggregated by several analytics platforms that track upcoming releases, their sizes, and their recipients. The schedule tells you how much locked supply exists, when it becomes sellable, and whether it goes to team, investors, or ecosystem, which is the information FDV only summarizes and the single most useful supplement to both valuation numbers.
Can circulating supply be misleading?
Yes. Circulating supply is meant to count freely tradable tokens, but methodologies vary and it can be reported generously, counting tokens held in team or foundation wallets that will not sell, or excluding supply to flatter the figure. Because market cap depends on it, an inflated or understated circulating supply distorts the market cap directly, which is why total supply and FDV, harder to fudge, are useful cross-checks.
Does a high FDV always mean a token is a bad investment?
No. Many legitimate projects launch with most supply locked and vest it responsibly over years, and a high FDV alone is not damning. The danger is specific: a high FDV combined with large, imminent unlocks to insiders sitting on gains, into a market whose demand is not growing fast enough to absorb them. FDV is a flag to investigate the unlock schedule, not an automatic verdict.
Which number should I use to compare two tokens?
Use both, plus the unlock schedule. Comparing by market cap alone can make a low-float token look smaller and cheaper than a high-float token that is actually more fairly valued. Comparing by FDV alone can penalize a responsibly vesting project. The honest comparison weighs each token’s market cap, its FDV, its float, and how fast its scheduled supply arrives against its actual demand growth.
Disclosure: This article does not represent investment advice. The content and materials featured on this page are for educational purposes only.

FIFA President Gianni Infantino has reportedly asked the Trump administration to help him keep his job, arranging a call with Secretary of State Marco Rubio, the New York Post reported Monday.
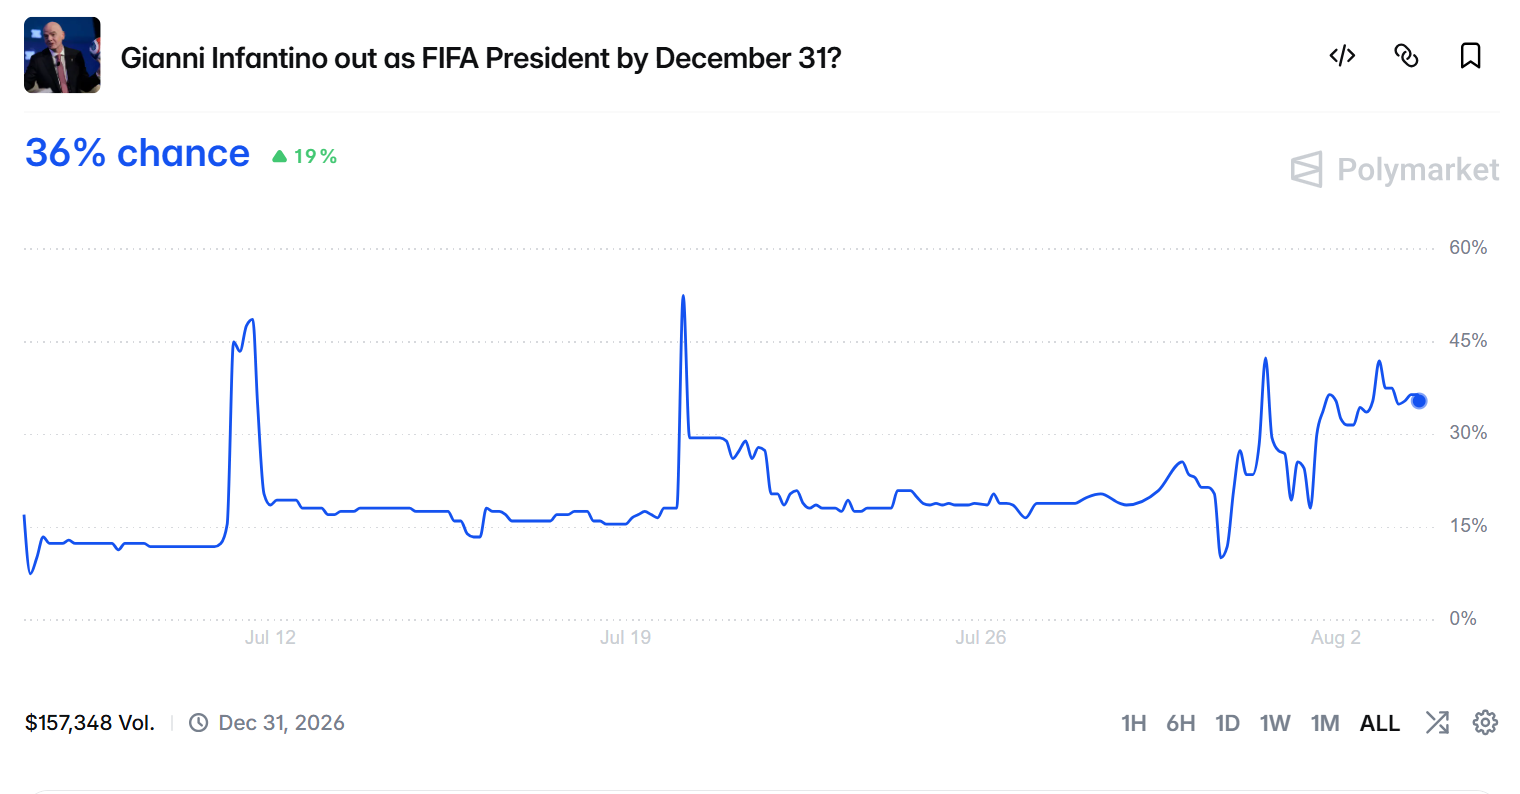
Polymarket traders price his exit by December 31 at 36.5%, up from roughly 19% a week ago. Almost all of the contract’s lifetime volume arrived in the past seven days.

Why Infantino Thinks Trump Owes FIFA a Favor
The reported ask lands four weeks after FIFA handed the White House a win. Its disciplinary committee cleared Folarin Balogun for Belgium, suspending the striker’s automatic red card ban on probation.
Trump had pushed for the reversal and claimed credit for it publicly.
“Thank you to FIFA for doing what was right, and reversing a great injustice!” Trump wrote on Truth Social.
Rubio is not a cold call. He sat in the Oval Office with Trump and Infantino last November. The occasion was a task force meeting on the World Cup.
FIFA’s bridge into that room is now gone. Carlos Cordeiro, the former Goldman Sachs banker who represented FIFA on the task force, resigned Friday over the sale plan. He had joined Infantino on repeated White House visits.
BeInCrypto could not independently verify the Rubio call, which the Post attributed to two people familiar with it.
Polymarket Traders Price the Fallout
The market read the revolt faster than the headlines did. It still traded near 20% on the afternoon of July 30. That was when all 55 UEFA member associations unanimously backed a boycott.
It broke above 40% the following day, once Infantino’s own executives turned on him. Chief operating officer Kevin Lamour told the Associated Press that staff had been deceived.
“It is the project of one person,” Kevin Lamour, chief operating officer of FIFA, in a statement to the Associated Press.
Follow us on X to get the latest news as it happens
Volume backs the repricing. The contract has handled $156,400 since it opened on July 6, and $151,700 of that traded in the past week. Open interest sits near $76,000.
The expiry date shapes how traders read it. The contract pays out only on a departure before December 31, while FIFA’s election falls next March. Challengers have until November 18 to declare, so the market is pricing resignation rather than defeat.
The asset in dispute is large. Cordeiro put FIFA’s revenue at $15 billion over the World Cup cycle. Josh Kushner’s fund offered $4.2 billion for 20% of a new FIFA subsidiary.
Crypto already has a claim on that value. The tournament drove $20 billion in World Cup prediction volume, Chainalysis found. FIFA’s own collectibles platform cleared at least $6 million in fees.
Whether Rubio’s call buys Infantino anything should show up in the odds before it shows up in a FIFA statement.
The post Infantino Wants to Collect on Trump’s World Cup Favor but Polymarket Says He’s 36% Out appeared first on BeInCrypto.

Miller’s previous controversies
Before being elected to the House in 2022, Miller spent six years in the Marine Corps Reserve. He also previously served in Trump’s first-term Administration, including as a senior advisor to the President.
Politico and the Washington Post have previously reported on Miller’s run-ins with the law as a young adult, including charges, which were later dismissed, for underage drinking, assault, disorderly conduct, and resisting arrest.
From 2019 to 2020, Miller dated Stephanie Grisham, a White House press secretary during Trump’s first-term Administration. Grisham has also accused Miller of abuse: she wrote in a 2021 op-ed for the Post and in a memoir the same year, without naming Miller, that her relationship with a White House staffer had “turned abusive” and that she had told Trump himself about her former partner who had “anger issues and a violent streak.”
The partner was later identified as Miller, who then sued Grisham for defamation, though he voluntarily dropped the suit in 2023 as part of a confidential settlement agreement.


BlackRock, the world’s largest asset manager, has expanded its tokenized cash platform, introducing a couple of new tokenized money market products, the firm said on Monday.
Back in May of this year, BlackRock filed for the new products with the U.S. Securities and Exchange Commission (SEC).
BlackRock is offering onchain shares of the BlackRock Select Treasury Based Liquidity Fund (BSTBL), a tokenized share class on Ethereum for an existing BlackRock money market fund. In addition, a new BlackRock Daily Reinvestment Stablecoin Reserve Vehicle (BRSRV) has also been unveiled with daily dividend reinvestment and access across multiple blockchains, said BlackRock in a press release.
Both funds intend to qualify as eligible reserve assets for permitted U.S. payment stablecoin issuers under the GENIUS Act, the asset manager said.
The move deepens BlackRock’s push into tokenized finance, blockchain-based representations of traditional financial assets such as funds, bonds or equities. Advocates say the technology can speed up settlement, enable round-the-clock trading and improve transparency.


Crypto exchange Bitget will stop accepting new registrations from Japanese users, announcing a phased exit that culminates in forced position closures by December 31, 2026.
The withdrawal comes as Japan tightens its licensing regime and grapples with severe currency turbulence.
The Timeline Japanese Users Now Face
The announcement, dated August 3, sets a clear timeline. Accounts flagged as potentially Japanese must complete that verification by November 1, 2026. Failure triggers restrictions. Users who miss the deadline face phased limitations from that date, with any remaining open positions forcibly closed by the end of December.
The exchange will email withdrawal instructions to affected users, framing the decision as part of its ongoing commitment to regulatory compliance.
The regulatory backdrop explains the move. Japan requires crypto service providers serving local residents to register with the Financial Services Agency under the Payment Services Act.
Follow us on X to get the latest news as it happens.
Enforcement risk is real for unregistered platforms. The agency issued warnings to Bitget and other overseas exchanges in November 2024. Consequences followed. Bitget’s app was later removed from Japan’s App Store, though web and Android access remained available to existing users.
Few jurisdictions demand more. Providers must meet capital, custody, consumer-protection, and anti-money-laundering standards to operate legally.
How Japan’s Yen Turmoil Compounds the Regulatory Burden
The timing coincides with acute currency pressure. The yen slid toward a 40-year low near 164 per dollar in late July, driven by rate differentials and carry-trade activity. Japan responded aggressively, with estimates suggesting authorities spent tens of billions of dollars buying yen to halt the decline.
“They have a weakening yen, and they wanted a little bit of help. And we’re always there for Japan,” US President Donald Trump told reporters on Sunday.
Washington then joined the effort. Both countries conducted a rare coordinated intervention, the first in 15 years, targeting excessive volatility and disorderly movements. The response was immediate, with the yen rebounding sharply and briefly reaching 155 per dollar.
Officials signaled more could follow. Finance Minister Satsuki Katayama and US Treasury Secretary Scott Bessent confirmed the operation and indicated readiness for further action.
The two pressures compound each other. Strict licensing raises fixed costs, while currency volatility complicates pricing and treasury management for offshore operators.
Bitget’s exit illustrates a broader pattern. Platforms must either invest heavily in registration or leave markets where regulatory barriers make operations uneconomical.
Japanese users still have room to act, with the transition window running until year-end before restrictions take full effect.
Subscribe to our YouTube channel to watch leaders and journalists provide expert insights.
The post Bitget Withdraws From Japan Amid Tightening Crypto Rules and Yen Turmoil appeared first on BeInCrypto.
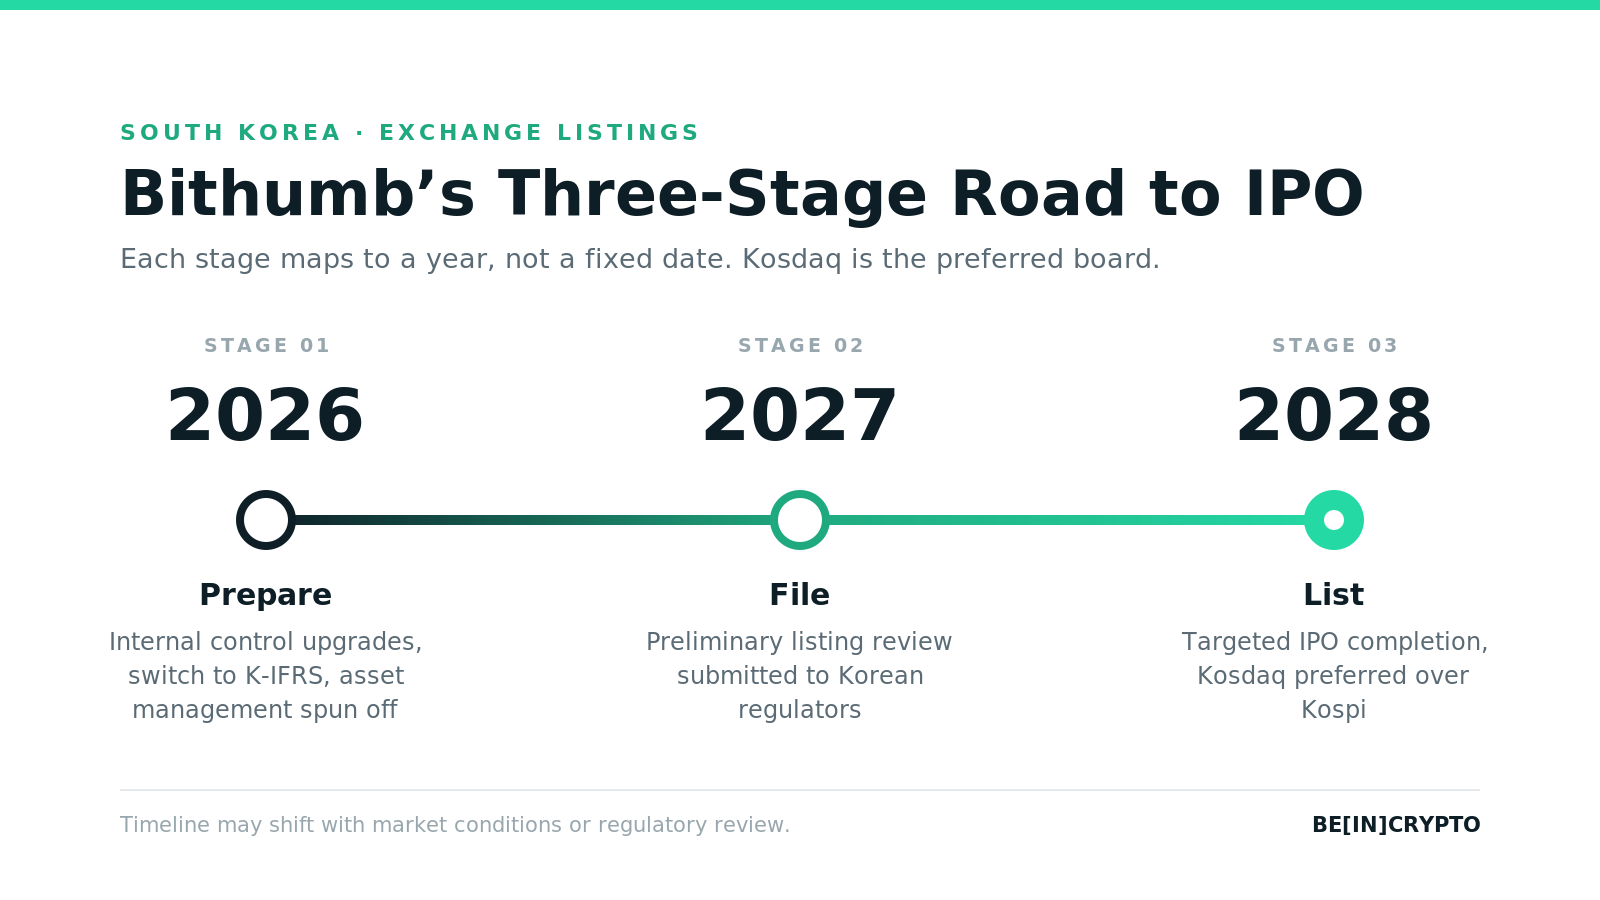
Bithumb has published a formal Bithumb IPO timeline. The plan targets a public listing by 2028.
South Korea’s second-largest exchange framed the listing as a trust-building step. Executives tied each phase to a specific governance target.
A Roadmap Shaped by Past Delays
Bithumb’s listing ambitions have shifted before. The exchange once targeted a debut in the second half of 2025. Management pushed that date back as new obligations piled up.
Shareholders backed CEO Lee Jae-won’s reappointment in March 2026. The vote came weeks after a Bitcoin (BTC) balance-display glitch drew a record fine.
The exchange also operates in a tougher home market. South Korean trading volume recently fell to a two-year low during a Kosdaq market crash. A new 22 percent crypto tax takes effect in 2027. That is the same year Bithumb plans to file its listing review.
The Bithumb IPO Timeline, Stage by Stage
The Bithumb IPO timeline runs in three stages. Each stage maps to a single year rather than a fixed date. Stage one covers 2026. It focuses on internal control upgrades and a shift from domestic accounting rules to the global K-IFRS standard.
Bithumb has also restructured internally, spinning off its asset management unit as a separate entity, Bithumb Asset. The company said the split separates responsibilities and reduces potential conflicts of interest ahead of a listing review.
Stage two opens in 2027. Bithumb plans to file for a preliminary listing review with Korean regulators that year. Stage three targets IPO completion in 2028. However, the notice cautions that the schedule could shift with market conditions or regulatory review timelines.
The exchange has indicated a preference for South Korea’s Kosdaq board. A listing on the larger Kospi market remains possible if conditions change.

The notice also spelled out promises to customers. Bithumb pledged a more transparent governance structure and stronger internal controls.
It also promised better investor protection, more frequent information disclosure, and a sustainable growth foundation as it moves toward institutional-level, global-standard management. The company said these steps aim to show it can operate like a listed company well before shares actually trade.
The plan lands as Japan and South Korea explore a broader digital asset framework. That regulatory shift could smooth Bithumb’s path toward institutional-grade compliance.
Meanwhile, the exchange keeps growing its trading business. Upbit and Bithumb listings sent one small-cap token up nearly 30% in July. That activity shows daily operations continuing alongside the listing push.
Whether Bithumb reaches 2028 on schedule may depend on more than internal readiness. It will also hinge on how regulators respond to a shrinking, more heavily taxed market in the years ahead.
The post Bithumb Lays Out a 3-Stage Path to Its South Korea IPO appeared first on BeInCrypto.
MicroStrategy added 37 bitcoin between May 26 and July 26. Last week it sold 1,638 in seven days. The company now holds less Bitcoin (BTC) than it did in spring.
Michael Saylor says Strategy expects to stay a net buyer. Its own filings show the buying stopped months ago.
The Stack Is Going Backwards
Strategy reported 843,738 BTC on May 26. Two months later, on July 26, it reported 843,775. That is a gain of 37 coins.
Then came Monday’s filing. It shows 842,138 BTC as of August 2.
The company is now 1,600 coins below where it stood in May. Ten weeks have passed with no net buying at all.
Saylor addressed the question directly on August 1, when he shut down a viral sale claim.
“We have never had a “never sell” policy. The program does not require any BTC sale, and we expect to remain a net buyer of Bitcoin over time,” the MicroStrategy chair stated.
Follow us on X to get the latest news as it happens
A $400 Million Dividend Bill
The MicroStrategy Bitcoin sale last week was not opportunistic. It paid a bill.
Strategy owes cash to holders of its preferred shares. Those pay a fixed dividend every quarter.
That cost reached $400.7 million in the second quarter. A year earlier it was $49.1 million. The bill is more than eight times larger.
Dividends and interest now run roughly $1.76 billion a year.
So the coins go out the door. Strategy sold $218.4 million of bitcoin this year through July 26. Last week added $104.7 million more.
Almost a third of the year’s selling happened in that one week.
Selling at a Loss to Buy at a Discount
Here is the trade. Strategy sold bitcoin at $63,957 a coin. Its average cost is $75,419. That is a loss of about $11,500 each.
It used half that cash to buy back 912,143 STRC shares. STRC is a Bitcoin-backed preferred share that pays 12% a year.
Each share is meant to be worth $100. Strategy paid $89.02.
So the company took a loss on bitcoin to capture an 11% discount on its own debt-like shares. Every share retired cuts the dividend bill for good.
It also sold 3,011,361 of its own ordinary shares, raising $290.6 million. Meanwhile a $1 billion approval to buy those shares back sits unused. That is the trade-off MSTR investors face.
“Strategy is evolving from one-way capital issuance to active capital management,” Phong Le, president and chief executive of Strategy, in the June 29 release
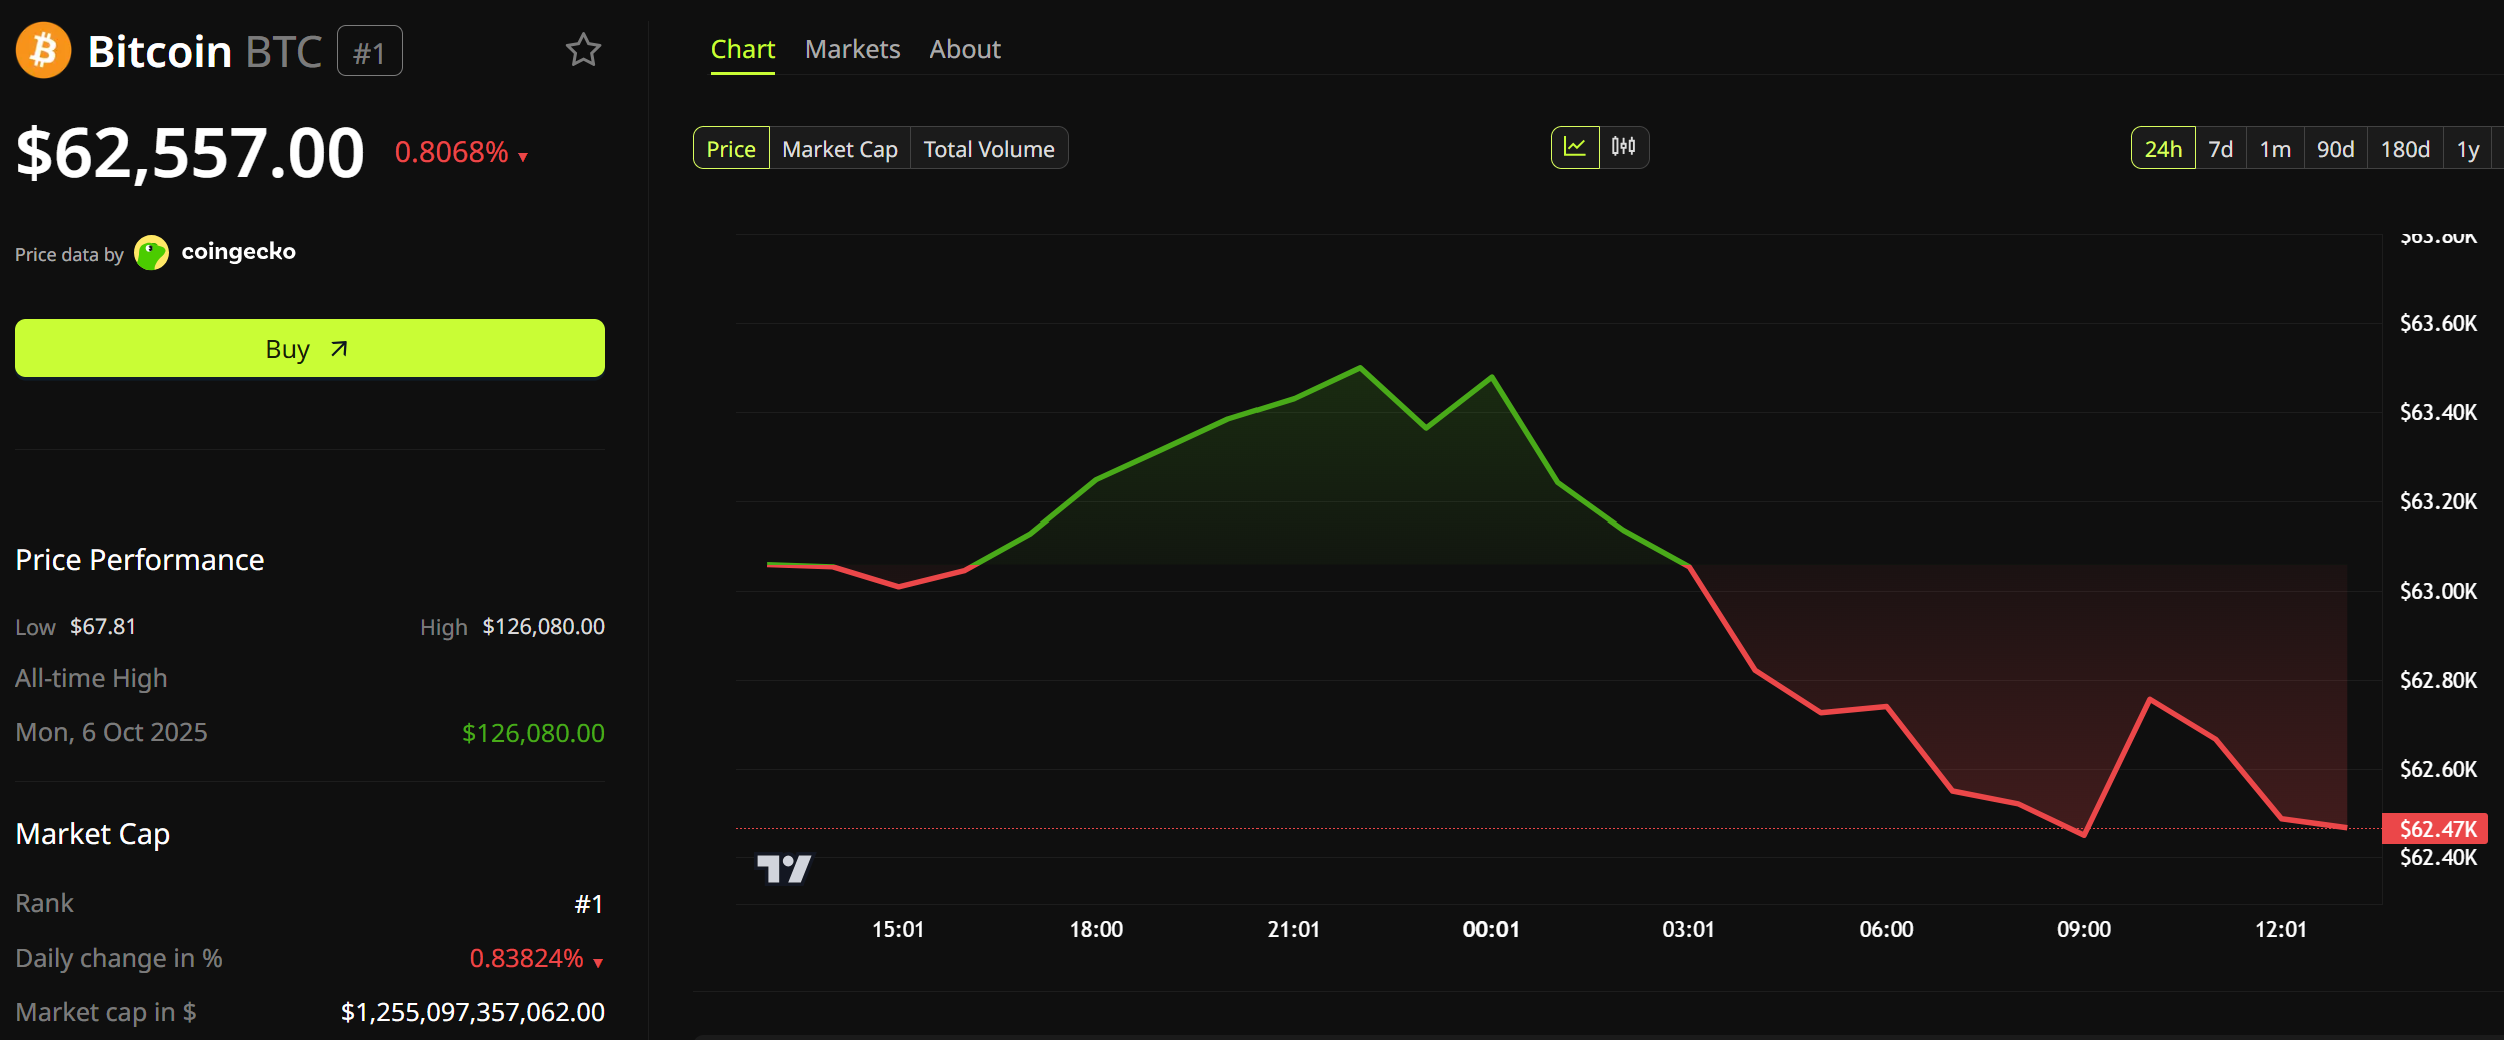
Bitcoin trades near $62,468, roughly half its October record. Strategy still owns more of it than any other company.

But the direction has changed. The next filing lands in a week.
The post MicroStrategy Added 37 Bitcoin in Two Months. Then It Sold 1,638 in One Week appeared first on BeInCrypto.
Michael Saylor’s Strategy sold 1,638 Bitcoin between July 27 and August 2, marking the year’s second-largest Bitcoin sale for the company.
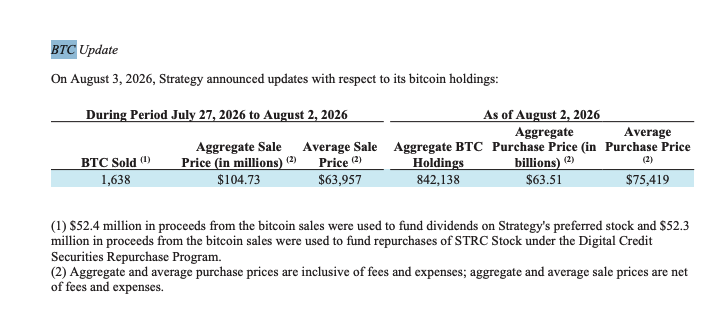
Strategy sold 1,638 Bitcoin (BTC) at an average price of $63,957 for a total of $104.7 million, according to a Monday 8-K filing with the Securities and Exchange Commission. Of the proceeds, $52.4 million was used to fund dividend payments on Strategy’s STRC preferred stock, while another $52.3 million was used to repurchase STRC.
The company now holds 842,138 Bitcoin bought at an aggregate cost of $63.5 billion.
Strategy sold 3,588 Bitcoin for about $216 million on July 6. It also disclosed the sale of 32 Bitcoin in early June, its first reported Bitcoin sale since the 2022 tax-loss transaction.
Strategy bolsters USD reserve to $4 billion, repurchases STRC stock
Strategy also reported selling $290 million in MSTR shares during the same period. About $250 million of the proceeds was used to increase the USD Reserve to $4 billion, $28.9 million to fund additional repurchases of STRC stock and $11.7 million was added to Strategy’s cash balance.
In total, Strategy repurchased $81 million worth of STRC stock and increased its USD runway by 57 days to 2.3 years, announced Strategy founder and chairman Michael Saylor in a Monday X post.
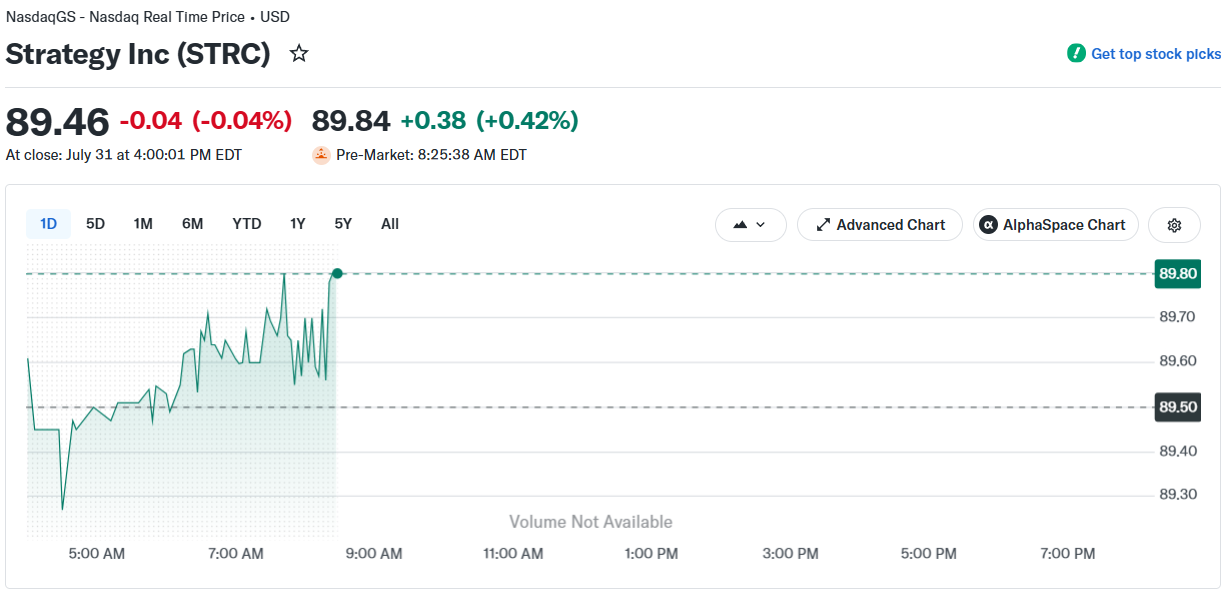
Strategy’s perpetual preferred stock, STRC, traded at $89.4, or 10.6% below its $100 intended par value, during Monday’s pre-market trading session, Yahoo Finance data shows. The company’s MSTR stock also declined 0.9% in pre-market trading on Monday.
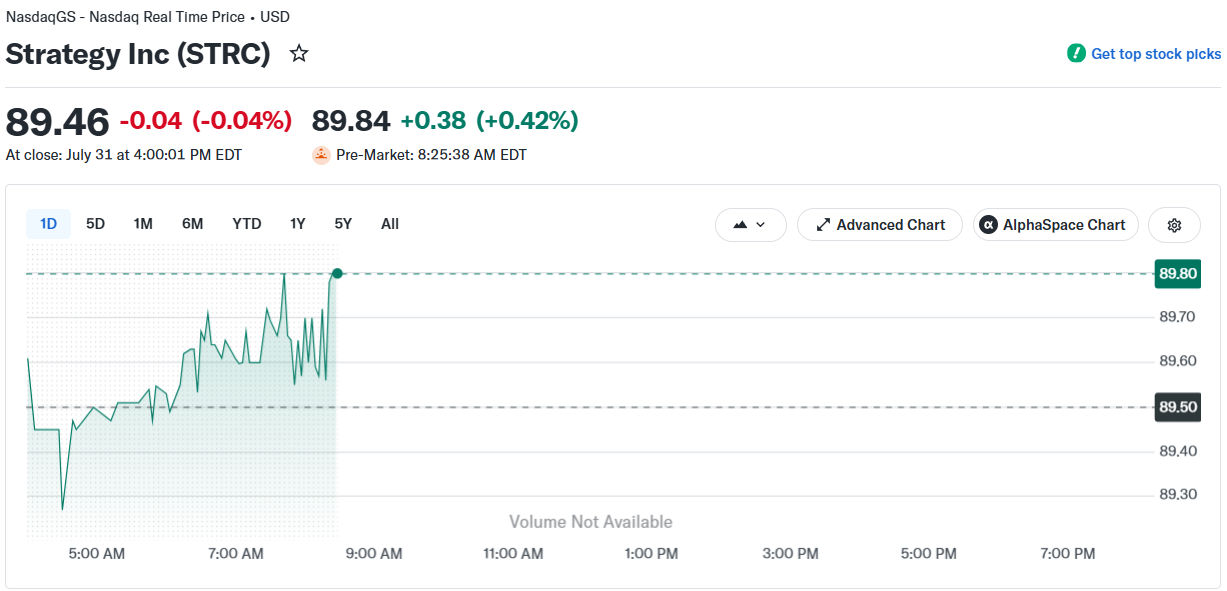
STRC stock price, 1-day chart. Source: Yahoo Finance
STRC is one of Strategy’s main mechanisms to fund its Bitcoin accumulation. Trading below par limits Strategy’s ability to raise funds through STRC sales. It may also force the company to further increase its nominal dividend rate to attract buyers and protect STRC’s price.
Related: CLARITY Act failure could send crypto valuations lower: Bernstein
On June 24, CryptoQuant CEO Ki Young Ju said that Strategy should pause Bitcoin purchases and replenish its cash reserve, after the company’s dividend coverage fell to 14 months from seven years.
“They should pause Bitcoin purchases, rebuild cash reserves, and adopt a systematic framework for purchase timing,” wrote Ju in a June 24 X post.
In its June 29 8-K filing, Strategy unveiled a capital framework allowing Bitcoin sales to fund dividends, increased the annual dividend rate on its STRC preferred stock to 12%, and disclosed that its US dollar reserve had grown to $2.55 billion.
Magazine: Bitcoin adoption metrics say one thing, price action says another
Strategy has increased its US dollar reserve and expanded its preferred-stock repurchases. The otherwise Bitcoin-focused company is moving to strengthen its balance sheet.
The firm added $250 million to its cash reserve, bringing the total to $4 billion. It also repurchased approximately $81 million worth of its Variable Rate Series A Perpetual Stretch Preferred Stock (STRC).
Strategy increased its USD Reserve by $250M and repurchased $81M of $STRC. This increased USD Duration by 57 days to 2.3 years and tightened STRC’s BTC Credit by 5 bps. As of 8/2/26, we hold ₿842,138 in our BTC Reserve and $4.0B in our USD Reserve. $MSTR https://t.co/t7bGZJ8Q3o
— Michael Saylor (@saylor) August 3, 2026
The transaction builds on the firm’s recently introduced Digital Credit Capital Framework. The company intends to use its dollar reserve primarily to cover preferred-stock dividends and debt interest, reducing the need to sell Bitcoin during periods of market stress.
What Saylor failed to mention in the tweet was that the firm also sold some 1,638 BTC for approximately $105 million between July 27 and August 2 at an average price of $63,957 – according to the official filing.
The post Strategy Sold Over $100 Million in Bitcoin, Buys Back More STRC appeared first on CryptoPotato.
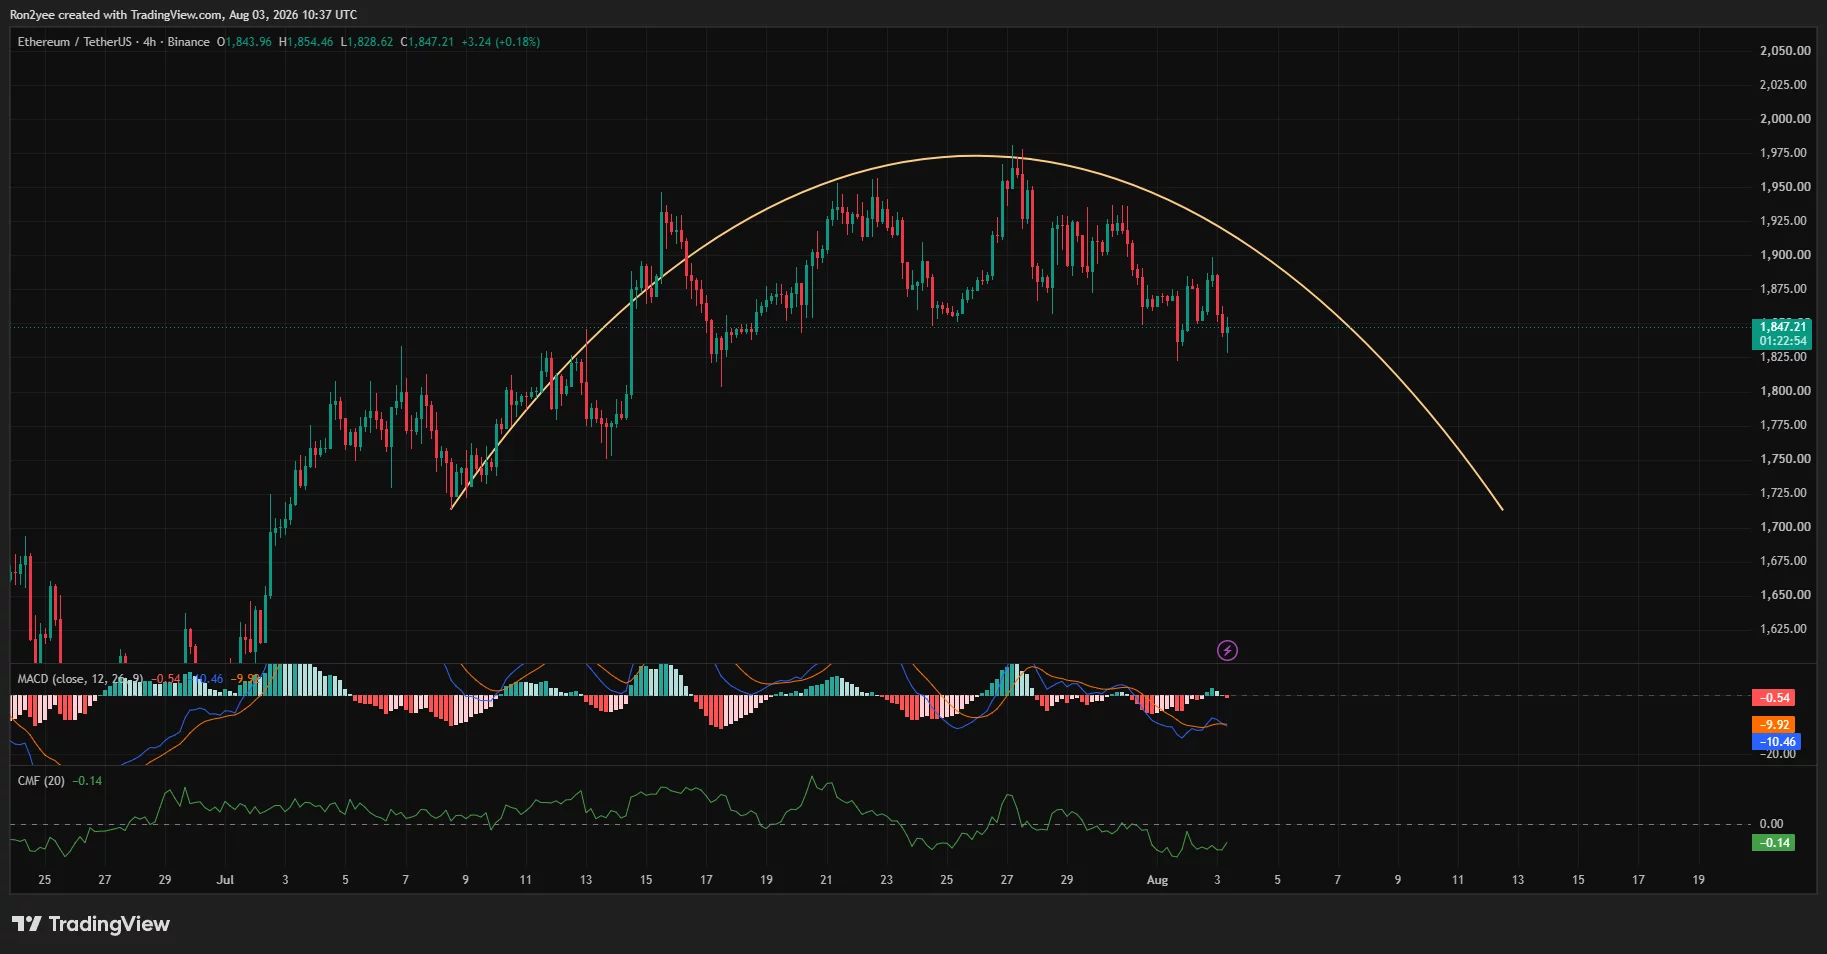
Ethereum price fell 2% to around $1,847 on Aug. 3 after another rejection near key moving averages left the $1,800 support zone exposed.
Summary
- Ethereum price fell 2.04%, reaching an intraday low of $1,828.
- ETH remains below its 50-day and 100-day moving averages at $1,889 and $1,927.
- 4-hour MACD and Chaikin Money Flow readings show weak momentum and continued selling pressure.
- A break below $1,800 could bring $1,785 and $1,700 into focus.
ETH slides after failing to reclaim $1,900
According to data from crypto.news, Ethereum (ETH) price traded at $1,847 at the time of writing, down 2.04% over the previous 24 hours. The token moved between an intraday high of $1,886 and a low of $1,829 on Binance.
The decline extended ETH’s retreat from its July 27 high near $1,975. Buyers have now failed several times to sustain a move above the resistance zone between $1,950 and $1,975.
ETH briefly rebounded after touching $1,828, but the recovery stalled around $1,850. That left the token near the lower end of its recent trading range and inside the closely watched $1,800–$1,850 support area.
The broader daily structure also remains defensive. Ethereum trades below its 50-day simple moving average at $1,889, its 100-day SMA at $1,927, and its 200-day SMA at $2,089.
Weak liquidity deepens Ethereum’s sell-off
The immediate pressure came from Ethereum’s failure to reclaim the moving-average resistance between $1,889 and $1,927. Sellers entered after the latest attempt faded, pushing ETH below $1,850 and toward its Aug. 3 low.
The 4-hour chart shows the price rolling over after forming a broad curved top below $1,975. Lower highs since late July suggest that buying demand has weakened, although ETH must still break below $1,800 to confirm a larger bearish continuation.
Momentum indicators support the cautious outlook. The 4-hour Moving Average Convergence Divergence remains below zero, with the MACD line near -10.46 and the signal line at about -9.92.
Chaikin Money Flow stands at -0.14. The negative reading indicates that selling volume has outweighed buying volume over the indicator’s measurement period.
Ethereum also faces broader liquidity pressure. A sharp weekly decline in Binance stablecoin netflows suggests less immediately available capital is entering the exchange, potentially reducing the buy-side liquidity available during market declines. However, exchange flows can change quickly and do not determine price direction alone.
Longer-term concerns include weaker institutional demand for Ethereum products relative to Bitcoin and lower mainnet fee revenue as activity shifts toward Layer-2 networks. These factors have weakened Ethereum’s investment narrative, but the current move remains primarily tied to the chart rejection and wider risk-off positioning.
Losing $1,800 could expose ETH to $1,700
The first support range sits between $1,828 and $1,800. ETH has already attracted buyers near the upper part of that zone, but repeated tests could weaken the remaining demand.
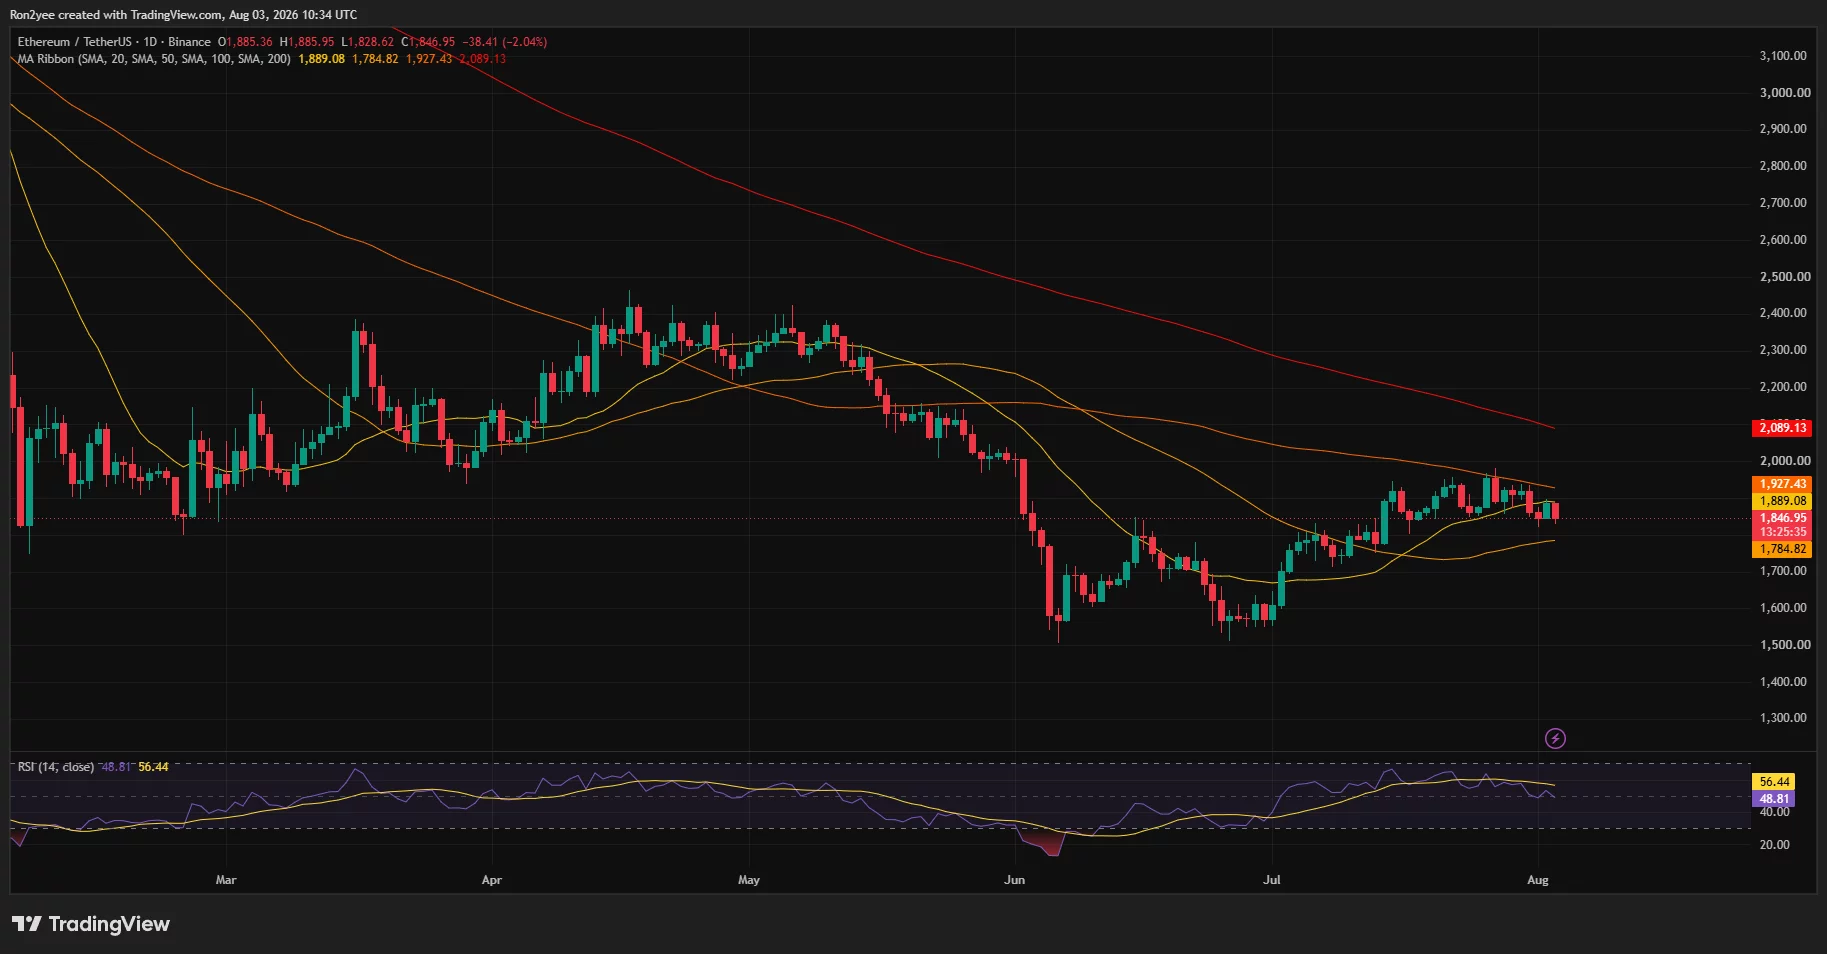
Ethereum’s lower daily moving-average ribbon stands near $1,785. A daily close below that level would strengthen the bearish setup and expose $1,700, followed by the June accumulation region around $1,550–$1,600.
CoinGlass’ 24-hour liquidation heatmap shows nearby leveraged-position clusters around $1,840, $1,820 and $1,810. A move through those levels could liquidate leveraged long positions and accelerate short-term volatility.
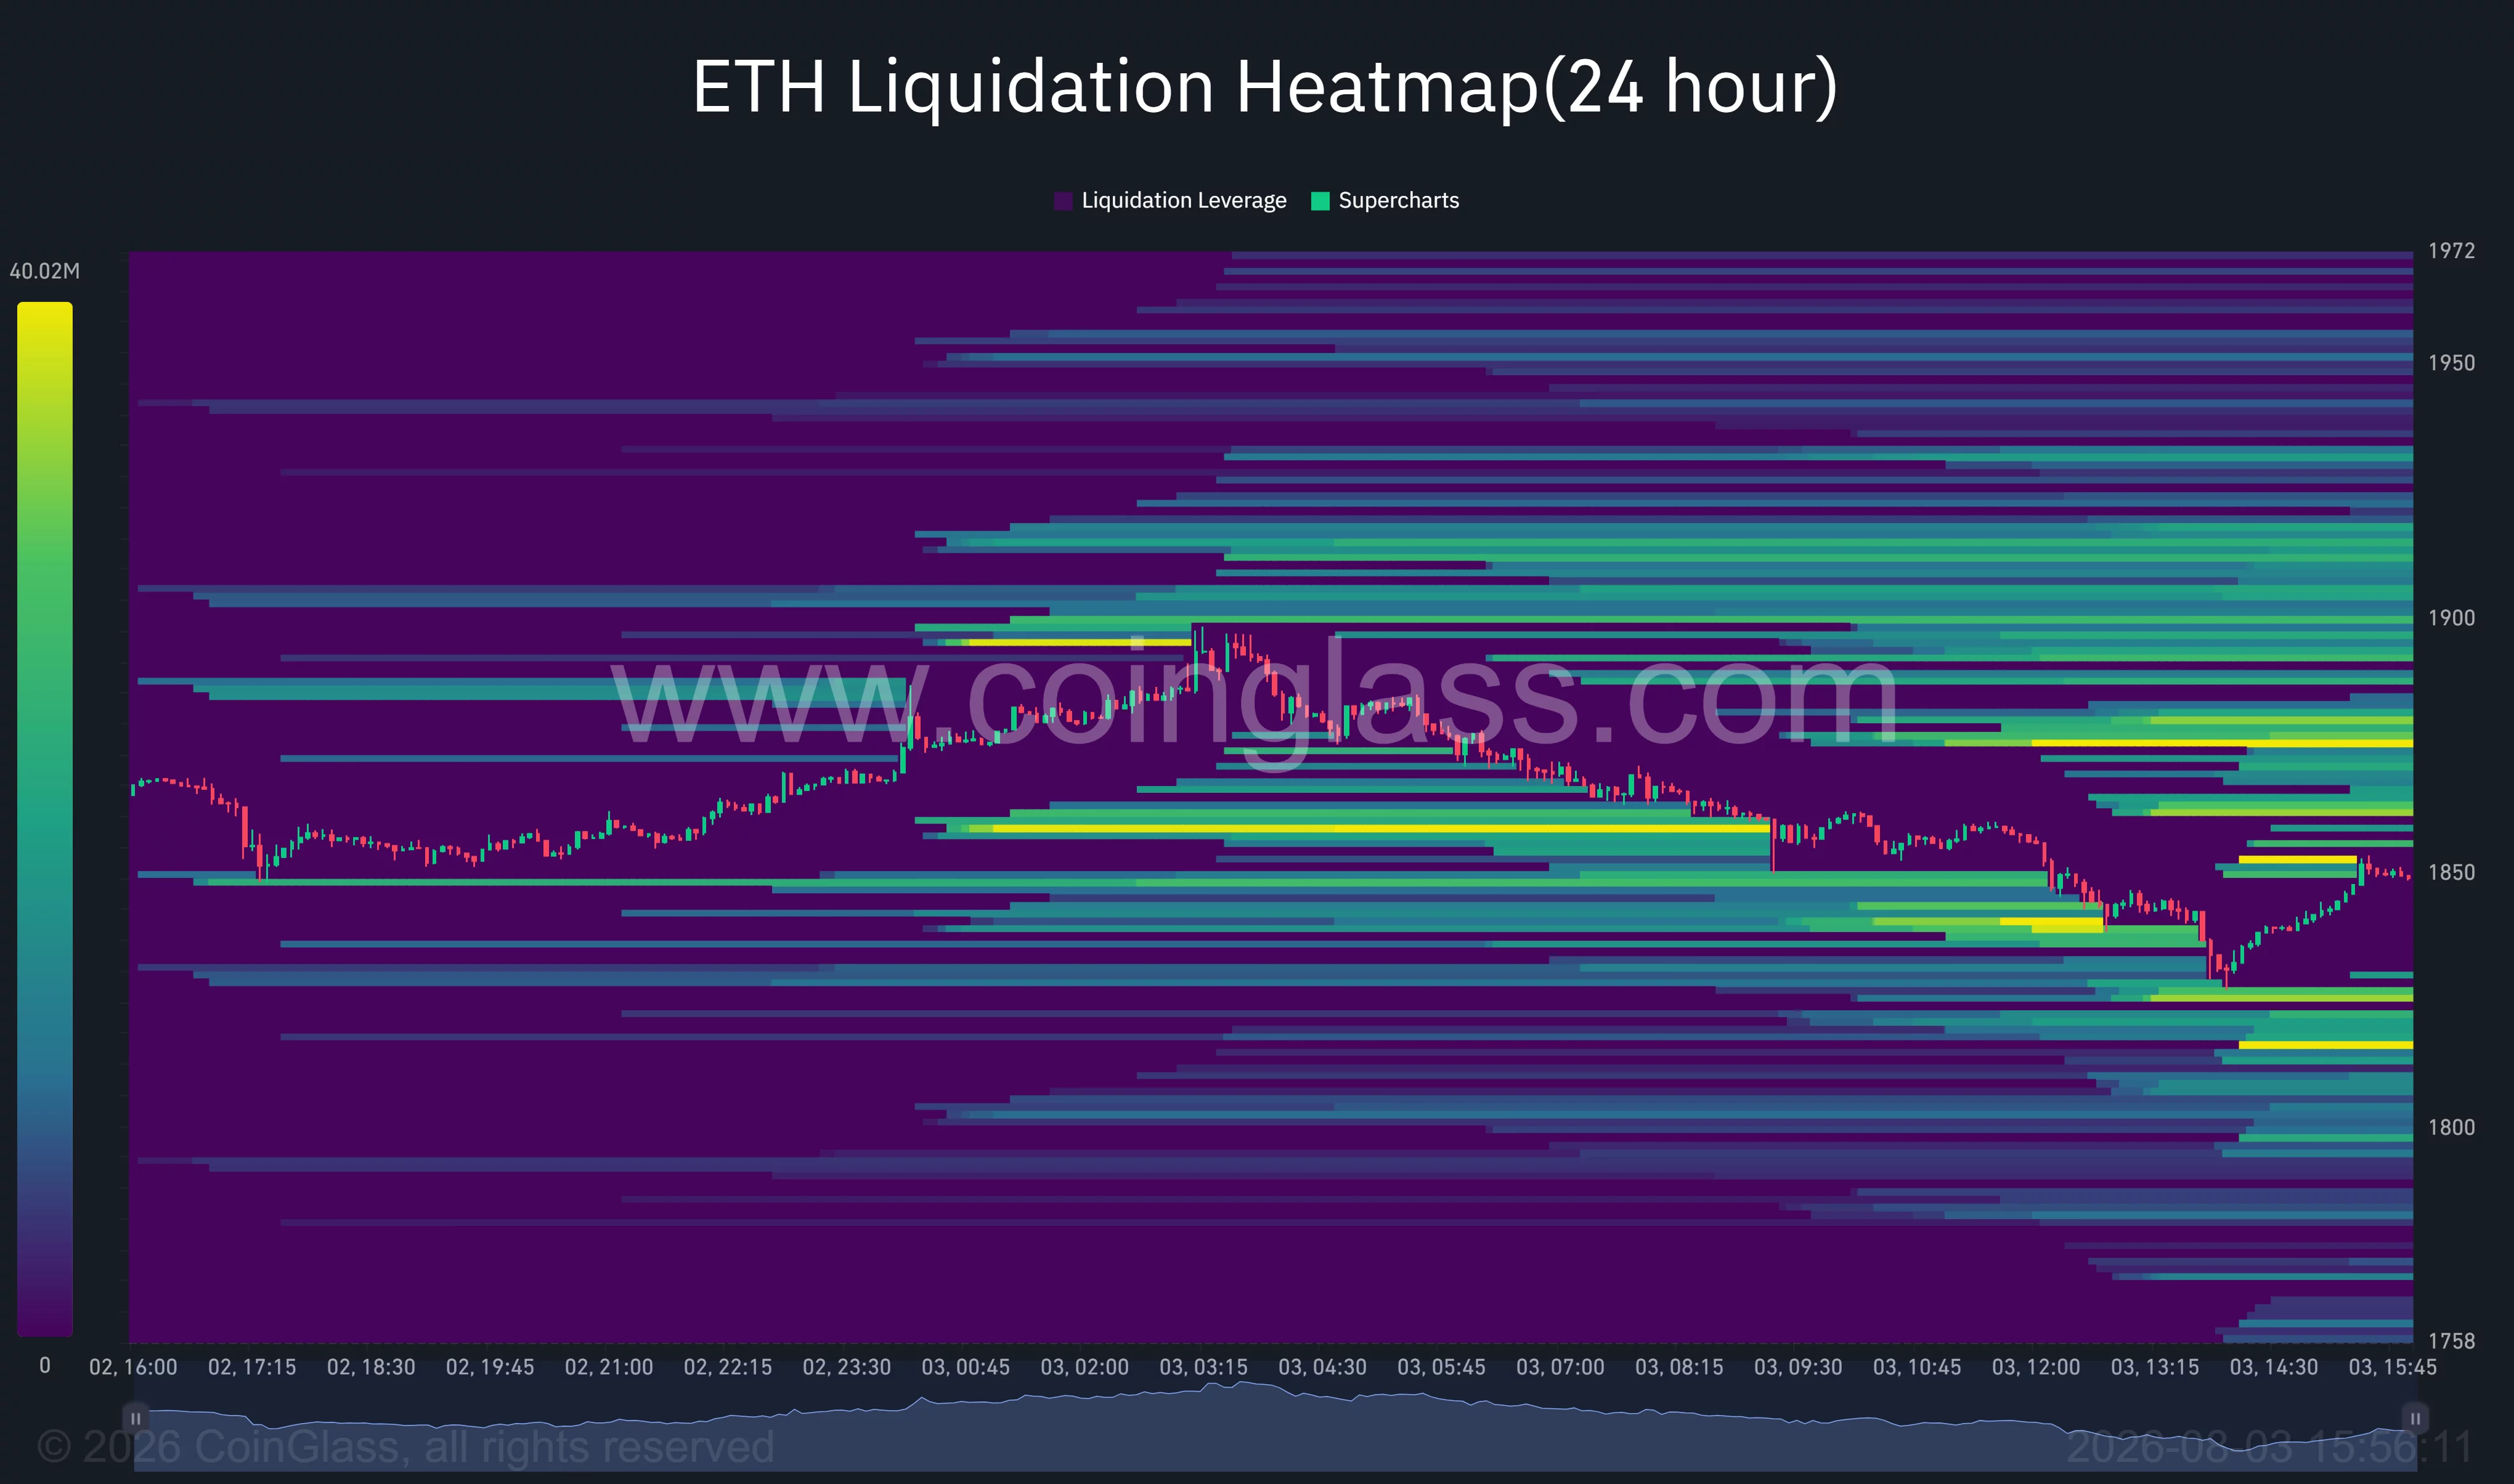
The map also shows overhead liquidity around $1,860–$1,875. If ETH rebounds above that range, short liquidations could help drive the price toward $1,890 and $1,920.
On the upside, Ethereum must first reclaim its 50-day SMA at $1,889. A daily close above the 100-day SMA at $1,927 would improve the setup, while a breakout above $1,975 would invalidate the current sequence of lower highs and place $2,000 back in focus.
The daily Relative Strength Index stands at 48.81, below its signal average of 56.44. The reading points to weakening momentum but remains well above oversold territory, leaving room for further selling if $1,800 fails.
Analyst sees Ethereum at a critical support zone
Crypto analyst Ted Pillows described the current support range as decisive for Ethereum’s next move.
“ETH is currently in the $1,800–$1,850 support level,” Pillows said. “This is very crucial for Ethereum to hold, or else it could drop towards $1,700.”
His chart presents two potential paths. Holding the current zone could allow ETH to recover toward $1,950 and then $2,050, while a confirmed breakdown could send the price toward $1,700.
The forecast aligns with the support levels visible on the daily chart, but the $1,700 target would require ETH to lose both the psychological $1,800 level and support near $1,785.
Fed outlook adds pressure on US crypto investors
Changing expectations for US monetary policy remain an additional risk for Ethereum and other speculative assets. Higher Treasury yields and a stronger dollar can reduce investor demand for crypto by increasing the relative appeal of dollar-denominated assets.
Slower-than-expected Federal Reserve rate cuts would keep financial conditions tighter and could limit institutional risk-taking. Ethereum may therefore remain sensitive to upcoming US inflation, employment and Fed policy signals.
For US investors, the near-term setup depends on whether ETH can defend $1,800 as macro liquidity remains constrained. A recovery above $1,927 would improve the technical outlook, but a daily close below $1,785 would shift attention toward $1,700.
Disclosure: This article does not represent investment advice. The content and materials featured on this page are for educational purposes only.
Solana price slipped below $73 on Aug. 3 as weak spot demand and sustained capital outflows raised the risk of a drop toward $70.
Summary
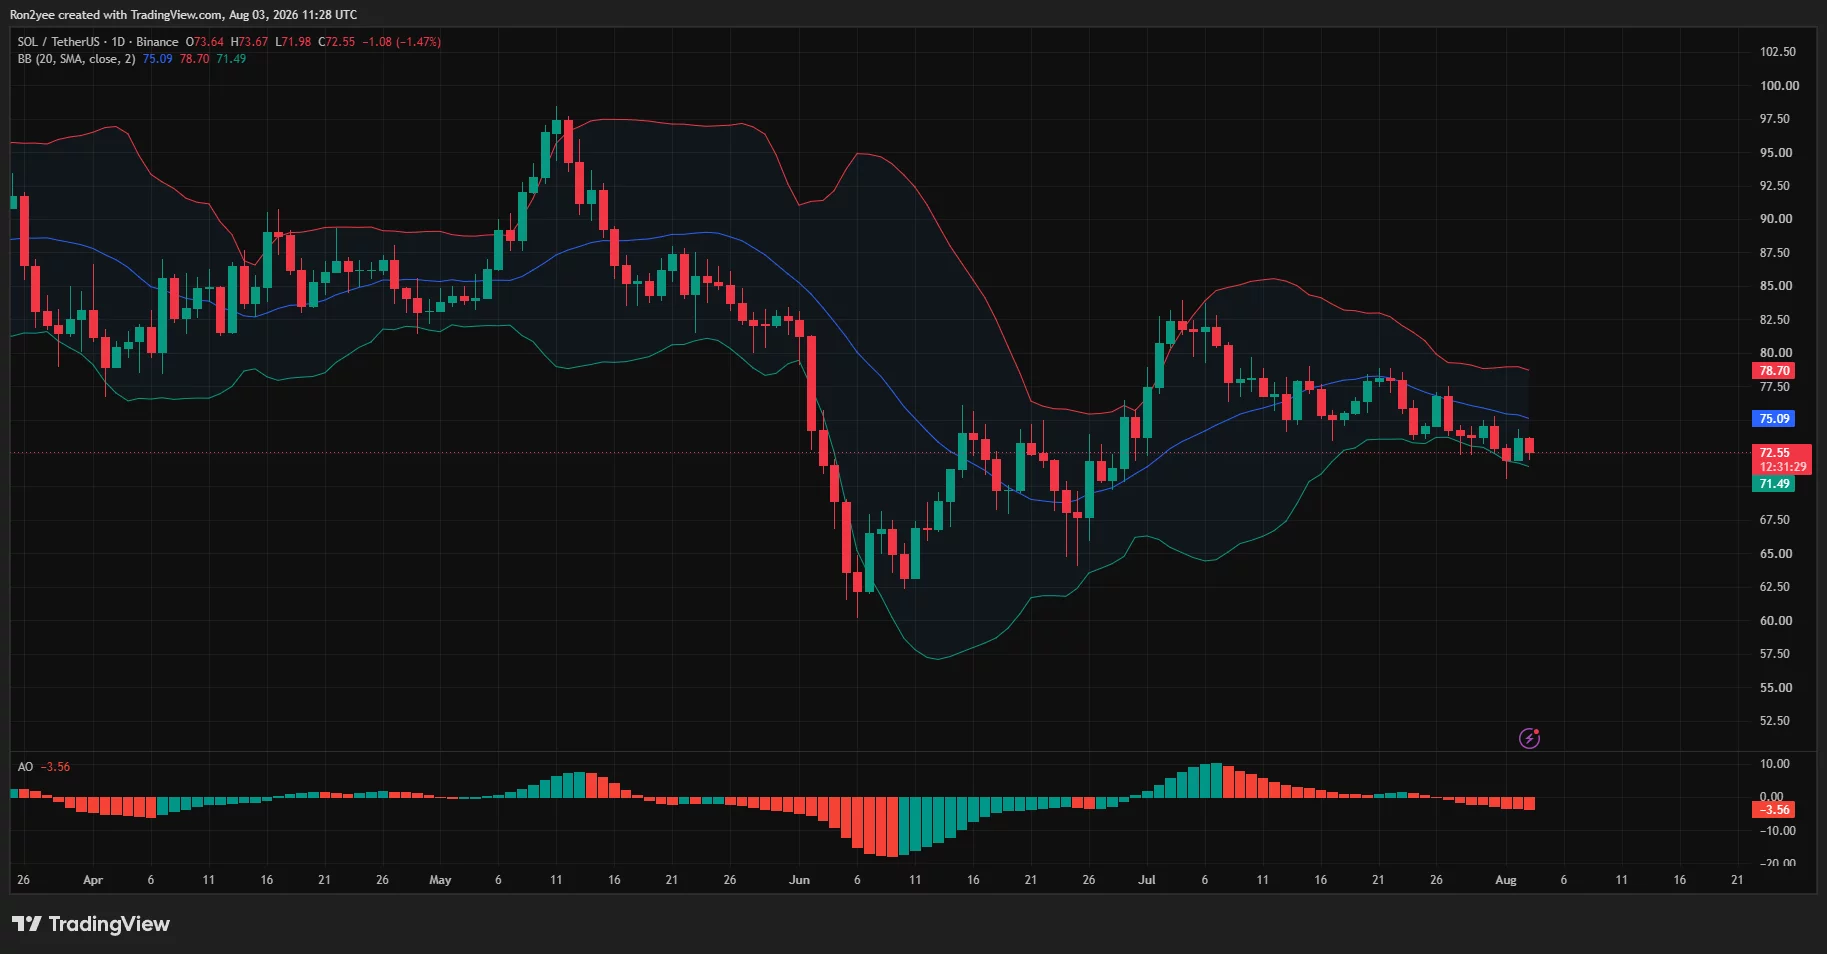
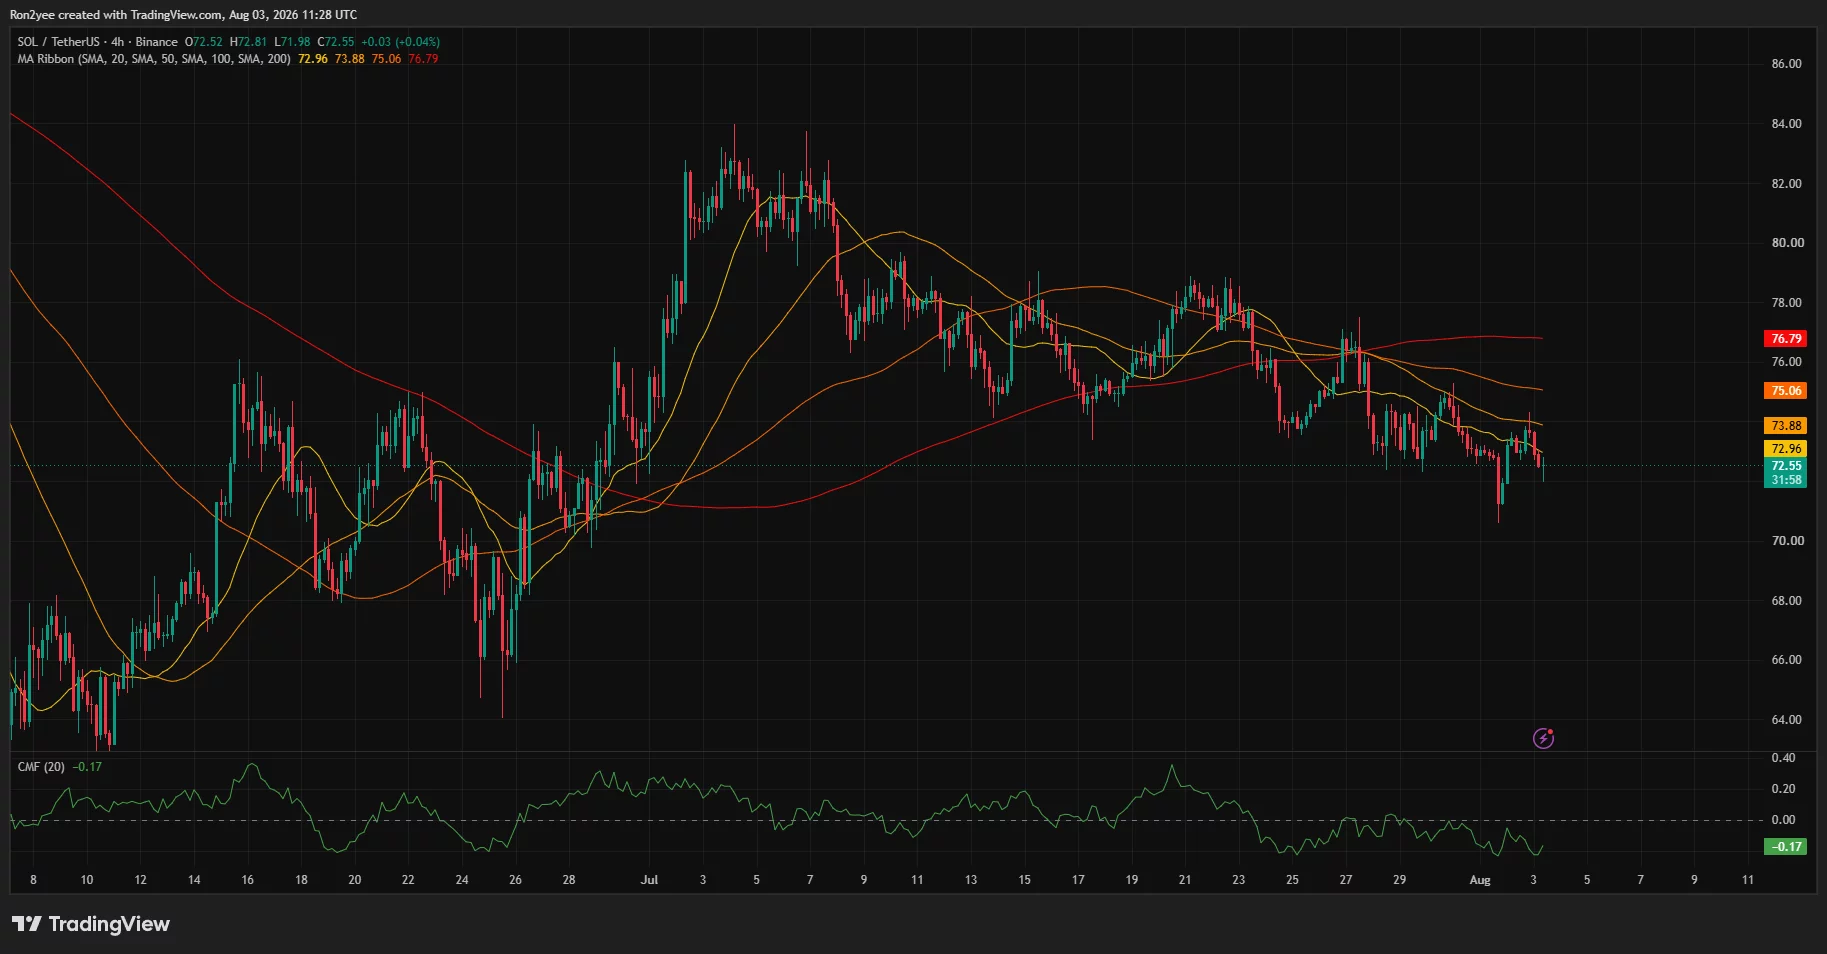
- Solana price fell 1.47% to $72.55, placing the token near its daily lower Bollinger Band.
- The 4-hour chart shows SOL below all four tracked moving averages, with the 200-period SMA at $76.79.
- Chaikin Money Flow dropped to -0.17, indicating that selling pressure continued to outweigh buying demand.
- Liquidation liquidity is concentrated near $73.50–$74.50, making that zone the first major upside test.
Solana price extends its decline below $73
According to data from crypto.news, Solana (SOL) price traded at $72.55 on Aug. 3, down 1.47% on the daily chart after moving between an intraday high of $73.67 and a low of $71.98.
The decline extended a broader pullback from the July high near $82.50. SOL has formed a sequence of lower highs since that peak, with sellers defending rebounds around $78 and then $76.
Price has now fallen below the daily Bollinger Band midpoint at $75.09. This level previously acted as support but has turned into the first major resistance area.
SOL briefly moved below the lower Bollinger Band at $71.49 before recovering above $72. That reaction shows buyers remain active around $71.50–$72, but the limited rebound suggests they have not regained control.
The Awesome Oscillator stood at -3.56, with its red bars expanding below zero. That reading points to strengthening bearish momentum on the daily timeframe rather than an immediate trend reversal.
Flat spot demand weakens SOL’s recovery
Solana attempted to rebound after falling toward $71 on Aug. 2, but spot demand failed to recover alongside price.
Analyst Ted Pillows described the divergence as a sign of weakness.
“$SOL is bouncing back. But spot demand is flat. Sign of weakness.”
The 4-hour Chaikin Money Flow reading supports that view. CMF fell to -0.17, meaning more capital was leaving SOL than entering it during the measured period.
Declining spot participation can leave a rebound dependent on leveraged derivatives positions. Such moves are more vulnerable to reversals because they lack the direct buying pressure needed to absorb new selling.
The weakness also comes as activity tied to speculative Solana tokens cools from previous peaks. Lower decentralized exchange activity and weaker fee generation would reduce one source of demand for SOL, which traders need to pay network fees and interact with on-chain applications.
Four-hour indicators keep sellers in control
Solana remains below every major moving average displayed on the 4-hour chart. The 20-period SMA stands at $72.96, followed by the 50-period SMA at $73.88 and the 100-period SMA at $75.06.
The 200-period SMA, currently near $76.79, represents the strongest overhead technical barrier. SOL would need to reclaim that level to weaken the current sequence of lower highs.
The moving averages are also bearishly ordered, with each shorter-term average sitting below the longer-term measures. That structure suggests the decline is established across several trading horizons.
A move above $72.96 could open a retest of $73.88. The $73.88–$75.06 range is particularly important because it combines two moving averages with liquidity visible on the three-day liquidation heatmap.
Failure to reclaim that area would leave SOL exposed to another test of $71.50. A daily close below the lower Bollinger Band could bring $70 into focus, followed by the June support region near $67.50.
Liquidation clusters could increase volatility
CoinGlass’ three-day liquidation heatmap shows the largest nearby concentration of leveraged positions above the current price, particularly around $73.50–$74.
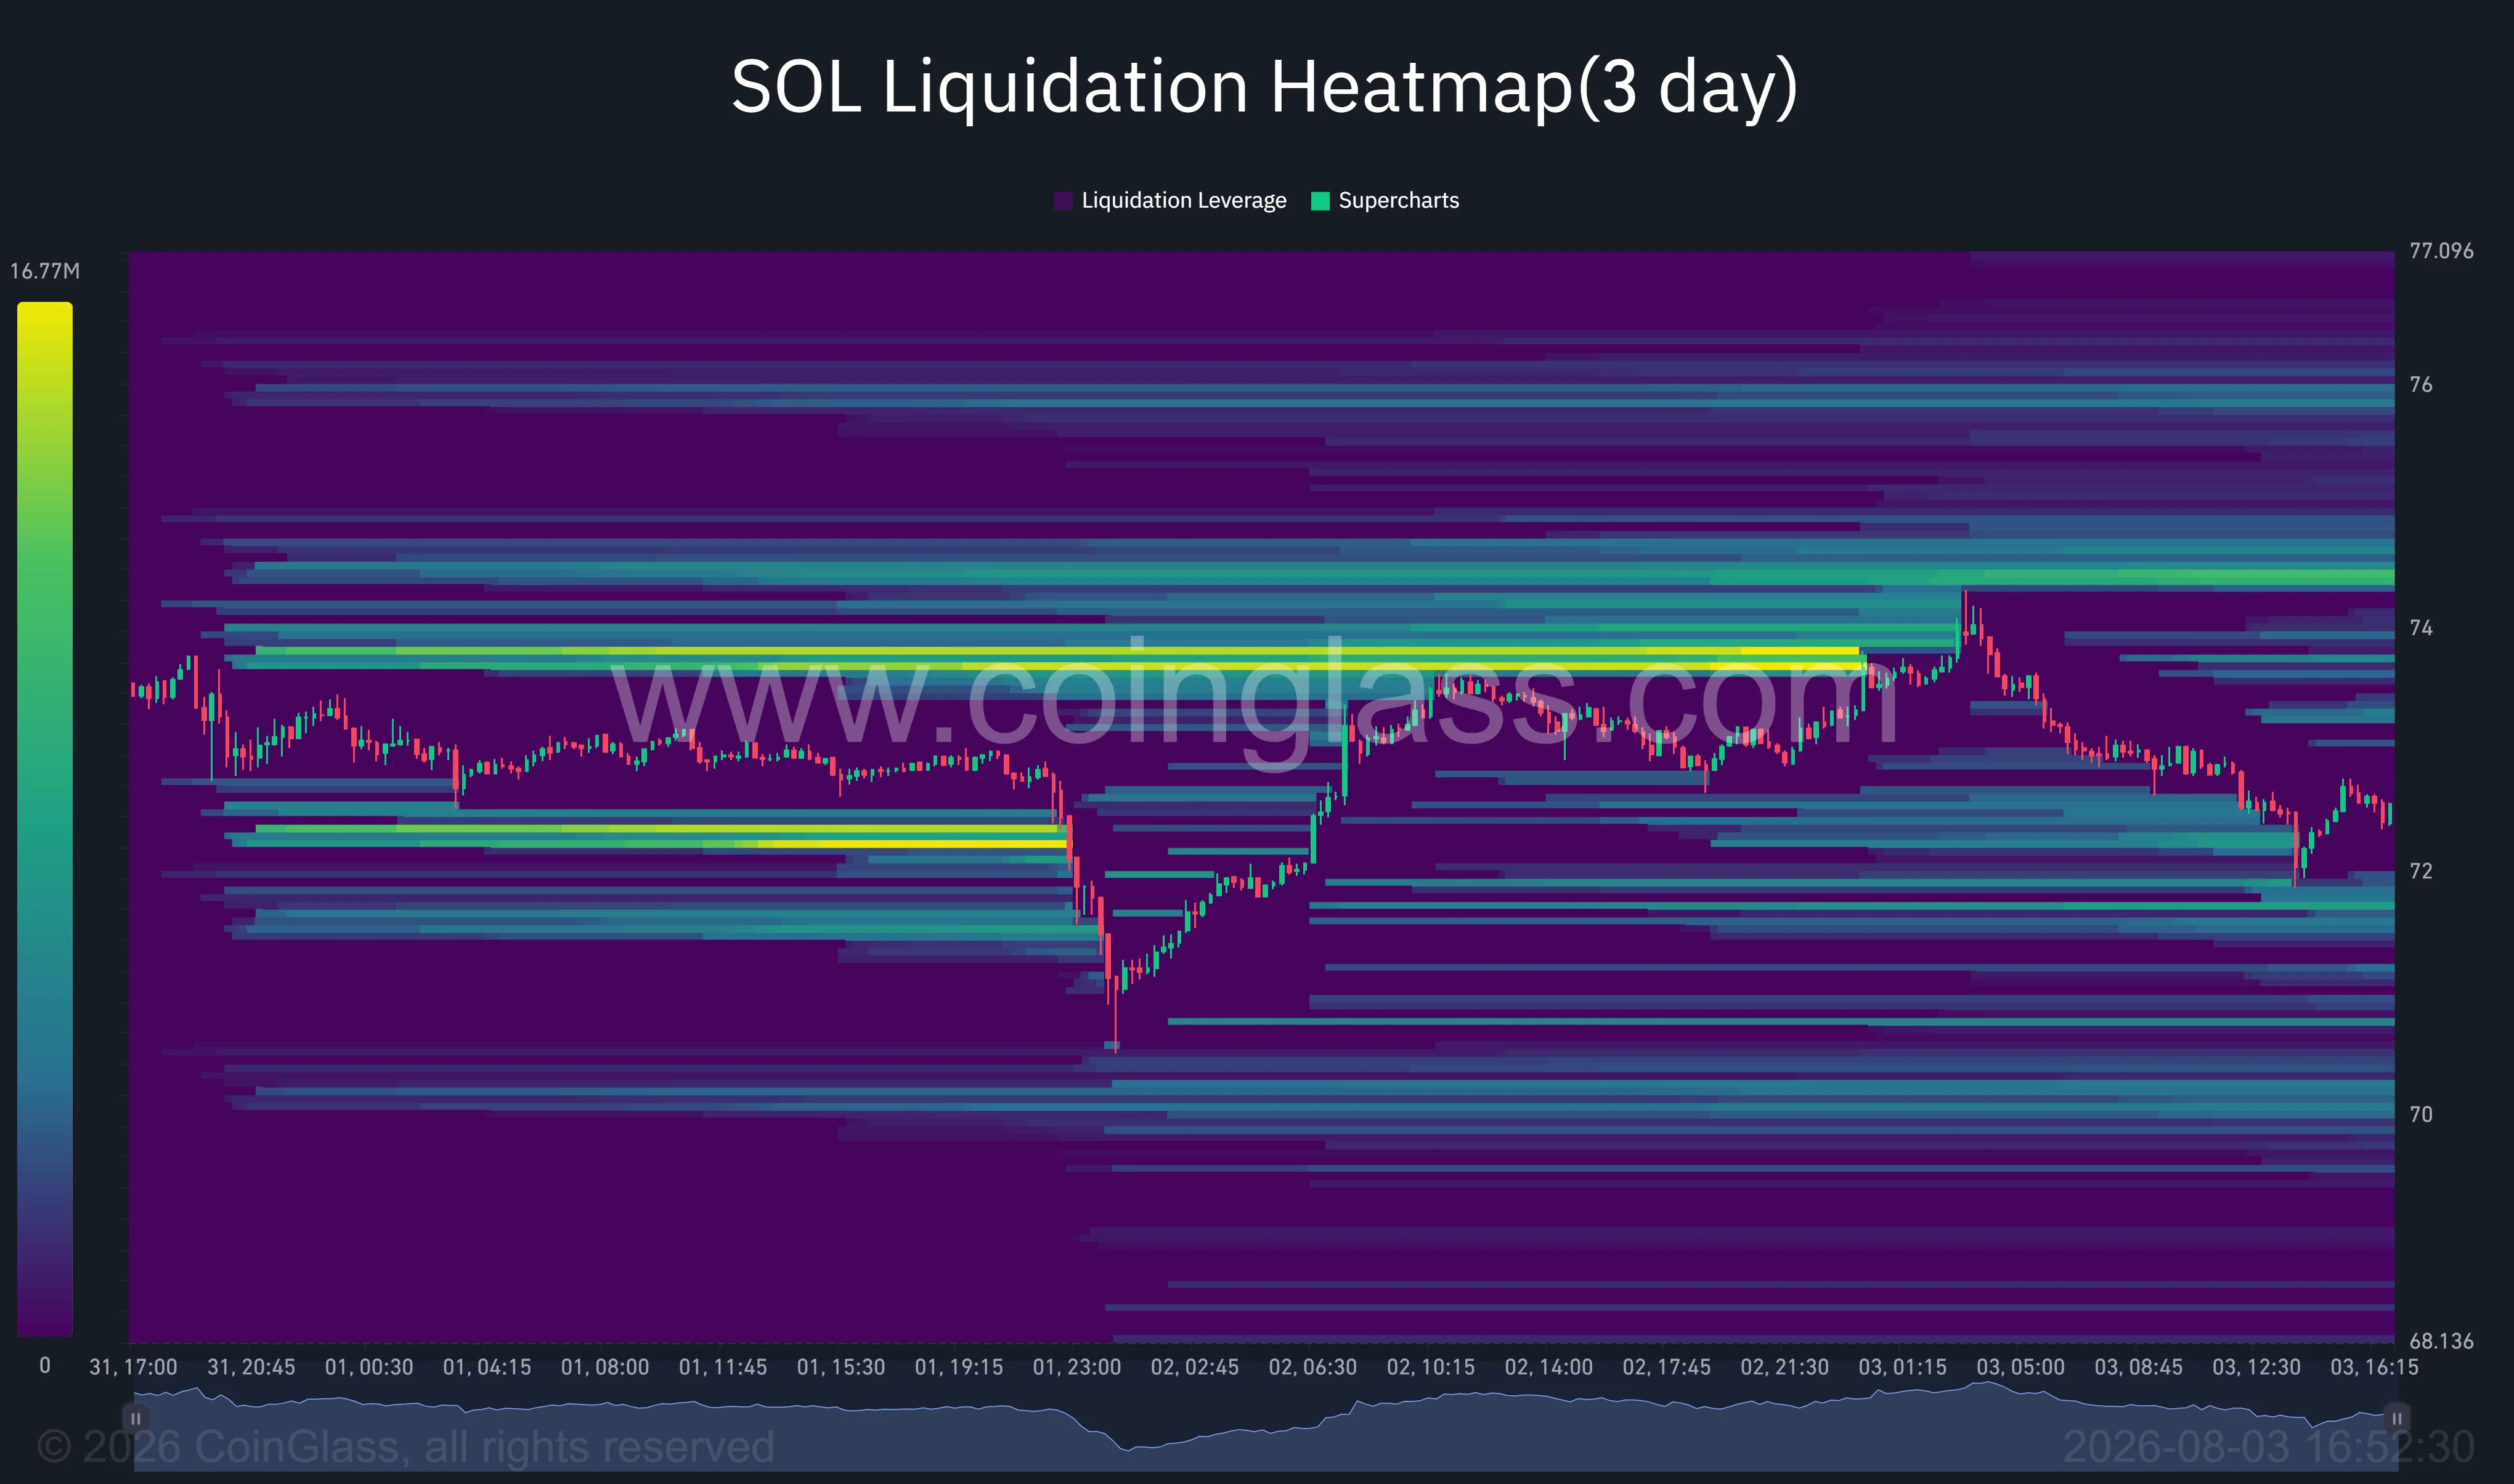
Additional liquidity appears near $74.50 and $76, creating potential targets if SOL begins a short-covering rebound. A move into these clusters could force bearish traders to close positions, accelerating the recovery.
However, liquidity also appears below the market around $71.50 and $70. These clusters could attract price if support near $72 fails.
This leaves SOL between competing liquidity zones. The closer upside concentration could produce a short-term bounce, but the weak CMF reading and bearish moving-average structure suggest any recovery must be confirmed by stronger spot buying.
Fee-burn vote offers Solana a potential catalyst
SolanaFloor reported that proposals addressing Solana’s fee burn and token disinflation were set to enter an initial vote on Aug. 3.
According to the report, the measures would double annual disinflation to 30%, remove about $1.36 billion in projected token issuance over six years and increase daily burns from roughly 650 SOL to 9,000 SOL.
Those figures remain projected outcomes rather than confirmed changes. The proposals must progress through governance before they can alter SOL’s supply dynamics.
For US investors, the immediate backdrop also remains tied to broader risk appetite. High-beta tokens such as SOL can face added pressure when elevated Treasury yields make lower-risk dollar assets more attractive. A shift in Federal Reserve expectations or US yields could therefore affect whether buyers return at the current support zone.
The short-term outlook remains bearish below $75.06. Reclaiming that level would improve the setup and expose $76.79, while a confirmed break below $71.49 would increase the risk of a move toward $70.
Disclosure: This article does not represent investment advice. The content and materials featured on this page are for educational purposes only.

Family tributes to Ava Gillies following crash on A170

Horizon Kinetics Q2 2026 Commentary

Infantino Wants to Collect on Trump’s World Cup Favor but Polymarket Says He’s 36% Out


-

 Business5 days ago
Why Trees Belong on the Risk Register
-

 Fashion3 days ago
Weekend Open Thread: Wit & Wisdom
-

 Politics3 days ago
Meta enters AI-training agreement with far-right ‘propaganda rag’ Newsmax
-
 Entertainment6 days ago
‘Stargate’ Creator’s New Sci-Fi Series Returns for Season 3 Tomorrow
-
 Crypto World2 days ago
MicroStrategy Post-Earnings CLARITY Act Push Could Add New Catalyst for Its Stock
-

 Politics6 days ago
The Part of the Electric Transition Nobody Wants to Discuss
-

 Business5 days ago
Major shareholder moves on Canyon
-

 Crypto World2 days ago
XRP Ledger v3.3.0 brings five institutional features
-

 News Videos4 days ago
Bitcoin Enters the 3rd Stage of the Bear Market
-

 Crypto World6 days ago
Kraken Enables Retail Access to Jersey Mike’s IPO via Tokenized Shares
-

 Tech7 days ago
New macOS Sequoia & Sonoma security updates for older Macs
-

 Politics4 days ago
Luke Littler’s dominance sparks GOAT debate
-

 News Videos6 days ago
Claude: Build Financial Dashboards in Minutes (2026)
-

 Business6 days ago
Johnson & Johnson agrees to $5.5B settlement over talc cancer claims
-

 Sports4 days ago
Seema Kaliramna Wins Discus Throw Bronze, Takes India’s CWG Medals Tally To 17
-

 Crypto World1 day ago
Crypto PAC spending tops $2M in Michigan House race
-

 Business3 days ago
Trump Announces Hamas Disarmament Agreement as Iran Strikes Kuwait Air Base and US Attacks Pause Overnight
-

 Tech5 days ago
Gemini can now summarize the messiest comment threads in Google Docs
-

 Crypto World3 days ago
New York sues Kalshi over prediction market gambling
-

 Tech1 day ago
ESET tracks rise in malicious AI skills and adaptable malware
You must be logged in to post a comment Login