

Crypto World
Is crypto market crash deepening after Trump confirms more strikes on Iran?
Crypto markets remain under pressure after U.S. President Donald Trump confirmed that military operations against Iran will continue following joint U.S.–Israeli strikes that killed Iran’s Supreme Leader, Ayatollah Ali Khamenei.
Summary
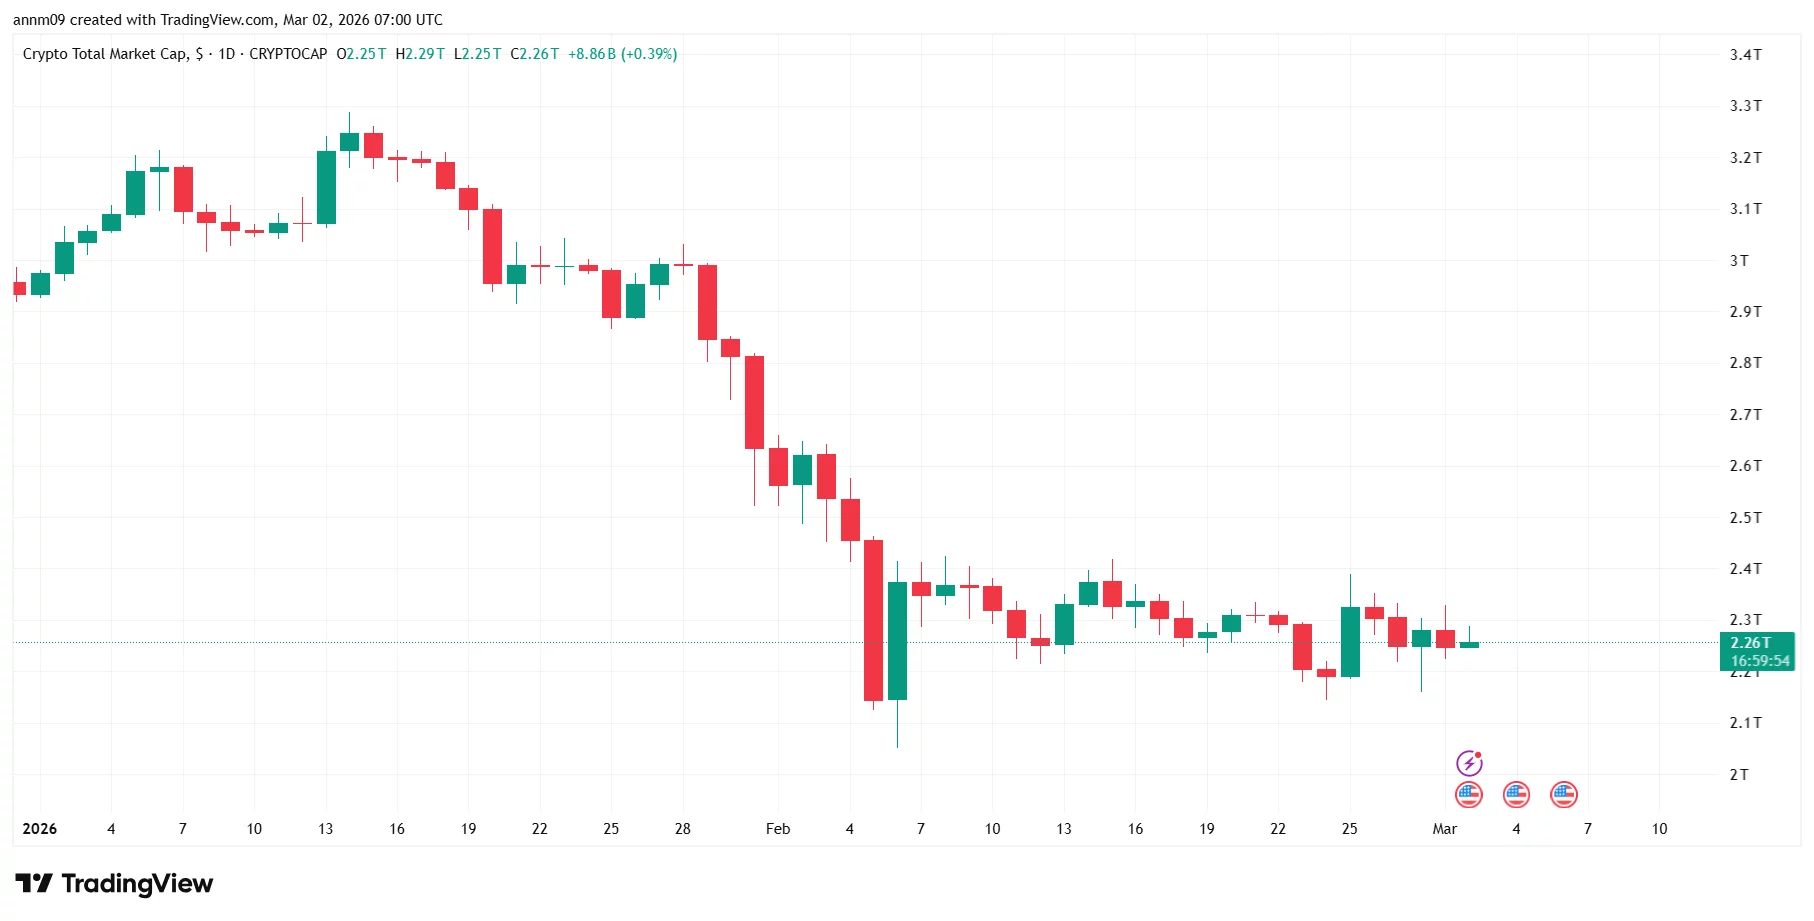
- Total crypto market cap has fallen from roughly $3.3 trillion in January to around $2.26 trillion, with key support now near $2.1 trillion.
- BTC trades near $66,200, well below its 50-day ($77K) and 100-day ($83K) moving averages, signaling continued bearish momentum.
- Trump’s confirmation of continued U.S. military operations against Iran has added uncertainty, keeping risk assets like crypto under pressure.
Trump said combat operations are ongoing and will persist until U.S. strategic objectives are achieved, warning Tehran of further consequences as the conflict escalates.
Total crypto market cap analysis
The total crypto market capitalization has fallen sharply from January highs near $3.3 trillion to around $2.26 trillion at press time, marking a drawdown of more than $1 trillion at the peak of the selloff.
February saw an accelerated breakdown, with a large capitulation candle pushing the market toward the $2.1–$2.2 trillion support zone.

Currently, total market cap is consolidating near $2.26 trillion, showing mild stabilization but no clear reversal. Immediate support sits around $2.1 trillion, the recent wick low.
A break below that could open the door toward the psychological $2.0 trillion level. On the upside, resistance stands near $2.35–$2.4 trillion, where previous breakdown consolidation occurred.
Momentum suggests a bearish structure remains intact, though volatility has compressed, indicating markets are waiting for further geopolitical clarity.
Crypto market crash continues: Bitcoin struggles
Bitcoin (BTC) mirrors the broader market weakness. After topping near $96,000 in early January, BTC plunged below $70,000, briefly wicking toward the low $60,000s during February’s panic selling.
At the time of writing, BTC trades around $66,200.
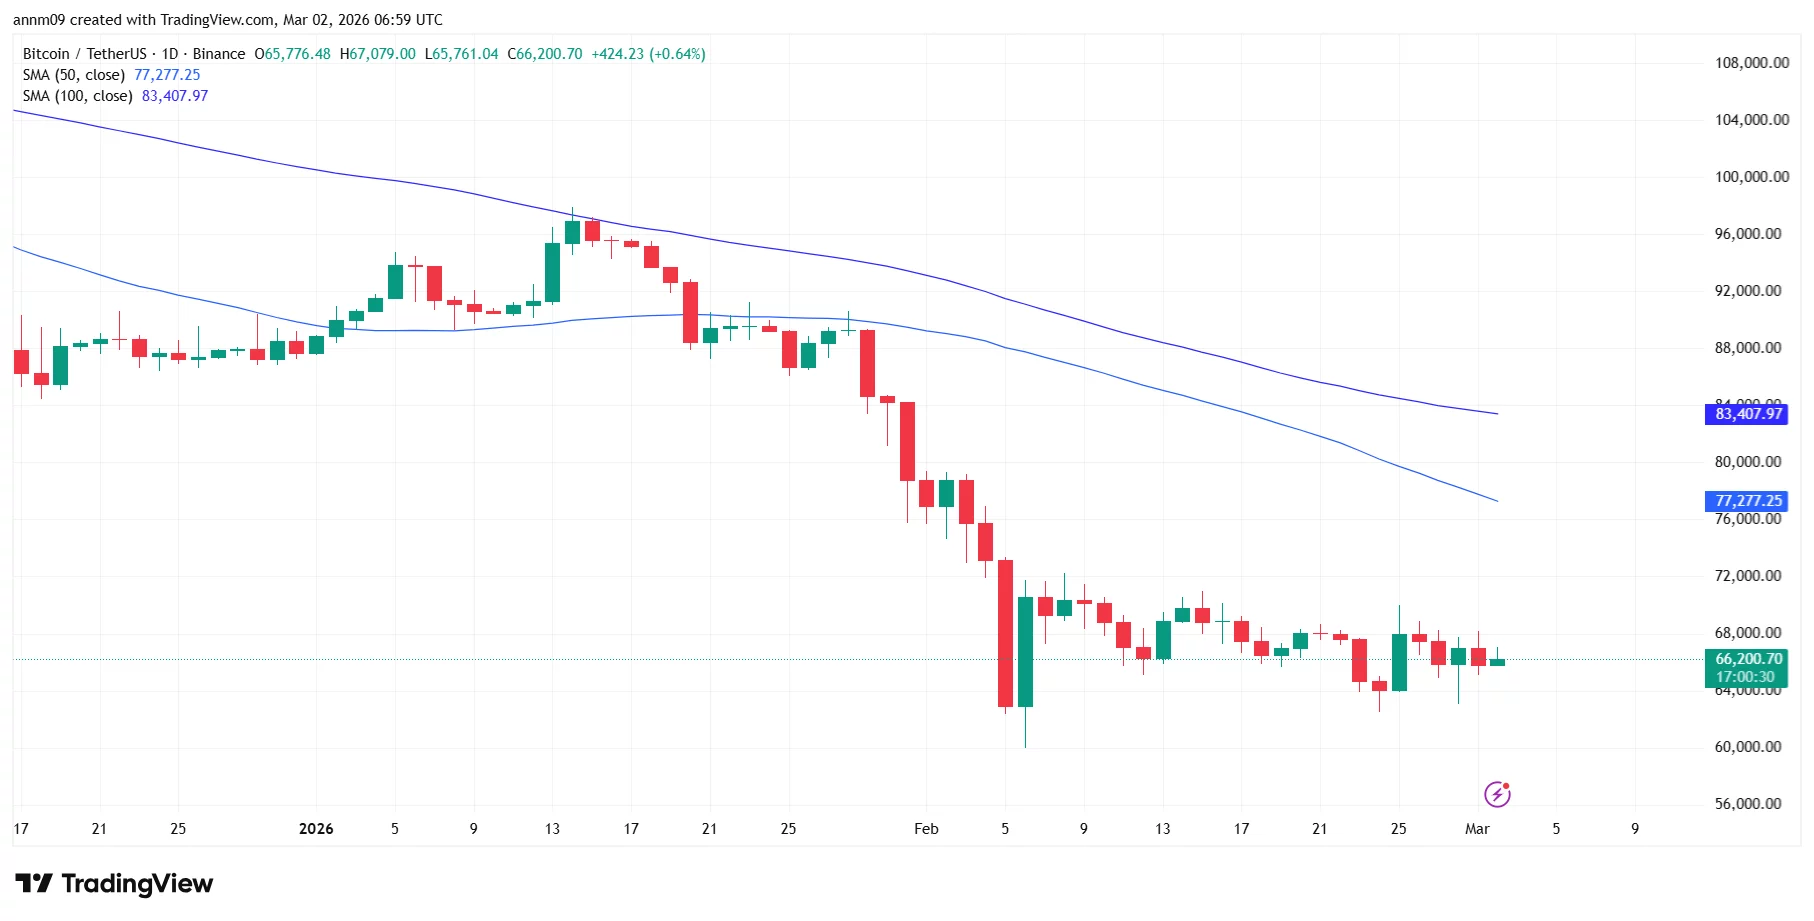
Technically, Bitcoin remains below both its 50-day SMA (~$77,277) and 100-day SMA (~$83,408) — a bearish alignment that confirms downward momentum. The 50-day moving average is trending lower and approaching a potential bearish crossover configuration.
Immediate support lies around $64,000–$65,000, with stronger structural support near $60,000. Resistance remains heavy at $70,000, followed by the 50-day SMA near $77,000.
While markets have not made new lows since the initial strike shock, Trump’s confirmation of continued military operations adds uncertainty that could keep risk assets under pressure. For now, crypto appears to be stabilizing, but the broader downtrend remains intact unless key resistance levels are reclaimed.


- Mantle has crossed the $1 billion total market size threshold on Aave.
- If inflows persist, bulls could target resistance in the $0.85-$0.92 range.
- MNT can rally toward the bulls’ key target of $1.
Mantle, a layer-2 blockchain network connecting traditional finance and on-chain liquidity, has surpassed $1 billion in total lending and borrowing volume on the Aave protocol.
The milestone coincides with a sharp rise in Mantle’s total value locked (TVL) in decentralized finance, despite the crypto market’s bearish outlook.
Can the lending and TVL milestones bolster the price of the native token MNT?
Mantle hits $1B lending milestone on Aave
The Mantle-Aave lending market rocketed past the $1 billion mark following a blockbuster launch that injected $800 million in just one day last week.
According to details, the staggering jump in market size, achieved in under three weeks, saw a new uptick as a dynamic weekend brought more than $200 million in organic capital inflows.
Beyond these gains, the Aave integration has ignited broader ecosystem momentum.
Notably, Mantle’s DeFi TVL has jumped from around $455 million to over $755 million, a 66% increase in just one week.
Emily Bao, a key advisor for Mantle, emphasized the achievement:
“Crossing $1 billion in total market size in under three weeks is a clear signal and not just of what Mantle and Aave have built together, but of where institutional and retail DeFi is heading. Mantle was built to be the distribution layer where real-world finance flows, and these milestones are proof that the ecosystem is delivering on that vision. The MoMNTum is real, and we’ve barely even started.”
What could these network milestones mean for MNT? Market experts say the integration of Mantle on Aave is critical to users seeking opportunities and incentives across DeFi.
As such, the surge highlights Mantle’s growing appeal as a scalable and efficient platform for DeFi activities.
MNT price could eye gains as the ecosystem expands and attracts inflows.
Mantle price forecast: can bulls target $1?
MNT’s price has hovered around $0.65-$0.70 over the past month, with current prices well below the all-time high of $2.85 in October 2025.
While buyers have shown resilience, early signs of recovery have faded amid a broader market downturn.
However, the $1 billion milestone could act as a powerful catalyst for MNT, potentially drawing more liquidity and boosting token utility.
The TVL surge also highlights increased value bet on Mantle growth.

If bulls hold current levels, a fresh bounce could bring the supply zone around $0.85 and $0.92 into play.
The $1 level is a key bullish target.
However, technical indicators suggest sellers may continue to exert downside pressure in the coming days and weeks.
Mantle token trading below key moving averages and being neutral-to-sell leaning oscillators support this outlook.
RSI is at 42, and suggests seller conviction, while the price also hovers below the parabolic SAR.
If the downside proves to be the path of least resistance, the next support levels could be $0.57 and Feb. 6 lows at $0.52.
XRP is still trading in a broader downtrend, and the rebound attempts keep getting capped at lower highs. The asset is now trying to establish a bottom near the lower part of the range, so the next move likely comes down to whether buyers can defend the recent floor and reclaim the first resistance band.
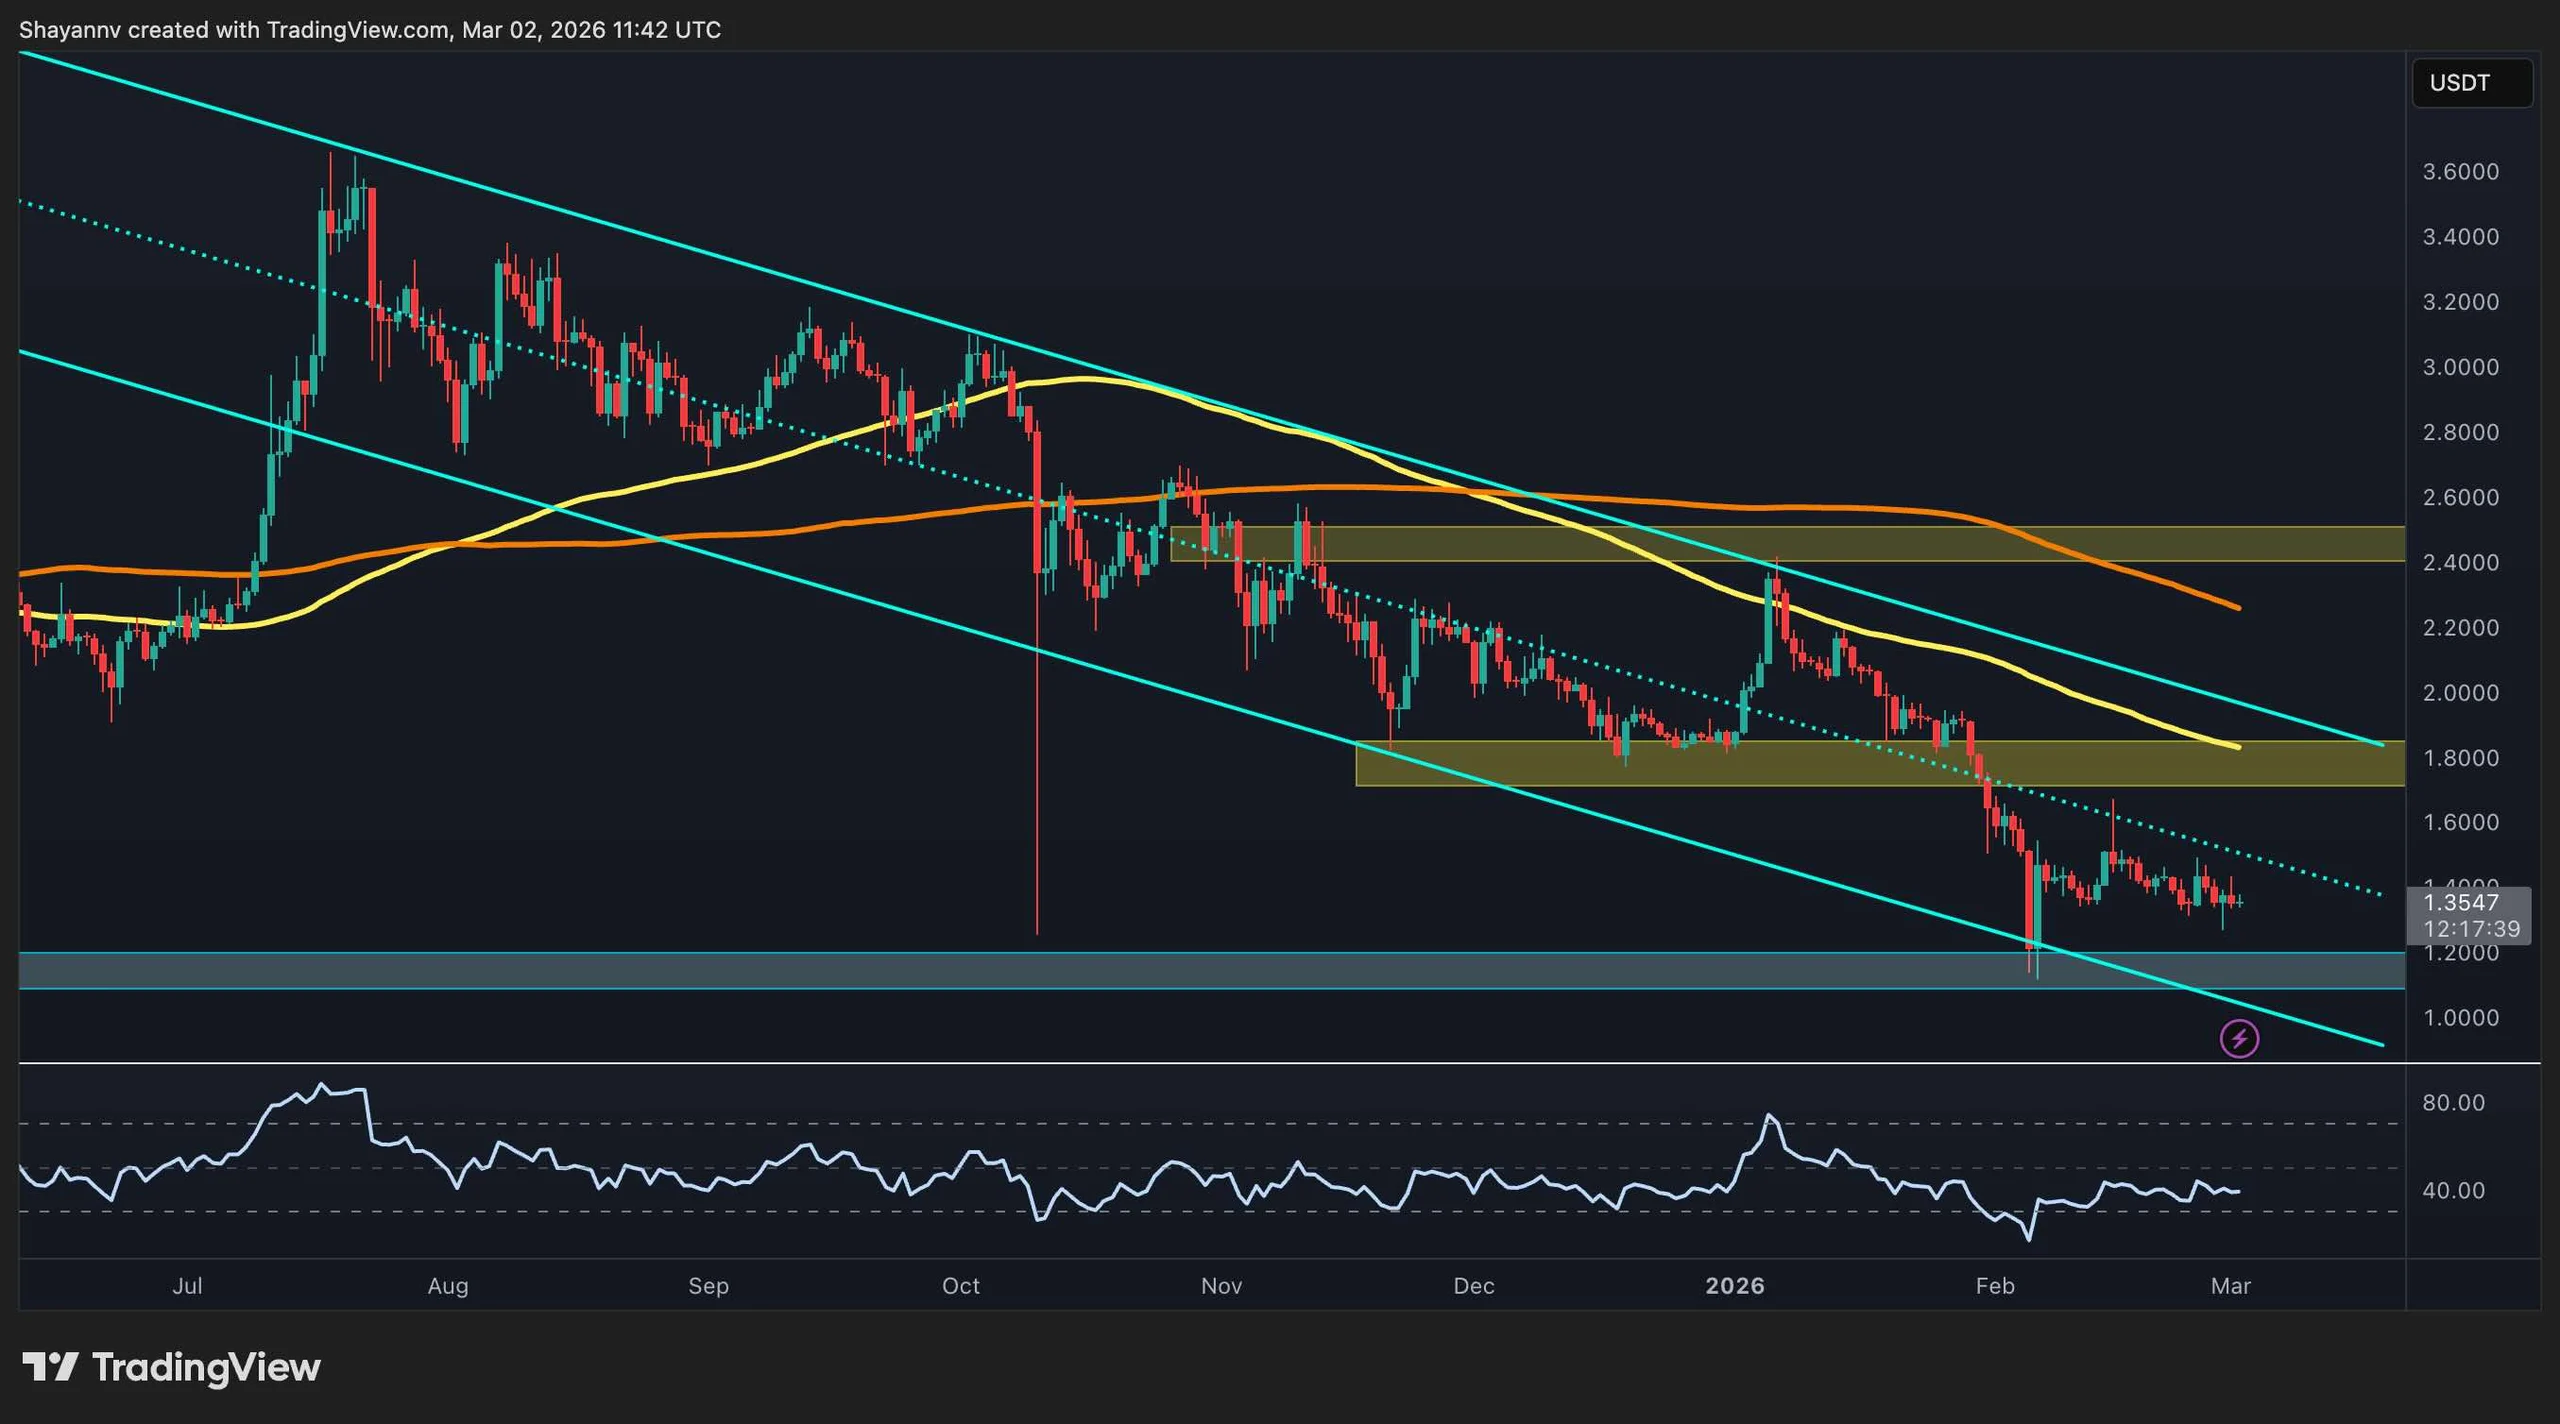
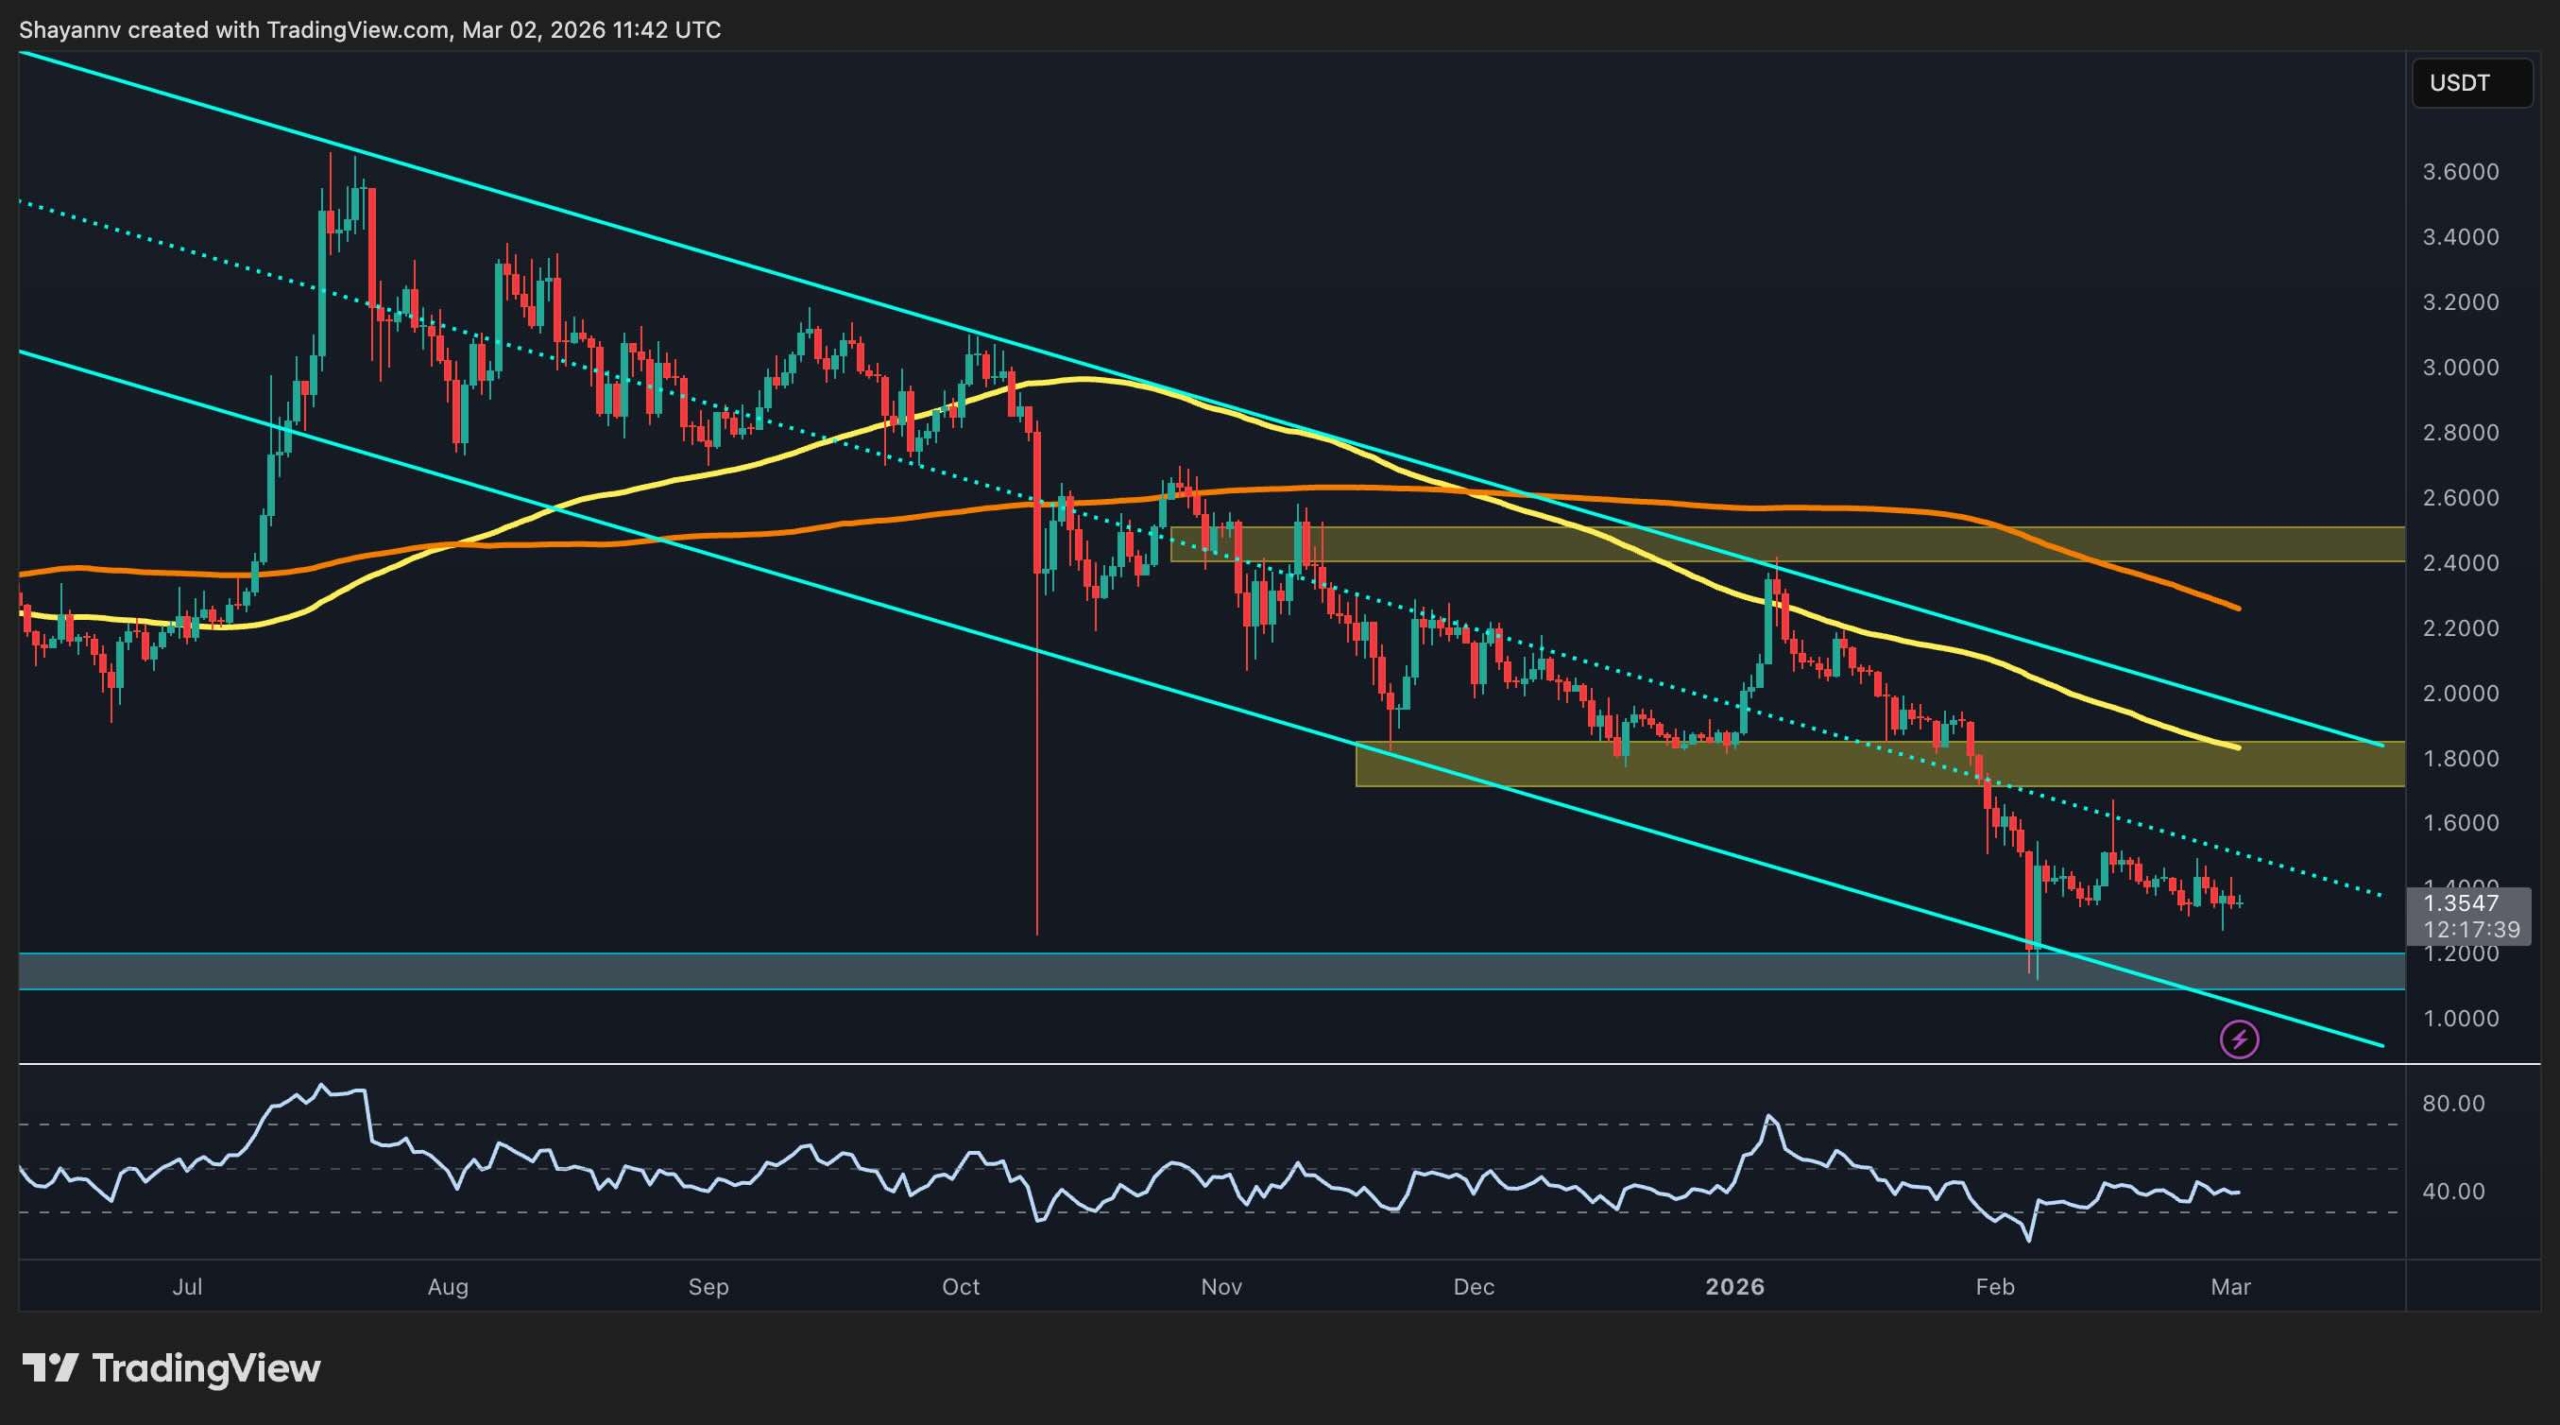
Ripple Price Analysis: The USDT Pair
On the daily XRPUSDT chart, the trend remains bearish inside a descending channel, with the price holding below the 100-day moving average and the 200-day moving average. The most important overhead supply is the $1.80 zone, which has acted as a pivot area and now lines up with dynamic resistance from the moving averages and the channel structure.
Above that, the next heavier resistance level sits around $2.40 to $2.50, where sellers previously stepped in and where a larger trend shift would need to prove itself.
Support is concentrated around $1.20, which is the area that has been repeatedly defended after the recent flush. As long as XRP stays above this band, the market can keep forming a base and attempt a recovery leg. A clean daily breakdown below $1.20, however, would weaken the structure and increase the odds of a deeper drop toward the next support region near $1.00 or even lower.
The BTC Pair
On the daily XRPBTC chart, XRP is trading around 2,050 sats and still sits below key resistance levels and the key 100-day and 200-day moving averages, after failing to hold the prior recovery swings. The first resistance to watch is the 100-day moving average around 2,200, followed by the 200-day moving average around 2,400 sats.
These elements have repeatedly rejected the price and also overlap with the moving averages, acting as pressure from above. If XRP can reclaim that zone and hold it, the next upside target becomes the 2,500 to sats supply area.
The main support is also located near the 2,000 sats region, which has been tested multiple times and is clearly a line bulls are trying to defend. If the 2,000-sat level fails on a clean break and close, the next major demand pocket sits much lower around 1,400 to 1,500 sats. That is the type of move that usually happens when Bitcoin strength outpaces altcoins, so XRPBTC is still the key risk gauge for bulls here.

Binance Free $600 (CryptoPotato Exclusive): Use this link to register a new account and receive $600 exclusive welcome offer on Binance (full details).
LIMITED OFFER for CryptoPotato readers at Bybit: Use this link to register and open a $500 FREE position on any coin!
Disclaimer: Information found on CryptoPotato is those of writers quoted. It does not represent the opinions of CryptoPotato on whether to buy, sell, or hold any investments. You are advised to conduct your own research before making any investment decisions. Use provided information at your own risk. See Disclaimer for more information.

Quick Summary
-
CVX shares gained approximately 4% before the market opening bell on rising crude prices
-
Brent crude surged up to 13% following strikes on Middle East energy infrastructure
-
The company’s Leviathan natural gas facility was shut down after regional attacks
-
Maritime traffic slowdowns near the Strait of Hormuz sparked supply worries
-
Market participants are monitoring petroleum stockpiles and regional tensions
Chevron (CVX) shares experienced upward momentum during Monday’s premarket session as crude oil prices rallied sharply following fresh military strikes across the Middle East.
The stock advanced around 4% in early morning trading as oil markets responded to renewed supply uncertainty and reduced maritime activity near the strategic Strait of Hormuz.
The rally came as both Brent crude and West Texas Intermediate futures posted significant gains.
Brent reached a peak increase of 13% during the opening moments before moderating somewhat as the session progressed.
Energy sector equities rallied swiftly as market participants factored in regional supply threats.
Chevron concluded Friday’s trading session at $186.76, posting a 1.41% increase.
Early Monday activity pushed the stock toward $194 as petroleum prices continued climbing.
Exxon Mobil alongside other prominent energy firms also experienced premarket gains.
The energy sector outperformed even as broader indices faced headwinds.
Supply Disruption Fears Fuel Oil Rally
Crude prices rocketed higher after recent strikes hit critical energy infrastructure and maritime passages throughout the Middle East.
Trading resumed with markets pricing in elevated risk premiums for potential supply interruptions.
Saudi Aramco suspended operations at its Ras Tanura refinery following a drone strike.
The installation has daily processing capacity of approximately 550,000 barrels, industry sources indicate.
Market observers characterized the attack as a significant escalation targeting crucial Gulf energy assets.
Maritime operations near the Strait of Hormuz experienced slowdowns in the wake of the strikes.
Approximately 20% of worldwide petroleum supply passes through the Strait of Hormuz.
Any impediment to transit through this waterway can rapidly influence global energy pricing.
Petroleum markets are currently responding to Gulf region events and shipping patterns.
Industry experts noted that price trajectories will depend significantly on disruption duration.
OPEC+ recently authorized a 206,000 barrel per day production boost beginning in April.
Traders emphasized that this supply addition remains modest when weighed against present geopolitical uncertainties.
Chevron’s Regional Exposure and Market Outlook
Chevron maintains significant exposure to regional events through its Middle East operations.
Israel’s Energy Ministry mandated temporary shutdowns of domestic natural gas production following the strikes.
Chevron’s operated Leviathan offshore gas field went offline in response to the attacks.
Industry sources attributed the closure to elevated security concerns.
The company’s financial performance correlates strongly with oil and gas pricing trends.
Elevated energy prices typically bolster upstream revenue for integrated producers.
Energy equities rallied broadly across the sector as petroleum prices advanced.
Occidental Petroleum and ConocoPhillips similarly registered substantial premarket increases.
Market participants are tracking whether Hormuz shipping volumes normalize in coming days.
Attention is also focused on potential resumption timelines for Israeli natural gas operations.
Domestic traders await Wednesday’s weekly petroleum inventory figures from regulators.
The Energy Information Administration is scheduled to publish the data at 10:30 a.m. Eastern Time.
CVX shares maintained premarket gains as oil markets continued processing supply concerns and operational interruptions stemming from Middle East developments.

Crypto investment products recorded their first weekly inflows since January last week, snapping a five-week outflow streak of around $4 billion.
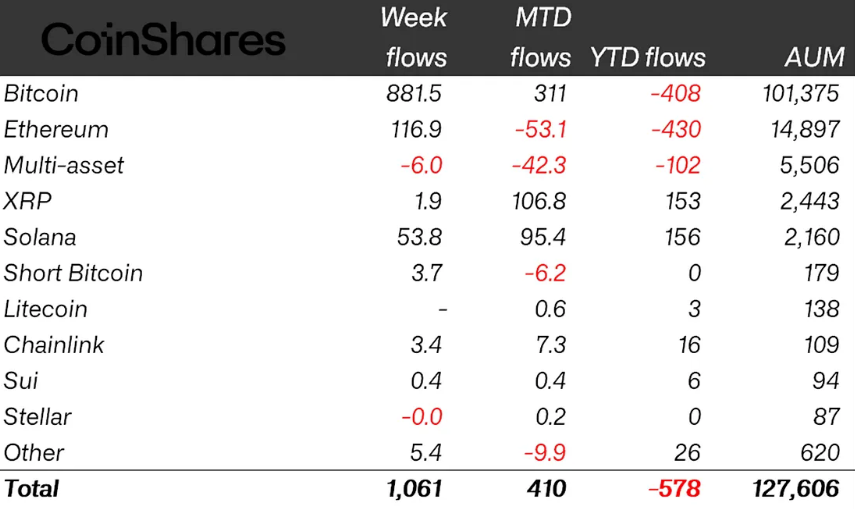
Crypto exchange-traded products (ETPs) attracted $1 billion in inflows last week, led by $882 million into Bitcoin (BTC) funds, according to a Monday report from CoinShares.
“From a macro standpoint, it is difficult to attribute the shift in sentiment to a single catalyst,” said James Butterfill, CoinShares’ head of research.
He said the reversal likely reflected prior price weakness, a break below key technical levels and renewed accumulation by large Bitcoin holders.
“At a more anecdotal level, recent client discussions have been almost entirely focused on identifying entry points rather than reducing exposure to the asset class,” he added.
Ether and Solana add $171 million in weekly crypto inflows
Ether (ETH) funds drew about $117 million, CoinShares said, marking their strongest week since January, while Solana (SOL) drew in about $54 million.
Chainlink (LINK) and XRP (XRP) followed with $3.4 million and $2 million in inflows, respectively.

Despite the renewed demand, Bitcoin and Ether ETPs remain in negative territory for the year, with net outflows of $408 million and $430 million, respectively.
Related: Bitcoin manipulation claims face pushback as ETFs snap 5-week outflow run: Finance Redefined
In contrast, Solana and XRP products have posted year-to-date inflows of $156 million and $153 million.
US spot Bitcoin ETFs lead with $787 million in inflows
Regionally, ETP flows were broadly aligned, with the United States accounting for the bulk of inflows at $957 million. Canada, Germany and Switzerland recorded inflows of $34 million, $32.7 million and $28 million, respectively.
Most of the gains came from US spot Bitcoin ETFs, which drew $787.3 million last week, snapping a five-week outflow streak that had totaled more than $3.8 billion, according to SoSoValue.

Despite the renewed inflows, total assets under management in crypto ETPs declined to $127.7 billion from $130.4 billion the previous week.
Net assets in Bitcoin ETFs also fell, slipping to $83.4 billion from $85.3 billion a week earlier.
Magazine: Clarity Act risks repeat of Europe’s mistakes, crypto lawyer warns
By Omkar Godbole (All times ET unless indicated otherwise)
The conflict between U.S., Israel and Iran remains the day’s biggest story as the attacks intensify and spread.
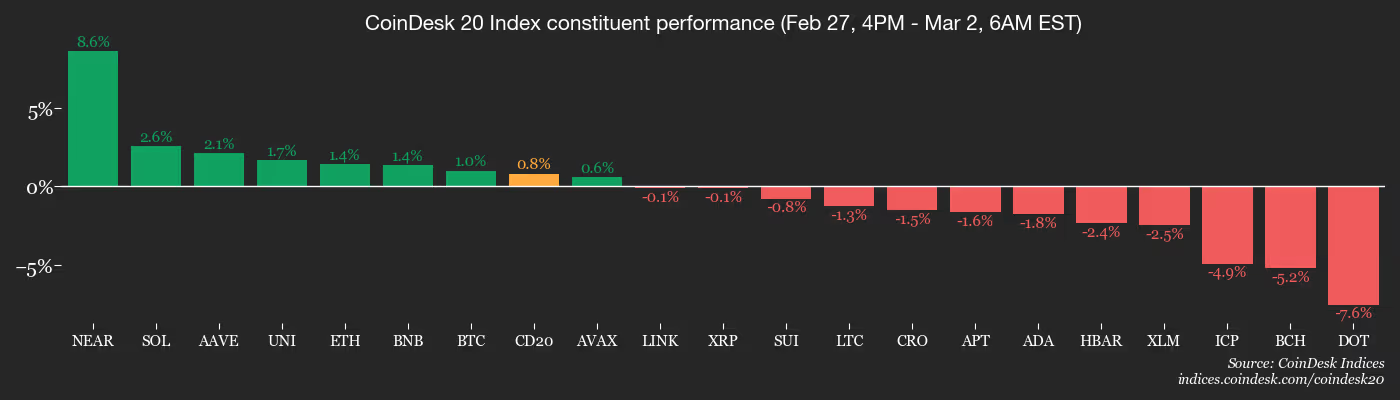
Markets reacted as they typically do: by de-risking and sending oil prices higher. Bitcoin dropped to $66,300, down 0.5% over 24 hours, having hit a high of $68,000 over the weekend. The CoinDesk 20 Index fell over 2%, signaling broader losses in the crypto market and futures tied to the S&P 500 index lost 1%.
Looking past the headlines and panic, the war could only strengthen the “debasement trade,” a strategy in which investors rotate into scarce-supply assets like gold and bitcoin in anticipation of a decline in the value of fiat (paper) currencies.
Governments in the U.S. and elsewhere already owe more than they generate in economic growth. Their finances will only worsen the longer the war drags on. In such situations, governments don’t collect enough in taxes. Instead, they force central banks to “print money” through bond purchases or quantitive easing (QE) to monetize debt. This floods fiat supply and dilutes purchasing power. Hello debasement.
Traders front-run that process by loading up on store-of-value assets like gold and BTC. The yellow metal has been on a tear for over a year mainly on debasement flows. BTC did not participate back then. But now, having nearly halved to under $67,000 since October, it looks oversold. The possibility of the debasement trade catalyzing a bounce in the largest cryptocurrency cannot be ruled out.
Besides, historically the Fed turns dovish with liquidity easing during geopolitical stress, supporting asset prices, as Maelstrom Fund’s CIO Arthur Hayes noted in his blog post.
Let’s see how things unfold. In the meantime traders need to watch headline risks and oil upswings. Stay alert!
Read more: For analysis of today’s activity in altcoins and derivatives, see Crypto Markets Today
What to Watch
For a more comprehensive list of events this week, see CoinDesk’s “Crypto Week Ahead“.
- Crypto
- March 2: SuperRare to release Delirium, a new collection by artist Xer0x
- March 2: Mantra’s OM to change to MANTRA with a 1:4 coin split as the MANTRA Chain upgrades from v6 to v7.
- Macro
- March 2, 10:00 a.m.: U.S. ISM manufacturing PMI for February est. 52.3 (Prev. 52.6)
- Earnings (Estimates based on FactSet data)
- March 2: Riot Platforms (RIOT), post-market, -$0.32
- March 2: Core Scientific (CORZ), post-market, -$0.18
Token Events
For a more comprehensive list of events this week, see CoinDesk’s “Crypto Week Ahead“.
- Governance votes & calls
- PoolTogether DAO is voting to manually resubmit and execute the remaining actions for the PTBR-35 Governance Shutdown after a previous execution error. Voting ends March 2.
- Angle DAO is voting to orderly wind down the EURA and USDA stablecoins, providing users a one-year 1:1 redemption period followed by a final settlement airdrop. Voting ends March 2.
- GMX DAO is voting to transition to a defined leadership model by hiring a CEO with performance-tied compensation and forming an interim leadership committee to guide the restructuring. Voting ends March 2.
- Unlocks
- Token Launches
- March 2: Dovu (DOVU) to be listed on Kraken.
Conferences
For a more comprehensive list of events this week, see CoinDesk’s “Crypto Week Ahead“.
Market Movements
- BTC is up 0.98% from 4 p.m. ET Friday at $66,194.78 (24hrs: -0.35%)
- ETH is up 1.48% at $1,950.67 (24hrs: -1.63%)
- CoinDesk 20 is up 0.78% at 1,916.46 (24hrs: -1.11%)
- Ether CESR Composite Staking Rate is up 1 bp at 2.85%
- BTC funding rate is at -0.0011% (-1.2147% annualized) on Binance

- DXY is up 0.64% at 98.23
- Gold futures are up 3.03% at $5,406.80
- Silver futures are up 2.64% at $95.75
- Nikkei 225 closed down 1.35% at 58,057.24
- Hang Seng closed down 2.14% at 26,059.85
- FTSE is down 0.78% at 10,825.36
- Euro Stoxx 50 is down 1.89% at 6,022.64
- DJIA closed on Friday down 1.05% at 48,977.92
- S&P 500 closed down 0.43% at 6,878.88
- Nasdaq Composite closed down 0.92% at 22,668.21
- S&P/TSX Composite closed down 0.47% at 34,339.99
- S&P 40 Latin America closed down 0.82% at 3,741.78
- U.S. 10-Year Treasury rate is up 0.4 bps at 3.966%
- E-mini S&P 500 futures are down 1.04% at 6,817.25
- E-mini Nasdaq-100 futures are down 1.42% at 24,650.00
- E-mini Dow Jones Industrial Average Index futures are down 1.11% at 48,458.00
Bitcoin Stats
- BTC Dominance: 58.63% (0.22%)
- Ether-bitcoin ratio: 0.02944 (-0.18%)
- Hashrate (seven-day moving average): 1,068 EH/s
- Hashprice (spot): $29.01
- Total fees: 2.55 BTC / $169,782
- CME Futures Open Interest: 109,280 BTC
- BTC priced in gold: 12.2 oz.
- BTC vs gold market cap: 4.42%
Technical Analysis

- The chart shows ether’s daily price swings with Bollinger bands, which are volatility bands placed two standard deviations above and below the 20-day simple moving average of the price.
- The gap between the bands has shrunk to $226, the narrowest since June 2025.
- Volatility typically booms when bands narrow, which means the token could soon see big price moves in either direction.
Crypto Equities
- Coinbase Global (COIN): closed on Friday at $175.85 (-2.88%), -2.42% at $171.60 in pre-market
- Circle Internet (CRCL): closed at $83.44 (-4.32%), -3.46% at $80.55
- Galaxy Digital (GLXY): closed at $20.59 (-6.15%), -2.19% at $20.14
- Bullish (BLSH): closed at $31.39 (-4.09%), -3.73% at $30.22
- MARA Holdings (MARA): closed at $8.94 (+5.80%), -1.23% at $8.83
- Riot Platforms (RIOT): closed at $16.29 (-4.68%), -2.70% at $15.85
- Core Scientific (CORZ): closed at $16.97 (-5.62%)
- CleanSpark (CLSK): closed at $9.95 (-4.69%), -2.01% at $9.75
- CoinShares Valkyrie Bitcoin Miners ETF (WGMI): closed at $39.88 (-5.43%), -3.61% at $38.44
- Exodus Movement (EXOD): closed at $10.20 (-2.39%), -2.25% at $9.97
Crypto Treasury Companies
- Strategy (MSTR): closed at $129.50 (-2.92%), -0.39% at $129.00
- Strive (ASST): closed at $7.94 (-3.05%), -2.39% at $7.75
- SharpLink Gaming (SBET): closed at $6.82 (-5.41%), +0.44% at $6.85
- Upexi (UPXI): closed at $0.66 (-12.88%)
- Lite Strategy (LITS): closed at $1.13 (-0.88%)
ETF Flows
Spot BTC ETFs
- Daily net flows: -$27.5 million
- Cumulative net flows: $54.78 billion
- Total BTC holdings ~1.27 million
Spot ETH ETFs
- Daily net flows: -$43 million
- Cumulative net flows: $11.63 billion
- Total ETH holdings ~5.7 million
Source: Farside Investors
While You Were Sleeping
- Trump says Iran war may last ‘four weeks or less’ as strikes escalate (Euronews): Trump says the Iran war could last four weeks or less as U.S. and Israeli forces continue their strikes in Iran, which is responding with hits on Gulf states, Israel and U.S. targets.
- New Iranian strikes reported across region, including in Saudi Arabia, as US planes crash in Kuwait (BBC): New Iranian strikes were reported across the Middle East, with explosions in Bahrain, Dubai and Saudi Arabia.
- U.S. equity futures fall in pre-market trading as oil, gold retreat from highs (CoinDesk): U.S. equities fell in pre-market trading. The Invesco QQQ ETF declined 1.5%. A Saudi Arabia oil refinery was hit by Iran, pushing WTI crude oil as high as $75 per barrel. Gold rallied more than 2% to $5,400 per ounce.
- Hedge funds, insurers rush to gauge exposure as Iran spirals (Bloomberg): Hedge funds, banks and insurers rushed to size up their exposure to the Middle East after weekend attacks on Iran fueled chaos across the region.

In the current DeFi landscape, conversations almost always orbit around yield optimization, governance mechanics, or the scaling capabilities of layer-2 solutions. Yet one critical piece of infrastructure remains largely overlooked: risk oracles. While price oracles and data feeds have become standard tools, the notion of composable risk oracles—systems that dynamically quantify and communicate both systemic and protocol-specific risk across multiple platforms—is still in its infancy.
What Are Composable Risk Oracles?
A composable risk oracle is more than a price feed. It aggregates real-time data from across the DeFi ecosystem—borrowing/lending metrics, leverage exposure, liquidity depth, liquidation history, protocol governance signals, and even cross-chain activity—to produce standardized risk signals. These signals are then usable by any smart contract or protocol, enabling dynamic risk management instead of static, one-size-fits-all rules.
Imagine a lending protocol that no longer sets fixed collateralization ratios but instead adjusts them continuously based on the asset’s aggregated risk score. Or a yield aggregator that modifies reward rates according to the systemic risk of the pools it taps into. Risk oracles allow protocols to react proactively, not reactively, to volatility or emerging threats.
Why DeFi Needs Them
The current ecosystem assumes either that token price alone drives risk or that risk is manually managed by developers or governance processes. This has clear limitations:
-
Systemic Blind Spots: Individual protocols may look safe in isolation, but become fragile when interdependencies are ignored.
-
Slow Reaction: Manual updates or governance votes lag behind market realities, leaving funds exposed.
-
Inefficient Capital Allocation: Overly conservative or overly aggressive parameters reduce yield efficiency and user participation.
Composable risk oracles provide a single, unified “risk layer” that protocols can plug into, enabling smarter leverage, collateral, and incentive designs that respond to real-time ecosystem dynamics.
A Vision for DeFi with Risk-Aware Protocols
Picture this: a cross-chain DeFi ecosystem where protocols continuously query risk oracles to:
-
Adjust collateralization ratios based on the health of underlying assets.
-
Scale leverage limits according to current market volatility and systemic exposure.
-
Dynamically modulate reward rates to incentivize safer behavior during periods of high stress.
This would turn DeFi from a reactive landscape, where users and protocols chase yield at the risk of systemic failure, into a self-regulating, adaptive financial network. Essentially, risk moves from the shadows into the core protocol logic.
Challenges and Opportunities
Implementing composable risk oracles is non-trivial. Key challenges include:
-
Data aggregation across chains and platforms without introducing latency or oracle manipulation risks.
-
Standardizing risk metrics so diverse protocols can interpret and act upon them consistently.
-
Governance coordination is especially important in decentralized systems where incentive alignment is complex.
Yet the upside is enormous. Risk oracles could underpin capital-efficient DeFi, unlock higher-leverage yet safer markets, and even help regulators or insurance protocols quantify systemic exposure in real time.
Conclusion
The DeFi ecosystem has made leaps in tokenization, yield, and scaling—but risk remains the silent variable. Composable risk oracles have the potential to fundamentally transform how protocols manage risk, aligning incentives and protections in real-time, dynamically. They could become as indispensable to DeFi as price oracles are today—turning a collection of isolated protocols into a coherent, resilient financial network.
DeFi’s next frontier may not be more yield—it may be smarter, composable risk.
REQUEST AN ARTICLE

Hong Kong and Shanghai authorities unveiled a joint plan to deepen blockchain-enabled collaboration in trade finance and cargo documentation, signaling a practical shift toward digital infrastructures for cross-border commerce. The memorandum of understanding, signed on March 2, 2026, brings together the Hong Kong Monetary Authority (HKMA), the Shanghai Data Bureau (SDB), and the National Technology Innovation Center for Blockchain (NTICBC) to explore a blockchain-based cross-border platform that would interlink trade data, electronic bills of lading, and associated financial applications as part of HKMA’s Project Ensemble. Officials framed the move as a concrete step toward more efficient, transparent and regulatorily sound trade workflows, with pilots and research guiding the rollout.
Key takeaways
- HKMA, SDB, and NTICBC formalize cooperation to digitize cargo trade and finance via a blockchain-driven cross-border platform.
- The project aligns with HKMA’s Project Ensemble and aims to integrate trade data, electronic bills of lading, and financial services within a unified digital rails framework.
- The initiative leverages the Commercial Data Interchange (CDI), HKMA’s blockchain-based data infrastructure launched in 2022 to enable institutional access to corporate data for lending and financing.
- Project CargoX is expected to play a role in strengthening trade and cargo data capabilities for financing and related services.
- Separately, Hong Kong is pursuing tax concessions for digital assets, proposing to broaden qualifying investments for funds and family offices, with potential exemptions on profits if approved.
Tickers mentioned:
Market context: The MoU arrives amid a broader push to modernize financial infrastructure in Asia, with Hong Kong positioning itself as a hub for digital finance and cross-border tokenized services, and Shanghai advancing its fintech ambitions within the broader mainland regulatory framework.
Sentiment: Neutral
Price impact: Neutral. The announcement describes strategic cooperation and policy considerations rather than immediate market moves.
Trading idea (Not Financial Advice): Hold. The collaboration signals long-term structural changes in trade finance infrastructure rather than short-term price triggers.
Market context: The plan sits at the intersection of regulatory clarity, digitization of trade finance, and growing interest in tokenized and data-driven financial services, within a macro environment of ongoing digitization and cross-border coordination in the Asia-Pacific region.
Why it matters
The memorandum underscores a concerted effort by two of Asia’s largest financial centers to reimagine how trade and finance data move across borders. By pursuing a blockchain-enabled cross-border platform, the partners aim to reduce paperwork, shorten settlement times, and improve data integrity for cargo finance. The initiative is designed to harmonize digital records with traditional documents like bills of lading, marrying the reliability of paper-based processes with the efficiency of digital ledgers. In practice, a platform of this kind could lower the operational friction that has historically dogged freight finance, where misaligned documents and slow reconciliation can stall shipments and funding cycles.
On the technical side, the collaboration will leverage the HKMA’s CDI, a blockchain-based financial data infrastructure launched in 2022 to give institutional lenders access to a broader set of corporate data. CDI is already being used to streamline lending decisions by consolidating disparate data sources, and its extension into trade finance could yield faster underwriting and more accurate risk assessment for shipments and financing arrangements. The plan also references Project CargoX, an HKMA initiative intended to strengthen data capabilities across cargo and trade workflows to support financing and related services. Taken together, the effort signals a shift from standalone digital pilots toward interoperable, end-to-end digital rails that can support a wider ecosystem of trade-related financial products.
“We look forward to driving innovative application of digital technology in areas such as cargo trade and finance, promoting joint achievements in digital innovation, exploring a digital infrastructure that links Shanghai and Hong Kong, promoting digitalisation of trade finance.”
The officials framing the MoU emphasized that the collaboration is not merely a theoretical exercise but a milestone in building practical, data-powered digital infrastructure. In remarks from the Shanghai Data Bureau, the partnership was described as a meaningful step toward data-powered, innovation-driven development, with the ambition of creating a secure, efficient, and open digital ecosystem for cross-border trade. By aligning Shanghai’s data capabilities with Hong Kong’s financial services ecosystem, the parties hope to demonstrate how a regulated, standards-based, and transparent approach to data can improve outcomes for traders and financiers alike.
Beyond the cross-border platform itself, the policy dimension of the announcement signals a broader regulatory openness to digital assets as a legitimate investment category. In parallel to the MoU, Hong Kong’s government laid out a policy path to make its tax concessions more attractive to investment funds and family offices by expanding qualifying investments to include digital assets. If the proposal passes through the legislative process, profits from digital assets held within these investment structures could qualify for tax exemptions, subject to approval. This element complements the tech push by creating a more favorable fiscal environment for capital deployment into digital asset strategies, potentially drawing more global fund participants to Hong Kong as a gateway to the region’s digital economy.
Taken together, the announcements reflect a broader regional strategy: to blend cutting-edge digital infrastructure with a clear, asset-backed regulatory framework that can support both traditional finance and newer digital assets. The MoU’s emphasis on data interoperability and risk-aware automation—paired with a thoughtful tax policy—suggests policymakers are seeking a stable yet forward-looking path for the digitization of trade and finance in a way that can be scaled and exported to other markets in the region.
What to watch next
- Progress of pilot deployments or go-live plans for the cross-border platform under Project Ensemble, including milestones and timelines for the joint research program.
- Results and findings from CDI-enabled pilots in trade finance, and how cargo data integrates with eBLs and financing workflows.
- Further details on Project CargoX’s role, timelines for its adoption, and how it interfaces with existing trade-data standards.
- Regulatory and legislative updates on the digital assets tax concessions, including timing of any approvals from the Legislative Council Financial Affairs Committee.
Sources & verification
- Official MoU announcement from info.gov.hk describing the HKMA–SDB–NTICBC collaboration on cross-border trade data and Project Ensemble.
- HKMA – Commercial Data Interchange (CDI) documentation and its role in institutional access to corporate data since 2022.
- HKMA – Project CargoX description for enhancing cargo and trade data capabilities in financing.
- Remarks by Hui Ching-yu on digital asset concessions, including the Legislative Council Financial Affairs Committee meeting (P2026030200210).
Hong Kong–Shanghai cross-border blockchain initiative: what it means for markets and users
The collaboration represents a shift from isolated pilots toward integrated, governance-aligned digital rails that can support a broader set of trade-finance products. By weaving together trade data, electronic bills of lading, and financing tools within a blockchain framework, the partnership seeks to reduce friction in invoicing, risk assessment, and settlement—benefits that could resonate across supply chains and the banks that finance them. The emphasis on using CDI as the backbone for data access underscores a belief in regulated, auditable data flows as a bedrock for confidence in digital trade structures. If successful, the cross-border platform could serve as a model not only for Hong Kong and Shanghai but for other hubs looking to harmonize trade data standards with financial services in a standards-based, interoperable manner.
From a policy standpoint, the digital asset tax concessions reflect a recognition that financial technologies and crypto-adjacent assets are increasingly relevant to institutional investment. While the policy is still subject to legislative approval, the proposal indicates a willingness to create incentives for funds and family offices to allocate to digital assets, potentially accelerating institutional exposure to this broader asset class. The policy, paired with the MoU’s focus on infrastructure, positions Hong Kong as a testbed for regulated digital rails that can support both traditional financing and newer digital-asset strategies, all within a framework designed to promote transparency and governance.
In the broader market context, these developments occur amid growing interest in tokenization, data-centric finance, and cross-border fintech collaboration across Asia. While actual market prices for assets will reflect a multitude of macro and idiosyncratic variables, the signaling value of such coordinated public-private efforts is meaningful: they indicate a pathway toward more efficient trade finance channels, enhanced data privacy and security, and a regulatory posture that seeks to balance innovation with oversight.


Around 46% of BTC, or 9.09m coins, sit at a loss in early 2025, nearing 2022 bear‑market loss concentrations after the 2024–2025 rally unwound.
Summary
- About 9.09m BTC, roughly 46% of the 19.8m circulating supply, are below their last on‑chain transaction price, the second‑highest loss reading since mid‑2022’s ~10m‑coin peak.
- Previous cycle lows saw 50–60% of BTC supply in loss; current levels mirror late‑2022 conditions but at much higher absolute prices, as many 2024–2025 entrants are now underwater.
- CryptoQuant data show net realized profits flipping to net losses since late 2025, with holders realizing up to 69k BTC in aggregate losses, resembling the 2021–2022 bull‑to‑bear transition
Approximately 9.09 million Bitcoin (BTC), representing roughly 46% of the cryptocurrency’s circulating supply, is currently held at a loss as of early 2025, according to data from CryptoQuant.
The figure marks the second-highest loss concentration recorded in CryptoQuant’s dataset spanning from July 2020 through early 2026, falling just below the peak reached during the 2022 bear market.
The BTC Supply in Profit/Loss chart from CryptoQuant displays coins held at a loss as a negative figure, with the current reading of negative 9.09 million coins approaching the deepest loss concentration visible on the chart. That record was set in mid-2022, when approximately 10 million coins were underwater as Bitcoin fell following the Luna and FTX contagion events.
The circulating supply of Bitcoin totals approximately 19.8 million coins, meaning nearly half of all Bitcoin that has moved on-chain is currently held below its last transaction price.
A key distinction separates the current period from the 2022 bear market. While a comparable number of coins were held at a loss during both periods, Bitcoin’s absolute price level remains significantly higher now than in 2022. The current loss concentration reflects holders who entered the market during the 2024-2025 rally and are now underwater, according to the data.
High supply-in-loss readings create specific market dynamics, according to market analysts. Holders facing losses experience pressure to either sell or maintain positions through corrections. Those with the highest cost basis relative to current prices typically exhibit lower conviction in long-term recovery.
The 2022 period provides a historical reference point. The supply-in-loss figure peaked near 10 million coins in late 2022 before declining as the market bottomed and new buying brought coins back into profit. That decline from peak loss concentration preceded the sustained price recovery that extended through 2023 and 2024.
Whether the current 9.09 million coin reading represents a peak depends on price stabilization at current levels or further decline, according to analysts tracking the metric.

Crypto is built on a powerful idea: align incentives correctly, and rational actors will secure the system.
Most protocol design rests on this belief.
But there’s a blind spot few teams model seriously:
What if harming the network is rational — just not within the network itself?
This is the foundation of what we can call crypto griefing markets: situations where actors willingly lose money on-chain because they profit elsewhere.
Not hacks.
Not exploits.
Not rug pulls.
But economically rational sabotage.
Defining Crypto Griefing
In game theory, griefing refers to behavior where an actor accepts a cost in order to impose a cost on others. Traditionally, it’s seen as irrational or malicious.
In crypto, however, griefing can be rational when:
-
The attacker has off-chain exposure (derivatives, venture positions, competitive businesses).
-
The damage creates external financial gain.
-
The cost of sabotage is lower than the external payoff.
The protocol may observe a net loss from the attacker’s wallet.
The attacker sees a net gain across their portfolio.
This distinction is crucial.
Most tokenomic models assume participants optimize within the system. Crypto griefing breaks that assumption by introducing cross-market incentives.
Why Incentive Alignment Breaks Down
Protocols often rely on the principle that:
If attacking costs money, rational actors won’t attack.
This only holds if:
-
Actors are exposed primarily to the protocol’s token.
-
There are no correlated positions elsewhere.
-
There are no strategic non-financial motives.
In modern crypto markets, these assumptions rarely hold.
Large participants often maintain:
-
On-chain token exposure
-
Off-chain derivative positions
-
Venture stakes in competitors
-
Business models dependent on specific governance outcomes
When incentives extend beyond the protocol boundary, alignment becomes fragile.
Common Forms of Economically Rational Sabotage
1. Short-and-Destabilize Strategies
An actor builds a significant short position on a token via centralized derivatives or OTC markets.
They then:
-
Thin liquidity depth through aggressive trading
-
Increase volatility during sensitive periods
-
Trigger liquidation cascades in leveraged markets
-
Amplify panic during narrative inflection points
They may incur direct losses from destabilizing trades.
But if the short position profits significantly from price collapse, the strategy becomes rational at the portfolio level.
From the protocol’s perspective, it appears irrational.
From a cross-market view, it is calculated.
2. Governance Griefing
DAO governance assumes token-weighted voting aligns long-term incentives.
However, voters may:
-
Operate competing protocols
-
Run businesses dependent on alternative outcomes
-
Hold asymmetric exposure elsewhere
A voter might rationally support a proposal that harms token value if it protects off-chain revenue.
The DAO sees a participant voting against their own economic interest.
In reality, they are protecting a broader one.
3. Oracle and Liquidation Engineering
In tightly coupled DeFi systems, small price distortions can cascade.
Actors may:
-
Push thin markets during low-liquidity windows
-
Exploit Oracle update timing
-
Trigger liquidations to create reflexive price drops
-
Profit from correlated positions outside the affected protocol
Even temporary distortions can cause lasting reputational damage.
The attacker does not need perfect control — only sufficient pressure to tip a fragile system.
4. Network Congestion and Launch Sabotage
During high-profile launches, congestion becomes an attack surface.
A competitor or short-exposed fund could:
-
Spam transactions degrade user experience
-
Drive gas prices higher
-
Cause failed transactions during critical moments
-
Create a public perception of instability
The attacker may lose transaction fees.
But if the reputational damage reduces adoption or weakens funding prospects, the indirect payoff may justify the cost.
In narrative-driven markets, perception has measurable economic value.
Why Fully On-Chain Systems Are Especially Vulnerable
Transparency is a core strength of crypto systems.
But transparency also enables precise attack modeling.
On-chain data reveals:
When attack costs are visible, they become quantifiable.
When costs are quantifiable, they become tradable.
Protocols optimize for capital efficiency.
Attackers optimize for cross-market asymmetry.
The protocol sees only the visible ledger.
The attacker sees the entire financial landscape.
Destructive Equilibria in Reflexive Markets
Crypto markets are reflexive: price influences confidence, and confidence influences price.
This creates conditions where:
-
Small shocks cascade into large moves.
-
Liquidity dries up rapidly under stress.
-
Panic spreads faster than fundamentals can correct.
If multiple actors benefit from a downturn — such as through short positions — destructive equilibria can form.
In these scenarios, sabotage doesn’t need to be large. It only needs to initiate reflexivity.
Defensive Design Strategies
While eliminating griefing may be impossible, protocols can reduce vulnerability.
1. Nonlinear Cost Structures
-
Dynamic fee adjustments during congestion
-
Escalating governance deposits
-
Anti-spam economic filters
The goal is to make sabotage costs rise faster than external payoffs.
2. Anti-Reflexive Mechanisms
-
Time-weighted average price (TWAP) oracles
-
Smooth liquidation curves
-
Circuit breakers during extreme volatility
Reducing cascade effects lowers the leverage of small attacks.
3. Governance Hardening
Increasing commitment reduces opportunistic interference.
4. Cross-Market Risk Modeling
This is the most difficult defense.
Protocols must consider:
-
Correlated derivatives markets
-
Concentrated token ownership
-
Competitive industry dynamics
However, off-chain incentives are inherently opaque.
Complete visibility is impossible.
The Emergence of Griefing Risk Markets
If griefing risk becomes measurable, it may also become insurable.
Potential future developments include:
-
Insurance products covering congestion or governance attacks
-
Derivatives tied to network performance degradation
-
DAO treasury hedging strategies against sabotage risk
If hacks created smart contract insurance markets, economic sabotage may create new meta-markets around strategic risk.
Once risk can be priced, it becomes financialized.
Conclusion
Crypto is often described as a system that aligns incentives through code.
But code cannot contain incentives that exist outside its boundaries.
As protocols grow in importance, they become strategic assets.
Strategic assets attract strategic behavior.
Griefing markets do not require criminals.
They require rational actors operating across interconnected markets.
The lesson is not that crypto is broken.
It is that incentive alignment only works within the scope you model.
And in a globally interconnected financial system, that scope may be far smaller than we assume.
REQUEST AN ARTICLE

TLDR
-
Magic Eden discontinues Ethereum & Bitcoin NFT marketplaces, pivoting to Dicey casino platform.
-
Platform maintains Solana NFT packs while eliminating underperforming blockchain integrations.
-
Bitcoin NFT traders will lose API & wallet functionality by early April.
-
Dicey’s closed beta generated over $15M in wagers, driving iGaming strategy.
-
Company pivots toward profitable revenue streams & blockchain gaming experiences.
The NFT marketplace Magic Eden has announced it will discontinue support for Ethereum and Bitcoin NFT trading to prioritize Dicey, its crypto casino platform. Support for EVM and Bitcoin-based marketplaces will cease on March 9. Subsequently, the Bitcoin API will be terminated on March 27, with the Magic Eden Wallet shutting down completely by April 1.
NFT packs—collections of randomized NFTs similar to physical trading card packs—will continue as one of the platform’s remaining offerings. Company leadership indicated this restructuring enables concentration on revenue-generating products while eliminating operational redundancies. The strategic realignment comes as NFT market valuations dipped below $1.5 billion in February. Since the 2021 NFT market peak, trading activity has declined substantially, forcing Magic Eden to reevaluate its strategic direction. Moving forward, the platform will emphasize products that complement its Solana-based foundation.
Scaling Back Ethereum NFT Operations
The platform will terminate all Ethereum NFT functionality, eliminating features associated with EVM chain compatibility. This shutdown impacts trading capabilities, listing functions, and associated marketplace services for Ethereum-based digital collectibles. According to the company, this consolidation enables better resource distribution toward priority offerings like NFT packs and iGaming ventures.
Ethereum-focused operations delivered minimal revenue contribution while demanding substantial operational expenditures. Leadership disclosed that approximately 80% of operational expenses originated from product segments producing just 20% of total revenue. Eliminating Ethereum integration allows the company to emphasize high-performance segments and pursue sustainable expansion.
While discontinuing EVM compatibility, the platform will maintain NFT-focused offerings on Solana. Magic Eden intends to sustain user activity through collectible pack releases and specialized features. This approach emphasizes operational efficiency and revenue generation over extensive multi-chain presence.
Exiting Bitcoin NFTs and Runes Marketplaces
Magic Eden will simultaneously discontinue Bitcoin NFT trading platforms, encompassing both Ordinals and Runes marketplaces, effective March 9. The Bitcoin-focused API infrastructure will be shut down later that month, eliminating all associated platform functionality. The proprietary Magic Eden Wallet will be permanently discontinued on April 1 as this transition concludes.
This withdrawal addresses minimal user adoption and substantial maintenance requirements for Bitcoin NFT offerings. By channeling resources toward Dicey and NFT pack products, Magic Eden redirects investment toward solutions with greater scalability potential. This consolidation enhances the company’s competitive positioning within the developing crypto entertainment landscape.
Users currently trading Bitcoin NFTs must migrate to alternative marketplace platforms for continued asset management. Magic Eden’s priority remains preserving revenue-positive services while eliminating underperforming product lines. The strategic transformation acknowledges current marketplace conditions and evolving user preferences.
Betting on Dicey and Crypto iGaming
The company’s future roadmap centers on expanding Dicey, its blockchain-based casino, alongside launching a cryptocurrency sportsbook for wagering activities. Throughout a two-month limited-access beta period, approximately 200 participants placed over $15 million in total wagers. This platform merges entertainment with financial services, establishing a fresh growth trajectory for Magic Eden.
Leadership views crypto gaming as a sustainable long-term opportunity given diminishing NFT marketplace revenues. Dicey exemplifies Magic Eden’s transformation toward crypto-based entertainment, blending gaming mechanics, betting functionality, and blockchain technology. The platform targets users interested in both digital asset ownership and online gaming participation.
Magic Eden anticipates Dicey will stimulate user engagement while preserving ME token functionality throughout its product ecosystem. NFT packs will persist as an offering, though primary resource allocation will support iGaming platform development. This strategic direction demonstrates the organization’s dedication to revenue sustainability and pioneering blockchain implementations

Food Quality More Important Than Macros For Our Heart Health

Mantle hits $1B market size milestone on Aave: will MNT price explode next?

Michael J. Fox Says His Role in ‘Shrinking’ Was More Than Just Acting Job


-

 Sports7 days ago
Women’s college basketball rankings: Iowa reenters top 10, Auriemma makes history
-

 Politics7 days ago
Nick Reiner Enters Plea In Deaths Of Parents Rob And Michele
-

 Fashion3 days ago
Weekend Open Thread: Iris Top
-

 Business6 days ago
True Citrus debuts functional drink mix collection
-

 Politics4 days ago
ITV enters Gaza with IDF amid ongoing genocide
-

 Tech1 day ago
Unihertz’s Titan 2 Elite Arrives Just as Physical Keyboards Refuse to Fade Away
-
Sports2 days ago
The Vikings Need a Duck
-

 Crypto World6 days ago
XRP price enters “dead zone” as Binance leverage hits lows
-
 NewsBeat2 days ago
Dubai flights cancelled as Brit told airspace closed ’10 minutes after boarding’
-

 Tech6 days ago
Unsurprisingly, Apple's board gets what it wants in 2026 shareholder meeting
-

 NewsBeat5 days ago
Cuba says its forces have killed four on US-registered speedboat | World News
-
 NewsBeat5 days ago
Manchester Central Mosque issues statement as it imposes new measures ‘with immediate effect’ after armed men enter
-
 NewsBeat2 days ago
The empty pub on busy Cambridge road that has been boarded up for years
-

 NewsBeat22 hours ago
‘Significant’ damage to boarded-up Horden house after fire
-

 NewsBeat2 days ago
Abusive parents will now be treated like sex offenders and placed on a ‘child cruelty register’ | News UK
-
 NewsBeat6 days ago
Police latest as search for missing woman enters day nine
-

 Business4 days ago
Discord Pushes Implementation of Global Age Checks to Second Half of 2026
-

 Entertainment5 hours ago
Baby Gear Guide: Strollers, Car Seats
-

 Business4 days ago
Only 4% of women globally reside in countries that offer almost complete legal equality
-
 Tech3 days ago
NASA Reveals Identity of Astronaut Who Suffered Medical Incident Aboard ISS