

Crypto World
Is now the time to buy the dip? A framework, not a cheer


“Buy the dip” is the most-searched, most-repeated, and most-dangerous phrase in crypto during a downturn, and in mid-2026 it is everywhere.
Summary
- More than 10 million BTC sitting at unrealized losses supports the argument that capitulation may be nearing exhaustion.
- Extreme fear and whale accumulation favor buying, but weak ETF demand and hostile macro conditions argue for caution.
- A disciplined decision depends on time horizon, financial resilience, asset quality, and the ability to withstand further declines.
- Dollar-cost averaging reduces timing risk and avoids turning a long-term thesis into an all-in bet on the exact bottom.
With Bitcoin down sharply toward the $60,000 region, the Fear and Greed Index in extreme fear, and on-chain data showing more than 10 million BTC held at a loss, the question dominating crypto searches and group chats is whether now is the moment to buy.
Most of the answers on offer are cheers, “buy the dip” shouted as a slogan by people who want prices to go up, with no framework behind it.
This piece is not that.
It is a decision framework instead of a cheer, built to help you think through whether buying this dip makes sense for you, because the honest answer is that it depends on factors specific to your situation, the actual signals in the market, and a clear-eyed view of what could go wrong.
The phrase “buy the dip” assumes the dip is a dip and not the start of a longer decline, and the entire question is whether that assumption holds.
This piece walks through the real signals pointing both ways, the framework for deciding, and the disciplined ways to act if the answer is yes.
Why “buy the dip” is dangerous as a slogan
Before building the framework, it is worth understanding why the phrase itself is a trap when treated as a slogan rather than a question, because the framing error causes real damage.
“Buy the dip” embeds an assumption that is the entire question in disguise: that what you are looking at is a dip, a temporary decline within a larger uptrend, not the early or middle stage of a sustained bear market.
A dip is a buying opportunity by definition because the price recovers. A bear market is a value trap because the price keeps falling and the buyer catches a falling knife.
The phrase “buy the dip” smuggles in the conclusion that it is a dip, which is precisely what cannot be known in advance, and that is why treating it as a slogan rather than a question is dangerous.
The people cheering “buy the dip” are assuming the answer to the only question that matters.
The danger is compounded by who tends to shout the phrase loudest and when.
“Buy the dip” reaches peak volume during sell-offs, when existing holders, who want prices to recover so their own positions improve, are most motivated to encourage buying, and when the emotional pull to “do something” is strongest.
This is exactly the moment when the assumption embedded in the phrase is most likely to be wrong, because severe declines that prompt loud “buy the dip” chatter are sometimes dips and sometimes the middle of much larger declines.
Buying every dip works in a bull market and is ruinous in a bear market, and the slogan offers no way to tell which environment you are in, which is the only thing that matters.
The history is sobering.
Investors who “bought the dip” in early 2018 or early 2022, when prices had fallen substantially and the phrase was everywhere, often bought into declines that continued for many more months and much lower prices.
Those were not dips but the early stages of bear markets that ran 77% to 84% from the highs.
The same phrase that correctly identified buying opportunities during bull-market corrections destroyed capital when applied indiscriminately to the start of bear markets.
The lesson is not that buying declines is always wrong. It is that “buy the dip” as an automatic reflex, without a framework to distinguish a dip from a bear market, is how people lose money trying to be opportunistic.
The phrase needs to be replaced with a question: Is this a dip, and even if it is, should I buy it?
The signals pointing toward “yes”
A serious framework weighs the real evidence on both sides, and in mid-2026 there are genuine signals suggesting this could be a dip worth buying.
Laying them out honestly is the first half of the decision.
The strongest bullish signal is the on-chain capitulation data, which suggests selling pressure may be exhausting.
By early June 2026, approximately 10.46 million BTC were held at unrealized losses, crossing the threshold above which major macro bottoms have historically formed.
The logic is that when more than 10 million coins are underwater, a vast majority of short-term speculators have been washed out, and selling pressure fundamentally fades because the people who would panic-sell have mostly already done so.
The Short-Term Profit Ratio falling below 1 confirms that short-term holders are selling at a loss, the capitulation pattern that has historically preceded bottoms.
These metrics do not guarantee a bottom, but they are the conditions from which bottoms have formed, which is a genuine point in favor of buying.
The second bullish signal is extreme-fear sentiment, which is a contrarian indicator.
The Fear and Greed Index buried in extreme fear, the record “Bitcoin to zero” searches, and the broad despair are the emotional conditions that have historically marked accumulation opportunities.
Maximum fear has tended to cluster near bottoms more than before further collapses.
Every prior extreme-fear event this cycle marked a buying opportunity for patient investors, and the contrarian logic, be greedy when others are fearful, points toward buying when sentiment is this bad.
The crowd is maximally afraid, and the crowd at its most afraid has historically been wrong about the direction.
The third bullish signal is smart-money behavior and valuation.
On-chain data shows whales, the largest holders, accumulating into the decline while retail capitulates, the classic transfer from weak hands to strong hands that builds bottoms.
Some corporate treasuries continued buying the dip even as ETFs sold.
On valuation, a closely watched metric shows Bitcoin’s market price getting close to its realized fair value after the sell-off, suggesting the price is approaching levels that have historically represented value rather than froth.
Institutional voices such as Bernstein have maintained year-end targets far above current levels, characterizing the drawdown as the “weakest bear case in Bitcoin’s history.”
Smart money is accumulating, valuation is approaching fair value, and credible institutions see substantial upside, all of which support the dip-buying case.
The signals pointing toward “no”
An honest framework gives equal weight to the bearish signals, and in mid-2026 there are real reasons for caution that dip-buying cheerleaders tend to ignore.
This is the second half of the decision.
The strongest bearish signal is that the institutional bid has weakened, which is new and concerning.
When Bitcoin returned to the $60,000 level in June, ETF investors did not buy the dip the way they had in February. Instead, they opted for larger-scale redemptions, with the record 13-day outflow streak draining billions.
This matters because institutional ETF demand was the structural support that cushioned prior declines, and its reversal removes a key buyer at exactly the moment the dip-buying case needs it.
The fact that institutions, with their research and capital, chose to sell instead of buy this dip is a meaningful vote against the bullish thesis.
It also distinguishes this decline from the February sell-off that institutions did buy.
The second bearish signal is the hostile macro environment, which shows no sign of turning.
The Federal Reserve has signaled rates will remain on hold, with markets pricing out meaningful cuts through 2026.
The 10-year Treasury yield remains elevated around 4.43%, suppressing risk appetite, inflation concerns persist, and geopolitical risk from the U.S.-Iran conflict adds pressure.
These are the forces that drove the decline, and none of them has reversed.
Buying the dip into an unchanged hostile macro backdrop means betting that the price recovers despite the conditions that caused the fall still being in place, which is a weaker bet than buying into improving conditions.
The macro that broke the market is still broken.
The third bearish signal is the technical structure and analyst warnings.
The decline broke key support levels, and the market sits at a critical point where the $60,000 level is the line between recovery and a deeper breakdown toward $50,000.
Some analysts characterize the current bounce as a fragile counter-trend rally fueled by short covering rather than a fundamental shift.
Standard Chartered, while bullish over the longer term, warned of a possible dip toward $50,000 before any recovery, and analysts have flagged that losing key support could open the door to lower prices.
Four-year-cycle analysts also point to the possibility of a deeper bottom.
The technical and analytical picture includes credible scenarios where this is not the bottom and meaningful further downside remains.
Buying now therefore risks catching a knife that has not finished falling.
The framework for deciding
With both sides laid out, the actual framework for deciding whether to buy this dip comes down to a set of questions about your situation and discipline, not a market call.
This is the heart of the piece.
The first question is your time horizon, and it is the most important.
If you are a long-term investor with a multi-year horizon who believes in Bitcoin’s structural case, the question of whether this exact moment is the bottom matters far less.
Over a multi-year period, buying somewhere in the zone of extreme fear and deep capitulation has historically been rewarded, even if the buyer does not identify the exact low.
If you are a short-term trader hoping for a quick bounce, the question is entirely different and far harder.
The fragile-counter-trend-rally warnings and deeper-downside scenarios mean a short-term buy could easily be underwater quickly.
The same dip can be a buy for the long-term investor and a trap for the short-term trader, so the first thing the framework demands is honesty about which one you are.
The second question is whether you can afford to be wrong.
Buying the dip means accepting that the price could fall further, potentially much further, before any recovery.
Even in the bullish case, analysts warn of a possible move toward $50,000 first, and in the bearish case, the downside is larger.
The disciplined buyer only deploys capital they can afford to see decline substantially and hold through, without being forced to sell at a loss by financial pressure or emotional panic.
If a further 20% or 30% decline would force you to sell or cause unbearable stress, you cannot afford to buy this dip regardless of how attractive the signals look.
You would likely capitulate at the worst moment.
The framework requires matching position size to your genuine ability to withstand being wrong.
The third question is whether you have a plan that removes emotion from execution.
The worst way to buy a dip is impulsively, in a single lump, driven by the fear of missing the bottom, because that maximizes the damage if you are early.
The disciplined approach is dollar-cost averaging, buying in planned increments over time, which accepts that you will not identify the exact bottom in exchange for not betting everything on a single timing call.
By spreading purchases across the zone of extreme fear and capitulation, you ensure you participate if this is the bottom while limiting the damage if it is not.
It also removes the emotional pressure of trying to time the precise low.
The framework strongly favors a planned, incremental approach over an all-in timing bet, because the honest truth is that no one, including analysts on both sides, knows exactly where the bottom is.
The mistakes dip-buyers make
Beyond the decision of whether to buy, the framework is incomplete without understanding the specific mistakes that turn dip-buying from a sound strategy into a destructive one.
Most of the damage comes from execution errors rather than from the decision itself.
The first and most common mistake is going all-in at once, driven by the fear of missing the bottom.
A dip-buyer who deploys all available capital in a single purchase is making a precise timing bet: that this exact price is the bottom.
That is the one thing the framework establishes cannot be known.
If the buyer is early, which is likely given that bottoms are zones rather than points and bear markets can last months, there is no capital left to buy lower.
The buyer is immediately underwater and maximally exposed to the emotional pressure to panic-sell if the decline continues.
The all-in dip buy converts a sound long-term thesis into a fragile short-term timing bet, and it is the single most destructive thing a dip-buyer can do.
The discipline of buying in increments exists precisely to avoid this error.
The second mistake is buying with money you cannot afford to hold through further declines.
Dip-buyers frequently deploy capital they need in the near term, or capital whose loss they cannot emotionally tolerate, on the assumption that recovery will be quick.
When the decline continues, as it often does, they are forced to sell at a loss by financial necessity or driven to panic-sell by stress.
That locks in exactly the loss they were trying to avoid and produces capitulation at the worst moment.
The framework’s requirement to deploy only capital you can afford to be wrong about, and to hold through, exists to prevent this.
A dip-buyer who can hold survives being early. A dip-buyer who cannot hold is destroyed by it.
Buying the dip with the wrong money turns a survivable mistake into a fatal one.
The third mistake is abandoning the quality filter in the hunt for the biggest bargains.
During a crash, the assets that have fallen the most look like the biggest opportunities, but the largest declines often belong to the weakest projects that will not recover.
The altcoin devastation of 2026 and stress across individual ecosystems illustrate the risk.
Dip-buyers who chase the most beaten-down names, reasoning that they have the most upside, frequently buy assets falling for fundamental reasons that will keep falling or die entirely.
The discipline of concentrating dip-buying on quality assets with the staying power to survive a bear market and participate in the recovery separates productive dip-buying from catching falling knives in names that never bounce.
The biggest discount is not necessarily the best opportunity.
The best opportunity is a quality asset at a discount, which is a different thing.
The through-line of all three mistakes is that they substitute emotion and greed for discipline.
Going all-in is greed and fear of missing out. Buying with the wrong money is impatience and overconfidence. Chasing the biggest losers is greed for maximum upside.
The framework’s antidotes—increments, affordable capital, and a quality filter—are all forms of imposing discipline on the emotional pull that a crash creates.
Dip-buyers who perform well are not the ones who time the bottom perfectly, which is impossible.
They are the ones who execute with discipline regardless of where the bottom turns out to be, which is entirely within their control.
Whether to buy the dip is a judgment call the framework helps you make. How to buy it is a discipline the framework demands, and the second matters as much as the first.
How to act if the answer is yes
For those whose answers to the framework questions point toward buying, the final piece is disciplined execution, because how you buy matters as much as whether you buy.
The core principle is to accept that you will not time the bottom and to build that acceptance into your approach.
The on-chain signals—the more than 10 million coins at a loss, the SOPR below 1, whale accumulation, and the approach toward realized value—suggest the market is in the zone where bottoms form.
However, a zone is not a point, and prices can fall further or move sideways for an extended period before recovering, as bear markets historically last eight to twelve months.
The disciplined buyer treats the current period as an accumulation zone to buy through gradually, not a single moment to buy all at once.
That is the practical application of the dollar-cost-averaging discipline the framework demands.
You are buying a range, not a bottom.
The second principle is to focus on quality and respect that some assets falling in the crash will not recover.
The contrarian, buy-when-fearful logic applies most reliably to high-quality assets with durable fundamentals and the structural staying power to survive a bear market and participate in the eventual recovery.
Buying the dip indiscriminately, treating every fallen token as a bargain, ignores that bear markets permanently kill weaker projects.
The framework’s quality filter means concentrating any dip-buying on the assets most likely to be there for the recovery, not the most beaten-down names, which are often beaten down for reasons.
The honest synthesis, and the answer to the question the title poses, is that whether now is the time to buy the dip truly depends.
The framework is the way to decide, not the cheer.
The signals are genuinely mixed.
On-chain capitulation, extreme fear, whale accumulation, and the approach toward fair value point toward a dip worth buying.
The weakened institutional bid, hostile and unchanged macro conditions, and credible deeper-downside scenarios point toward caution and the risk of catching a falling knife.
For a long-term investor who can afford to be wrong, who buys quality, who deploys capital gradually through the zone rather than all at once, and who can hold through further declines without being forced to sell, the framework supports buying this dip as part of disciplined accumulation.
That conclusion comes with full awareness that the exact bottom cannot be timed and further downside is possible.
For a short-term trader hoping for a quick bounce, the framework advises far more caution because the fragile-rally and deeper-downside scenarios make the short-term bet substantially riskier.
The phrase “buy the dip” offers a slogan. The framework offers a decision, and the decision is yours to make based on your horizon, capacity to be wrong, and discipline, not on the volume of the cheering.
The right question is never simply, “Is it time to buy the dip?”
It is: “Is this a dip I can afford to be wrong about, bought in a way that survives being early?”
Only you can answer that.
This article is for informational purposes and does not constitute financial or investment advice. Cryptocurrency markets are highly volatile. The figures and analysis described reflect data available as of June 2026. Always do your own research and consult with qualified financial professionals before making investment decisions.


The U.S.-Iran peace deal reached over the weekend provided the stimulus many markets had been waiting for.
Oil fell more than 4% on news the Strait of Hormuz would reopen, copper jumped. MSCI’s broadest index of Asia-Pacific shares rallied 3% and Japan’s Nikkei 225 hit a record high.
Crypto markets, however, posted muted gains after the announcement, with the CoinDesk 20 Index (CD20) little changed since midnight UTC. The measure, however, is 2.4% higher over 24 hours.
Bitcoin held below $66,000, barely moving since midnight after adding 3.4% over the weekend. Ether’s (ETH) performance mirrored its larger peer. The biggest gains came in the smaller altcoins, with the CoinDesk 80 Index adding 1.5% since midnight.
The crypto market, reacting to geopolitics in the absence of industry-specific catalysts, has learned to distrust this particular headline. A ceasefire in April collapsed. U.S. strikes broke another truce on June 9. Both times, bitcoin gave back the relief rally. Today, traders appear not to be prepared to pay for an agreement that won’t be signed until the end of the week.

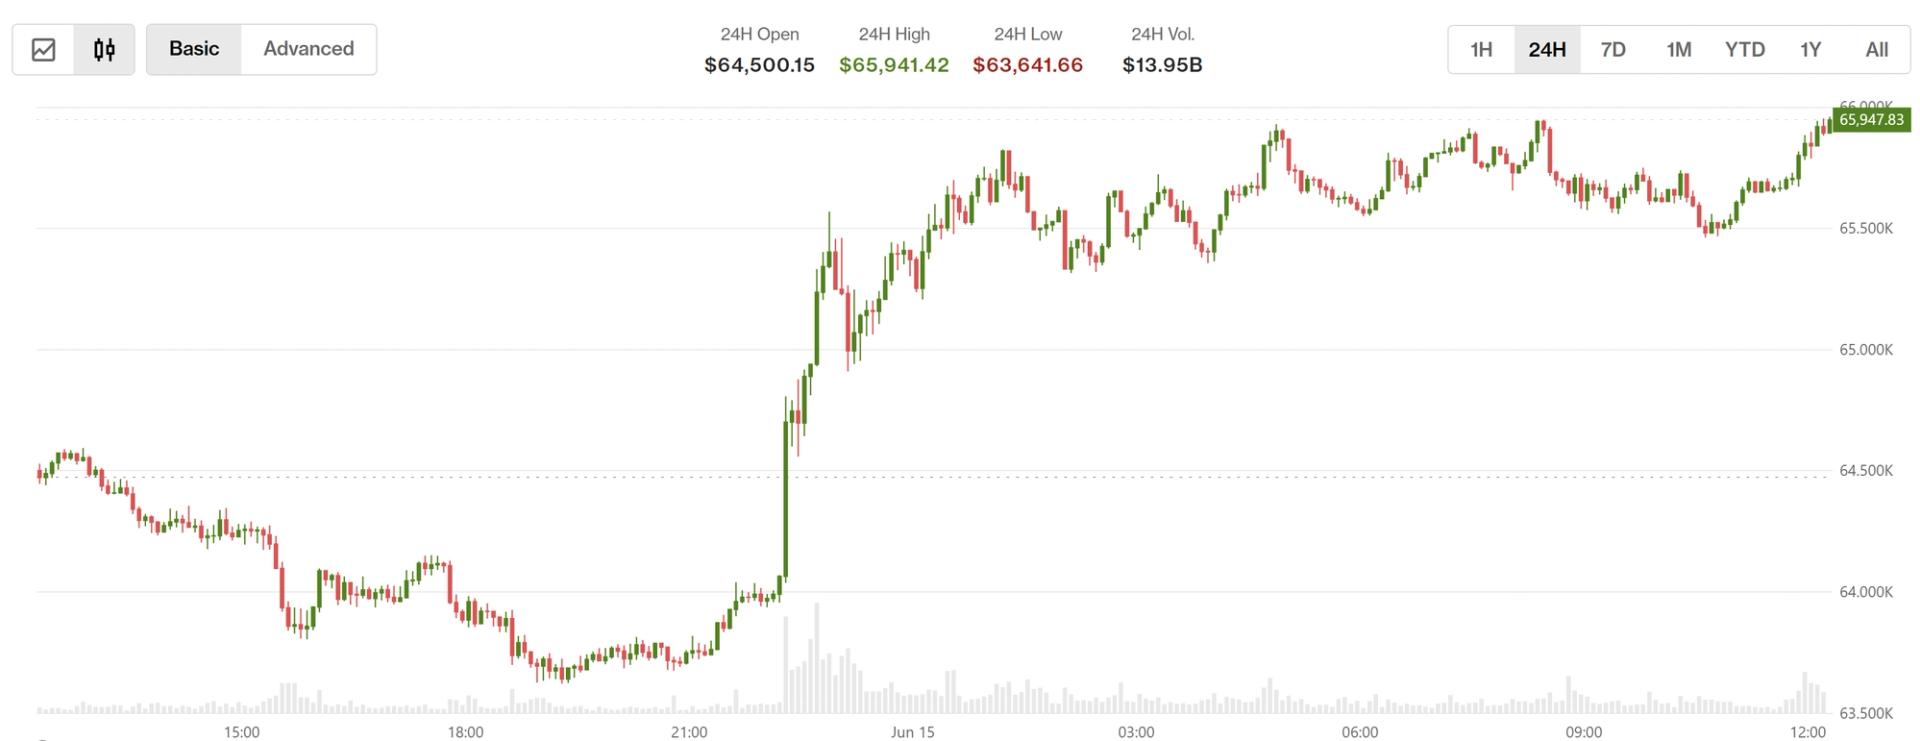
Bitcoin price is back above $65,000, gaining more than $3,000 in a day, although Washington helps, news from the other side of the world threatens the bullish prediction. The Bank of Japan is widely expected to raise its benchmark rate to 1% tomorrow, and the decision carries real tail risk for BTC.
What happens in Tokyo could determine if Bitcoin holds its current range or revisits the pre-June levels.
— Coin Bureau (@coinbureau) June 15, 2026
 BREAKING: JAPAN'S NIKKEI HITS NEW ATH RECORD 69,700
Nikkei just posted its largest one-day market cap gain in years, adding over $465 BILLION in a single session.
All eyes on the BOJ as its last four rate hikes triggered global market selloffs, with a fifth widely expected… pic.twitter.com/8WGE3SQARP
Leveraged funds have stacked speculative yen short positions to over 115,000 contracts as of the week, the highest since November 2017, per CFTC data. Analysts are flagging a 20–30% Bitcoin decline if tightening signals trigger a sharp short squeeze, forcing an unwind of yen-funded carry trades that have quietly underwritten risk appetite across global markets for years.
Polymarket odds on a December BOJ hike sit near 98%; it’s a near-certain event with uncertain magnitude.
The carry trade channel is the direct transmission mechanism: investors borrow cheap yen, deploy into higher-yielding risk assets including crypto, and reverse the entire position when the yen strengthens.
Discover: The Best Crypto to Diversify Your Portfolio
Bitcoin Price Prediction: BOJ Tightening Pressure Mounts?
Bitcoin’s technical structure is not doing it any favors heading into the decision. Price just broke upward, but the blood might not be over. The $70,000 zone that was supposed to act as a floor has already been breached on a spot basis weeks ago, shifting that level to immediate resistance.
Key levels to watch are if a daily close below $63,000 opens the door to the $60,000 structural support band. Lose that, and under $60,000 becomes the next logical destination. On the upside, bulls need to reclaim $68,000with volume to neutralize near-term bearish momentum — without that, any relief rally is just noise.

However, for bulls, if BOJ hikes as priced but delivers dovish forward guidance, yen shorts could absorb the move gradually for Bitcoin to reclaim $70,000, then target $72,200. The July 2024 precedent is instructive: BTC dropped from ~$65,000 to $50,000 within a week of that BOJ decision.
Some technicians see long lower wicks and reduced forced liquidations as evidence of dip-buying — base-building rather than breakdown. That read is contingent on macro staying quiet, which is exactly the variable currently in play.
Discover: The Best Token Presales
Bitcoin Hyper Targets Early Mover Upside as Bitcoin Tests Key Levels
Spot BTC exposure into a BOJ event with 115,000 stacked yen shorts is a risk management conversation as much as a trading one. Traders rotating out of near-term BTC volatility are looking at asymmetric alternatives. The one gaining traction in that context is infrastructure-layer exposure rather than pure price beta.
Bitcoin Hyper ($HYPER) is positioning itself as the first Bitcoin Layer 2 with full Solana Virtual Machine (SVM) integration, a meaningful technical distinction that claims sub-Solana latency while preserving Bitcoin’s security model.
The presale has raised $32 million at a current price of $0.0136, with staking already live for early participants. The core pitch is practical: Bitcoin’s transaction speed and programmability limitations are genuine constraints on ecosystem growth, and an SVM-powered L2 with a decentralized canonical bridge addresses all three slow finality, high fees, and lack of smart contract functionality in one architecture.
Earlier coverage of the project noted Bitcoin consolidating at comparable price levels while HYPER’s rise gained momentum.
Research Bitcoin Hyper before the presale closes.
The post Bitcoin Price Prediction: Bank of Japan Rate Hike and Piling Yen Shorts Threaten BTC appeared first on Cryptonews.
Crypto World
This Week’s Market Catalysts: Fed Meeting, SpaceX (SPACEX) Debut, and U.S.-Iran Peace Agreement

Key Highlights
- An interim peace agreement between Washington and Tehran will be formally executed Friday in Switzerland
- SpaceX launched on public markets at $150 per share, achieving a historic $2.1 trillion valuation
- Federal Reserve Chair Kevin Warsh presides over his inaugural policy meeting Wednesday; no rate change anticipated
- Consumer price growth reached a three-year peak in May, creating policy challenges for the central bank
- Anthropic executives scheduled for White House discussions regarding discontinued advanced AI systems
Washington and Tehran have finalized an interim peace framework that may conclude over three months of hostilities. The diplomatic agreement will be formally executed in Switzerland this Friday. Pakistani Prime Minister Shehbaz Sharif verified that both countries have announced an immediate cessation of military activities across all theaters, including Lebanese territory.
President Trump indicated the agreement will facilitate the reopening of the Strait of Hormuz, a critical maritime corridor for global petroleum transport. Approximately 20% of worldwide oil shipments traversed this waterway prior to conflict eruption in late February. Trump noted a temporary postponement attributable to naval mine removal operations, projecting the strait will resume operations Friday.
Crude oil valuations declined following the announcement. International equity markets experienced gains. However, market observers caution that complete energy sector normalization will require extended timeframes. Rystad Energy calculates the confrontation has already eliminated one billion barrels from global supply, with projections suggesting this figure could approach two billion by year’s conclusion.
Warsh Assumes Federal Reserve Leadership Role
Wednesday represents Federal Reserve Chair Kevin Warsh’s inaugural Federal Open Market Committee session since his May 22 oath of office. Market participants broadly anticipate interest rates will remain unchanged.
Inflationary pressures persist at elevated levels. May’s consumer price index registered its steepest acceleration since 2023. Producer price metrics reached their most significant rate since November 2022. Employment figures have similarly exceeded forecasts across multiple consecutive months.
Warsh has historically advocated against excessive specificity in forward policy guidance. This methodology may heighten market responsiveness to incoming economic indicators in subsequent periods.
President Trump has advocated for rate reductions. Nevertheless, economists emphasize current economic conditions bear little resemblance to circumstances surrounding the Fed’s previous easing cycle. Several strategists have identified artificial intelligence capital expenditure as a potential contributor to near-term inflationary dynamics, further complicating policy deliberations.
Vital Knowledge analysts project Wednesday’s statement will eliminate references to the Fed’s easing inclination. They suggest Warsh might still adopt accommodative messaging during his press briefing if he connects prospective rate cuts to successful Iran diplomatic resolution.
SpaceX Achieves Unprecedented Market Milestone
SpaceX commenced trading on the Nasdaq exchange last Friday, debuting at $150 per share. This represented an 11% premium above its $135 initial offering price. Share value appreciated approximately 20% during the trading session.
The aerospace manufacturer’s market capitalization reached approximately $2.1 trillion, positioning it among America’s most valuable publicly traded corporations. The offering mobilized more capital than any previous public market transaction in financial history. Elon Musk achieved trillionaire status for the first time in the contemporary economic era as a consequence.
Retail market participants acquired $117.6 million in shares during the inaugural trading day exclusively. Market analysts have identified potential price instability ahead attributed to SpaceX’s limited public float and elevated valuation metrics.
Musk announced Sunday that SpaceX could potentially achieve $1 trillion in annual revenues by 2030. The enterprise generated $18.7 billion throughout 2025.
SpaceX’s public market debut may additionally indicate robust investor demand for additional large-scale technology offerings. Anthropic, the artificial intelligence venture responsible for Claude, recently submitted confidential IPO documentation. Senior Anthropic personnel are scheduled to convene with White House representatives this week. These discussions seek to address a disagreement that compelled the organization to discontinue its most sophisticated AI models on a global basis.
The Bank of Japan is similarly projected to increase rates to levels unseen in over three decades Monday evening, while the Bank of England is forecast to maintain its 3.75% benchmark Thursday.


Key Takeaways
- SpaceX launched on public exchanges with a market valuation of $2.1 trillion, securing its position as the sixth-largest U.S. company by market capitalization
- Prominent investor Anthony Pompliano issued a public appeal for Elon Musk to consolidate Tesla and SpaceX under one corporate umbrella
- Wall Street analyst Dan Ives from Wedbush estimates an 80% probability of a Tesla-SpaceX combination materializing
- SpaceX’s public offering documents contain language suggesting potential major equity-related transactions ahead
- Gwynne Shotwell, SpaceX’s Chief Operating Officer, acknowledged that combining the companies might simplify Musk’s operations
Space Exploration Technologies set its initial public offering price at $135 for each share. During its inaugural trading session, the stock surged to a peak of $176.52 before settling at $160.95—representing an impressive 19% jump.
Space Exploration Technologies Corp., SPCX
This opening-day rally pushed SpaceX’s market capitalization to approximately $2.1 trillion. The valuation now exceeds Tesla’s current market worth of about $1.52 trillion.
The market debut immediately positioned SpaceX among the top six most valuable corporations with public listings in America.
Major Investor Makes Public Merger Appeal
Entrepreneur and investment figure Anthony Pompliano seized the IPO occasion to directly address Elon Musk with a consolidation proposal.
“As someone who owns Tesla stock, I’m hoping Elon Musk brings Tesla and SpaceX together as quickly as feasible,” he posted on the social platform X. “Let us invest in a single entity behind this era’s most innovative business leader.”
Pompliano’s reasoning is uncomplicated. Musk’s commercial ventures currently encompass electric transportation, aerospace operations, artificial intelligence, automated machinery, and digital platforms. Shareholders presently need to purchase separate equity positions to gain comprehensive exposure to his ecosystem.
A consolidated entity would enable investors to support Musk’s complete business portfolio with one stock purchase.
Wall Street Voices and Company Executives Comment
Dan Ives, an analyst at Wedbush, stated last month that he believes there’s roughly an 80% likelihood of a Tesla-SpaceX corporate combination. He maintains that the operational connections among Musk’s ventures are already taking shape.
Gwynne Shotwell, who serves as SpaceX’s president and chief operating officer, took the discussion a step further during a CNBC interview, suggesting that such a merger could streamline Musk’s management responsibilities. Her remarks carried particular weight since they originated from within SpaceX’s executive ranks.
Walter Isaacson, author of Musk’s authorized biography, has similarly highlighted possible synergies between the two corporations.
Investor Ross Gerber has floated the idea that any transaction would more likely resemble SpaceX acquiring Tesla rather than an equal partnership structure.
Regulatory Filing Hints at Major Moves
SpaceX’s S-1 regulatory document contained cautionary language informing investors that the company might issue additional shares related to upcoming business transactions. Market observers widely interpret this disclosure as an indication that significant corporate activity could be forthcoming.
Musk has demonstrated a pattern of combining his various business interests. Earlier in 2025, he integrated X into xAI. Subsequently, SpaceX purchased the merged entity during February through an equity-based transaction.
A Tesla-SpaceX combination would represent a substantially bigger and more intricate undertaking, considering both corporations maintain distinct shareholder bases, management frameworks, and financing requirements.
Tesla’s stock finished Friday’s session at $406.43, reflecting a 1.74% increase, though it dipped marginally during extended trading hours.
- The Dogecoin price sits in a tight range after a recent rebound.
- Analysts note compression near an apex zone seen before past breakouts.
- Key levels to watch for the next move are the $0.085 support and the $0.092 resistance.
The Dogecoin price is moving within a tight range after several days of mixed momentum, with price action clustering around a level that traders are now watching closely.
At the time of writing, DOGE was priced near $0.0886, moving between an intraday low of $0.0857 and a high of $0.0890.
Notably, the range has narrowed compared to earlier swings, a structure often described by market participants as price compression.
Over the past 24 hours, DOGE has gained about 1.6%, while its short-term trend shows mild strength with a 3.4% increase over the past week.
Despite that, the broader picture remains uneven. The meme coin is still down roughly 20% over the past 30 days and nearly 50% over the past year, reflecting a market that has struggled to sustain longer-term upside momentum.
Dogecoin price tightens near long-standing support band
The current trading structure places Dogecoin price in a narrow band between $0.085 and $0.089, an area that has repeatedly acted as both support and resistance in recent sessions.
Bulls have consistently stepped in near the lower edge of this zone, particularly around $0.0850–$0.0855, preventing deeper breakdowns.
At the same time, upside moves have repeatedly stalled just under $0.089–$0.090, creating a compressed structure where neither buyers nor sellers have gained full control.
This tightening range has led analysts to describe the setup as a potential “apex zone,” where volatility typically contracts before a larger directional move.
The importance of the $0.085 level has been highlighted by several short-term reactions.
Each time the Dogecoin price approached this area, buying pressure returned, pushing DOGE back toward the mid-range near $0.088.
On the upper side, resistance around $0.0905 remains a key level that has not yet been convincingly broken.
The technical structure mirrors past breakout formations
The current setup has drawn comparisons to previous Dogecoin price cycles where prolonged compression preceded sharp expansions.
In earlier market phases, particularly during the 2020–2021 period, DOGE traded in tightening structures before breaking into extended rallies that pushed the memecoin’s price toward its all-time high of $0.7316, reached on May 8, 2021.
A similar pattern is being observed again by technical analysts tracking longer-term formations.
Market analysts note that the Dogecoin price recently rebounded from the $0.0850 zone, briefly moving above $0.0870 and reclaiming short-term momentum indicators such as the 100-hour moving average.
The resistance identified in the current structure includes $0.0920, which has acted as a rejection point in prior moves.
A sustained break above that level would open the path toward $0.0950 and potentially the psychological $0.1000 region, where trading activity typically increases.
On the downside, failure to maintain support at $0.0850 could expose lower levels around $0.0820 and $0.0800, zones that previously acted as consolidation areas during earlier declines.
Another perspective comes from Tardigrade, who describes DOGE as retesting the apex of a long-term triangle formation.
According to Tardigrade, similar compression phases in previous cycles were followed by rapid expansions once the price broke out of the narrowing range.
The current retest suggests that volatility has been steadily declining, a condition often associated with breakout setups rather than trend continuation.
$Doge/monthly (Heikin Ashi)#Dogecoin just retested the apex of the triangle — and it’s ready to send.
2017: Triangle compression → Apex retest → Parabolic rally
2020: Triangle compression → Apex retest → Parabolic rally
2026: Triangle compression → Apex retest → ?The… pic.twitter.com/dfQNqMynbE
— Trader Tardigrade 🧬 (@TATrader_Alan) June 14, 2026
What to watch out for
With DOGE trading near $0.088, the market remains positioned between a well-defined support base and a ceiling that has repeatedly capped upside attempts.
The compressed structure, combined with repeated tests of both boundaries, has created a technical environment where a decisive move is increasingly expected.
The next directional signal is likely to come from a clean break outside the $0.085–$0.092 range.

Hyperliquid traded near $67 on June 15, according to crypto.news price data, after gaining more than 9% in 24 hours.
Summary
- HYPE traded near $67 after gaining more than 9% in 24 hours, crypto.news data showed.
- Ali Martinez said $65 remains key resistance; losing $54 would confirm HYPE’s bearish structure.
- ETF inflows and open interest rose, but RSI and MACD still show mixed momentum.
The token also rose more than 9% over seven days and more than 63% over the past month, keeping HYPE among the strongest large-cap crypto movers.
The latest move placed HYPE close to its June 2 all-time high of $75.48. Market data showed 24-hour volume near $871 million, while market capitalization stood near $14.9 billion. Hyperliquid held the No. 10 market rank, with a fully diluted value near $64 billion.
That rebound followed a sharp pullback from the early June peak. The token had dropped toward the mid-$50 area before buyers pushed it back into the $60 to $67 zone. This makes the current range important because it sits between recent support and the right-shoulder area flagged by analysts.
HYPE $65 resistance remains the key level
Crypto analyst Ali Martinez said HYPE is forming what looks like the right shoulder of a head-and-shoulders pattern.
“For now, $65 is the key resistance level,” he wrote. “Lose $54, and the bearish pattern would be confirmed.”
The four-hour chart places the left shoulder near the mid-$60 range, the head around $75.63, and the right shoulder below the same resistance area. This shows that buyers have not yet reclaimed the previous high after the drop from the head.
Price has recently traded near and above the $65 area, but traders still need to see whether it can hold that zone. A clean move above $65 would weaken the bearish setup and shift attention back toward the upper range.
The main support level remains near $54.61. If sellers push HYPE below that level, the chart would confirm the bearish pattern. The next downside levels marked on the setup sit near $48.14 and $40.66.
ETF inflows and derivatives activity rise
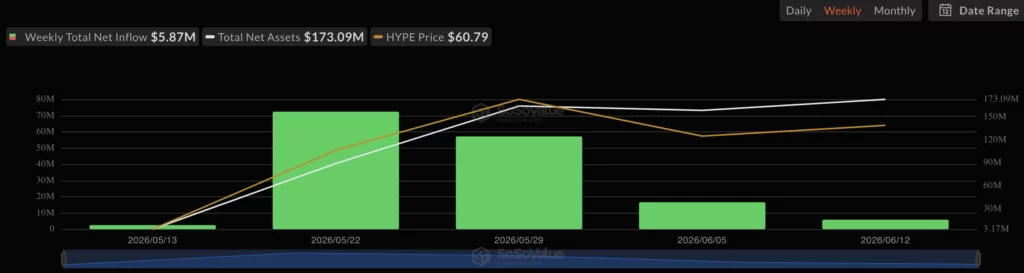
HYPE also drew new market activity through fund flows and derivatives. SoSoValue data showed HYPE spot ETFs recorded about $5.87 million in net inflows during the week from June 8 to June 12. Bitwise BHYP led the flows, while Grayscale HYPG also added inflows.
Coinglass data showed HYPE derivatives volume rising 69.69% to $3.61 billion. Open interest rose 11.36% to $2.86 billion. Rising open interest can point to stronger trader participation, but it can also raise liquidation risk when price moves fast.
Recent crypto.news coverage showed that derivatives interest had already been rising before the latest move. Kalshi launched CFTC-regulated HYPE perpetual futures for U.S. traders, while HYPE futures open interest climbed 10.7% to $2.48 billion at the time and moved above XRP.
Separately, Coinbase activated Hyperliquid’s USDC treasury after becoming the official USDC deployer for the network. That update came as Hyperliquid ecosystem activity expanded, with USDC serving as collateral for HIP-3 and HIP-4 markets.
These updates kept HYPE in focus as traders watched whether new products could support deeper liquidity.
Spot flow data also turned positive in the latest visible reading. Around June 15 at 03:00, HYPE showed about $2.32 million in netflow while trading near $67.31. Recent green bars showed stronger activity after several red outflow periods.
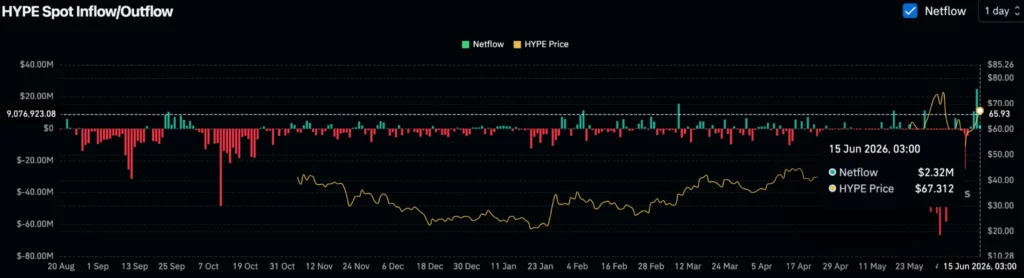
The flow picture remains mixed. Positive netflow can support price when it reflects buying demand. It can also show more tokens moving into spot platforms. For that reason, traders may watch whether price holds above $65 after the new activity.
Momentum signals stay mixed
Technical indicators show recovery, but not a clear bullish reset. The RSI stood at 58.74, while its moving average was around 54.89. This keeps RSI above the neutral 50 level and shows buyers still have momentum.
Even so, RSI has cooled from the recent overbought zone. That means momentum remains positive, but it has slowed from the strong rally that pushed HYPE near record highs. A fresh move above the recent high zone would make the bullish case stronger.
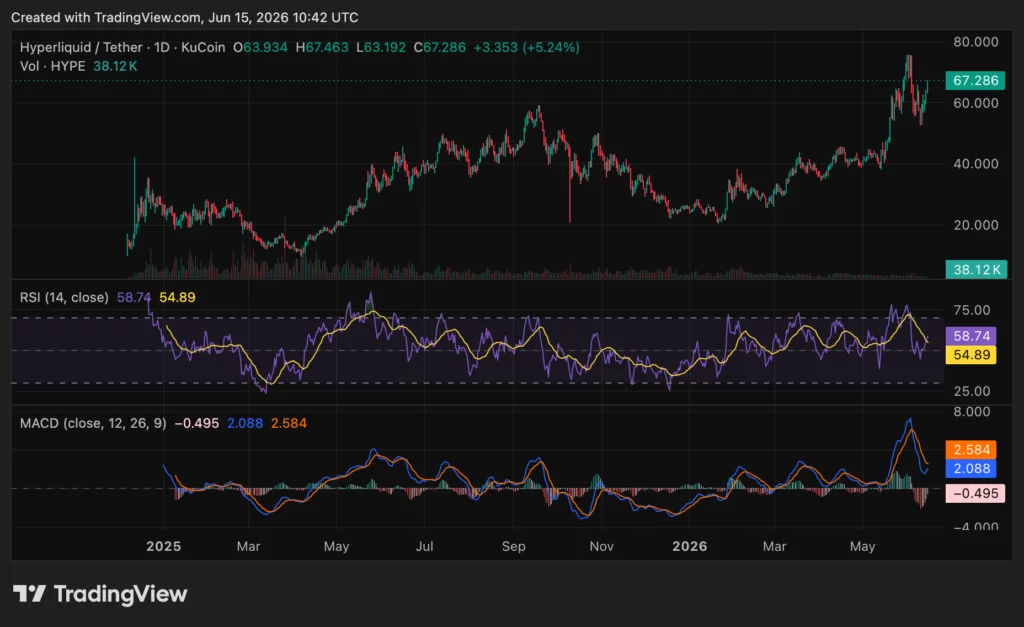
The MACD shows short-term weakness. The MACD line was near 2.088, below the signal line at 2.584, while the histogram was slightly negative at about -0.495. This points to softer momentum after the recent surge, even though price remains elevated.
For now, HYPE price analysis centers on two levels. A move above $65 that holds could weaken the head-and-shoulders risk and bring the all-time high back into view. A break below $54 would confirm the bearish structure and raise the risk of deeper consolidation.
Disclosure: This article does not represent investment advice. The content and materials featured on this page are for educational purposes only.
Aztec Labs says a deprecated DeFi platform, Aztec Connect, was drained of roughly $2.1 million in crypto after an attacker exploited a flaw tied to the way the protocol verified and settled transactions on Ethereum. The issue appears to have targeted the bridge-era contract logic rather than the live Aztec Network.
According to Aztec Labs’ update on X, the transfers were conducted from Aztec Connect’s smart contract, and the company said the incident did not impact users or assets on the current Aztec network. Still, the event adds to a broader pattern of this month’s exploit activity across decentralized finance.
Key takeaways
- Aztec Connect—deprecated since March 2023—lost about $2.1 million after an attacker abused its transaction verification and Ethereum settlement logic.
- BlockSec said the exploit stemmed from a mismatch between “verified” transaction inputs and the set enforced by the ZK proof, enabling unbacked balances.
- The attacker reportedly withdrew funds multiple times across seven different assets, including 909 ETH and 270,000 DAI.
- Aztec Labs stated it holds no admin keys and cannot pause or upgrade the system, and developers described Aztec Connect contracts as effectively immutable.
- The incident follows other large June compromises, including a reported $30 million loss tied to Humanity Protocol and $8 million from a Syscoin bridge exploit.
What happened to Aztec Connect
Aztec Labs posted on X that it was investigating a potential exploit affecting Aztec Connect. The company said approximately $2.1 million was moved from the platform’s smart contract, while the active Aztec network—its current privacy-focused layer-2 ZK rollup on Ethereum—was not affected.
Crypto security firm BlockSec later described the mechanics behind the exploit. In its analysis, BlockSec said an attacker took advantage of how Aztec Connect verified transactions and how those transactions were settled on Ethereum. The core problem, according to BlockSec, was a mismatch in binding: verified transactions on the Aztec Connect contract were “not effectively bound” to the transaction set enforced by the ZK proof.
A verification-versus-settlement mismatch enabled unbacked withdrawals
BlockSec explained that this gap allowed the verification path and settlement logic on Ethereum to “interpret the transaction list differently.” In practical terms, that created a path where the contract could credit value for transactions that were not validated on Ethereum in the way the settlement logic expected.
Once the attacker introduced transactions that resulted in unbacked balances, those balances could be withdrawn. BlockSec said the exploitation occurred seven times across seven different assets, suggesting the attacker used repeatable steps to drain multiple token balances rather than relying on a single one-off failure.
The assets reported as stolen include 909 Ether (ETH), 270,000 Dai (DAI), 167 wrapped staked Ether (wstETH), and several other cryptocurrencies. A related breakdown posted by CertiK on X referenced the scope of the stolen assets.
Why a deprecated bridge contract still matters
Aztec Connect was the earlier bridge version of Aztec’s system, launched in 2022. Aztec Network is now described as a privacy-focused layer-2 ZK rollup on Ethereum, with Aztec Connect representing the prior generation of tooling.
Aztec Connect was deprecated in March 2023, with deposits halted as the team directed efforts toward the next-generation Aztec Network. However, Aztec Labs maintained that it did not have control over the compromised component: the company stated it “holds no admin keys or control over the system,” adding that it cannot pause or upgrade it.
Independent developer “Param” also said the Aztec Connect smart contracts became “fully immutable,” reinforcing the idea that once the bridge logic was retired, it could not be patched or stopped in response to later threats.
That distinction is important for investors and builders: even when a protocol is deprecated and deposits are halted, the remaining on-chain code and balances can still attract attackers—particularly if the contract cannot be upgraded or paused. In this case, an exploit surfaced more than a year after deprecation, illustrating how long-lived smart contract artifacts can remain security liabilities.
Broader exploit pressure in June
This Aztec Connect incident lands amid heightened exploit losses across DeFi. DeFiLlama data referenced in coverage points to at least $44 million stolen so far in June from 12 other exploits.
Earlier in the month, the largest loss highlighted was a reported $30 million suffered after a private key compromise on the Humanity Protocol on June 8. The day before, a Syscoin Bridge exploit reportedly resulted in $8 million stolen through a fake proof mechanism.
While each incident stems from different technical failures, the pattern is consistent: attackers continue to find weaknesses across both active and legacy contracts, and even well-known ecosystems can remain exposed through older infrastructure.
What to watch next
For users and DeFi operators, the main question is whether Aztec Labs will be able to offer any practical mitigation beyond investigation—especially given its claim that it cannot pause or upgrade the affected system. More broadly, readers should watch for additional forensic disclosures on the exact transaction-binding failure described by BlockSec, and whether the exploit pattern points to similar design risks in other retired bridge-era contracts.
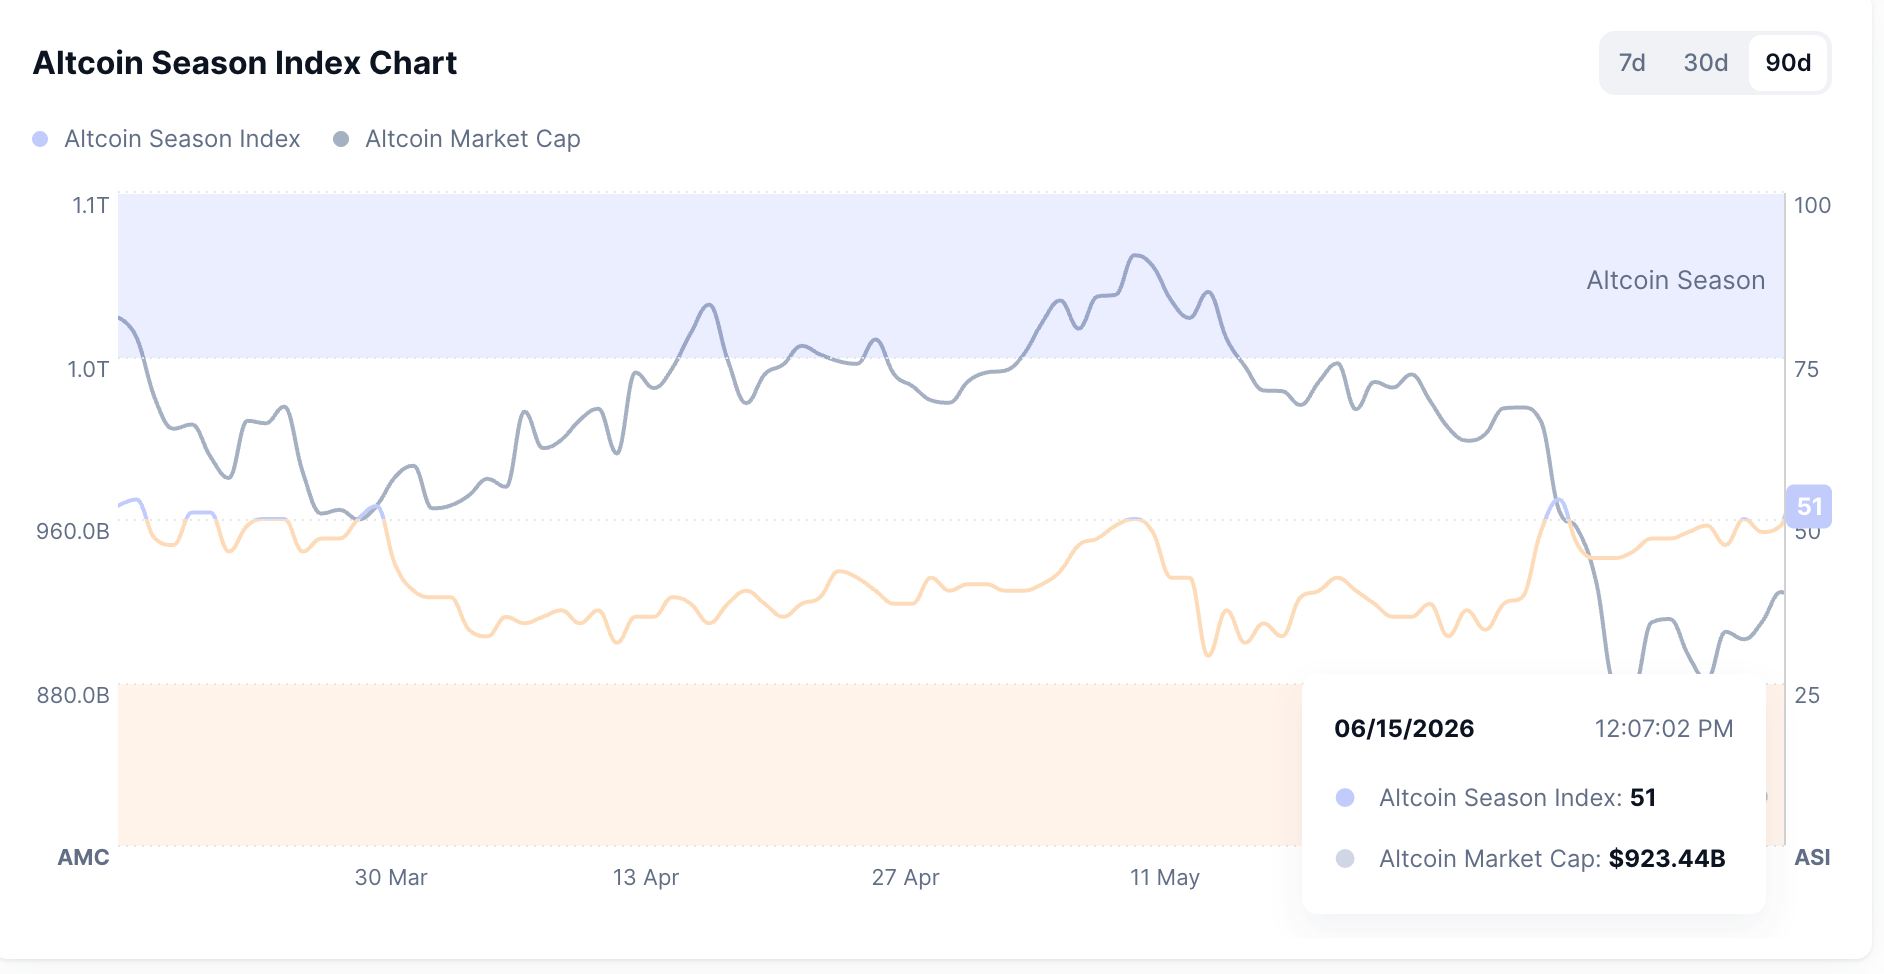
Altcoin season is warming, with the index climbing to 51, yet the most speculative tier of the market is being sold harder than the rest. The Solana network, which out-trades every chain on meme coins, confirms the drag as even its own volume fades.
The split is between intent and fuel. Capital is rotating off Bitcoin into altcoins, but the riskiest corner is lagging. It is an early risk-off tilt rather than a broad run.
Altcoin Season Is Warming Toward Neutral
The starting point is the Altcoin Season Index, which tracks how many top altcoins outperform Bitcoin over 90 days. A reading above 75 confirms altcoin season, while a low score means Bitcoin leads.
Want more token insights like this? Sign up for Editor Harsh Notariya’s Daily Crypto Newsletter here.
The index sits at 51, up sharply from the deep Bitcoin-led readings of early June, with the altcoin market cap near $923 billion. That climb shows money starting to rotate out of Bitcoin and into the broader altcoin market.

Still, 51 is only neutral. It signals a market that wants to run, not one already running. What decides whether the move becomes a true season is the behavior of the riskiest assets, and that is where the picture turns.
The Speculative Tier Is Lagging, Not Leading
BeInCrypto’s meme-versus-alt data exposes the weak link. Over the past 30 days, a basket of meme coins fell 19.1% while a basket of mid-cap altcoins fell 9.8%. That leaves meme outperformance at negative 9.3 percentage points, meaning the speculative tier is being sold harder than the rest of the market.
This is the part that matters for timing. In a healthy, broad rally, the most speculative assets lead or at least keep pace, since they sit at the far, highest-risk end of the risk curve. When they lag this much, risk appetite is draining first from the riskiest names, an early risk-off tilt rather than a euphoric, late-cycle top.
The two baskets have not split apart, which is the key nuance. Their 30-day correlation sits at 0.90, so meme coins and altcoins still move as one risk-on wave.

The problem is force, not direction. They fall together, but the speculative tier falls faster, dragging the move down rather than driving it up.
Even the Solana Network, the Leader, Is Cooling
The Solana network is the place to verify that read, since it out-trades every chain on meme coins. Over the past seven days, it led all networks with more than $471 million in meme-coin volume and the strongest base of new launches, far ahead of Ethereum near $50 million and a Base meme market already in net outflows, per Nansen data.

BeInCrypto excluded BNB Chain from the comparison after a single token showed wash-trading patterns at 438 times its valuation in turnover.
That leadership makes Solana the clearest live gauge of speculative appetite. If retail demand were returning, the Solana network’s meme market would light up first. Instead it is fading. Its weekly DEX volume, the engine of the meme trade via platforms like Pump.fun, slid from roughly $5.2 billion in the week of June 5 toward about $1.1 billion by June 14, a drop of nearly 80%.

The pieces line up into one read. Altcoin season wants to run, the speculative tier is underperforming, the two still move as one wave, and even the Solana network, the leader, is cooling.
Until that engine reignites, altcoin season can keep warming while the broad, risk-on run waits.
The post Altcoin Season Is Warming, yet the Solana Network Is Flashing Early Risk-Off appeared first on BeInCrypto.


India has cleared the regulatory framework for 100% ethanol as a vehicle fuel, opening the way for cars that run on biofuel instead of imported petrol.
Road Transport Minister Nitin Gadkari signed the file. The decision comes after the Iran war put pressure on India’s import bill.
India Opens Door to E100 Ethanol Fuel for Vehicles
Gadkari announced the decision while speaking at an event. He noted that the government wants to raise domestic fuel output over time and build viable substitutes for petrol and diesel.
“Last night at around 8 pm, I signed the file making rules for 100% ethanol and giving it legal process,” he stated. “The country has an import of 22-lakh crores. Now, the resolution we made to reduce this import… gradually gas will also be produced in the country. An alternative to petrol and diesel will also be ready.”
Follow us on X to get the latest news as it happens
E100 refers to near-pure ethanol. Vehicles need specially calibrated engines to burn it, and automakers are now building them.
Maruti Suzuki has shown a flex-fuel WagonR, and Hero MotoCorp has launched two ethanol-ready motorcycles. Gadkari said Toyota, Suzuki, Hyundai, and MG will follow within about six weeks.
US-Iran War Exposes India’s Fuel Dependence
India imports close to 85% of the fuel it consumes. That dependence turned costly after the US and Israel struck Iran on February 28.
The conflict closed the Strait of Hormuz. India had relied on the route for roughly half its crude and most of its gas.
The war-driven supply crunch pushed New Delhi to act on several fronts. In May, Prime Minister Narendra Modi urged citizens to cut fuel use and work from home.
India also leaned harder on the US. Washington sent 630,000 tonnes of LPG in May. That haul ran about 60% above the 380,000 tonnes from all Gulf states combined. US LNG cargoes hit 900,000 tonnes over the same month.
The ethanol decision extends that push. Wider use of domestically produced biofuel should soften exposure to volatile crude prices. It also builds fresh demand for farm feedstocks.
Subscribe to our YouTube channel to watch leaders and journalists provide expert insights
The post India Moves to Slash an 85% Fuel Import Habit With E100 Ethanol appeared first on BeInCrypto.

Over the weekend, the SIREN token collapsed from around $1.30 to $0.05 after its controller sold roughly 94% of the supply, according to reports by analysts from Spot On Chain and Lookonchain.
The sell-off reignited concerns that a single entity had too much control over the BNB Chain-based token, a risk that had been flagged by several blockchain investigators earlier in the year.
Whale Unloads Hundreds of Millions of Tokens
According to data shared by Spot On Chain’s Hupzy account, the SIREN controller dumped approximately 670 million tokens over a 48-hour period, a number that was equal to about 92% of the circulating supply, with the wallet reportedly collecting $64.8 million in USDT during the liquidation.
The data also showed that some $25.7 million, still in USDT, was later transferred to several centralized exchanges, while just over $39 million stayed on-chain, with Hupzy describing the activity as a “textbook pump-and-dump.” They added that the remaining holdings were split across hundreds of addresses after the sales, a pattern they said could make tracking future movements much more difficult.
Lookonchain reported similar figures and noted that the whale had kept on selling after receiving $28 million in one day. Furthermore, the analytics account said it had observed around 200 million SIREN tokens moving to exchange-linked wallets, including addresses associated with Binance, Gate, and KuCoin.
The market reaction came quickly soon after, with CoinGecko data showing SIREN trading near $0.05, down about 59% in the last 24 hours and nearly 96% over the past seven days. It now carries a market cap of just over $38 million, way below the multi-billion-dollar valuation it briefly touched during a rally in March that saw it hit an all-time high of $3.61.
The price collapse also saw the token’s trading volume plummet by more than 48% per CoinGecko, while data from CoinGlass showed over $625 million in futures volume over the past day, with liquidations reaching $3.4 million, over $2.7 million of that being longs.
A Series of Ups and Downs
Soon after the $3.61 ATH mentioned above, SIREN was hit by its first major collapse, tanking by nearly 70%, with on-chain investigator ZachXBT and the Bubblemaps analytics platform warning that a single cluster controlled almost half of its supply, a cluster that ZachXBT later linked to wallets connected to DWF Labs.
The meme token played a similar trick on holders just days after, first jumping by more than 100% on March 26, when it went from $1.02 to $2.08 per CoinGecko data, and then plummeting over 60% to about $0.79 on March 28. As if that wasn’t enough, it teased the market again on March 30, skyrocketing to just under $1.80, but before holders could count their profits, it recorded its worst dip yet, going all the way down to $0.13 in early April, with some X users accusing Binance of manipulating the asset.
There was another spike to just under $2 in the days that followed, and that jump too vanished as suddenly as it had appeared, with SIREN dropping by 65% to about $0.70. Most recently, on June 8, the token, now ranked #583 by market cap, pumped almost 190% when it went from the $0.45 level to $1.30, from where it has since dumped to $0.05.
The post SIREN Crashes 96% as Whale Dumps 94% of Supply appeared first on CryptoPotato.
Pattern Group stock tumbles on secondary offering announcement

U.S.-Iran deal lifts stocks, weighs on oil. Crypto stays wary: Crypto Markets Today

Steven Spielberg Responds To Emily Blunt Disclosure Day AI Claim


-

 Business20 hours ago
No Jackpot Winner as $257 Million Prize Rolls Over to $269 Million Monday Draw
-

 Crypto World4 days ago
Oppenheimer backs SpaceX as $70 billion retail frenzy builds
-

 Crypto World4 days ago
Markets Rally as SpaceX IPO Looms Amid Iran Tensions and Inflation Surge
-

 Fashion3 days ago
Weekend Open Thread: Tuckernuck – Corporette.com
-

 Sports7 days ago
FIFA WC 2026 Group C: Morocco, Scotland challenge Brazil’s hunt for glory | FIFA World Cup 2022
-
 Crypto World7 days ago
Eli Lilly (LLY) Stock Surges 4% Following Breakthrough Sleep Apnea Trial Results
-
Crypto World12 hours ago
Zimbabwe Requires Crypto Businesses to Register Annually Under New FIU Regulations
-

 Entertainment6 days ago
The Ryan Gosling True Crime Thriller On Netflix That Gets Even Stranger, Stream It Now
-
 Sports6 days ago
Bangladesh beat Australia after 20 years in ODIs, register only their second win over six-time world champions | Cricket News
-

 Tech3 days ago
This Week In Security: Microsoft On Microsoft, Register Your Domains, Linux On ARM, And FreeBSD Joins The File Cache Club
-

 Tech2 days ago
NanoClaw integrates JFrog registries to secure AI agent downloads
-

 Crypto World2 days ago
Bitget enters Argentina’s regulated crypto market through PSAV registration
-

 Politics4 days ago
Politics Home | Healey Resignation Is “Colossal Failure Of Government”, Says Former Labour Defence Secretary
-

 Tech5 days ago
‘This is Seattle’s position on AI’: City Council votes unanimously to pause big new data centers
-
 Tech4 days ago
Dutton Ranch star claims they ‘didn’t see any disruption’ on set following Chad Feehan’s exit from Yellowstone spinoff fueled by Taylor Sheridan clash rumors
-

 NewsBeat4 days ago
El Nino has formed in the Pacific and could set records, forecasters say
-
 Entertainment4 days ago
Donnie Wahlberg & More Heat Up Las Vegas at Circa’s Barry’s Downtown Prime
-

 Sports4 days ago
First Time Since 1971: Australia Register Historic Low In ODI Cricket
-
 Tech4 days ago
Opendoor Ends India Operations, Fueling a Bigger Conversation About AI and Outsourcing
-

 Tech7 days ago
Nvidia and Hyundai deepen their robotics push around Atlas
You must be logged in to post a comment Login