
Crypto World
Market Analysis: Gold Slips While WTI Crude Oil Eyes Fresh Upside

Gold price extended losses below $4,800 before the bulls appeared. WTI Crude oil prices are rising and could climb further higher toward $92.00.
Important Takeaways for Gold and WTI Crude Oil Prices Analysis Today
· Gold price failed to clear $4,900 and declined steadily against the US Dollar.
· There is a key bearish trend line forming with resistance at $4,815 on the hourly chart of gold at FXOpen.
· WTI Crude oil prices are moving higher above the $85.00 pivot zone.
· There is a connecting bearish trend line forming with resistance at $89.10 on the hourly chart of XTI/USD at FXOpen.
Gold Price Technical Analysis
On the hourly chart of Gold at FXOpen, the price failed to settle above $4,900 and reacted to the downside, as discussed in the previous analysis. The price traded below $4,850 and $4,800 to enter a short-term bearish zone.
There was a sharp drop below $4,750. The price settled below the 50-hour simple moving average, and RSI dipped below 40. Finally, it tested the $4,700 zone. A low was formed at $4,699, and the price is now correcting some losses.
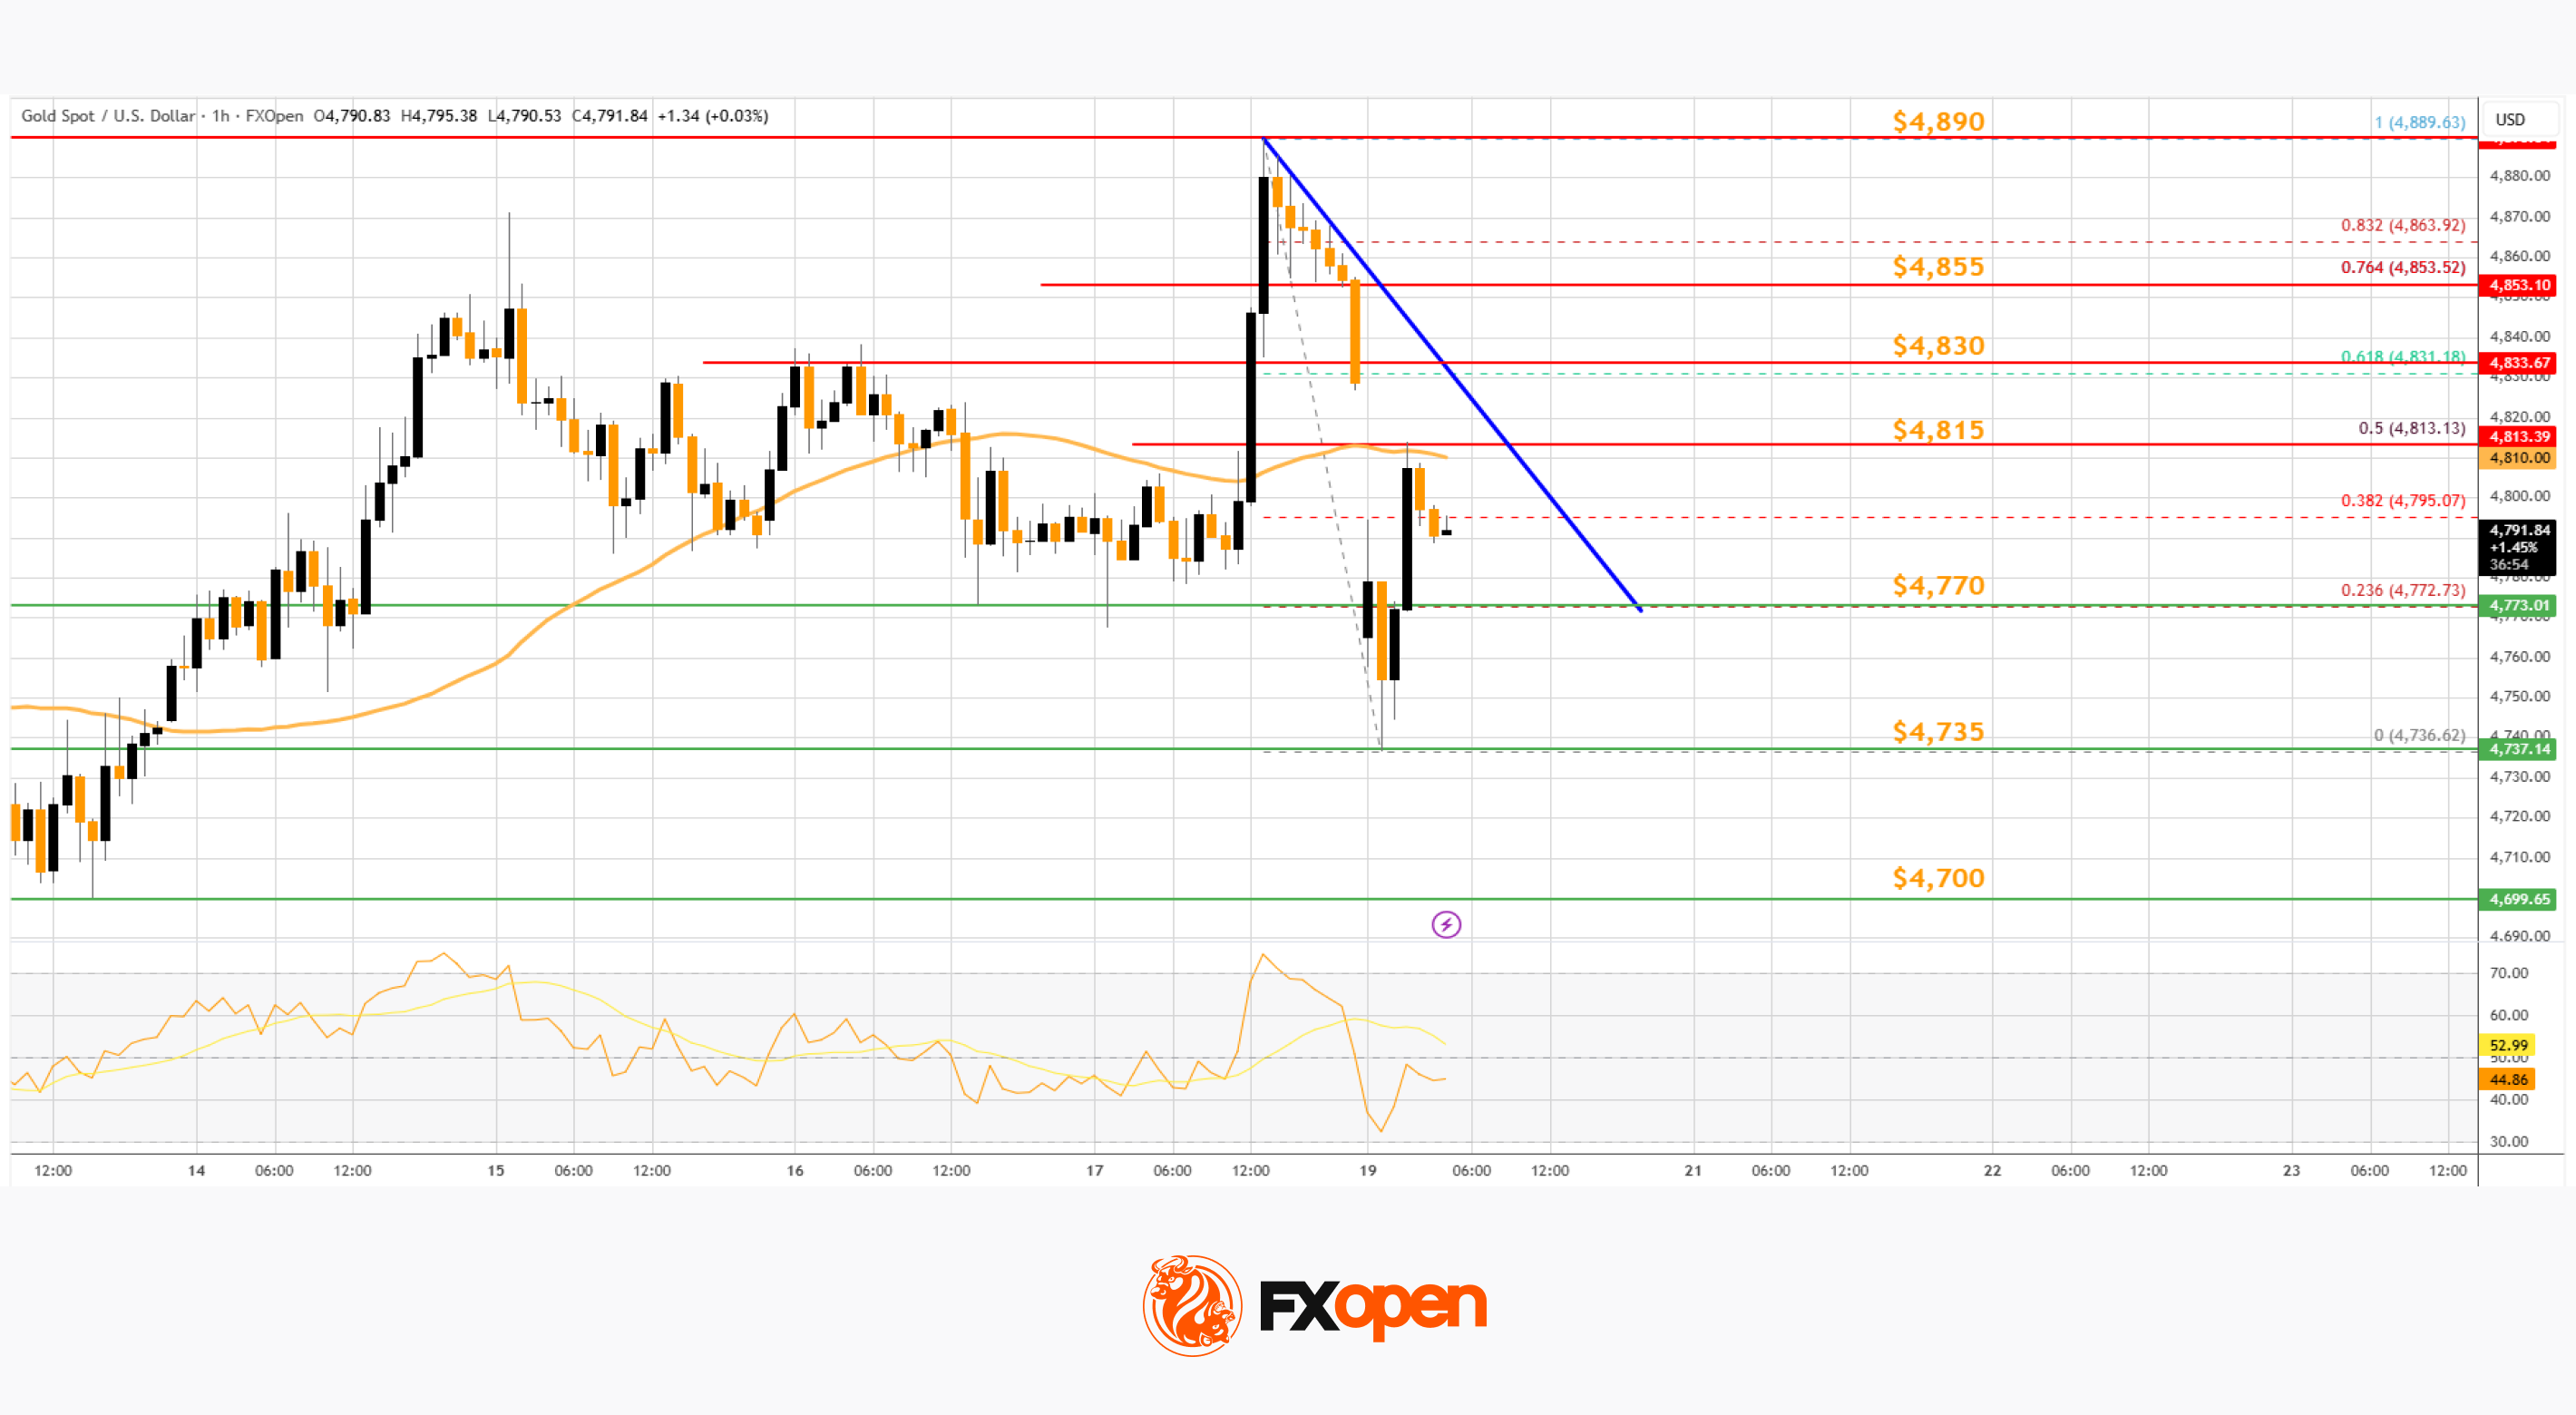
Immediate hurdle on the upside is $4,815 or the 50% Fib retracement level of the downward move from the $4,889 swing high to the $4,699 low. There is also a key bearish trend line forming with resistance at $4,815.
The first major barrier for the bulls could be $4,830 and the 61.8% Fib retracement. A close above $4,830 could initiate a recovery wave to $4,855. An upside break above $4,855 could send Gold price toward $4,890. Any more gains may perhaps set the pace for an increase toward $5,000.
If there is no fresh increase, the price could continue to move down. Initial support on the downside is near the $4,770 level. The first key area of interest might be $4,700. If there is a downside break below $4,700, the price might decline further. In the stated case, the price might drop to $4,500.
WTI Crude Oil Price Technical Analysis
On the hourly chart of WTI Crude Oil at FXOpen, the price started a fresh increase from $79.00 against the US Dollar. The price gained bullish momentum after it broke $84.00.
There was a sustained upward movement above $84.50 and $85.00. The bulls pushed the price above the 50-hour simple moving average, and the RSI climbed toward 60. A high was formed near $89.08 before there was a minor pullback. The price declined below the 23.6% Fib retracement level of the upward move from the $78.96 swing low to the $89.08 high.
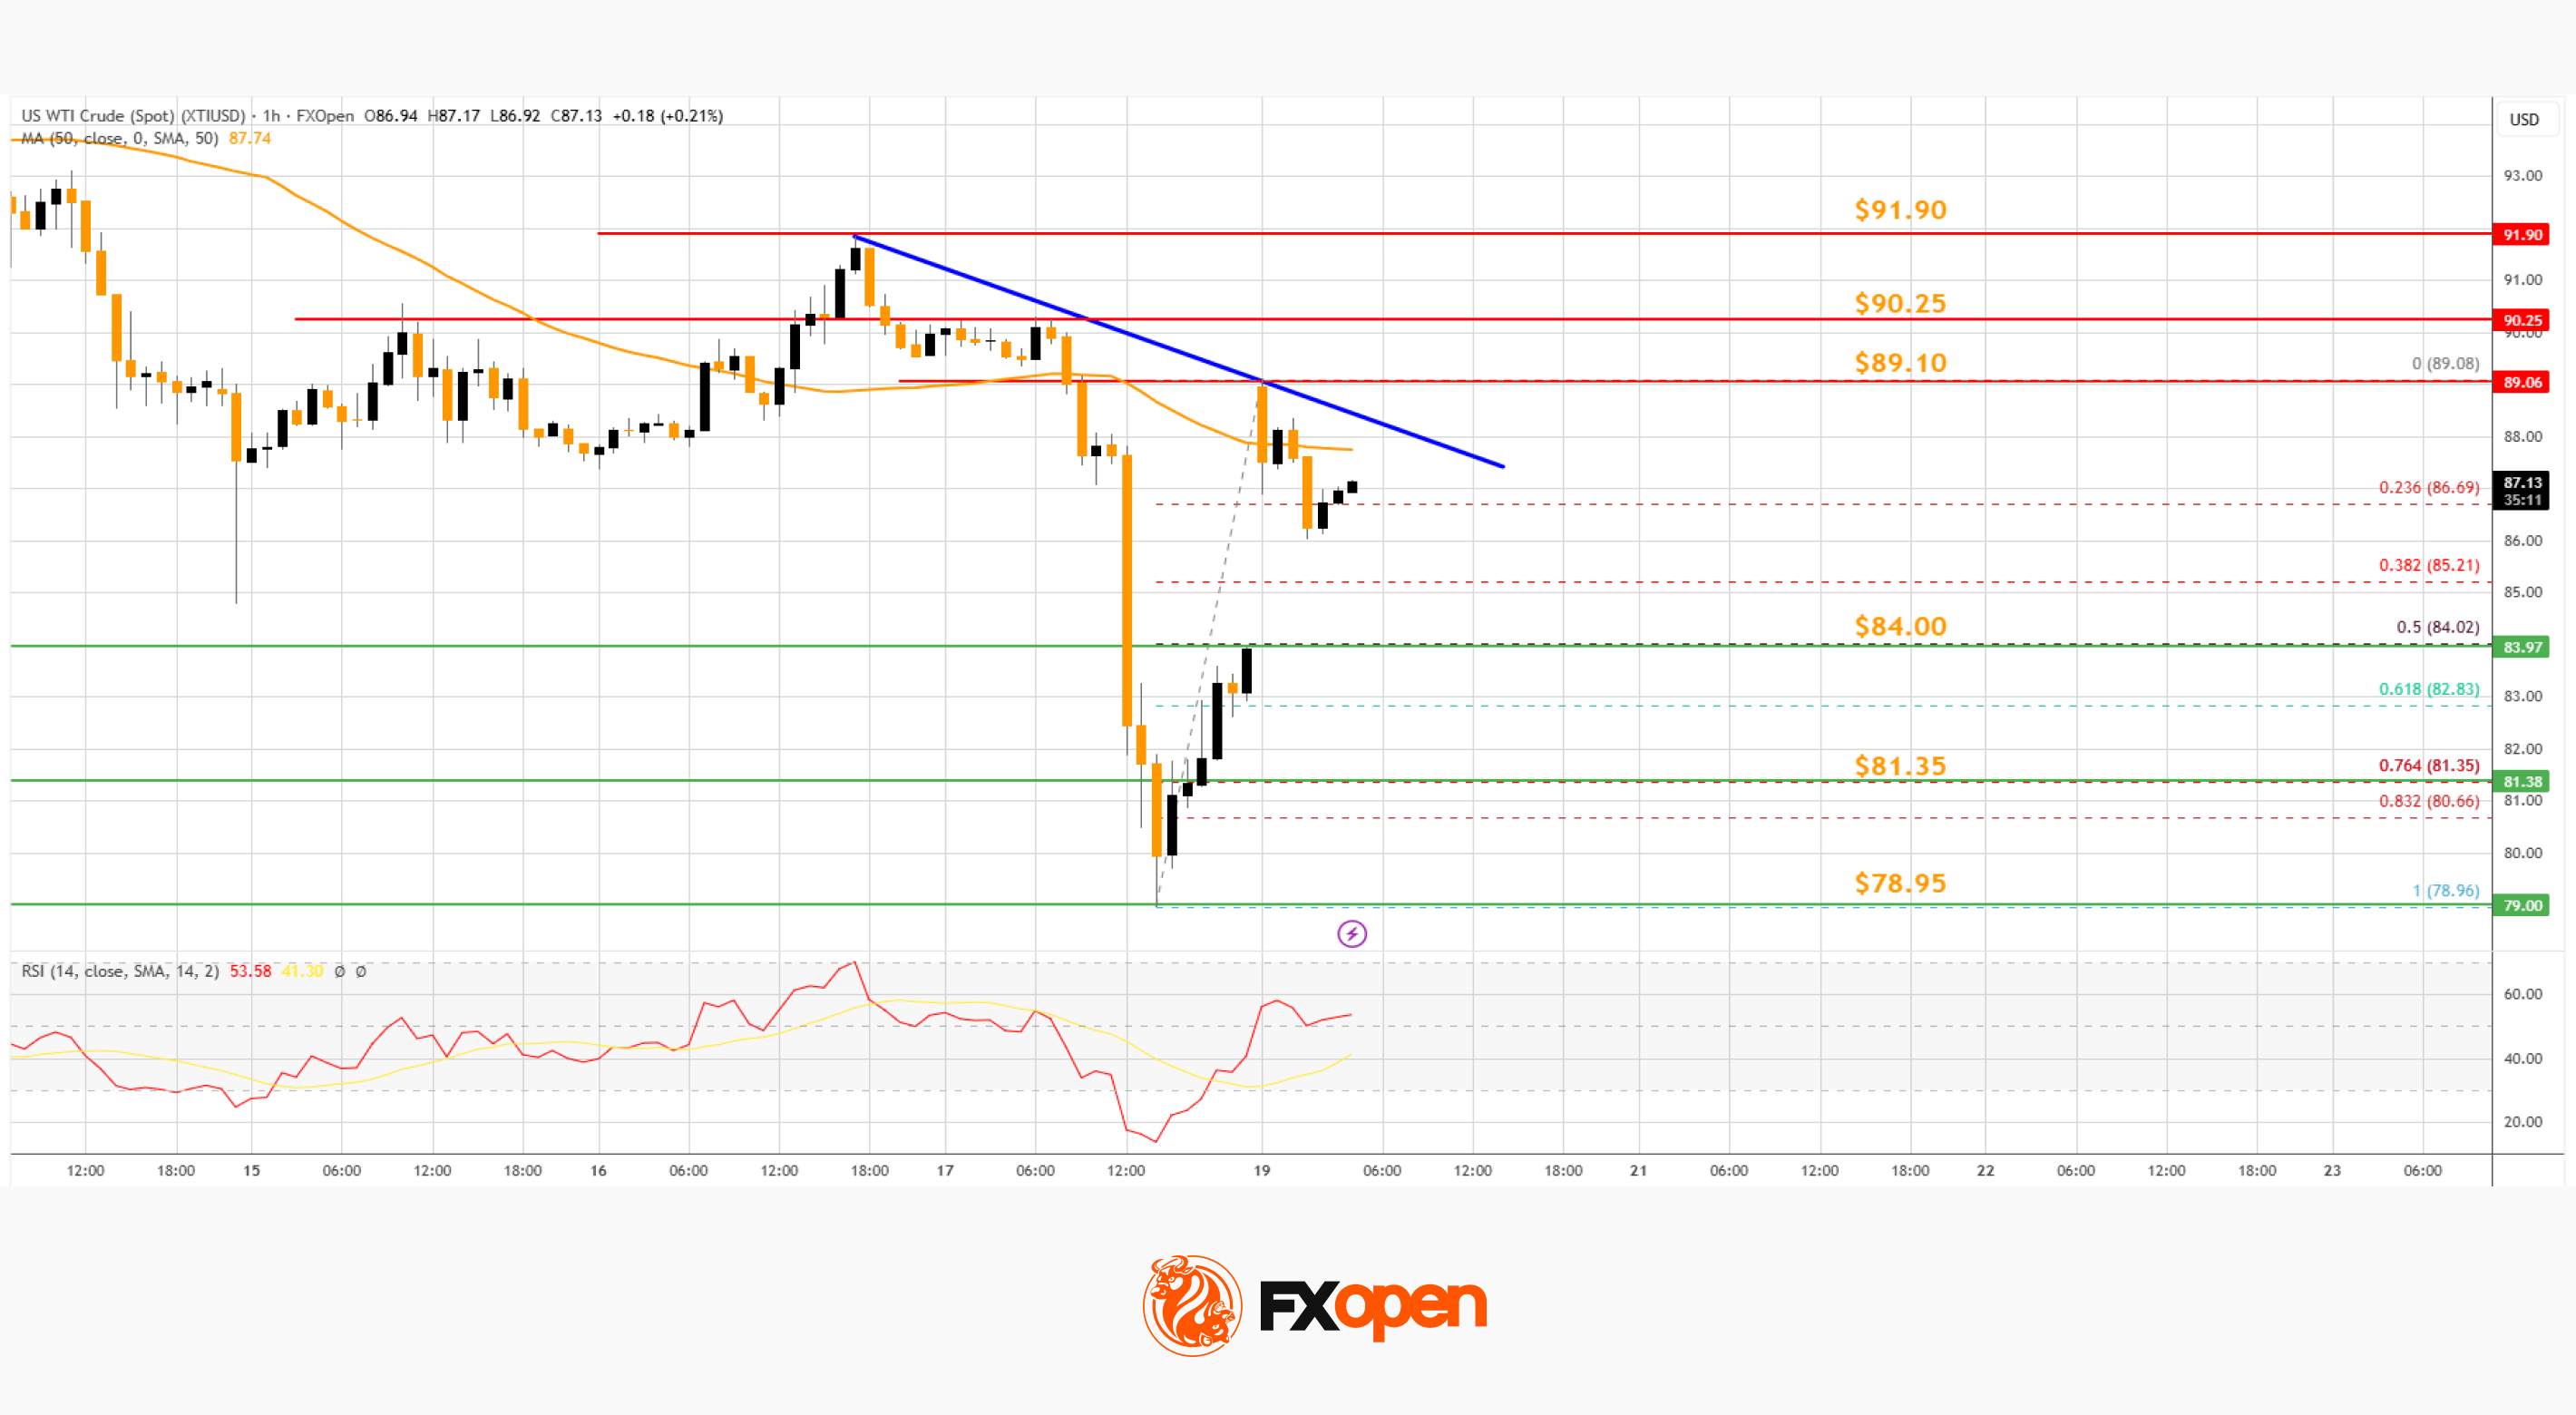
However, the bulls are active above $85.00. Immediate resistance is near a connecting bearish trend line at $89.10. If the price climbs further, it could face hurdles near $90.25.
The next major stop for the bulls might be $91.90. Any more gain might send the price toward $95.00. Conversely, the price might correct gains and test the 50% Fib retracement at $84.00. The next area of interest on the WTI crude oil chart could be $81.35.
If there is a downside break, the price might decline to $80.00. Any more losses may perhaps open the doors for a move toward $75.00.
Start trading commodity CFDs with tight spreads (additional fees may apply). Open your trading account now or learn more about trading commodity CFDs with FXOpen.
This article represents the opinion of the Companies operating under the FXOpen brand only. It is not to be construed as an offer, solicitation, or recommendation with respect to products and services provided by the Companies operating under the FXOpen brand, nor is it to be considered financial advice.

Onchain investigator ZachXBT publicly challenged MemeCore on Monday to justify the valuation and supply distribution of its M token, asking the project to explain its market cap and why “insiders hold >90% of supply.”
“Please provide a single data point to support your $6B mkt cap at a top 20 token and why insiders hold >90% of supply,” wrote ZachXBT in a Monday X response to Memecore, a project advertising itself as the layer–1 blockchain for the “Meme 2.0 economy.”
The comments add fresh scrutiny to MemeCore after a sharp rally, though live valuation metrics differed across major trackers. CoinMarketCap ranked the token No. 21 at about $4.33 billion on Monday, while CoinGecko ranked it No. 20 at about $5.97 billion.
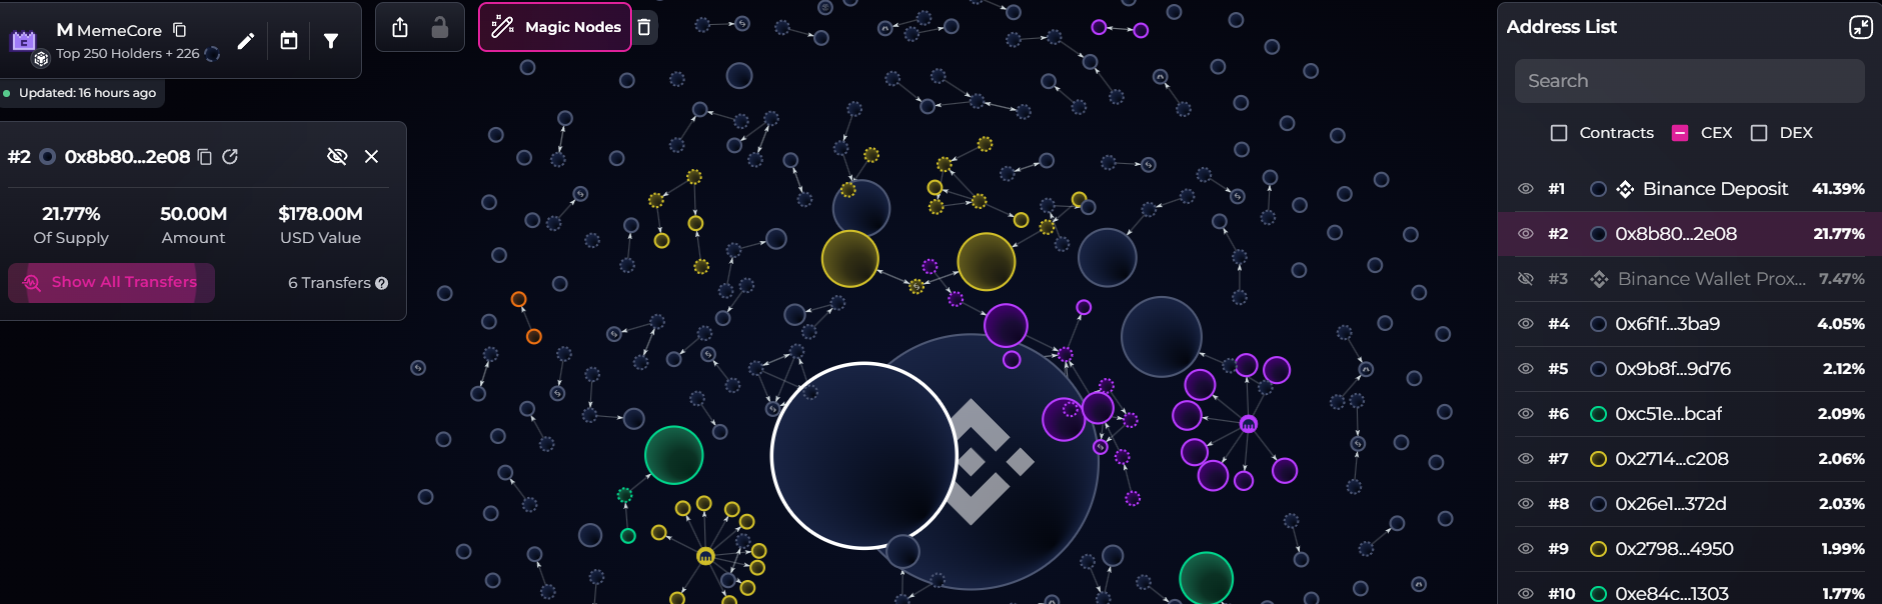
The second-largest holder, wallet “0x8b8,” held 50 million M tokens currently worth $178 million, representing 21.77% of the supply, according to blockchain data visualization platform Bubblemaps, which listed the Binance Deposit address as the largest holder with 41.3% of the supply.
However, the token holdings don’t necessarily point to coordinated activity, according to Bubblemaps blockchain data analyst 0xToolman, who told Cointelegraph that the “pattern looks like team holdings,” which may not be in circulation yet.

Cointelegraph has contacted MemeCore for comment on the matter and details surrounding the token’s distribution.
ZachXBT has not posted definitive blockchain data proving that 90% of the supply is held by insiders, but pledged to investigate the token after the recent meltdown of the Rave DAO (RAVE) token sent shockwaves across the industry.
Related: Suspected insider wallets rack up $1.2M betting on ZachXBT’s Axiom exposé
RAVE token’s 90% meltdown sparks insider concerns
On Saturday, ZachXBT accused RaveDAO of orchestrating a pump-and-dump scheme, citing concentrated token holdings and suspicious exchange flows, after the RAVE token soared from $0.25 to nearly $28 within days before crashing over 80%.
RaveDAO has denied any role in the token’s surge and collapse, Cointelegraph reported on Sunday. Both Binance and Bitget confirmed they are reviewing the situation.
The RAVE token fell 92% during the past week and was trading above $0.69 at 12:46 p.m. UTC on Monday, CoinMarketCap data shows.

ZachXBT claimed that RAVE was just one of several tokens spotting “manipulation” signs on major exchanges.
“Other projects with highly questionable price action recently include: SIREN, MYX, COAI, M, PIPPIN, RIVER,” he wrote in a Saturday X post, pledging to investigate these price movements to identify the responsible parties.
Magazine: Meet the onchain crypto detectives fighting crime better than the cops
Crypto World
LayerZero Post Mortem Shows Lazarus Group Stole $290M From KelpDAO via RPC Node Compromise

North Korea’s Lazarus Group exploited a single-verifier LayerZero setup to drain $290M in rsETH on April 18 by compromising RPC infrastructure and poisoning the bridge’s data feeds.
On April 18, 2026, North Korea’s Lazarus Group (TraderTraitor unit) executed a $290M theft from KelpDAO’s rsETH bridge by compromising two LayerZero RPC nodes that feed data to the protocol’s verifier. The attacker hacked the nodes, deployed malware to feed false transaction data exclusively to LayerZero’s verifier while maintaining honest responses to monitoring systems, then DDoS’d legitimate RPC endpoints to force the verifier to rely on the poisoned nodes. Once the verifier signed off on a fabricated transaction, the bridge released $290M in unbacked rsETH before the malware self-destructed and deleted all traces.
LayerZero Labs confirmed KelpDAO used a 1-of-1 DVN (Decentralized Verifier Network) setup—a single point of failure the protocol had repeatedly warned against—limiting contagion to KelpDAO’s bridge with no reported impact on other assets. Security researchers noted the attack vector raises unanswered questions about how the attacker obtained the RPC node list and achieved root-level access to production infrastructure, suggesting either a prior unreported LayerZero compromise, a breached deployment pipeline, or insider access rather than a Kelp-side misconfiguration.
Sources: LayerZero
This article was generated automatically by The Defiant’s AI news system from publicly available sources.
Crypto World
DeFi Contagion Spreads Beyond Aave as LayerZero, Lido, Ethena Suffer Sharp Declines: Santiment


AAVE, ZRO, LDO, and ENA tokens plunged 10–22% as market repriced risk across DeFi protocols exposed to a bad debt event, with LayerZero priced as equally culpable as the originating lender.
DeFi tokens suffered steep declines over a recent window as contagion from a bad debt event spread across multiple protocols. AAVE declined 22%, LayerZero’s ZRO fell 22%, Lido’s LDO dropped 19%, Ethena’s ENA slid 13%, and Compound’s COMP lost 10%, according to Santiment. ETH remained flat over the same period, highlighting the sector-specific pressure on DeFi assets.
LayerZero, which operated the bridge connecting the affected protocols, was repriced by markets as equally culpable to Aave, which held the bad debt. Notably, Ethena—which held zero exposure to the underlying rsETH collateral—still experienced a 13% decline, suggesting contagion fears extended to protocols with no direct exposure. Compound, with only minor rsETH exposure, fell 10%, indicating cascading risk reassessment across the broader DeFi ecosystem.
Sources: Santiment
This article was generated automatically by The Defiant’s AI news system from publicly available sources.

TLDR:
- Nike stock has fallen 76% from its 2021 all-time high of $179.10, now trading between $42 and $46 per share.
- China sales are projected to drop 20% as local brands like Li-Ning capture the mid-to-high-tier footwear market.
- Converse recorded a 35% revenue plunge, reflecting Nike’s broader loss of relevance in lifestyle and streetwear segments.
- Tim Cook and Director Bob Swan purchased a combined $3.5M in Nike shares, signaling boardroom confidence at decade lows.
Nike stock has fallen to its lowest level in over a decade, trading between $42 and $46 following an April 2026 earnings shock.
The decline represents a 76% drop from its 2021 all-time high of $179.10, erasing 12 years of gains for long-term shareholders.
Meanwhile, board members are purchasing shares at these levels, creating a split between public sentiment and insider conviction.
Overseas Pressure and Brand Challenges Drive Nike’s Decline
Nike faces a projected 20% sales drop in China, one of its highest-margin markets. The shift stems from Guochao, a cultural movement among Chinese millennials and Gen Z embracing domestic brands and national identity.
Local competitor Li-Ning sold over 26 million pairs of professional running shoes last year, moving firmly into the mid-to-high-tier segment.
As Li-Ning and similar brands gain ground, Nike’s premium positioning in China is becoming harder to defend. Analyst Ali Charts observed on X, noting that Nike is “currently weathering its most significant structural challenge since 2014,” with the stock retreating to a decade-low and erasing 12 years of gains for long-term holders.
The pressure is not limited to performance footwear. Converse, Nike’s lifestyle subsidiary, recorded a 35% revenue plunge, pointing to a broader loss of cultural relevance in the casual and streetwear segments.
This decline serves as a clear signal that the market is moving away from the classic aesthetics Nike has long relied on.
In response, CEO Elliott Hill has moved to rebuild wholesale partnerships with retailers like Foot Locker and Dick’s Sporting Goods.
This shift reverses the Direct-to-Consumer strategy that previously supported Nike’s higher profit margins. While it helps clear inventory, it marks a structural retreat for the brand.
Board Members Buy Shares as Stock Hits Oversold Territory
On the technical side, Nike’s monthly RSI has reached its most oversold reading since the company went public. Historically, Nike’s corrections have ranged from 24% to 73%. The current 76.5% drawdown from its all-time high is the steepest in company history.
Ali Charts further noted that the stock appears to be in the “Anger Phase” of the market cycle. This is the period when negative news feels heaviest, often just as a price floor begins forming. The zone between $35 and $42 is being watched as a potential long-term support area.
Against this backdrop, two Nike board members made notable open-market purchases. Tim Cook, Apple’s CEO and a Nike director, bought approximately $3 million in Nike shares. Director Bob Swan added $500,000 to his position at similar price levels.
Insider purchases of this size, made during a period of broad pessimism, tend to attract attention from value-oriented investors. They suggest that those closest to the company view current challenges as correctable rather than permanent.

LayerZero has attributed the Kelp DAO exploit to North Korea’s Lazarus Group, identifying a single-point-of-failure in the protocol’s verifier setup as the technical root cause that made the attack possible.
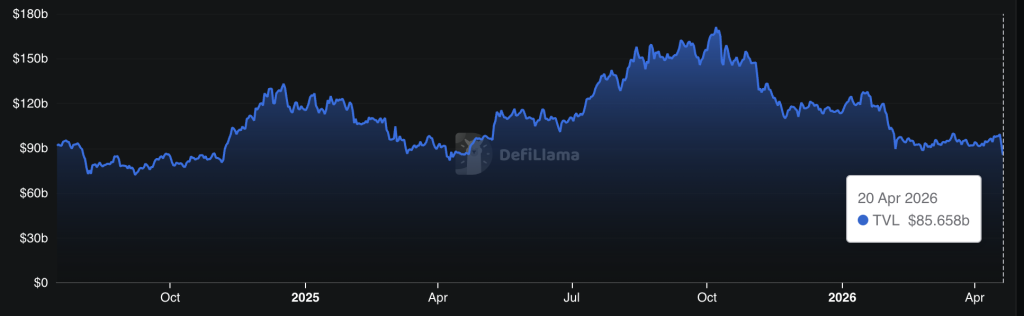
The breach drained an estimated $292 million from Kelp DAO’s rsETH pool on April 18, marking the largest DeFi hack of 2026 to date – and sent total value locked across the DeFi sector down 7% in 24 hours to $85 billion, according to DefiLlama.

The attribution lands not as a closed finding but as a probabilistic claim: LayerZero says Lazarus is the likely perpetrator, not a confirmed one. What that distinction means for the protocol, its users, and the cross-chain security model is the question this story answers.
- Attribution source: LayerZero conducted the post-incident investigation and named North Korea’s Lazarus Group – specifically the TraderTraitor subgroup – as the likely perpetrator.
- Technical root cause: Kelp DAO operated a 1-of-1 DVN (single decentralized verifier node) setup, ignoring LayerZero’s repeated recommendations for multi-verifier redundancy.
- Exploit amount: Approximately $292 million drained from Kelp DAO’s rsETH pool; no LayerZero protocol code or private keys were compromised.
- Market impact: DeFi TVL fell 7% in 24 hours to $86 billion following the incident.
- Response: LayerZero decommissioned affected RPC nodes and restored full DVN operations; law enforcement collaboration is ongoing for fund tracing.
- Watch: Whether Kelp DAO announces a compensation mechanism and whether additional cross-chain protocols operating single-DVN configurations move to remediate before the next attack.
Discover: The best pre-launch token sales
LayerZero’s Kelp DAO Lazarus Findings: What a Single-Point Failure Actually Means in Cross-Chain Architecture
The exploit’s mechanism was multi-step and precise. Attackers poisoned the RPC infrastructure feeding LayerZero’s decentralized verifier network, then launched a DDoS attack designed to force failover to compromised backup nodes.
With the verifier network redirected, the system validated fictitious cross-chain transactions, and $292 million in rsETH exited Kelp DAO’s pool before the fraud was detected.
The critical enabler: Kelp DAO ran a 1-of-1 DVN configuration, meaning a single verifier node stood between the protocol and catastrophic failure. LayerZero had flagged this architecture as inadequate – multiple times, according to the investigation – and recommended a multi-DVN setup consistent with industry best practices for redundancy. Kelp DAO did not act on those recommendations.
A multi-DVN setup would have required attackers to compromise several independent verification nodes simultaneously, a substantially harder technical lift. The 1-of-1 setup collapsed that barrier entirely. As Ripple CTO David Schwartz put it on X: “The attack was way more sophisticated than I expected and aimed at LayerZero infrastructure taking advantage of KelpDAO laziness.”
LayerZero’s response was surgical: the team decommissioned all affected RPC nodes post-incident and fully restored DVN operations without broader contagion to other protocols using the same infrastructure. No LayerZero protocol code was compromised. No private keys were exposed. The failure was architectural, not foundational – a distinction that matters enormously for the protocol’s credibility but does nothing to recover the $292 million.
Why North Korea Attribution Changes the Threat Model for All of DeFi
LayerZero’s Lazarus Kelp DAO attribution, framed as likely, not confirmed, is consistent with an established and accelerating pattern.
The TraderTraitor subgroup, a known Lazarus operational unit, was preliminarily identified in the forensic analysis. LayerZero is actively collaborating with global law enforcement on fund tracing, suggesting the attribution carries enough evidentiary weight to involve state-level investigative resources.
Lazarus has been tied to some of the largest crypto thefts on record, including the $625 million Ronin Network hack in 2022 and a string of DeFi protocol exploits that have collectively funneled billions into DPRK’s weapons programs, according to U.S. Treasury and UN assessments.
North Korea’s crypto operations extend well beyond direct exploits – the regime has also embedded operatives inside Web3 companies under fabricated identities, a parallel track that widens the attack surface beyond infrastructure alone.
Cross-chain protocols are structurally attractive targets for this class of actor. They sit at high-value junctions between multiple chains, often carrying pooled liquidity that dwarfs any single application’s balance, and their security depends on verifier networks that can become single points of failure when misconfigured. RPC poisoning as a tactic against verifier networks represents a novel escalation – one that security researchers say is now documented and replicable.
Discover: The best crypto to diversify your portfolio with
The post LayerZero Says Lazarus Group Likely Behind Kelp DAO Exploit appeared first on Cryptonews.


Tangem Pay lets users spend USDC directly from their self-custodial Tangem wallets, settling all transactions on Polygon.
Switzerland-headquartered hardware wallet company Tangem today announced the global rollout of its retail payments product, Tangem Pay, per a press release shared exclusively with The Defiant.
The new feature lets Tangem wallet users spend stablecoin USDC anywhere where Visa is accepted, using virtual Visa cards that can be added to Apple Pay and Google Pay.
The wallet manufacturer also announced today that it is partnering with Polygon for the new product, with the blockchain providing on-chain settlement for all transactions.
As of today, Tangem Pay is available to users in the U.S. (excluding some states), Latin America, and select countries in the Asia-Pacific region. The global rollout follows an early-access phase for waitlisted users that began in November, the press release notes.
Tangem is a self-custodial hardware wallet founded in 2017. Unlike crypto hardware wallet giants Trezor and Ledger, Tangem only offers NFC-powered devices for crypto storage, which come in two forms: a card that’s about the size and shape of a bank card, as well as a wearable ring.
How It Works
To pay with Tangem Pay, users need to convert funds they want to spend into USDC first, before transacting, the firm clarifed to The Defiant. “Over time, we will expand supported assets and settlement options,” Tangem Pay CEO Marcos Nunes told The Defiant.
Currently, the wallet only lets users create virtual Visa cards that they can add to payment services like Apple Pay. But the firm plans to launch physical cards as well.
“A large part of the world still relies on physical cards, and we want to support that fully,” said Nunes. Tangem Pay’s CEO told The Defiant that the physical Visa card launch is expected this year.
Why Polygon?
Tangem said that the firm selected Polygon for its transaction speed, predictable fees, and ability to handle the high transaction volumes required for global payments. “Payments are a scale game, not a theory exercise,” Nunes told The Defiant, continuing, “You need near-zero fees, fast finality, and reliability under load. Polygon delivers that today in a way that supports real daily spending.”
Nunes also added, “We are not dogmatic about chains. This is an infrastructure decision. If something better emerges, we will adapt.”
Per the press release, Polygon will cover gas fees for users, at least for the initial rollout period. There are no fees from Tangem’s side, Nunes clarified to The Defiant. “It should feel like using money in a regular account.”
Aishwary Gupta, head of global business development at Polygon Labs, said in a statement: “With Polygon as the settlement layer, Tangem Pay makes self-custody practical for real-world spending, combining the transparency of blockchain with the speed and reliability users expect.”
Polygon is an Ethereum sidechain with $1.27 billion in total value locked in DeFi across 775 protocols, per DefiLlama. That makes it the 11th-largest chain in DeFi by TVL, while it’s currently the 4th-largest chain by 24-hour active addresses.
In January, Polygon Labs announced its acquisition of two U.S. regulated crypto companies, Coinme and Sequence, adopting their licenses and enabling Polygon’s operations as a regulated payments platform across 48 U.S. states.

Spot Bitcoin ETFs logged nearly $1 billion in weekly net inflows last week, their strongest seven-day stretch since mid-January, per CoinGlass flow data.
BlackRock’s IBIT alone absorbed $612 million of that total, confirming institutional concentration in the dominant fund. The core question now: does this flow momentum translate into durable price support, or does tactical resistance cap the rally again?
Year-to-date Bitcoin product inflows have turned positive for the first time since January, a threshold Bloomberg ETF analyst Eric Balchunas flagged as signaling “extraordinary institutional acceptance” of Bitcoin as an asset class.
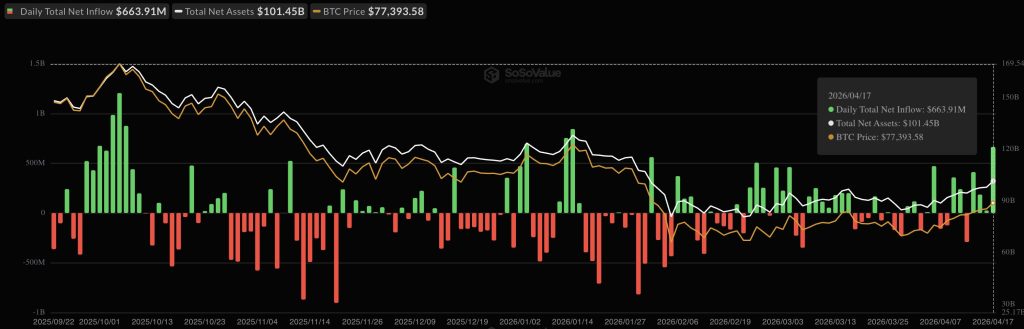
Total net assets across all U.S. spot Bitcoin ETFs surpassed $101 billion by Friday’s close, with daily trading volumes approaching $4.8 billion.
- Weekly inflows: Nearly $1 billion – highest since mid-January
- IBIT dominance: BlackRock captured $612 million of total flows
- Total net assets: Surpassed $101 billion by end of week
- YTD flows: Turned positive for first time since January per Bloomberg’s Balchunas
- Global share: U.S. institutions captured 96.4% of $1.1 billion in global crypto product inflows
- ETH ETFs: $275 million net inflows; XRP ETFs added $11.75 million; Solana lost $5.6 million
Discover: The best crypto to diversify your portfolio with
What $1 Billion in Weekly Bitcoin ETFs Inflows Actually Signals
The weekly flow breakdown reveals a Friday-heavy pattern: $663.9 million hit on Friday alone, roughly two-thirds of the total, with Tuesday contributing $411.5 million and Wednesday adding $186 million. Thursday brought just $26 million, and Monday registered a $291 million outflow. That volatility in daily flows suggests opportunistic accumulation rather than a steady institutional drip.
IBIT’s $612 million weekly haul pushed its market cap to $159.22 billion, placing it among the world’s largest ETFs by assets. Fidelity’s FBTC also contributed meaningfully to inflows, while Grayscale’s GBTC continued to bleed – a split that reflects sustained conviction in lower-fee products and residual exit pressure from legacy holders.
U.S. institutions captured 96.4% of global crypto product inflows last week, absorbing $1.06 billion of a $1.1 billion global total. That concentration matters: it signals that Bitcoin demand is increasingly centralized in regulated U.S. vehicles, making ETF flow data the most reliable leading indicator for near-term BTC price direction.
If weekly inflows sustain above $750 million, BTC’s support floor around current levels strengthens materially. If flows revert toward the $200–$300 million range seen during January’s plateau, the bid thins out fast.
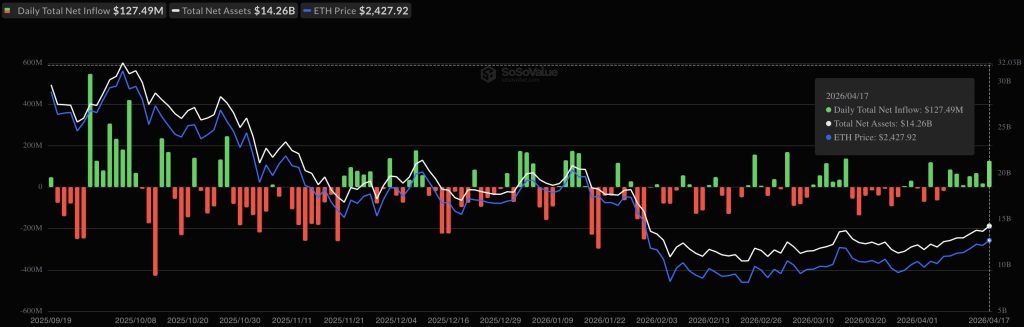
Ethereum spot ETFs pulled in $275 million net last week, XRP ETFs added $11.75 million, and Solana shed $5.6 million; this was selective altcoin rotation, not a broad risk-on flush.
Discover: The best pre-launch token sales
The post Spot Bitcoin ETFs Near $1 Billion in Weekly Inflows, Best Stretch Since Mid-January appeared first on Cryptonews.


BitMine Immersion Technologies (BMNR), the largest Ethereum-focused digital asset treasury firm, sped up its crypto purchase pace as chairman Tom Lee sees growing signs of the crypto “mini-winter” ending.
The firm reported Monday it acquired 101,627 ether (ETH) last week, its largest weekly haul since December 15. The purchase, worth roughly over $230 million at current ETH prices, lifted BitMine’s total holdings to 4.97 million ETH.
The move comes as most digital asset treasuries — except Michael Saylor’s bitcoin-focused Strategy (MSTR) — have slowed or halted buying in recent months. BitMine remains among the last large-scale buyers of ether-focused treasuries, continuing to provide a steady source of demand for ETH.
BitMine’s total crypto and cash holdings stand at $12.9 billion. In addition to its ETH treasury, the firm holds 199 bitcoin, $1.12 billion in cash and equity stakes including investments in Beast Industries and Eightco Holdings.
Chairman Thomas Lee said the firm sees signs that the recent downturn is nearing an end, pointing to ETH’s rebound and broader market dynamics.
“Bitmine has maintained the increased pace of ETH buys in each of the past four weeks, as our base case ETH is in the final stages of the ‘mini-crypto winter,’” Lee said.
He added that ether has risen sharply from its early February lows and has outperformed equities since the start of the Iran conflict, supported by demand tied to tokenization and AI-related use cases.
BitMine has also continued expanding its staking operations. The firm has staked more than 3.3 million ETH, or about two-third of its holdings, generating roughly $221 million in annualized revenue.


Michael Saylor’s Strategy (MSTR) added 34,164 bitcoin to its treasury over the past week at an average price of about $74,395 per coin, for a total cost of roughly $2.54 billion, according to a Monday filing.
The purchase brings the company’s total holdings to 815,061 BTC, acquired for approximately $61.56 billion at an average cost basis of $75,527. With BTC currently trading at around $75,000, Strategy’s stash is currently break even. Strategy is the world’s largest publicly-listed bitcoin holder. It began acquiring BTC as a balance sheet asset in 2020.
Last week’s acquisitions were funded by $2.2 million raised through sales of the company’s preferred stock, Stretch (STRC), and $366 million from common stock offerings.
MSTR shares are down more than 2.5% in pre-market trading.


Users have been advised to stop interacting with any DeFi application for a few days after Vercel, the creator of Next.js and cloud provider for a large number of crypto’s user-facing platforms, admitted that attackers breached its internal systems.
According to Vercel CEO Guillermo Rauch, the attack happened when one of its employees “got compromised via the breach of an AI platform customer called Context.ai that he was using.”
The attackers, who Rauch says were “significantly accelerated by AI,” apparently escalated through the employee’s Google Workspace account into Vercel’s corporate environment.
A BreachForums seller claiming to be extortion crew ShinyHunters is demanding a $2 million ransom via a listing that allegedly includes GitHub tokens.
For DeFi, the incident is a nightmare. A user interacting with a poisoned Next.js package via a website can sign a transaction straight into an attacker’s wallet.
Vercel disclosed the incident in a Sunday security bulletin, saying that it had found “unauthorized access to certain internal Vercel systems” and had already engaged law enforcement.
Following the disclosure, X user and Cork Protocol CTO “Pybast,” who is also former CTO of DeFi cybersecurity company Nefture, warned users to stop interacting with “any DeFi application,” adding that “a lot of DeFi is hosted on Vercel and crypto users are a prime target for such attack.”
Comically, he suggested eth.limo, which also had its own security incident on the same day, as a safer alternative.
Next.js cleared 520 million downloads in 2025, according to Rauch. DeFi dashboards, crypto wallet connectors, and token launchpads use it.
Members of the crypto community were concerned that the hacker could use Vercel credentials to push malicious code to dependencies pulled by thousands of downstream projects.
Rauch has named Mandiant, Google’s incident-response arm, as the firm assisting with incident response.
Only a “limited subset of customers” was affected, Rauch claimed, and services remained operational.
Read more: ‘Decentralized’ apps suffer after Ledger Connect Kit attack
DeFi terrified after Vercel breach
A screenshot of the ransom notice, published by BleepingComputer, advertises multiple employee accounts, internal deployments, API keys, and GitHub tokens.
The vendor attached hundreds of employee records, a screenshot of Vercel’s internal Linear instance, and what appears to be an internal enterprise dashboard.
BleepingComputer couldn’t verify their authenticity.
Curiously, threat actors tied to the actual ShinyHunters extortion crew told BleepingComputer that they had nothing to do with this particular caper.
Got a tip? Send us an email securely via Protos Leaks. For more informed news, follow us on X, Bluesky, and Google News, or subscribe to our YouTube channel.

What I Packed for the Beach

Footballs could be designed to reduce impact of heading – scientists

AST SpaceMobile: The Pullback I Was Waiting For


-

 Crypto World7 days ago
The SEC Conditionalises DeFi Platforms to Be Avoided for Broker Registration
-

 NewsBeat6 days ago
Trump and Pope Leo: Behind their disagreement over Iran war
-

 Fashion3 days ago
Weekend Open Thread: Theodora Dress
-

 Crypto World7 days ago
SEC Signals Exemption for Crypto Interfaces From Broker Registration
-

 News Videos5 days ago
Secure crypto trading starts with an FIU-registered
-

 Sports3 days ago
NWFL Suspends Two Players Over Post-Match Clash in Ado-Ekiti
-

 Crypto World6 days ago
SEC Proposes Certain Crypto Interfaces Don’t Need to Register as Brokers
-

 Business23 hours ago
Powerball Result April 18, 2026: No Jackpot Winner in Powerball Draw: $75 Million Rolls Over
-

 Crypto World3 days ago
Russia Pushes Bill to Criminalize Unregistered Crypto Services
-

 Politics3 days ago
Palestine barred from entering Canada for FIFA Congress
-
 Business4 days ago
Creo Medical agree sale of its manufacturing operation
-

 Politics1 day ago
Zack Polanski demands ‘council homes not luxury flats for foreign investors’
-
 Entertainment6 days ago
Brand New Day’ Footage Reveals the Devastating Impact of ‘Now Way Home’
-

 Crypto World3 days ago
Russia Introduces Bill To Criminalize Unregistered Crypto Services
-
 Tech6 days ago
Microsoft adds Windows protections for malicious Remote Desktop files
-
 Entertainment7 days ago
Karol G’s ‘Ultra Raunchy’ Coachella Set Gave ‘Satanic Vibes’
-

 Sports7 days ago
Aaron Judge says Yankees need to ‘simplify’ approach amid offensive slump
-

 Entertainment7 days ago
How Babylon 5 Turned Brief Side Story Into Emotional Masterpiece
-
 Tech7 days ago
What was the first ransomware attack to demand payment in Bitcoin?
-

 Tech5 days ago
‘Avatar: Aang, The Last Airbender’ Leaked Online. Some Fans Say Paramount Deserves the Fallout
You must be logged in to post a comment Login