

Crypto World
moomoo targets Wall Street-grade crypto tools for retail investors


Retail investing platforms have spent a number of years racing to become “everything apps” for finance, piling on stocks, crypto, banking and payments in a bid to keep users inside a single ecosystem.
But for moomoo, the next battle isn’t about who offers the most assets.
It’s about who gives retail investors the same level of intelligence and execution long reserved for Wall Street institutions.
“We want to democratize access to the best tools that have historically only been available to institutional investors,” Albi Mema, director of crypto operations at moomoo U.S., told CoinDesk in an interview. “A decade ago the issue was access. Now it’s the quality of access.”
“Moomoo is built for the retail investor who has outgrown basic trading apps. Today’s retail investors are more informed, more engaged, and more demanding than ever,” according to Mema. “They do not just want access to markets, they want better data, better tools, better education, and more context around the decisions they make,” he added.
Global platform
Moomoo is a global trading platform that offers retail investors access to stocks, options, exchange-traded funds (ETFs) and cryptocurrencies through a single app. The company focuses on combining low-cost trading with institutional-grade market data, analytics and investing tools for self-directed traders.
The New York-based firm, which says it has more than 30 million global users, $156 billion in client assets and nearly $1.9 trillion in annual trading volume, is betting that retail traders increasingly want sophisticated analytics, AI-assisted trading and institutional-style execution tools rather than simply another crypto venue.
That positioning comes as brokerages across both crypto and traditional finance push toward the “one-stop shop” model. Robinhood (HOOD), Kraken and Coinbase (COIN) have all expanded beyond their original products in recent years, blending equities, derivatives, payments and digital assets into broader financial platforms.
Mema argues moomoo’s differentiator is not aggregation alone, but the depth of tooling layered on top of it.
“The next generation of retail investors won’t be defined by who offers the most assets,” he said. “It will be about who helps investors make the best decisions across those assets.”
Retail traders
Retail investors are increasingly seeking institutional-grade analytics, execution capabilities, and AI-powered trading tools which drive trading assistance into the platform.
“Retail investors are building positions, measuring volatility and thinking long term,” he said. “They’re trading alongside some of the best and brightest.”
The company’s no-code algorithm builder allows users to scan markets for technical patterns, backtest strategies and automate trading signals.
Traders can also share strategies with the broader community, creating what Mema described as a collaborative “trading floor” dynamic for over 30 million retail participants.
Mema says retail crypto traders often experience significantly worse execution speeds and slippage than institutions, with some retail orders taking hundreds of milliseconds to settle compared with institutional systems that operate in tens of milliseconds or faster.
“If you’re getting rinsed on slippage, that puts you at a disadvantage as a crypto user,” he said. “We are bringing institutional-level execution to retail.”
The firm is also pushing deeper into tokenization. Moomoo recently joined Figure Markets’ onchain public securities initiative and partnered with Figure (FIGR) and BitGo (BTGO) on tokenized secondary market offerings.
“We think the future is hybrid. Traditional markets are not disappearing. Blockchain-native markets are not replacing everything tomorrow,” Mema says. “But the two are starting to converge, and platforms that can bridge those worlds responsibly will be well positioned,” he added.
Read more: Gemini taps SpaceXAI to build a personalized prediction markets feed


ARK Invest bought nearly 3.3 million shares of SpaceX (SPCX) as Elon Musk’s company went public in the largest IPO ever on Friday, building a stake worth more than $500 million by the end of the day.
The shares, priced at $135 for the sale, closed at $160.95, rising more than 19.2% on their first day.
The Cathie Wood-owned firm liquidated almost $280 million of stock in the week before the listing, then sold another roughly 948,000 shares across 13 companies worth at least $48 million on Friday, including Advanced Micro Devices, Roku and Baidu, according to daily emailed statements over the period.
The ARK Innovation ETF (ARKK) did the bulk of the buying, ending the day with SpaceX at 3.28% of its portfolio.
A first-day pop of almost 20% on the largest IPO in history signals institutions are paying up for high-beta innovation risk again. While bitcoin is the highest-beta asset in the group, the hottest trade in the market is now a wave of AI and space listings, with OpenAI and Anthropic also filing to go public.
Key Highlights
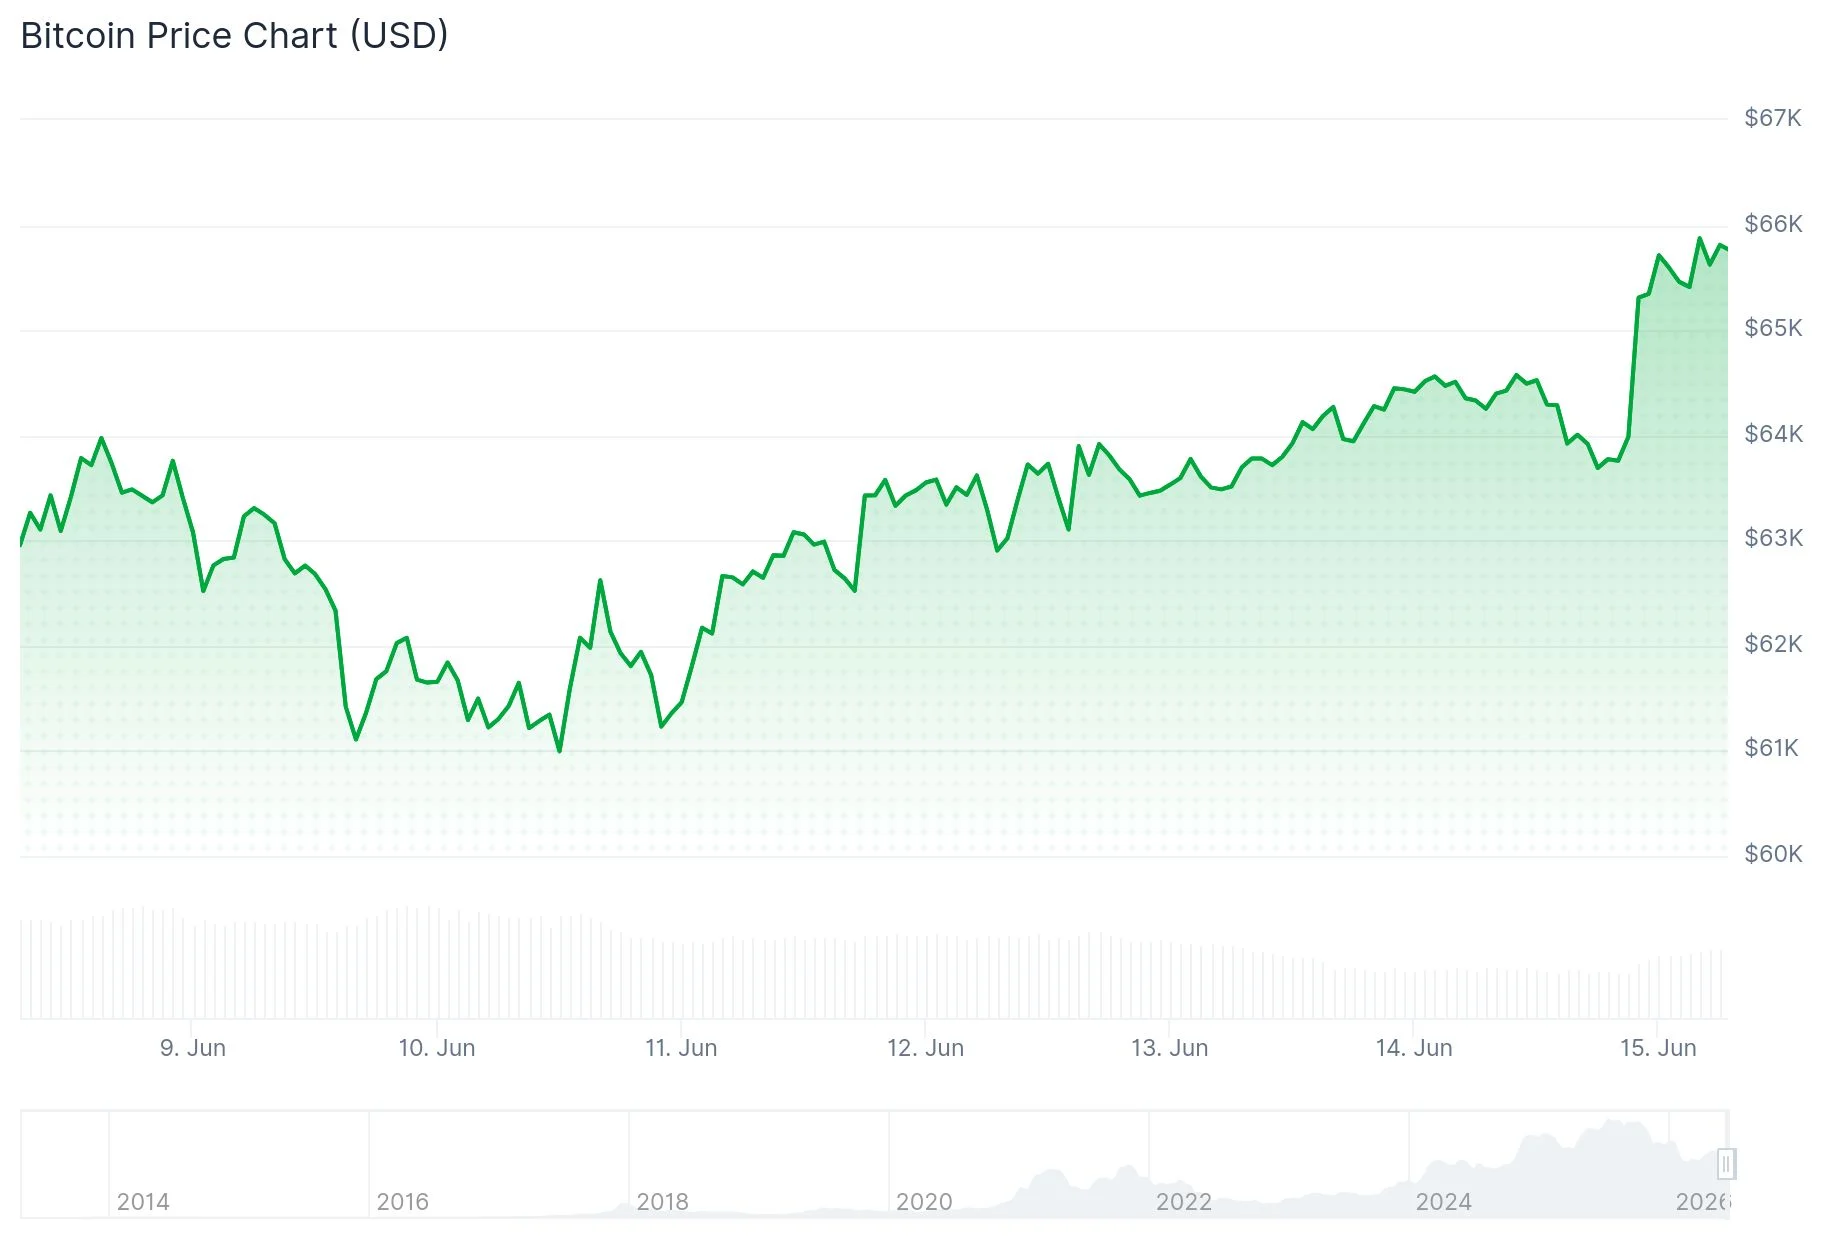
- Bitcoin gained 2.1% to reach approximately $65,800, marking its strongest level in almost 14 days
- Washington and Tehran finalized an agreement to cease conflicts and restore access to the Strait of Hormuz
- Crude oil prices plummeted, with WTI dropping close to 5% to reach $81 per barrel
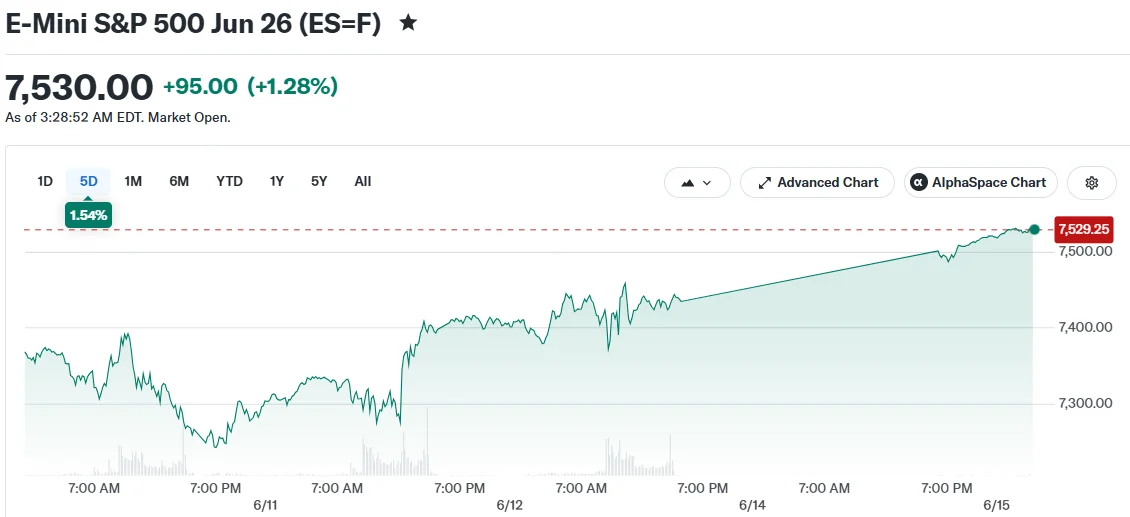
- American equity futures rallied sharply, led by Nasdaq 100 futures climbing 1.9%
- SpaceX stock skyrocketed more than 19% during its initial public trading, elevating its valuation beyond $2 trillion
Financial markets experienced a dramatic shift following the announcement of a peace accord between the United States and Iran. Cryptocurrency values climbed, equity futures jumped, and energy commodities retreated as investors adjusted to reduced Middle East conflict risks.
Cryptocurrency Markets Gain as Geopolitical Risk Diminishes
Bitcoin changed hands near $65,844 during Monday’s session, registering a 2.1% increase across the previous day. This represents approximately a 9% recovery from the sub-$60,000 depths reached last week, its most vulnerable position since October 2024.

The digital asset touched a session low around $63,722 during early Asian market hours, just before news of the diplomatic agreement emerged.
The positive momentum extended throughout digital asset markets. Ether advanced 2.5% to $1,721. Solana climbed 3.6% to $71. XRP increased 3.2% to $1.19. Hyperliquid’s HYPE token led the pack, surging 7.5% to approach $65.
Pakistan’s Prime Minister Shehbaz Sharif made the initial announcement regarding the diplomatic breakthrough. President Donald Trump subsequently confirmed the development, declaring on Truth Social that the agreement was “complete.” Officials plan a formal signing event this Friday in Switzerland.
Trump revealed he approved the reopening of the Strait of Hormuz, an essential waterway for international oil transportation. Tehran will reportedly obtain economic advantages in return for compliance with the agreement’s provisions.
Energy Prices Collapse, Equity Futures Soar
Brent crude tumbled more than 4% approaching $83 per barrel. West Texas Intermediate declined nearly 5% to $81 per barrel. These sharp declines signal diminishing concerns regarding potential oil supply interruptions that had maintained elevated energy prices throughout late February.
Dow futures advanced 1%. S&P 500 futures rose 1.2%. Nasdaq 100 futures spearheaded the rally, soaring 1.9%. Asian equity markets climbed over 3%, with Japan’s Nikkei 225 positioned for a historic closing high.
The greenback weakened against primary trading counterparts.
The relationship between energy prices and digital assets has been straightforward. Elevated oil costs had reinforced expectations of prolonged higher interest rates, which diverted capital away from speculative assets like Bitcoin. Declining oil prices reverse this dynamic.
SpaceX Trading Debut Amplifies Bullish Sentiment
Equity markets received additional support from SpaceX’s entrance into public trading. The company’s shares exploded more than 19% during the inaugural session, propelling its market capitalization past $2 trillion. The stock extended gains with an additional 3% rise in extended trading.
Markets approach an abbreviated trading week carrying this upward momentum.
Moving forward, market participants continue monitoring Federal Reserve monetary strategy. Current pricing indicates greater than 98% likelihood that the central bank maintains existing interest rate levels at the upcoming policy meeting.
Two demand-side uncertainties persist specifically for Bitcoin. Strategy’s recent revelation that it liquidated 32 Bitcoin to finance preferred share dividend payments undermined confidence regarding institutional accumulation. Exchange-traded fund withdrawals have similarly created downward pressure. Neither challenge is addressed by the diplomatic agreement.

Kill Zone trading is a method that focuses on the most liquid and volatile periods of the trading day. It aims to align trades with institutional activity during specific time windows. The concept comes from the Inner Circle Trader (ICT) method, with ICT Kill Zone times covering the Asian, London, and New York sessions. These forex Kill Zone times mark specific intraday periods when liquidity, trading volume, and institutional activity tend to increase, with the London Kill Zone time among the most active windows.
This article explains forex Kill Zone times, the main trading sessions, and the role of institutional order flow in Kill Zone trading.
What Is a Forex Kill Zone?
A forex Kill Zone is a short, high-activity window when a currency pair tends to see higher volatility and trading volume. These windows usually align with the open of a major session or occur during forex session overlaps. The concept, popularised by Michael Huddleston, also known as the Inner Circle Trader, highlights the importance of timing in trading strategies.
These active windows sit inside the broader forex market sessions. The forex market operates 24 hours a working day across four major sessions: Sydney, Tokyo, London, and New York. Each session reflects the working hours of its regional financial centre.
A trading session and a Kill Zone are not the same thing. A session lasts around nine hours and covers a region’s full trading day. A Kill Zone is a shorter window, often two to three hours, when order flow tends to concentrate. Forex Kill Zones therefore act as focused periods within these longer sessions.
Two main forces drive this concentration of activity during a Kill Zone. Liquidity rises as institutional order flow enters the market, which can tighten spreads. Volatility tends to rise as that heavier order flow moves price more quickly. A session overlap strengthens both effects, since two regions trade at once. The London and New York overlap is the clearest example, and it shapes much of Kill Zone trading.
Forex Kill Zone Times at a Glance
Forex Kill Zone times group into four main windows across the trading day, each tied to the main ICT trading sessions. The table below sets out each window in GMT for winter and summer, the pairs that tend to lead it, and how the market usually behaves.
The Asian window keeps the same GMT trading times year-round, since Tokyo does not observe daylight saving. For current session times, traders often confirm the windows against a forex trading hours reference.
Main ICT Kill Zone Times in Detail

Each Kill Zone period corresponds to transitions in major forex markets worldwide. The windows differ in their typical pairs, pace, and liquidity.
Below, we’ve described each along with the key ICT Kill Zone times. You can see how currency pairs react during these times in FXOpen’s TickTrader trading platform.
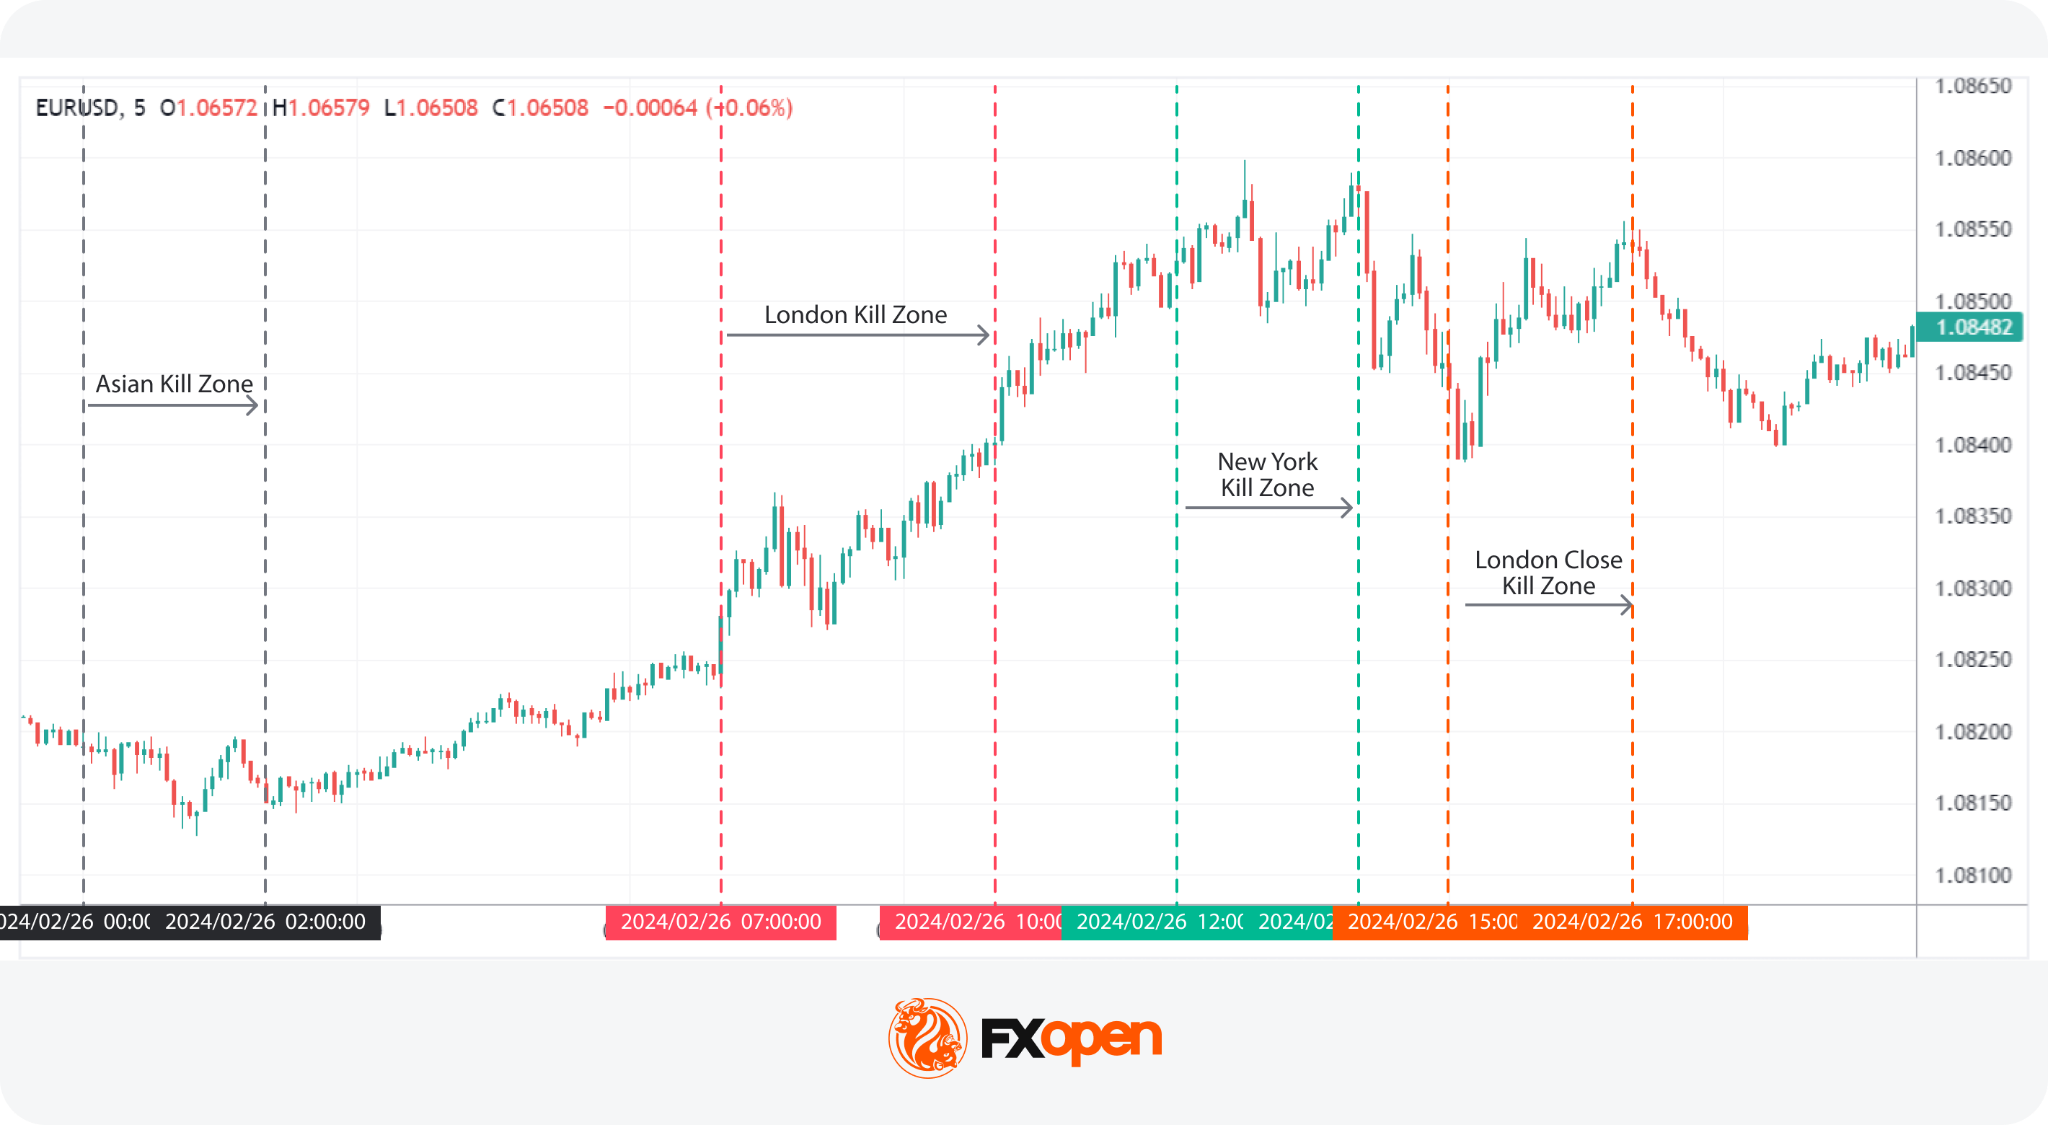
1. Asian Kill Zone
Asian Kill Zone Time Period: 23:00 GMT to 02:00 GMT in winter and in summer.
This window coincides with the opening of Asian markets, primarily Tokyo. This period sees increased activity in currency pairs with AUD, NZD, and JPY.
During these hours, price tends to trade inside a tight range rather than trend strongly. This is known as the Asian range, and traders watch its high and low as reference levels. Lower participation means liquidity builds slowly rather than driving large moves. That accumulated liquidity can matter later, since the high and low of the Asian range often shape the first London moves. A break of either level after the London open can signal where larger order flow is heading.
2. London Kill Zone Time
ICT London Kill Zone Time Period: 08:00 GMT to 11:00 GMT in winter (07:00 GMT to 10:00 GMT in summer).
This window is known for its volatility and significant trading volume, particularly involving EUR and GBP. As the London session opens, it often establishes the daily highs (in bullish markets) or lows (in bearish markets).
Much of this reaction centres on the Asian session highs and lows formed overnight. Price often sweeps these levels first, taking liquidity that rested above or below the Asian range. A liquidity sweep of this kind can precede a sharper move once the level breaks. London session volatility can rise quickly as European volume enters. Traders study these conditions to prepare for potential breakouts or reversals.
3. New York Kill Zone Time
New York Kill Zone Time Period: 13:00 GMT to 16:00 GMT in winter (12:00 GMT to 15:00 GMT in summer).
This window marks the overlap of the London and New York sessions, creating a critical period for USD-paired currencies.
USD pairs become more active when the New York forex session overlap occurs because American volume joins a market London is still trading. The New York Kill Zone draws traders from two continents at once, which lifts liquidity and pace. High-impact US economic data is often released during this period, including inflation and employment figures. These releases can move USD pairs sharply within minutes, so volatility tends to spike around them.
Traders seek continuation or reversal of the trends established over the London session, employing strategies that capitalise on the volatility to maximise returns.
4. London Close Kill Zone
London Close Kill Zone Time Period: 15:00 GMT to 17:00 GMT in winter (14:00 GMT to 16:00 GMT in summer).
As the London session concludes, this window typically exhibits less volatility but still offers conditions for strategic trades. Traders might observe retracements or continuations of earlier trends.
European participation declines as London desks close their books for the session. With fewer active participants, liquidity and volatility usually eases versus the London and New York windows. Moves can still occur, though they often lack the force seen during the main overlap. Strategies here often centre on trend exhaustion as European traders step back before the US close.
Trading Considerations During Kill Zones
When engaging with Kill Zones in forex, practical considerations are important for leveraging these periods. Keep in mind these things:
Economic Calendar Events
High-impact data often lands during the New York Kill Zone and the London hours. Releases such as interest-rate decisions and employment figures can create market volatility. Many traders check an economic calendar before a session to see what is scheduled.
Daylight Saving Time Adjustments
Traders account for time zone shifts such as British Summer Time (BST) and Eastern Daylight Time (EDT) when planning their trading schedules. These shifts can impact the real-time operation of forex markets by altering the relative timing of session openings and peak activity periods.
BST is GMT+1, moving the London window to an hour earlier for those trading on GMT. During BST, which typically runs from late March to late October, the London Kill Zone shifts from 07:00 to 10:00 GMT. Conversely, EDT, which is GMT-4, affects those in the US by advancing the New York window to start and end an hour earlier. This period typically extends from the second Sunday in March to the first Sunday in November.
For a quick conversion, add one hour to GMT during BST to reach local London time. Traders also confirm broker or server time, since platform clocks may differ from GMT.
Risk Management
Trading these windows means facing periods of rapid, hard-to-anticipate price movement. Sound risk management may potentially help traders manage that exposure.
- Volatility-Based Position Sizing: Adjusting position sizes based on volatility may be useful. In more volatile periods like the London or New York openings, reducing position size might help manage potential losses.
- Time-Specific Stop-Loss Orders: Stop-loss orders that reflect the heightened activity levels is another risk management tool. Pre-defined risk limits, set before the session, may potentially help traders avoid reactive decisions when price moves quickly. Wider stops may suit the New York window, where price gaps are more common. Slippage can also rise around high-impact news, filling orders away from the intended level.
- Real-Time Monitoring: Active monitoring during these volatile times is vital. Setting alerts at particular levels and indicators may aid in a proactive approach.
Currency Pairs Commonly Traded During Kill Zones
Each Kill Zone tends to favour the major currency pairs tied to the regions trading at that hour. Matching a pair to its active window can place a trade where liquidity is deepest.
EUR/USD is most active across the London and New York windows, when European and US volume overlap. It carries some of the tightest spreads in forex, which suits the faster pace of these hours. GBP/USD also leads during the London Kill Zone, often moving further than EUR/USD on the same news.
USD/JPY draws activity in both the Asian and New York windows, since it bridges two of the regions. It tends to react sharply to US data and to shifts in risk sentiment. AUD/USD is most active in the Asian window, when Australian and regional markets set the early tone.
Liquidity differs across these pairs and across the windows themselves. The major pairs above usually trade with deeper liquidity and narrower spreads than minor or exotic pairs. That depth tends to thin outside the main ICT trading sessions as currency pair activity declines, which can widen spreads and slow fills. For this reason, traders often focus on the pairs whose home session is open.
Key Takeaways
Kill Zone strategies focus on specific periods of the trading day when liquidity and market activity tend to increase. By monitoring these windows, traders can analyse how price behaves around session opens and overlaps, where larger market participants are often most active.
The four forex Kill Zones are the Asian, London, New York, and London Close windows. Each corresponds to a key trading session or session overlap – key institutional trading hours – and ICT Kill Zone times may shift during daylight-saving periods. Understanding these time windows can help traders place market activity into context, as liquidity, volatility, and price behaviour often vary significantly from one session to another.
Those looking to refine their market timing and participate in high-impact trading sessions may consider opening an FXOpen account to access a wide range of currency pairs during these critical periods of volatility.
FAQ
How Could You Use a Kill Zone?
Traders use a Kill Zone to time entries and exits during periods of high volatility and liquidity, capturing significant price movements during specific time windows — usually at the beginning or end of a trading session or when sessions overlap.
How May Traders Participate During ICT Kill Zones?
Traders can engage by monitoring price action, identifying high-probability setups, and executing trades on currency pairs during major institutional trading windows.
What Are Forex Kill Zone Times?
Forex Kill Zone times are specific periods during major trading sessions when liquidity and trading activity tend to increase. They are commonly associated with the Asian, London, New York, and London Close sessions.
What Is the London Kill Zone Time?
The London Kill Zone time generally occurs around the opening hours of the London session. It is commonly referenced as 07:00 to 10:00 GMT in summer or 08:00 to 11:00 GMT in winter.
What Is Kill Zone Trading?
Kill Zone trading is a session-based approach that focuses on trading during periods when market participation and liquidity are typically higher.
What Is the New York Kill Zone?
The New York Kill Zone refers to the period when New York trading overlaps with London. This overlap often creates increased activity in USD-related currency pairs. It is commonly referenced as 13:00 GMT to 16:00 GMT in winter and 12:00 GMT to 15:00 GMT in summer.
Do ICT Kill Zone Times Change During Daylight Saving Time?
Yes. ICT Kill Zone times can shift when London or New York move to daylight saving time. For example, the London Kill Zone typically occurs one hour earlier in GMT during British Summer Time (BST). Traders should check current session schedules and their broker’s server time to ensure they are using the correct timings.
Which Currency Pairs Are Most Active During Kill Zones?
EUR/USD, GBP/USD, USD/JPY, AUD/USD, and other major pairs often show increased activity during their respective regional sessions.
This article represents the opinion of the Companies operating under the FXOpen brand only. It is not to be construed as an offer, solicitation, or recommendation with respect to products and services provided by the Companies operating under the FXOpen brand, nor is it to be considered financial advice.
Bitcoin (BTC) has rebounded to near $65,800 after an on-chain bottom signal flashed for the second time in 2026, the same setup that preceded a 24% rally earlier this year. Large holders added to their positions as the signal appeared, hinting they see the low as in.
The move pairs a rare metric with visible whale buying. Both point the same way, though weakening volume keeps the case from being one-sided.
A Bitcoin Bottom Signal Just Flashed?
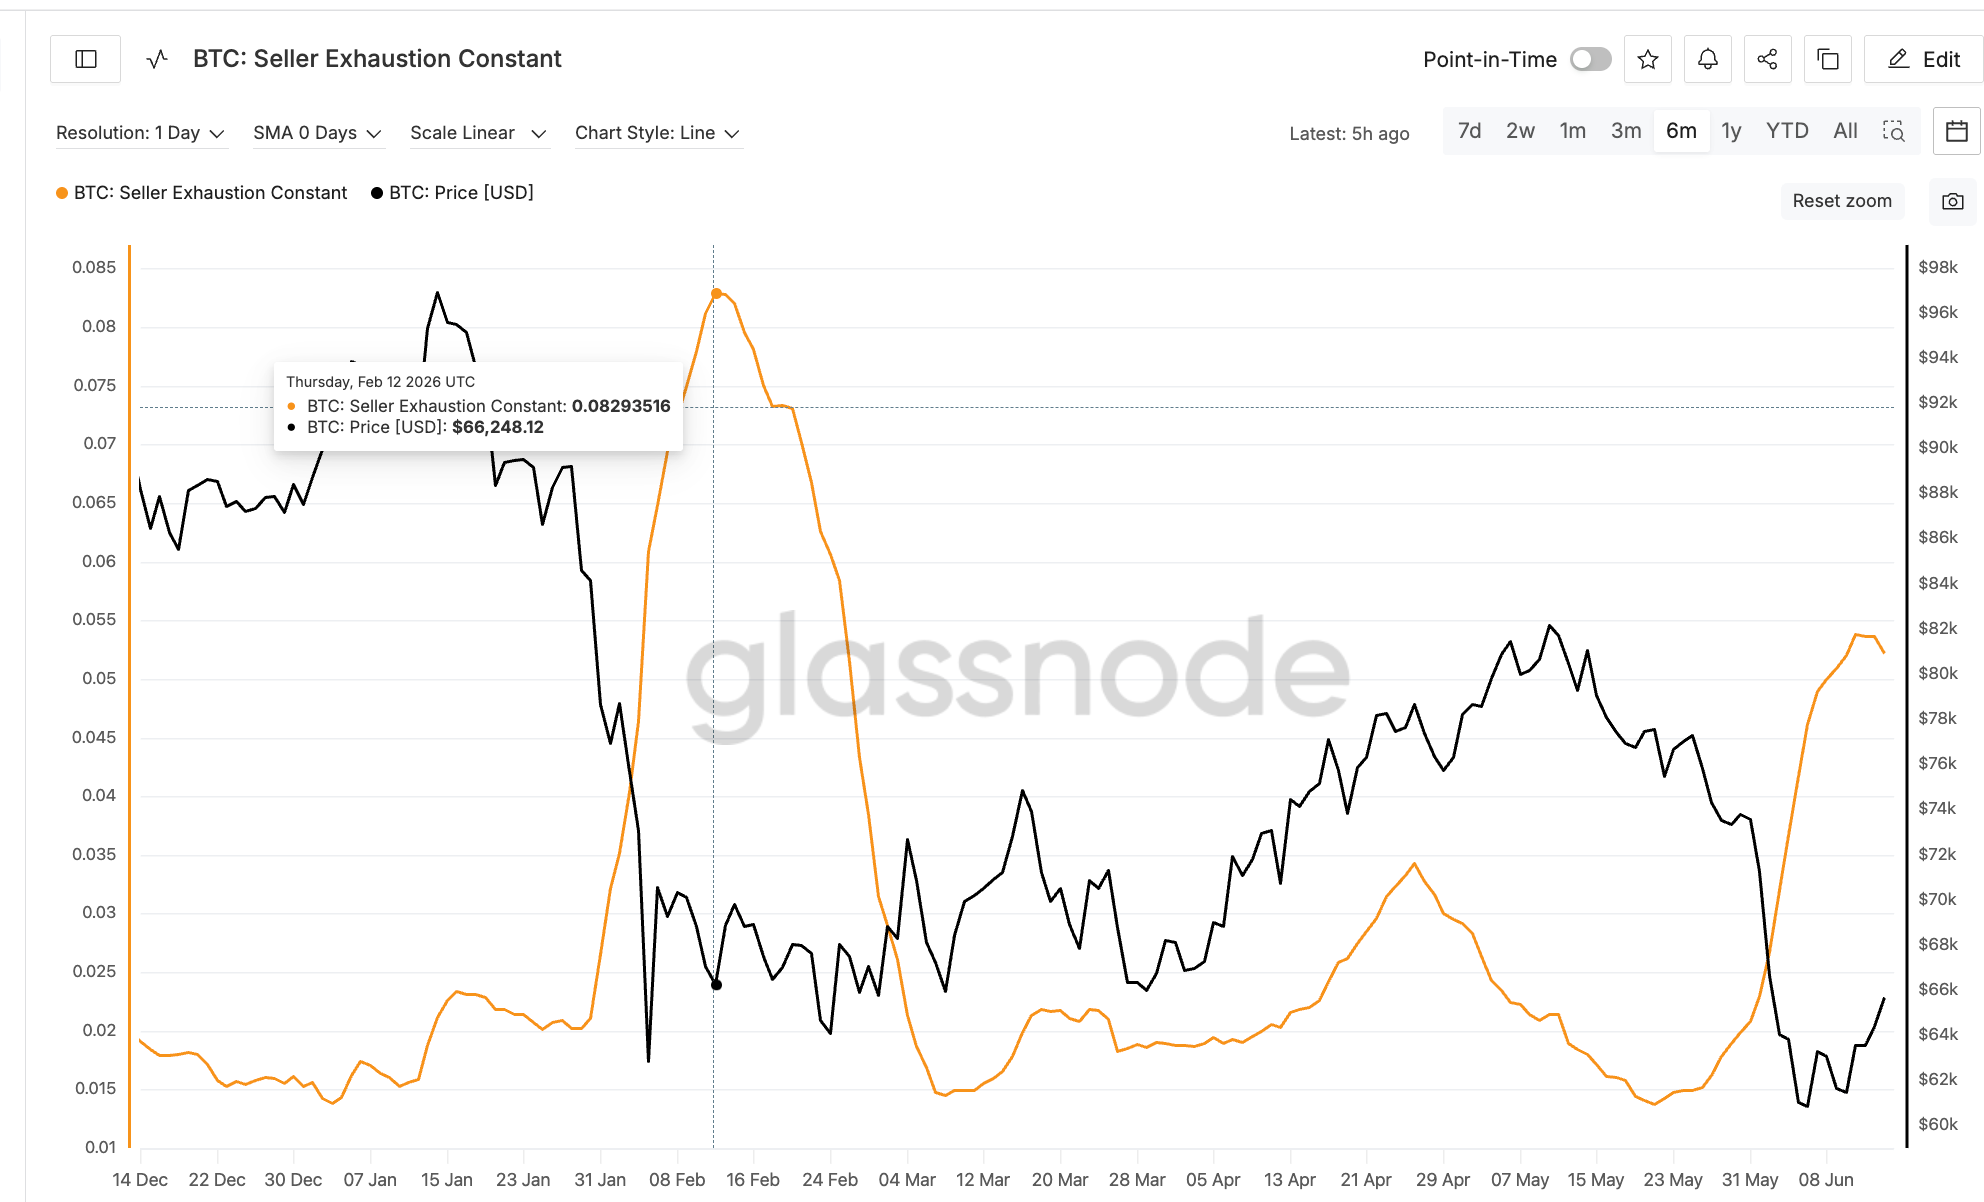
The starting point is a Glassnode metric called the Seller Exhaustion Constant. It multiplies the share of Bitcoin supply in profit by 30-day price volatility to flag low-risk bottoms, and it was first developed by ARK Invest.
Want more token insights like this? Sign up for Editor Harsh Notariya’s Daily Crypto Newsletter here.
History gives it weight. The metric peaked at 0.082 on February 12, when BTC traded near $66,248. Price then climbed to about $82,186 by May 10, a gain of roughly 24%.

The signal marked the start of that run.
It has now flashed again. On June 11, the metric hit 0.053, its second-highest reading in six months.

That repeat is why the current setup matters, and the next layer shows who acted on it.
Whales Bought Into the Exact Signal
Large holders moved on the same cue. One of the biggest Bitcoin whale cohorts, holding between 100,000 and 1 million BTC, lifted its stash from about 693,600 BTC to 694,390 from June 11, the same day the signal fired.
Smaller whales followed. The cohort holding 1,000 to 10,000 BTC grew its position from roughly 4.24 million to 4.25 million BTC starting June 13. Together the two groups added close to 11,000 BTC, worth around $700 million at current prices.

The timing is the point. Whales accumulated on the exact signal that historically preceded gains, so the metric and the largest holders agree. The price chart shows whether the structure backs them.
Bitcoin Price Levels to Watch as the Rebound Meets Resistance
BTC rebounded from its $59,100 low and crossed $64,694 on June 11, the trigger that aligned with the signal. Bitcoin price trades near $65,800, now testing overhead resistance.
The bullish case builds on the setup. A reclaim of the 20-day exponential moving average at $66,610, a trend gauge that smooths recent price, opens $68,155, the 0.382 Fibonacci level that measures the proportional pullback from the prior swing.
Clearing that targets $70,953. If the US-Iran deal keeps supporting risk and retail joins the whales, a move toward $73,750 and then the 200-day EMA at $78,668 could follow, with $82,805 as the stretch target, echoing the last run. That implies a possible 8% move and more if momentum builds. Right now, the overall buyer-specific volume is on the decline as retail might be needing some more confirmation.

The bearish case rests on participation. Buying volume has weakened since June 11 even as price rose, which shows whales are adding but retail has not joined.
Without that demand, BTC could stall at $66,610 and slip back toward the $64,694 level it just reclaimed. A daily close above $66,610 confirms strength, while rejection there keeps the rebound capped.
The post Bitcoin Whales Scoop $700 Million Into the Same Setup That Sparked a 24% Rally appeared first on BeInCrypto.

Bitcoin surged to just under $66,000 in Monday morning trading after US President Donald Trump claimed the United States had brokered a peace deal with Iran that would reopen the Strait of Hormuz. Trump said the agreement was completed late Sunday and authorized both the “toll-free opening” of the strategic waterway and the removal of any US naval blockade, adding that “oil will flow” again.
The move quickly spilled into crypto markets. According to TradingView data cited by Cointelegraph, bitcoin reached $65,881 on Coinbase during Monday morning trading—its highest print over roughly the past 12 days. The price had not traded above $66,000 since June 3, highlighting how closely investors were tracking the geopolitical storyline for near-term risk relief.
Key takeaways
- Bitcoin approached $66,000 after Trump claimed a US-Iran peace arrangement would reopen the Strait of Hormuz and remove a US naval blockade.
- Traders appears to have interpreted the announcement as a reduction in geopolitical risk and potential oil-supply pressure, supporting a “risk-on” move into crypto.
- US and Iranian officials confirmed aspects of an agreement, but the full deal details were not immediately available to markets, leaving room for last-minute friction.
- Crypto’s broader market followed higher, while crude benchmarks fell sharply during the same window.
- Additional volatility could come midweek ahead of the Federal Reserve’s interest-rate decision under new chair Kevin Warsh, with markets split by inflation dynamics.
Geopolitics meets liquidity: why bitcoin reacted
Trump posted on Truth Social that “the deal with the Islamic Republic of Iran is now complete,” and he separately called for the immediate authorization of the Strait of Hormuz opening alongside the removal of the US naval blockade. He framed it as enabling global shipping and oil movement.
While the market may focus on crypto fundamentals, the reaction underscored how quickly bitcoin can trade as a macro-sensitive asset when major geopolitical risk shifts. Andri Fauzan Adziima, research lead at the Bitrue Research Institute, told Cointelegraph that the potential deal “removes a major geopolitical risk premium,” prompting a “clear risk-on move as uncertainty fades.” He added that bitcoin’s strength was accompanied by traders rotating back into crypto amid “lower oil pressure” and a broader stability narrative tied to a pro-crypto administration.
Still, Adziima cautioned that despite the bullish price action, the situation may not be fully settled. He flagged the risk of “last-minute signing issues,” reflecting a common reality in macro-driven crypto rallies: confirmation can matter as much as headlines.
What’s confirmed—and what remains unclear
Markets reacted positively to the latest claims, but key implementation details were not immediately available. Cointelegraph noted that the precise terms of the US-Iran deal were not released at the time of reporting and that it would not take effect until Iran signs. Iran’s signing was expected on Friday, according to Associated Press reporting, under mediation by Pakistan.
On the Iranian side, Cointelegraph reported that Iran’s deputy foreign minister, Kazem Gharibabadi, confirmed the agreement on state television. The secretariat of Iran’s Supreme National Security Council also stated that the war on all fronts “will end immediately and permanently beginning tonight” and that the US blockade “will be terminated immediately and in full.”
This mix—US messaging emphasizing authorization and Iranian confirmation of termination—was enough to shift trader expectations quickly. However, the gap between “claimed completion,” “signing expected Friday,” and “details not immediately available” is precisely where uncertainty can linger, even when the initial reaction looks decisive.
Ripple effects across crypto and energy markets
Bitcoin’s rally was not isolated. Cointelegraph reported that the broader crypto market gained around 2% in total capitalization on the day. Several altcoins were described as outperforming, including Hyperliquid (HYPE), Zcash (ZEC), and Near Protocol (NEAR), with some posting double-digit gains.
Energy moves offered additional confirmation that traders were leaning into the “reduced pressure” narrative. Cointelegraph cited crude oil weakness, with WTI falling about 5% to just above $80 per barrel—its lowest level since early March—while Brent dropped around 4.6% to $83.30. A drop in oil prices often signals expectations of easing supply disruption risk, which in turn can reduce one layer of macro uncertainty affecting risk assets.
Bitcoin’s technical backdrop also matters: Cointelegraph noted that bitcoin has been gradually trending up since dipping briefly below $60,000 on June 6. Even with Monday’s strength, the asset remains down roughly 48% from its October peak above $126,000, suggesting the current rally is more of a recovery leg than a full reversal of the larger decline.
Midweek macro catalyst: the Fed decision risk
Even with geopolitical relief in focus, crypto traders have another immediate macro variable to watch. Cointelegraph reported that Wednesday may bring additional volatility as the Federal Reserve schedules its interest-rate decision under new chair Kevin Warsh.
Cointelegraph also cited that Warsh’s positioning appears more receptive to rate cuts, while ongoing inflation—described as topping 4% again in the cited coverage—bolsters the case for possible rate increases. The conflicting signals underline why rate decisions often amplify swings in both risk sentiment and crypto liquidity.
According to Cointelegraph, the CME Fed Watch tool currently predicts a 96.6% probability that rates will remain unchanged at a range of 3.5% to 3.75%. While that suggests limited odds for immediate changes, the bigger risk for traders is what the Fed implies about the path ahead—especially if inflation proves sticky or if communications shift expectations quickly.
For now, the market is trading a geopolitical headline with real macro implications: reopenings, blockade terminations, and—critically—execution. Investors should watch for final agreement language, the timing of Iran’s signature expected Friday, and whether oil continues to ease; alongside that, Wednesday’s Fed decision could determine whether this relief rally holds or flips back into higher volatility.

Investors are focused on the Bank of Japan’s policy meeting on 16 June. According to a Reuters survey published on 10 June, the majority of economists expect the benchmark interest rate to be raised to 1% — a level not seen for decades. The market is also reacting to the Producer Price Index (PPI) data released on 10 June, which points to ongoing inflationary pressures.
For the Japanese market, not only the rate decision itself matters, but also its impact on the yen. Monetary policy expectations influence the outlook for export-oriented companies included in the Japan 225 index (J225 on FXOpen), prompting investors to assess both the BoJ’s decision and any signals regarding policy moves in the second half of the year.
Technical Picture
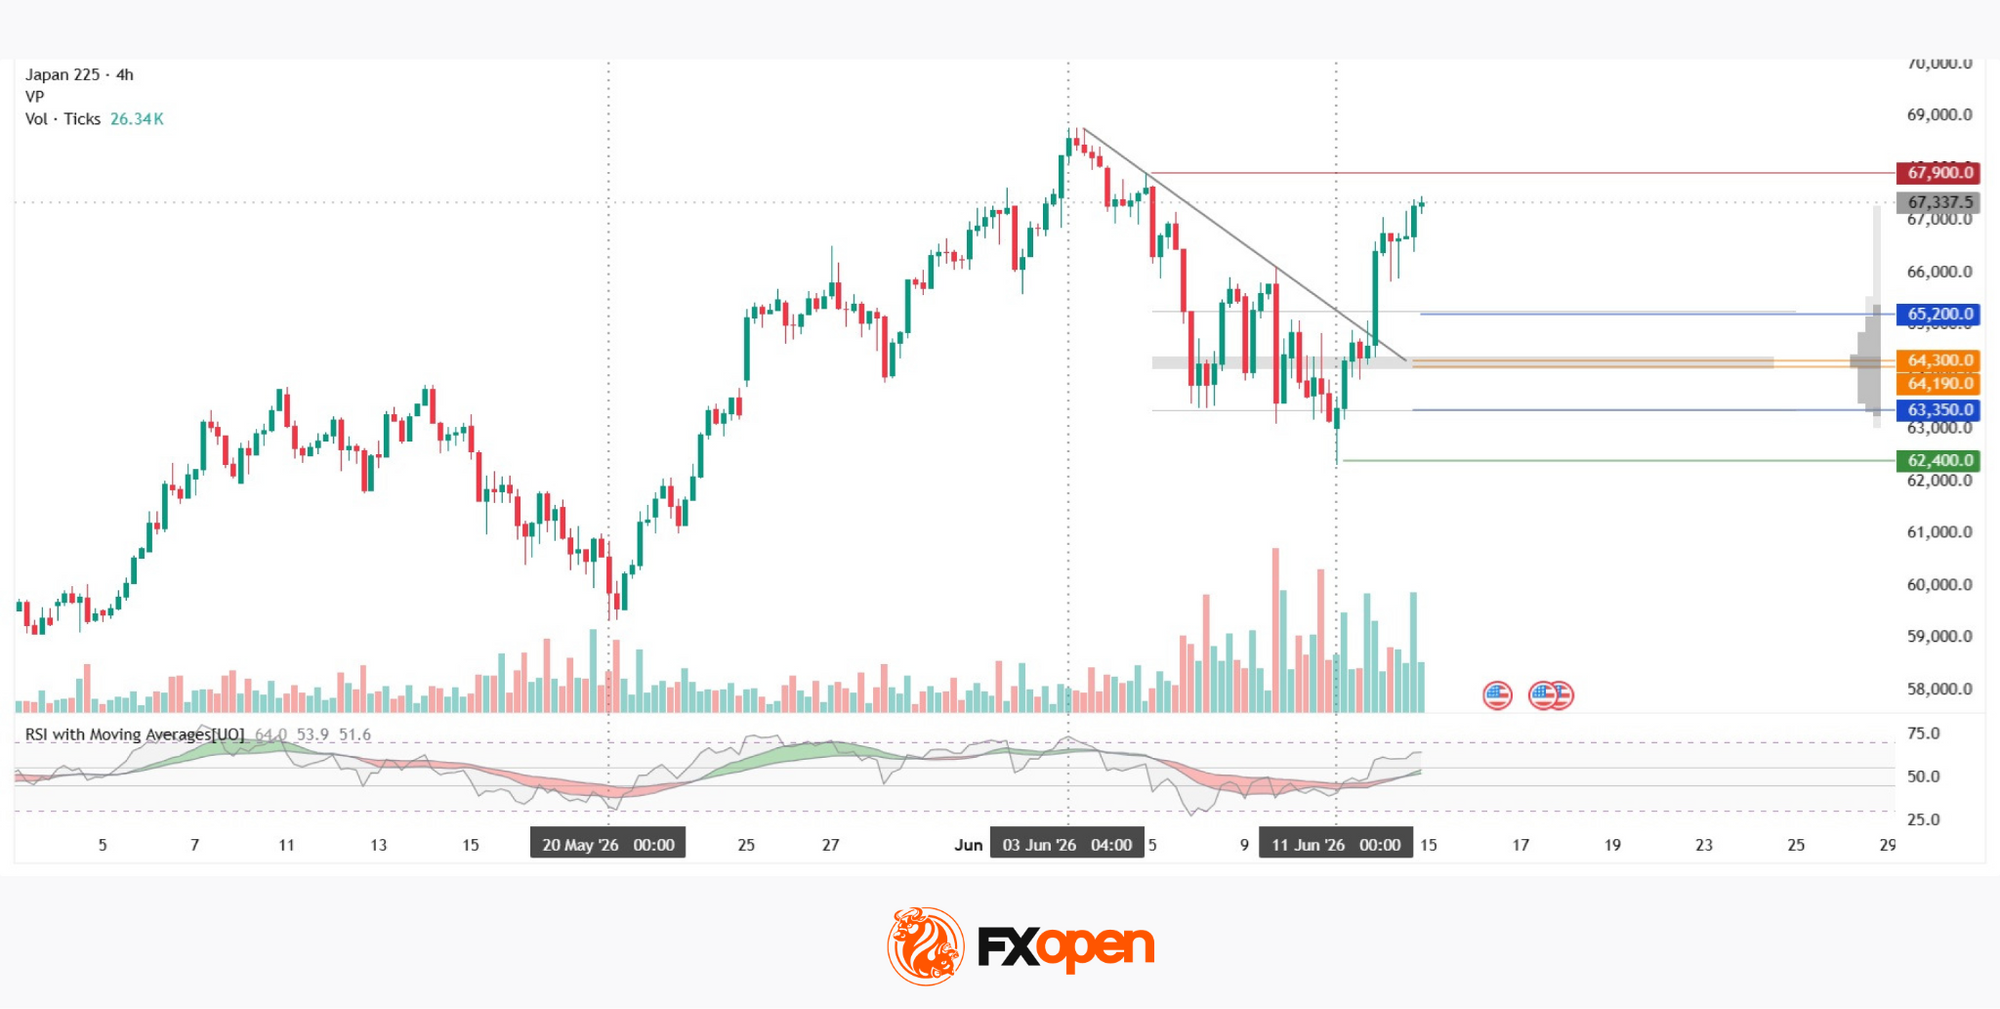
After completing its upward trend near the 68,700 area, the Japan 225 index came under pressure and formed a corrective trend structure. However, sellers have lost momentum in recent sessions, and following the break of the trend, the price has moved above the upper boundary of the profile. If the current bullish impulse persists, the resistance area around 67,900 could attract renewed selling interest. Should buying activity weaken, the upper boundary of the current profile at 65,200 may serve as the nearest support zone.
A deeper decline would bring the Point of Control (POC) area at 64,190–64,300 into focus. If sellers manage to push the price below both the POC and the lower boundary of the profile, the green support zone around 62,400 could become the next key downside target.
RSI + MAs currently shows readings of 64, 53 and 51. The main RSI line remains above both averages and has not yet entered overbought territory. The moving averages are turning higher and have approached the upper boundary of the neutral zone near 55. It is also worth noting the elevated trading volume recorded on 12 June, which adds significance to the current market setup.
Key Takeaways
The market is awaiting the Bank of Japan’s interest-rate decision amid a recovery following the recent correction. The next move may depend both on the regulator’s rhetoric and on the market’s ability to remain above the upper boundary of the profile. RSI + MAs remains in the green.
Trade global index CFDs with zero commission and tight spreads (additional fees may apply). Open your FXOpen account now or learn more about trading index CFDs with FXOpen.
This article represents the opinion of the Companies operating under the FXOpen brand only. It is not to be construed as an offer, solicitation, or recommendation with respect to products and services provided by the Companies operating under the FXOpen brand, nor is it to be considered financial advice.


Crypto traders enter June 15 with U.S. data releases and a Federal Reserve decision in focus.
Summary
- Bitcoin climbed above $65,500 as U.S.-Iran deal eased oil and inflation concerns.
- Markets expect Fed to keep rates unchanged during Kevin Warsh’s first policy meeting this week.
- Retail sales, housing starts and manufacturing data could shape crypto risk appetite this shortened week.
The Kobeissi Letter listed May industrial production on Monday, housing starts on Tuesday, retail sales on Wednesday, and the Philly Fed Manufacturing Index on Thursday.
U.S. markets will close Friday for Juneteenth. That leaves traders with less time to react to new data, the Fed decision, and comments from Kevin Warsh after the meeting.
Warsh faces first rate decision
The Federal Reserve will announce rates on Wednesday. Markets widely expect policymakers to keep rates unchanged at 3.50% to 3.75%, as crypto traders watch inflation, growth, and borrowing costs.
Kevin Warsh took office as Fed chair in May, and the June meeting will give markets their first full look at his approach. MarketWatch said economists remain unsure whether he will lean toward rate cuts or take a firmer line on inflation.
Joseph Brusuelas, chief economist at RSM, told MarketWatch that “it all puts Warsh in a difficult position.” He said Warsh had backed rate cuts while seeking the role, but higher prices now make that path harder.
Iran deal lifts risk mood
Crypto markets reacted to the latest U.S.-Iran peace deal claims. President Donald Trump wrote on Truth Social that “The Deal with the Islamic Republic of Iran is now complete. Congratulations to all!” He also said he had authorized the reopening of the Strait of Hormuz and the removal of the U.S. naval blockade.
The announcement eased energy pressure. Oil prices fell, while stock futures rose. Lower oil prices can reduce inflation fears, helping risk assets such as Bitcoin, ether, and major altcoins.
crypto.news reported Monday that Bitcoin climbed above $65,500 after the U.S.-Iran deal lifted markets. The report said BTC traded near its highest level in almost two weeks as traders priced in lower oil stress and a better global market mood.
Bitcoin rebound still faces tests
The recovery follows a volatile period for digital assets. crypto.news earlier reported that traders had positioned themselves for a Fed pause, with CME FedWatch data showing a probability near 98% that rates would stay unchanged at the June 16-17 meeting.
Bitcoin still faces resistance near $68,000, according to crypto.news market coverage. Ether traded near $1,700, while XRP, Solana, Cardano, and Hyperliquid also moved higher during the relief rally.
The next test will come from the Fed statement, the dot plot, and Warsh’s press conference. If the Fed signals higher rates for longer, crypto gains may slow. If inflation fears ease, traders may extend the rebound.


An attacker drained more than $2.1 million from Aztec Connect on June 14 by exploiting a flaw in the platform’s proof verification logic.
Blockchain security firm CertiK flagged the suspicious transaction on X (formerly Twitter).
Aztec Connect Exploit Nets Attacker $2.1 Million
CertiK said the exploit appears to stem from incomplete validation of submitted proof data. According to the security firm, one contract function verified only the beginning of the proof, while token transfer instructions embedded elsewhere in the data may not have been properly checked. This potentially allowed the attacker to manipulate withdrawals and drain approximately $2.19 million.
Follow us on X to get the latest news as it happens
The Aztec Foundation said it was notified of a potential exploit involving Aztec Connect. The team stressed that the incident does not affect the AZTEC ERC-20 token or any smart contracts associated with the current Aztec network.
The foundation noted that Aztec Connect was deprecated three years ago. Thus, Aztec Labs no longer has any control over the system.
Aztec Labs also confirmed an active investigation. However, the team said it has no way to step in.
“Aztec Labs holds no admin keys or control over the system; it cannot be paused or upgraded by us,” the post read.
The incident came just days after a separate exploit on Raydium (RAY). The incident resulted in the loss of roughly $1.3 million after attackers drained five legacy liquidity pools on the Solana (SOL) network.
The attack adds to the growing list of exploits recorded this month, which have collectively resulted in losses of approximately $43.93 million, according to DeFiLlama.
Subscribe to our YouTube channel to watch leaders and journalists provide expert insights
The post Attacker Drains $2.1 Million From Aztec Connect 3 Years After Its Shutdown appeared first on BeInCrypto.
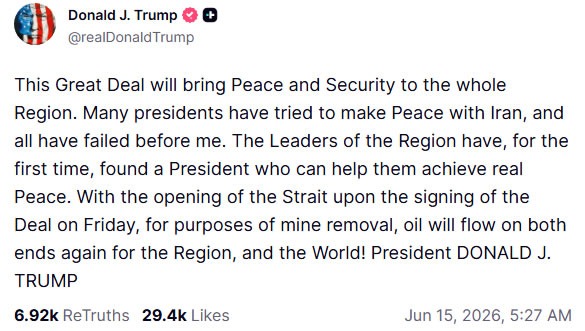
Bitcoin came just shy of $66,000 during Monday morning trading after US President Trump claimed that the US had brokered a peace deal with Iran that would reopen the Strait of Hormuz.
“The deal with the Islamic Republic of Iran is now complete. Congratulations to all!” Trump posted on his Truth Social platform late on Sunday.
“I hereby fully authorize the toll-free opening of the Strait of Hormuz, and, simultaneously herewith, authorize the immediate removal of the United States Naval blockade,” Trump said. “Ships of the World, start your engines. Let the oil flow!”
“With the opening of the Strait upon the signing of the deal on Friday […] oil will flow on both ends again for the region, and the World!” he said in a separate post.

Source: Donald Trump
Trump has claimed dozens of times over the last two months that a deal to end the war was near, and the crypto markets have traded on news of the Iran war since it started in February with US-Israeli strikes.
Markets reacted positively to Trump’s latest claim, with Bitcoin (BTC) reaching $65,881 on Coinbase on Monday morning, according to TradingView. It is the highest the asset has traded over the last 12 days, having not been over $66,000 since June 3.
Andri Fauzan Adziima, the research lead at Bitrue Research Institute, told Cointelegraph that the potential deal “removes a major geopolitical risk premium, triggering a clear risk-on move as uncertainty fades.”
“Bitcoin has broken above $65,000, fueled by traders rotating back into crypto amid lower oil pressure and a broader stability narrative under a pro-crypto administration,” he added, but cautioned that there could be “last-minute signing issues” with the deal.
The details of the deal between the US and Iran were not immediately available, and it would not be implemented until Iran signs, which is expected on Friday under mediation by Pakistan, the Associated Press reported.
Related: Trump says Iran peace deal to be signed Sunday, contradicting Tehran
Iran’s deputy foreign minister, Kazem Gharibabadi, confirmed the agreement on state television while the secretariat of Iran’s Supreme National Security Council said the war on all fronts “will end immediately and permanently beginning tonight” and that the US blockade “will be terminated immediately and in full.”
Bitcoin has been gradually trending up since it fell below $60,000 briefly on June 6; however, it remains 48% down from its peak of over $126,000 in October.
The broader crypto market also gained 2% in total capitalization on the day, with several altcoins, including Hyperliquid (HYPE), Zcash (ZEC) and Near Protocol (NEAR) were outperforming, some with double-digit percentage gains.
There was also movement in crude oil prices, with WTI Crude falling 5% to its lowest level since early March at just over $80 per barrel, while Brent Crude mirrored the move, dropping 4.6% to $83.30.
More volatility may be ahead
Wednesday could add more volatility to crypto markets as the Federal Reserve is scheduled to make its interest rate decision, the first under new chair Kevin Warsh.
The new central bank chair appears more receptive to cuts, but increasing inflation, which has topped 4% again, strengthens the case for rate increases.
The CME Fed Watch tool currently predicts a 96.6% probability that rates will remain unchanged at 3.5% to 3.75%
Magazine: OpenAI files for IPO, SEC scraps 611 rule and Hungary overhauls crypto: Hodlers Digest


Ripple’s UK and Europe head Cassie Craddock says banks and financial institutions see clear value in digital asset technology, but many still need a simpler way to use it.
Summary
- Ripple says banks want partners to handle custody, liquidity, settlement and compliance for digital assets.
- UK and Luxembourg licences give Ripple a regulated base for cross-border payment growth in Europe.
- Banks are increasingly seeking blockchain payment tools that reduce technical complexity and streamline implementation.
In a post shared after her appearance on FinTech Futures’ What the FinTech? podcast, she said institutions want support across custody, liquidity, settlement and compliance.
Craddock said banks want partners that can reduce the work needed to connect with digital asset rails. She wrote that firms want to focus on “delivering better experiences for their customers,” rather than building every part of the system alone.
Ripple points to licensing push
Ripple has framed its UK and European strategy around regulated access to blockchain-based payments. The company secured an Electronic Money Institution licence and Cryptoasset Registration from the UK Financial Conduct Authority in January 2026. It later received full Electronic Money Institution approval from Luxembourg’s CSSF, giving it a route to scale payment services across the European Union.
Craddock said financial institutions now want partners that pair new technology with clear legal standing. In her post, she said Ripple’s recent licences in the UK and Luxembourg form part of a regulatory base that supports “faster, more transparent and more cost-effective cross-border payments in a compliant way.”
https://x.com/CraddockCJ/status/2066373507634565340
Meanwhile, on the podcast, Craddock discussed Ripple’s investment plans in the UK and Europe, the region’s rules for digital assets and the future of cross-border payments. FinTech Futures said the episode also covered stablecoins and how Ripple’s dollar stablecoin fits into its wider payment strategy.
Craddock said Ripple has worked with large banks for many years. She added that this record helps the company present itself as a trusted partner for firms that need tested infrastructure. The message fits a wider push by crypto payment firms to serve banks without forcing them to manage every technical part of digital asset settlement.
Broader market moves toward regulated rails
Recent crypto.news coverage shows that institutional payment firms are building products that hide blockchain complexity from banks and businesses. Circle launched a managed stablecoin settlement service for banks and fintechs. Cecabank also moved a MiCA-regulated custody and trading platform into production for financial institutions in Europe.
These launches point to the same demand described by Craddock. Banks want faster settlement and lower costs, but they also need controls, licence coverage and clear operating rules. That need gives regulated crypto infrastructure firms a stronger role in payment services. It also places more attention on providers that can manage onboarding, monitoring and reporting inside one service.
Ripple’s pitch centers on cross-border payments, where banks still face delays, fees and capital tied up in old systems. Its licensing in the UK and Luxembourg gives the company more room to offer regulated services in key European markets. The company’s next task is to turn licensing progress into steady bank usage across real corridors.
Social media ban: Government issues update about curfew for 16 and 17 year olds
Rajesh Exports shares jump 5% after 30% crash in 7 days. How the alleged Rs 15.15 lakh cr fraud saga unfolded

Cathie Wood’s Ark Invest bought 3.3 million SpaceX shares on its IPO day


-

 Crypto World4 days ago
Oppenheimer backs SpaceX as $70 billion retail frenzy builds
-

 Business17 hours ago
No Jackpot Winner as $257 Million Prize Rolls Over to $269 Million Monday Draw
-

 Crypto World4 days ago
Markets Rally as SpaceX IPO Looms Amid Iran Tensions and Inflation Surge
-

 Sports7 days ago
FIFA WC 2026 Group C: Morocco, Scotland challenge Brazil’s hunt for glory | FIFA World Cup 2022
-

 Fashion3 days ago
Weekend Open Thread: Tuckernuck – Corporette.com
-
 Crypto World7 days ago
Eli Lilly (LLY) Stock Surges 4% Following Breakthrough Sleep Apnea Trial Results
-
 Crypto World9 hours ago
Zimbabwe Requires Crypto Businesses to Register Annually Under New FIU Regulations
-

 Entertainment6 days ago
The Ryan Gosling True Crime Thriller On Netflix That Gets Even Stranger, Stream It Now
-
 Sports6 days ago
Bangladesh beat Australia after 20 years in ODIs, register only their second win over six-time world champions | Cricket News
-

 Tech2 days ago
NanoClaw integrates JFrog registries to secure AI agent downloads
-

 Tech3 days ago
This Week In Security: Microsoft On Microsoft, Register Your Domains, Linux On ARM, And FreeBSD Joins The File Cache Club
-

 Crypto World2 days ago
Bitget enters Argentina’s regulated crypto market through PSAV registration
-

 Politics4 days ago
Politics Home | Healey Resignation Is “Colossal Failure Of Government”, Says Former Labour Defence Secretary
-

 Tech5 days ago
‘This is Seattle’s position on AI’: City Council votes unanimously to pause big new data centers
-
 Tech4 days ago
Dutton Ranch star claims they ‘didn’t see any disruption’ on set following Chad Feehan’s exit from Yellowstone spinoff fueled by Taylor Sheridan clash rumors
-

 NewsBeat3 days ago
El Nino has formed in the Pacific and could set records, forecasters say
-
 Entertainment4 days ago
Donnie Wahlberg & More Heat Up Las Vegas at Circa’s Barry’s Downtown Prime
-

 Sports4 days ago
First Time Since 1971: Australia Register Historic Low In ODI Cricket
-
 Tech4 days ago
Opendoor Ends India Operations, Fueling a Bigger Conversation About AI and Outsourcing
-

 Tech7 days ago
Nvidia and Hyundai deepen their robotics push around Atlas
You must be logged in to post a comment Login