

Crypto World
ORDI Surges 200% Amid Altcoin Rally, Prints God Candle

Ordinals (ORDI) posted a 94% single-day gain on April 16, pushing directly into its first major Fibonacci resistance zone. The move follows months of base-building and a falling wedge breakout visible across multiple timeframes.
A massive volume surge accompanied the advance, driving price from the $2.00 range to above $6.60. ORDI is now testing the 0.382 Fibonacci retracement at $6.488 after opening the session at $3.444.
Volume Explosion Drives ORDI Into Fibonacci Resistance
The daily chart shows a prolonged downtrend that stretches back to the all-time high. A Fibonacci retracement runs from the May 14, 2025 high of $13.61 to the March 29 low of $2.085. That grid maps the key recovery levels ahead.
ORDI spent months building a base below the 0.236 level at $4.805. A green accumulation zone formed between $3.60 and $4.00 from late 2025 through early 2026, with a series of higher highs and higher lows developing inside that range.
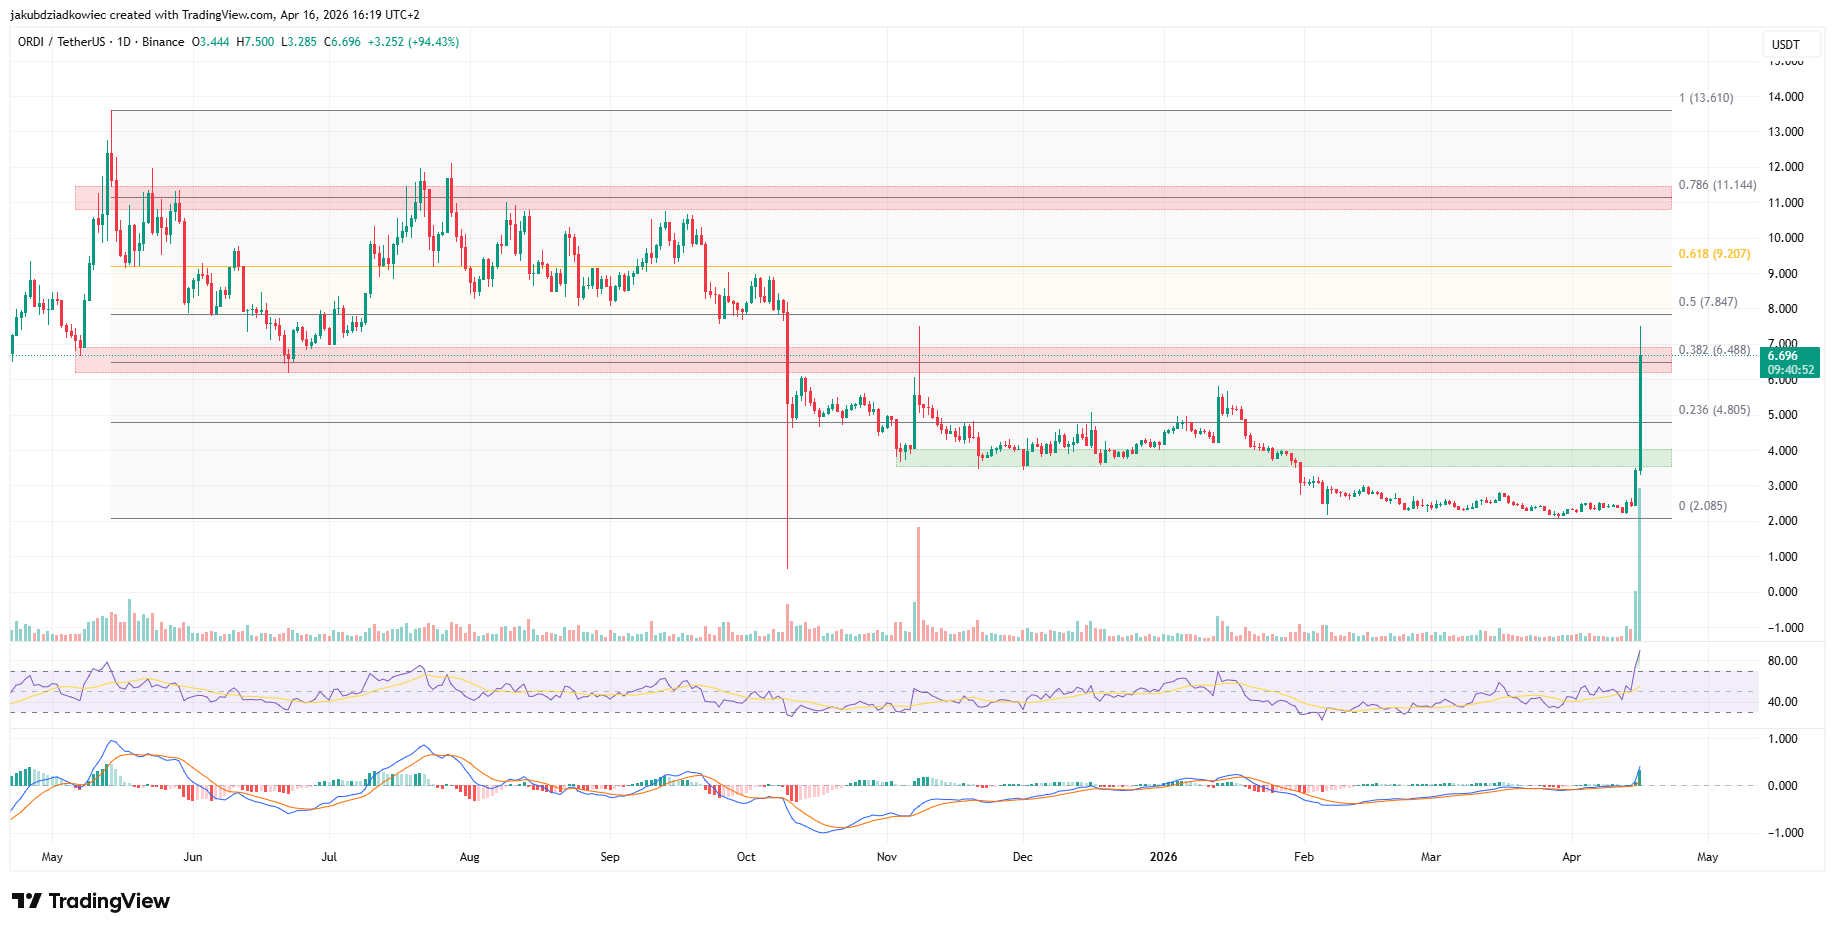
Today’s candle drove price through that zone and into the 0.382 resistance band at $6.488. A volume spike dwarfing recent activity fueled the move, with the daily bar reaching a high of $7.500 before pulling back toward $6.696.
The daily RSI is printing approximately 89, its highest reading in months. That level sits deep in overbought territory. A daily close above $6.488 would confirm the level as broken and redirect focus to higher targets. A rejection here could send ORDI back toward the $4.805 support.
One-Hour Chart Confirms Trend With No Bearish Divergence
The overbought daily RSI introduces caution. The one-hour chart, however, offers a contrasting read on near-term momentum.
From April 13, ORDI tracked a black exponential growth curve, with each candle printing new highs at an accelerating pace. Price accelerated sharply on April 16, lifting from roughly $2.50 to a high of $6.896 in a matter of hours.
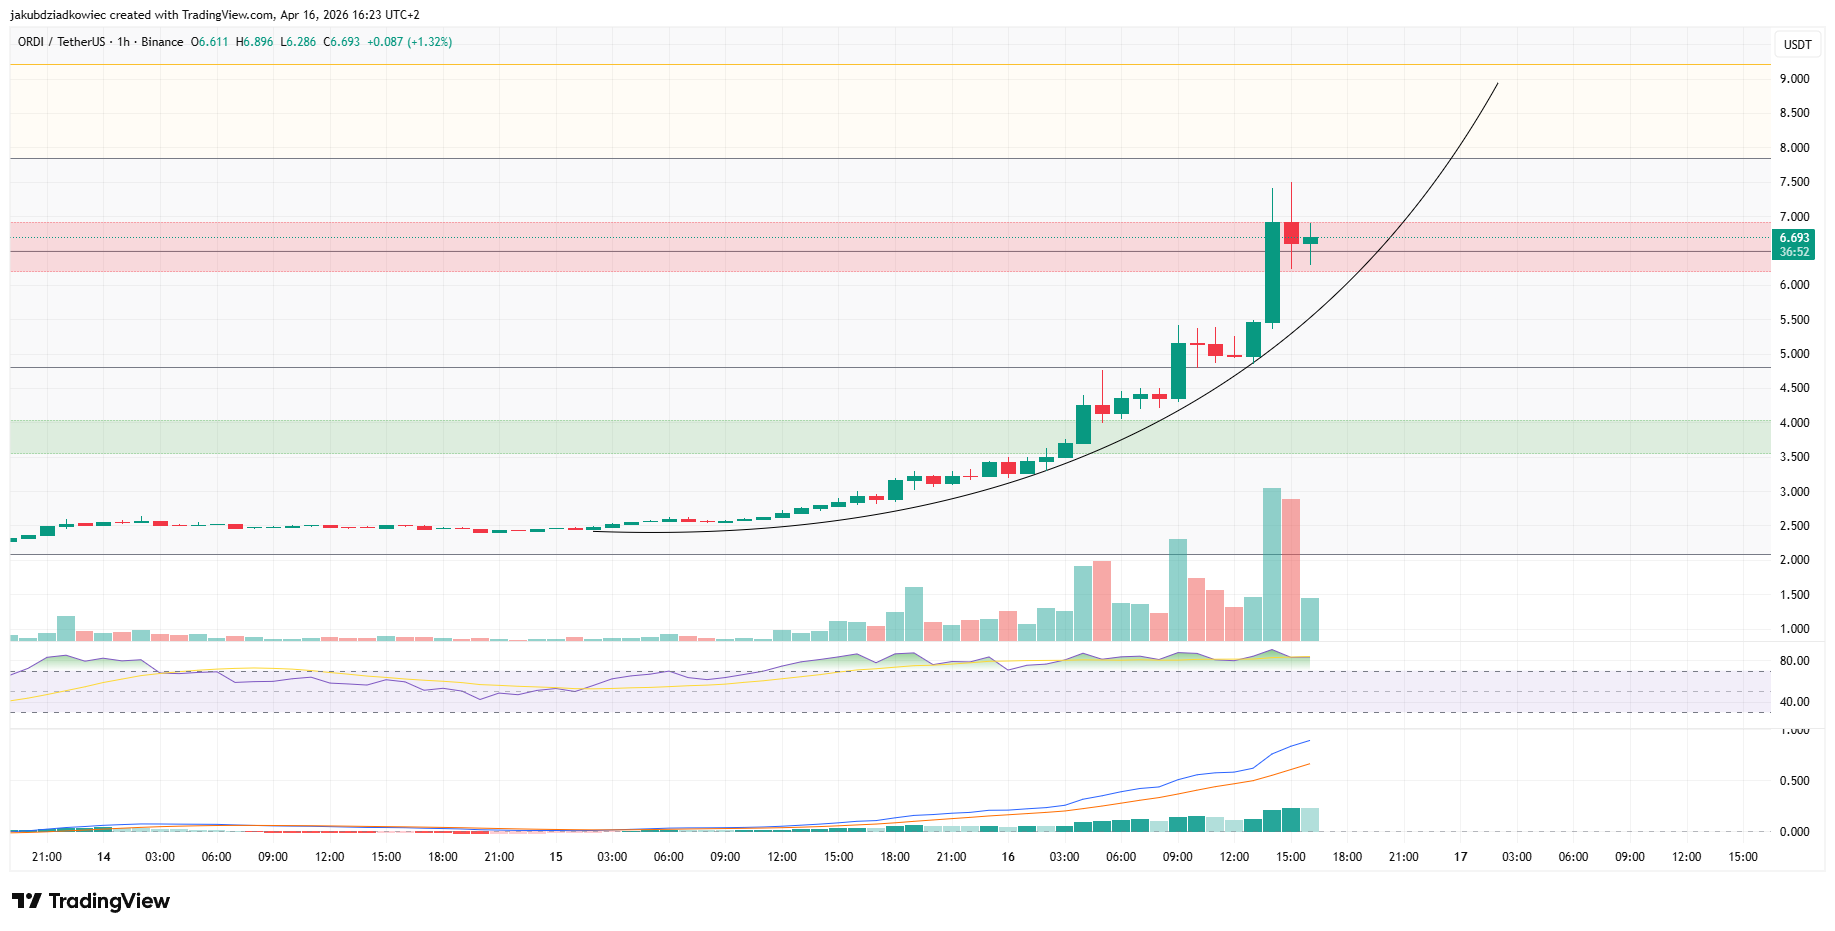
Neither the RSI nor the MACD on the one-hour timeframe shows any bearish divergence. Both indicators are rising alongside price, not lagging behind it. That distinction matters in strong trend environments, where ORDI has historically maintained momentum longer than overbought readings alone would suggest.
Price is currently consolidating inside the red resistance box between $6.50 and $7.00. A sustained break above that zone opens immediate targets at $8.00 and above $9.00. Should buyers lose control at current levels, the first meaningful support sits at the green zone between $3.60 and $4.00, with an intermediate buffer near $4.805.
ORDI Price Targets $11.40 as Falling Wedge Signals Extended Rally
The three-day chart published by analyst @CryptoCove adds a longer-term structural argument to the Ordinals breakout thesis. A falling wedge pattern, visible since mid-2024, is now breaking out with force.
The analyst projects a 335.65% move from the breakout point, with a target of $11.409. That figure sits near the 0.786 Fibonacci retracement at $11.144 identified on the daily chart. Both signals converge around $11.40, strengthening the case for that target.
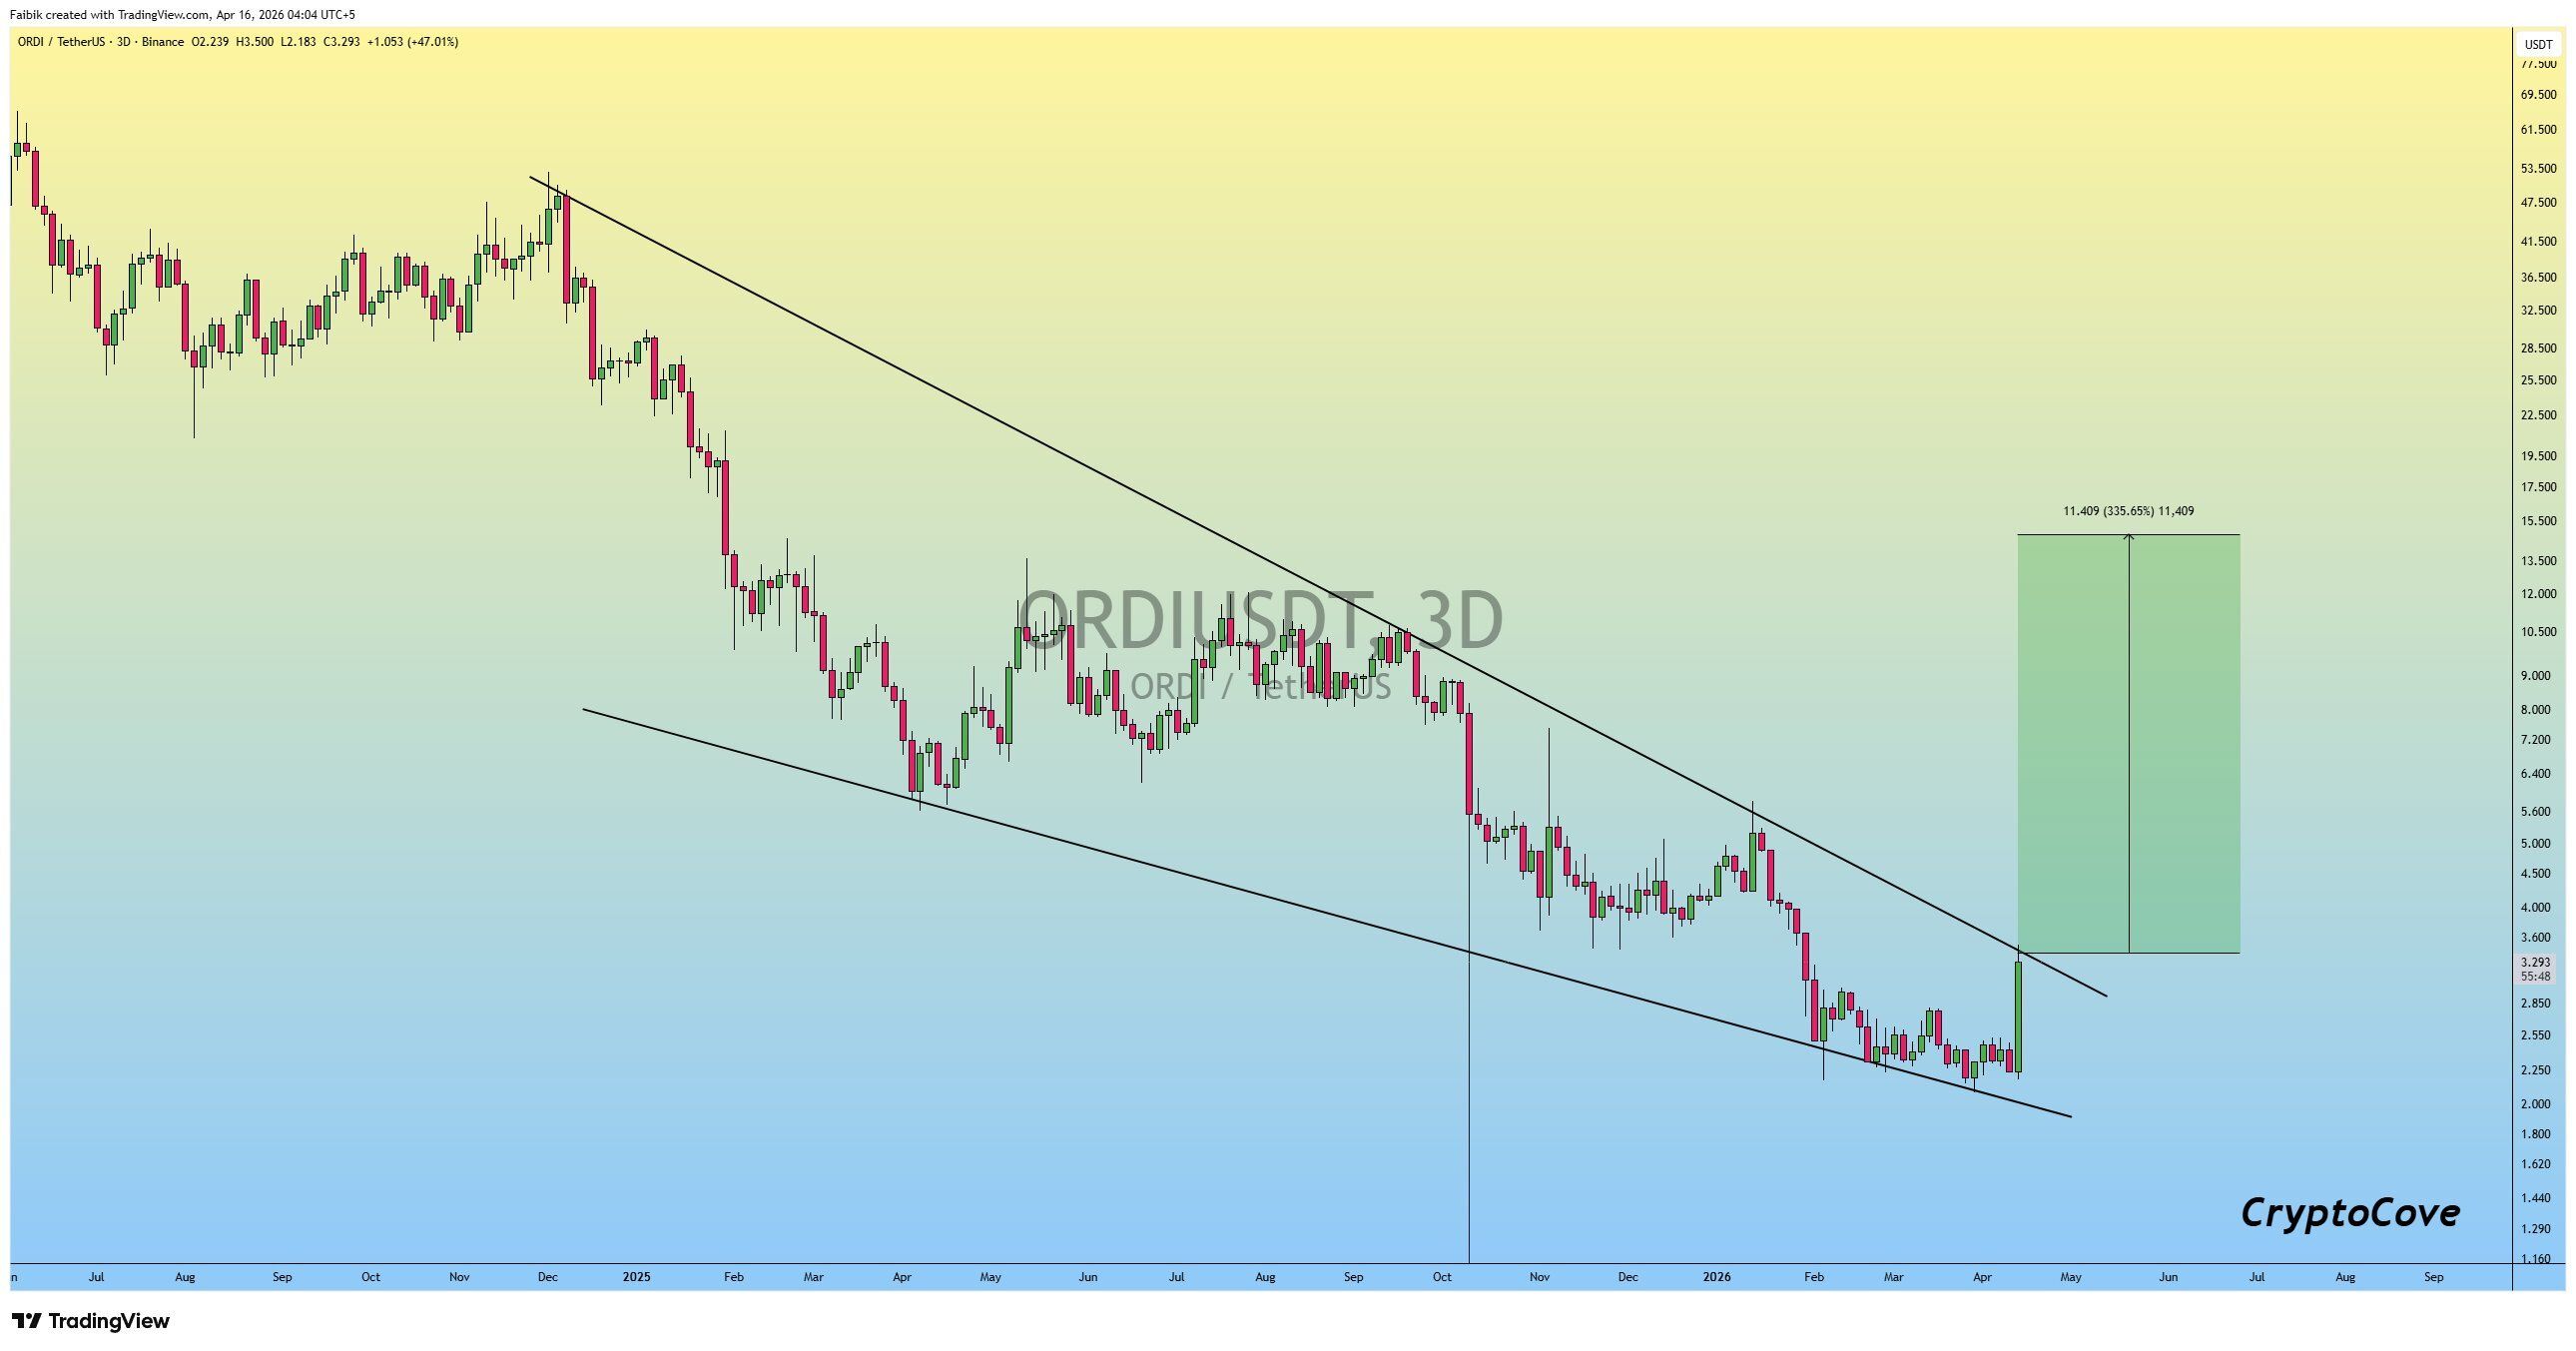
Three resistance zones stand between current price and $11.40. The 0.5 Fibonacci level at $7.847 is the first test. The golden pocket at 0.618, near $9.207, follows. The 0.786 retracement at $11.144 is the final structural hurdle before new highs become possible.
A failure to hold above $6.488 would delay the setup and put the green support zone back in play. But the volume behind today’s move and the aligned signals across three timeframes suggest that any dip toward support may attract fresh buyers.
The post ORDI Surges 200% Amid Altcoin Rally, Prints God Candle appeared first on BeInCrypto.

Wells Fargo reported larger positions in Ether exchange-traded funds in the first quarter while reshuffling its Bitcoin ETF holdings across several products, according to its latest Securities and Exchange Commission filing.
The bank said it raised its holdings in Ether (ETH) ETFs, including BlackRock’s iShares Ethereum Trust ETF (ETHA) and the Bitwise Ethereum ETF (ETHW), according to its latest Form 13F filing released on Monday.
ETHA rose 63.5% from about 672,600 shares in Q4 2025 to roughly 1.1 million shares in Q1 2026, while ETHW increased by 37% from about 186,800 to more than 257,000 shares, showing a broad-based increase across Ether-linked funds.
Bitcoin (BTC) ETF exposure, by contrast, showed a more mixed pattern: positions in the iShares Bitcoin Trust ETF (IBIT) were slightly reduced, while Bitwise Bitcoin ETF Trust (BITB) and Grayscale Bitcoin Mini Trust ETF (BTC) holdings increased by roughly 24% and 41%, respectively.
The filing suggests Wells Fargo reported larger Ether ETF positions at quarter-end, even as its Bitcoin ETF exposure was more mixed.
Accumulation amid ETH price dip
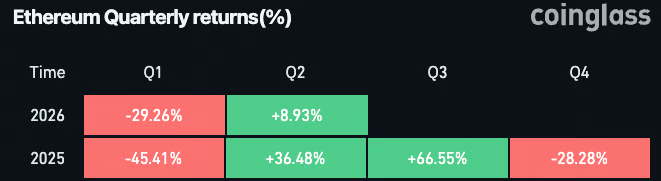
Wells Fargo’s Ether ETF accumulation came during a period of weakening spot prices. According to CoinGlass data, Ethereum posted two consecutive quarterly declines, falling around 28% in Q4 2025 and 29% in Q1 2026.
Over the same period, spot Ether ETFs saw sustained outflows, totaling roughly $769 million across three straight months of withdrawals.

Ethereum quarterly price performance data, 2025–2026. Source: CoinGlass
Despite the broader downturn, Wells Fargo held around $21.5 million in Ether ETFs in Q1 2026, with ETHA as the largest position at $17.6 million.
Bitcoin dominates holdings, equity rotations favor Strategy over Galaxy
Bitcoin ETFs remain the dominant crypto ETF exposure in Wells Fargo’s portfolio, with IBIT making up the bulk of the exposure at roughly $250 million.
In equities, Wells Fargo made a more pronounced shift in crypto-linked holdings. The bank significantly reduced its stake in Michael Novogratz’s Galaxy Digital (GLXY), cutting its position from about 2.5 million shares in Q4 2025 to roughly 78,600 shares in Q1 2026, a decline of nearly 97% and an estimated $54.7 million reduction in exposure.
Related: Galaxy Digital posts $216M Q1 loss as crypto market slides 20%
On the other hand, Wells Fargo significantly increased exposure to Michael Saylor’s Strategy, the world’s largest public Bitcoin holder.
The bank raised its stake from about 322,700 shares in Q4 2025 to roughly 726,000 shares in Q1 2026, a gain of around 403,000 shares, or 125%, and an estimated $41.6 million increase in exposure.
Magazine: Strategy reveals why they would sell BTC, Trump Media posts loss: Hodler’s Digest, May 3 – 9


U.S. inflation data came in hotter than expected on Wednesday, reinforcing expectations that the Federal Reserve will keep interest rates steady at 350-375bps not only at its June 17 meeting, but also likely through the end of the year.
The Consumer Price Index (CPI) year-over-year rose 3.8% in April, according to a report from the Bureau of Labor Statistics. Economists’ forecasts had been for a rise of 3.7% following March’s 3.3% increase.
On a month-over-month basis, CPI rose 0.6%, above expectations of 0.3% and up from March’s 0.2%.
Core CPI, which excludes food and energy costs, rose 0.4% in April versus forecasts of 0.2% and March’s 0.3%. Year-over-year core CPI was higher by 2.8% versus forecasts of 2.7% and March’s 2.6%.
Under pressure this morning, bitcoin traded at $80,700 following the report, down 1.2% over the past 24 hours.
U.S. stock index futures were down across the board, and the 10-year treasury yield came in higher at 4.44%. WTI crude oil is posing a threat to the markets, and is higher by 3% on the day at $101.
Ahead of the CPI data, markets were pricing in a 98% probability that the Federal Reserve would leave interest rates unchanged at its March meeting, according to the CME Fed Watch tool.
Kevin Warsh is set to be confirmed as the next Federal Reserve Chair this week, as he is expected to take over from Jerome Powell on May 15.

Key Takeaways
- On Holding surpassed Q1 projections with sales reaching 831.9 million Swiss francs, representing a 14.5% increase year-over-year
- Adjusted earnings per share reached 0.37 francs compared to analyst expectations of 0.27 francs
- Full-year gross profit margin guidance was elevated to a minimum of 64.5%, versus the previous 63% forecast
- The Asia-Pacific region delivered the strongest performance with 44.4% net sales growth; China recorded high-double-digit expansion
- Founders David Allemann and Caspar Coppetti assumed co-CEO roles, succeeding Martin Hoffmann
On Holding exceeded analyst projections for its first quarter across both top and bottom lines while upgrading its annual profitability forecast. Yet shares reversed an early premarket surge of over 6%, with ONON trading down approximately 3.2% at the most recent check.
Revenue totaled 831.9 million Swiss francs, marking a 14.5% rise from the prior year and representing the company’s first quarter exceeding the 800 million franc milestone. Measured in constant currency, the increase was 26.4%.
Adjusted earnings per share landed at 0.37 francs, comfortably beating the consensus target of 0.27 francs. Reported net income reached 103.3 million francs, almost doubling the 56.7 million francs recorded in Q1 2025.
Direct-to-consumer sales increased 16.4% to 322.3 million francs — though this narrowly missed the 326 million franc projection. Wholesale operations, which generate lower profit margins, expanded 13.3% to 509.6 million francs, exceeding the 499 million franc forecast.
Asia-Pacific Drives Expansion with China Leading the Charge
The Asia-Pacific territory emerged as On’s top-performing market during the quarter, with net sales surging 44.4% to 174 million francs — or 61.4% when adjusted for currency fluctuations. EMEA registered 22.8% growth while the Americas advanced 3.1%, equivalent to 17.1% in constant currency.
China delivered exceptional results. Revenue in the country is expanding at a high-double-digit pace, with apparel now comprising approximately 30% of China’s total sales — significantly higher than the roughly 6% share across the entire company. This performance stands in sharp contrast to Nike’s difficulties in the region, where domestic competitors have been capturing market share.
Co-CEO Caspar Coppetti attributed On’s success to its European heritage, which appeals to Chinese shoppers. “We’re Swiss and so the high quality, the attention to detail, really resonates,” he explained to CNBC.
On’s adjusted EBITDA soared 45.4% to 174.3 million francs. The adjusted EBITDA margin widened to 21.0% from 16.5% in the comparable period.
Full-Year Forecast Upgraded Amid Tariff Questions
For fiscal 2025, On projected revenue of 3.51 billion francs — suggesting constant currency growth of no less than 23%. This figure trailed the 3.54 billion franc analyst consensus slightly.
The athletic footwear and apparel maker increased its gross profit margin target to at least 64.5%, up from the previous 63% estimate. Adjusted EBITDA margin expectations were also lifted to a 19.5%–20% range, exceeding the earlier 18.5%–19% band.
On’s financial guidance still incorporates assumptions around a 20% tariff on Vietnamese imports, despite a recent U.S. Supreme Court decision that effectively eliminated that levy. The company has filed for a refund but maintains the situation remains uncertain. Coppetti emphasized that even if tariff relief materializes, the financial effect would be “immaterial.”
Shortly before quarter-end, On revealed a change in its executive leadership. Co-founders David Allemann and Coppetti transitioned into co-CEO positions, replacing Martin Hoffmann, who had served as the company’s principal representative with investors. The firm characterized Hoffmann’s departure as a “planned hiatus.”
ONON shares have declined roughly 27% year to date prior to this earnings announcement.

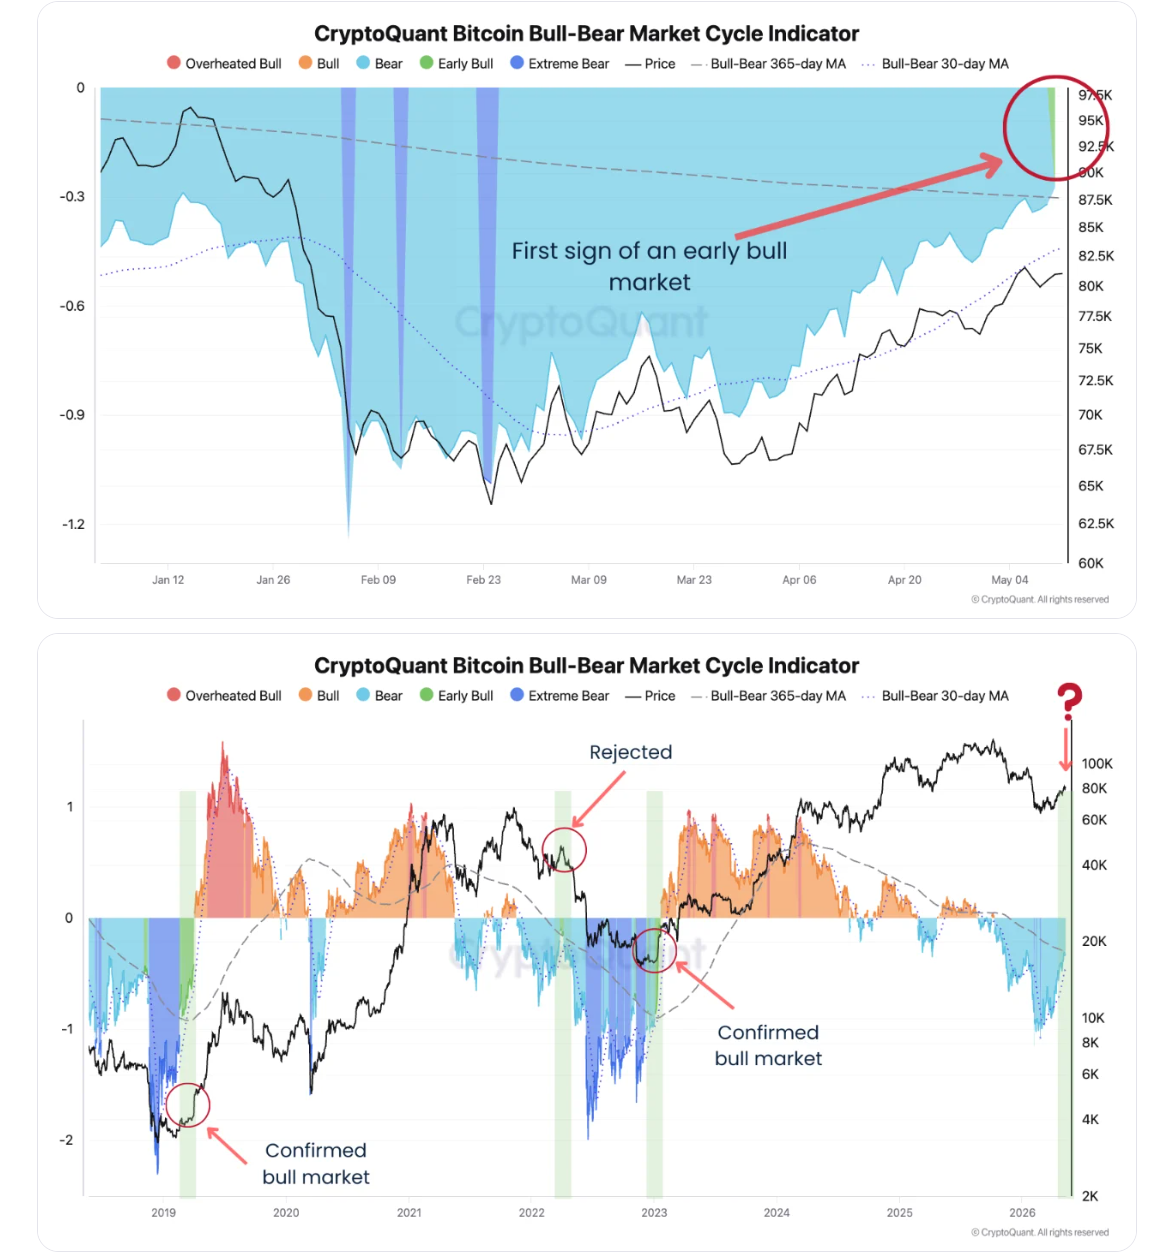
Bitcoin (BTC) just printed its first early-bull reading on CryptoQuant’s Bull-Bear Market Cycle Indicator since March 2023, a regime shift that historically marks recoveries from deep corrections.
The signal arrives as the Bureau of Labor Statistics releases April 2026 Consumer Price Index (CPI) data Tuesday morning, an inflation print that could decide whether BTC follows through or stalls below recent resistance.
Bull-Bear Cycle Indicator Flips After Two-Year Drought
CryptoQuant’s Bull-Bear Market Cycle Indicator moved out of bear territory this week for the first time in roughly 26 months. Similar prints in 2019 and early 2023 preceded sustained recoveries after deep drawdowns.

Both episodes followed long stretches of subdued price action and rising on-chain conviction among long-term holders. The indicator’s 30-day moving average also points to improving momentum beneath the surface.
BTC traded for $80,655 as of this writing, according to BeInCrypto data, down by about 0.6% on the day but holds a roughly 13% gain over the past 30 days.

BTC has also reclaimed the $78,000 zone aligned with the True Market Mean and Short-Term Holder cost basis. That region has historically separated bear and bull phases.
On-chain analyst CheckOnchain said sustained trade above the level usually coincides with stronger market structure and improving sentiment.
Exhaustion Signals Echo a 2022 Trap
The current reading carries one clear historical exception. In March 2022, the same indicator briefly turned green before BTC was rejected and extended its downtrend.
CryptoQuant analyst Moreno flagged that several other metrics are already showing exhaustion. He framed the current reading as less clean than a classic early-cycle confirmation.
In my view, the probabilities slightly lean toward this being a potential local top rather than the beginning of a new bull market, unless price follows through strongly and confirms the move,” Moreno noted.
Joao Wedson of Alphractal raised a related concern. The 30-day change in exchange reserves has flipped from negative to positive. That means more BTC is now moving onto exchanges than off them.
Wedson warned the shift runs counter to the accumulation pattern bulls would expect at a genuine cycle low.
April CPI Becomes the Next Catalyst
The April 2026 inflation release lands ahead of the Wall Street open. Economists’ consensus puts headline CPI near 0.7% month over month and 3.7% year over year.
That would mark an acceleration from March’s 3.3% YoY print, with gasoline and shelter doing most of the work.
A hotter reading would likely revive doubts about near-term Federal Reserve rate cuts and pressure risk assets. A softer print could reinforce the bullish regime shift and support the recent May recovery.
For now, BTC sits between two narratives. Whether the signal extends into a trend or fades like the 2022 example remains open.
The outcome may hinge on how today’s CPI print collides with an exhausted spot market. Traders will watch for follow-through above $82,000 and the True Market Mean for cleaner confirmation.
The post Bitcoin Bull-Bear Cycle Indicator Flashes Green Ahead of April CPI Print appeared first on BeInCrypto.
U.S. President Donald Trump (L) listens as Nvidia CEO Jensen Huang speaks in the Cross Hall of the White House during an event on “Investing in America” on April 30, 2025 in Washington, DC.
Andrew Harnik | Getty Images
BEIJING — Nvidia CEO Jensen Huang said it would be “a great honor” to travel to China with Donald Trump. But he isn’t among the executives joining the U.S. president to meet Chinese President Xi Jinping — a sign the chipmaker’s sales in one of its most important markets are unlikely to recover soon.
Huang has visited China multiple times in the last 18 months, including a high-profile trip last summer, underscoring Nvidia’s efforts to maintain ties in a market that once accounted for at least a fifth of its data center revenue.
But he is absent from Trump’s closely watched visit this week, when more than a dozen U.S. executives will join the president, including chip company Qualcomm’s Cristiano Amon, Tesla’s Elon Musk and Apple’s Tim Cook. Boeing’s Kelly Ortberg is also part of the delegation, as the U.S. planemaker is expected to secure its first major Chinese order in years.
Nvidia’s most advanced chips, widely used for training AI models, have faced tighter U.S. restrictions on China sales over the last four years. The company said in February that U.S.-government-approved versions of the chips had yet to be allowed into China.
The U.S. chipmaker’s China sales are unlikely to recover anytime soon, experts told CNBC.

There would be “very little” for Nvidia to gain in terms of deliverables if Huang joined Trump’s delegation, Hao Hong, chief investment officer at Lotus Asset Management, told CNBC’s Emily Tan on “The China Connection” on Tuesday.
“It’s highly unlikely that the more advanced form of Nvidia chips would be approved by the Trump administration for China to purchase,” Hong said, adding that technology “decoupling” between the U.S. and China is likely to increase.
“I think China realized that the tech rivalry between the two countries will be one of the key determinant factors going forward to determine the relative competitive position in the global geopolitics between the two countries,” Hong said.
Nvidia did not immediately respond to a request for comment from CNBC.
Huang told CNBC’s Jim Cramer last week: “We should let the president announce whatever he decides to announce … If invited, it would be a privilege, it would be a great honor to represent the United States.”
Trump is scheduled to arrive in Beijing late on Wednesday local time for two days of meetings with Xi. It will be the first visit by a sitting U.S. president in nearly a decade.
Crypto World
Bitcoin Price Analysis: Ray Dalio Says Bitcoin Fails as a Safe Haven And Saylor Just Fired Back
Ray Dalio just took another swing at Bitcoin. Michael Saylor caught it and threw it back harder, fueling bullish Bitcoin price analysis.
Dalio, founder of Bridgewater Associates and one of the most closely watched macro investors alive, issued a fresh critique of Bitcoin as a store of value, targeting 3 specific weaknesses.
First, privacy. Every Bitcoin transaction is publicly visible and can be monitored or potentially controlled by governments, which, in Dalio’s view, disqualifies it as a reserve asset for central banks.
Second, correlation. Bitcoin moves with tech stocks, meaning investors dump it when they need liquidity elsewhere, exactly the opposite behavior you want from a safe haven.
Third, size. Bitcoin is still a relatively small and controllable market compared to gold, which is deeply embedded in the global financial system, widely held across sovereign balance sheets, and has no digital equivalent competing for its role.
Saylor’s counter was direct. Bitcoin’s transparency is a feature, not a bug. It is precisely what makes Bitcoin usable as global collateral, a verifiable, auditable asset that any party in any jurisdiction can confirm without trusting a third party.
He also pointed to Bitcoin’s Sharpe ratio, arguing it has consistently outperformed gold on a risk-adjusted basis.

Bitcoin financial services firm River backed the bull case separately, noting that unlike physical gold, Bitcoin can actually be used for payments and cross-border transfers, making it functionally superior as a monetary tool even if gold has a longer institutional track record.
What makes Dalio’s position interesting is the contradiction sitting underneath it. He revealed a Bitcoin allocation in 2021, has recommended small crypto allocations as recently as August 2025, and frames his own BTC position as a long-duration hedge against macroeconomic instability. He owns it. He just thinks gold is better.
Criticizing an asset you hold is either intellectual honesty or a tell. Either way, both sides of this argument are now on record.

Bitcoin Price Analysis: Can BTC Respond by Hitting $85,000?
BTC is sitting at $80,857 on the daily chart, and the broader picture shows a coin that ran from $74,000 in early 2025 to $126,000 at the January peak before collapsing nearly 50% to $61,000 in February.
The recovery since that February low has been the strongest and most sustained move since the top, with price grinding from $61,000 back to $82,000, reclaiming the key $80,000 level that marked the pre-crash consolidation zone from late 2024.
That $80,000 to $84,000 range is now the most critical area on the chart. It was prior support for months before the breakdown, and price is currently pushing right into the underside of that zone as resistance.
A clean daily close above $84,000 and held would be a significant technical development, signaling that the breakdown from January has been fully reclaimed and opening the path toward $90,000, $96,000, and eventually a retest of the $100,000 psychological level.
The downside risk is a rejection here at $82,000 to $84,000, sending price back toward $72,000 to $75,000, which was the main consolidation range during the recovery and would need to hold to keep the bullish structure intact.
The recovery from $61,000 to $82,000 is real, and the structure of higher lows since February is clean, but reclaiming $84,000 is the moment this goes from recovery trade to genuine bullish continuation.
LiquidChain Doesn’t Care About Bitcoin, 1000x Potential?
Bitcoin’s compressed volatility and uncertain near-term trajectory are exactly the environments where early-stage infrastructure plays attract attention.
When the market’s largest asset is range-bound, capital looks for asymmetric setups elsewhere, and cross-chain infrastructure is one area seeing genuine developer demand regardless of short-term price cycles.
LiquidChain is positioning itself as the cross-chain liquidity layer for the next generation of DeFi. The Layer 3 project fuses Bitcoin, Ethereum, and Solana liquidity into a single execution environment, a meaningful technical proposition given how fragmented on-chain liquidity remains across those three ecosystems.
Developers deploy once and access all three networks simultaneously through features such as a Unified Liquidity Layer, Single-Step Execution, Verifiable Settlement, and a Deploy-Once Architecture.
The presale is currently priced at $0.01458 per $LIQUID token, with $748,837.41 raised to date. Early-stage presales carry real risk, token utility depends on protocol adoption, and L3 infrastructure is a competitive category, but the entry price reflects a pre-liquidity valuation.
The post Bitcoin Price Analysis: Ray Dalio Says Bitcoin Fails as a Safe Haven And Saylor Just Fired Back appeared first on Cryptonews.
Bakkt reports a first-quarter 2026 net loss as revenue from crypto services contracts sharply. The digital-asset platform posted a net loss attributable to Bakkt of $11.7 million, or 41 cents per basic and diluted share, for the quarter ended March 31, compared with a net income of $7.7 million, or $1.13 per diluted share, a year earlier. Crypto services revenue declined 77% year over year to $243.6 million, a drop Bakkt attributed primarily to lower crypto trading volumes. However, the vast majority of that revenue is offset by crypto costs and brokerage fees, which totaled $242 million in the quarter. Excluding crypto costs, operating expenses were $18.5 million, roughly in line with a year ago. The company ended the period with $82.6 million in cash, including $69.6 million raised through equity offerings, and it carries no long-term debt.
In response to the subdued trading backdrop, Bakkt is repositioning itself around stablecoin payments and AI-enabled financial infrastructure. The quarter saw the company close its acquisition of Distributed Technologies Research on April 30, bringing in an AI-native payments engine and a stablecoin compliance stack. It has also signed a memorandum of understanding with Zoth, a stablecoin provider targeting high-volume cross-border payments across South Asia, the Middle East and Sub-Saharan Africa. Chief Executive Akshay Naheta framed the pivot as a long-term bet on the structural potential of stablecoin rails, pointing to evolving regulation as a potential tailwind for Bakkt’s licensed infrastructure.
Investor reaction to the results was mixed. Bakkt shares closed up 0.71% at $9.92 on the trading day, but slid in pre-market trading the following day, trading down about 9% to around $9.00 after the release. For context, the company’s full details and quarterly results were published in its earnings press release.
Key takeaways
- First-quarter 2026 net loss of $11.7 million, or 41 cents per share, versus a year-earlier net income of $7.7 million.
- Crypto services revenue collapsed 77% year over year to $243.6 million; crypto costs and brokerage fees totaled $242 million, offsetting much of that revenue.
- Cash position of $82.6 million at quarter end, with $69.6 million raised through equity offerings; Bakkt maintains no long-term debt.
- Strategic shift toward stablecoins and AI infrastructure, marked by the acquisition of Distributed Technologies Research and a signed MoU with Zoth to pursue large-scale stablecoin payments.
Bakkt’s pivot from trading rails to stablecoin infrastructure
The quarterly results underscore a deliberate strategic shift for Bakkt away from traditional crypto trading platforms toward what management portrays as durable, utility-focused infrastructure. The acquisition of Distributed Technologies Research, completed on April 30, adds an AI-native payments engine and a stablecoin compliance stack to Bakkt’s offerings. Taken together with the MoU with Zoth—aimed at enabling substantial cross-border payments via stablecoins—the moves suggest Bakkt is betting on a future where regulated, scalable digital-asset rails underpin mainstream payments activity rather than speculative trading volumes. In the earnings release, CEO Akshay Naheta framed stablecoin infrastructure as a transformative trend in global finance, noting potential regulatory catalysts such as the GENIUS Act and CLARITY Act could lift the value of Bakkt’s licensed platform.
Financials in flux: what changed, what stays uncertain
The pronounced drop in crypto services revenue highlights the volatility inherent in crypto markets and trading activity. Bakkt’s narrative around stabilization hinges on the idea that a stablecoin-focused, AI-enabled payments backbone can deliver steadier, enterprise-oriented demand. The company’s costs remained manageable on an operating basis, with expenses at $18.5 million, only slightly lower than a year ago, helping limit the impact of the revenue gap. The absence of long-term debt provides a clean balance sheet as Bakkt invests in its strategic pivot. The cash position, while modest, is strengthened by equity financing conducted during the period, which suggests a clear plan to fund growth initiatives without leverage. The near-perfect offset between revenue and crypto costs in the quarter illustrates a business where the top-line volatility of crypto trading did not translate into purely additive profit or loss, reinforcing the logic of a structural shift toward stablecoins and infrastructure services.
Broader market context: stablecoins as an infrastructure play
The Bakkt pivot sits within a broader industry narrative that has drawn increased attention from public markets. Stablecoin infrastructure firms are attracting investor interest as market participants seek regulated, scalable rails for digital-asset payments. In related market coverage, Circle Internet Group reported a strong quarter, with USDC in circulation rising to about $77 billion and on-chain transaction volumes surging to roughly $21.5 trillion, alongside a $222 million presale of its ARC token at a $3 billion fully diluted network valuation. Circle’s results also showed a 20% year-over-year rise in total revenue and reserve income to $694 million, underscoring how stablecoins and on-chain ecosystems are expanding beyond niche crypto trading into broader financial infrastructure. These dynamics help explain Bakkt’s strategic emphasis on stablecoins and enterprise-grade payments capabilities as a differentiating asset class in a crowded crypto landscape.
Bakkt’s efforts reflect an ongoing tension in the market: the need to translate crypto-adjacent activity into sustainable revenue streams while navigating an evolving regulatory framework that could unlock or constrain growth. The company’s emphasis on stablecoins and AI-enabled infrastructure aligns with a broader trend of institutional-grade entrants seeking regulated, scalable rails for payments and settlement, rather than relying on highly cyclical trading volumes. For investors and builders, the key question is whether Bakkt’s new architecture can achieve product-market fit at scale and whether stablecoin adoption by merchants and financial institutions can outpace the slowdown in direct crypto trading activity.
Looking ahead, observers will be watching Bakkt’s progression on several fronts: the traction of its AI-enabled payments engine, the commercial pipeline around the Zoth MoU, and the degree to which regulatory developments support or impede stablecoin infrastructure. In the near term, the company will also need to demonstrate that its balance sheet and liquidity posture can sustain ongoing pivot-related investments while delivering tangible product adoption and revenue growth beyond crypto services.
As Bakkt executes this transition, the broader market will also be assessing the pace at which stablecoins transition from ancillary tools to essential components of mainstream commerce. The coming quarters should reveal whether Bakkt’s recalibration translates into durable, recurring revenue from stablecoin rails and enterprise-grade financial infrastructure, or whether the company must further recalibrate in response to evolving market dynamics and regulatory clarity.
What to watch next: ongoing updates on Bakkt’s stablecoin and AI initiatives, the commercial outcomes of its DT Research integration and Zoth collaboration, and regulatory developments that could shape the viability of licensed infrastructure players in the digital-asset payments space.

Arthur Hayes, the chief investment officer of crypto-focused venture capital and investment fund Maelstrom, said the bull market is back and he is not waiting for confirmation.
Bitcoin found a bottom at $60,000 earlier this year, and retaking its October 2025 record of $126,000 is a “foregone conclusion,” Hayes wrote in a Substack essay on Monday. The largest cryptocurrency briefly rose above $82,000 on Tuesday and recently traded around $80,600. A return to the high from current levels would be a gain of about 55%.
Hayes, who also co-founded the BitMEX exchange, flagged $90,000 as the level where the rally turns explosive. At that point, writers of call options with higher strike prices would be forced to buy bitcoin to cover their positions, accelerating the advance. Call option writers are betting that the price will not rise above a certain level; buyers are betting that it will.
Hayes pointed to two tailwinds behind his targets.
The first is capital expenditure on AI, which, he said, has shifted from being funded by cash flow at the largest software companies to requiring credit creation by commercial banks and central banks. He flagged the Federal Reserve and the People’s Bank of China loosening financial conditions to support the buildout, with Chinese banks specifically redirecting capital from real estate toward tech.
The second tailwind is the U.S.-Iran war, which has forced sovereign nations to rebuild domestic infrastructure and stockpile commodities rather than save in dollar assets.
“Higher for longer” is how Hayes framed the inflationary impact of the two combined.
War is inflationary, the AI buildout is inflationary, and the political will to print money to fund both is what produces the environment for bitcoin to outperform, he wrote. He pointed to bitcoin’s performance against the Nasdaq 100, the IGV software ETF and gold since the start of the war on Feb. 28 as evidence that the asset has already begun pricing the shift.
Hayes also disclosed Maelstrom’s altcoin positioning. The fund holds large positions in Hyperliquid’s HYPE token and Zcash’s ZEC, with NEAR identified as the next pick. The NEAR thesis, which he said he will explain in a follow-up essay, rests on the combination of the privacy narrative and the protocol’s intents-based architecture creating a positive cash flow.
“This will flip the script on the disastrous price performance of the token,” Hayes wrote.
Hayes also flagged two scenarios that would end the rally. The first is an irresponsible mega-AI IPO or merger in the U.S. or China that the market cannot absorb, snapping investors out of the manic phase.
The second occurs if the Democratic challenger in the 2028 U.S. presidential election runs on an anti-AI platform that promises to curtail the capex buildout, with the popularity of that message forcing lenders to reconsider whether credit keeps flowing to the sector.
The November 2026 mid-term elections could be a “slight speed bump” before then.
“It’s a bull market; close your eyes and press the button,” Hayes wrote. “There will be a time to sell, but it ain’t right now.”


Exodus Movement (EXOD) cut its bitcoin holdings by 1,076 BTC in the first quarter, while adding 5,068 SOL, as it moved more of its balance sheet into cash as the crypto wallet provider prepared to close its W3C payments deal.
The company held 628 BTC at the end of March, down from 1,704 BTC on Dec. 31, according to its latest quarterly filing. The value of those holdings fell to $42.8 million from $149.2 million.
Revenue fell 36.8% to $22.7 million in Q1 from $36 million a year earlier, according to Exodus’ earnings release. Net loss widened to $32.1 million from $12.9 million, driven in part by a $36.4 million loss on crypto.
Exodus’ solana holdings rose to 17,541 SOL from 12,473 SOL over the same period. Their fair value still fell to $1.5 million from $1.6 million over the crypto sell-off seen over the period.
In total, Exodus said it sold $73.2 million of cryptocurrency held during the quarter, and bought $962,000. The company said the increase in net sales for cash was tied to proceeds that will be used to fund the W3C acquisition.
“During Q1 2026, the Company has continued to sell digital assets to prepare for the next disbursement related to the W3C closing, and has set aside over $70 million in US dollar reserves for these obligations,” the filing reads.
Cash, cash equivalents and stablecoins rose to $74.4 million from $5.2 million at year-end. Total crypto and liquid assets held fell to $122.6 million from $161.6 million.
The filing does not break out sales by token. The balance sheet move was concentrated in bitcoin, with BTC down 63% and SOL up 41%. Bitcoin lost around 23% of its value in Q1, while SOL dropped more than 34% over the period.
Exodus closed its acquisition of Monavate and Baanx on May 1, adding card issuing and payments infrastructure to its self-custody business. The deal followed its $175 million agreement to buy W3C’s payments units and its push into stablecoin payments.
EXOD is down 3.1% in pre-market trading at $7.47.

Cryptocurrency transactions may look instant on the surface, but several important processes happen behind the scenes before funds officially reach another wallet.
When you send Bitcoin, Ethereum, or any other cryptocurrency, the transaction moves through a network of computers that verify, secure, and permanently record the transfer on a blockchain.
Understanding how this process works helps beginners avoid mistakes, understand gas fees, and gain confidence when using crypto wallets and decentralized applications.
This guide explains exactly what happens during a crypto transaction — step by step.
Understanding the Basics of a Crypto Transaction
A crypto transaction is the transfer of digital assets from one wallet address to another using blockchain technology.
Unlike traditional banking systems, crypto transactions do not rely on a central authority like a bank or payment processor. Instead, decentralized networks of validators or miners verify transactions and maintain the blockchain.
Every transaction includes:
- The sender’s wallet address
- The receiver’s wallet address
- The amount being sent
- A digital signature
- A network fee (gas fee)
Once verified, the transaction becomes part of the blockchain permanently.
Step 1: The Wallet Creates and Signs the Transaction
Everything begins inside a crypto wallet.
When a user enters a recipient address and clicks “Send,” the wallet software prepares a transaction request containing:
- The amount of cryptocurrency
- The destination address
- Network fee information
- A cryptographic signature
The most important part is the digital signature.
What Is a Digital Signature?
A digital signature proves that the owner of the wallet approved the transaction.
Crypto wallets use:
- A public key (your wallet address)
- A private key (your secret authorization code)
The private key never leaves the wallet. Instead, it signs the transaction mathematically to prove ownership without revealing sensitive information.
This is why protecting your private key or seed phrase is critical. Whoever controls the private key controls the funds.
Step 2: The Transaction Is Broadcast to the Blockchain Network
After signing, the wallet broadcasts the transaction to the blockchain network.
The transaction enters a waiting area commonly called the mempool (memory pool).
At this stage:
- The transaction is pending
- Validators or miners can see it
- It has not yet been finalized
Thousands of pending transactions may compete for inclusion in the next block, especially during periods of high network activity.
Step 3: Validators or Miners Verify the Transaction
The blockchain network must confirm that the transaction is legitimate before adding it to the blockchain.
Depending on the blockchain, this verification is performed by:
- Miners (Proof-of-Work systems like Bitcoin)
- Validators (Proof-of-Stake systems like Ethereum)
What Do Validators Check?
Validators verify:
- The sender has enough funds
- The digital signature is valid
- The transaction follows network rules
- The same funds were not already spent elsewhere
This prevents fraud and solves the “double-spending” problem.
Without verification, someone could attempt to spend the same cryptocurrency multiple times.
Step 4: Gas Fees Determine Processing Priority
Most blockchain networks require users to pay a transaction fee.
On networks like Ethereum, this is called a gas fee.
Gas fees compensate validators for:
- Processing transactions
- Securing the network
- Using blockchain resources
Why Do Gas Fees Change?
Gas fees fluctuate depending on:
- Network congestion
- Transaction complexity
- Blockchain demand
When many users are active simultaneously, fees increase because users compete for faster processing.
Higher fees usually result in:
- Faster confirmation times
- Higher transaction priority
Lower fees may cause transactions to remain pending longer.
Step 5: The Transaction Is Added to a Block
After verification, the validator group approved transactions into a new block.
A block contains:
- Multiple transactions
- Timestamp information
- Cryptographic references to previous blocks
Once created, the block is added to the blockchain.
This is what makes blockchain systems transparent and difficult to alter.
Every new block strengthens the security of previous transactions.
Step 6: Block Confirmations Begin
After inclusion in a block, the transaction receives its first confirmation.
Each additional block added afterward increases confirmation count and security.
For example:
- 1 confirmation = transaction entered the blockchain
- 3 confirmations = stronger reliability
- 6+ confirmations = widely considered highly secure
Different networks and exchanges require different numbers of confirmations before considering funds fully settled.
Why Confirmations Matter
Confirmations reduce the risk of:
- Blockchain reorganizations
- Transaction reversals
- Double-spending attacks
Large transfers often require more confirmations for additional security.
Step 7: Final Settlement Occurs
Once enough confirmations are completed, the transaction reaches final settlement.
At this point:
- The recipient officially controls the funds
- The transaction becomes practically irreversible
- The blockchain permanently records the transfer
Unlike traditional banking systems, most crypto transactions cannot be reversed after settlement.
This immutability is one of blockchain’s core features.
Example of a Crypto Transaction in Real Life
Imagine Alice sends 1 ETH to Bob.
Here’s what happens:
- Alice enters Bob’s wallet address
- Alice’s wallet signs the transaction using her private key
- The Ethereum network receives the transaction
- Validators verify Alice has enough ETH
- Alice pays a gas fee
- The transaction enters a new Ethereum block
- The blockchain confirms the transaction
- Bob receives the ETH after the confirmations are complete
The entire process may take seconds or several minutes, depending on network activity and fees.
Why Crypto Transactions Are Secure
Blockchain transactions are secured through:
- Cryptography
- Decentralization
- Consensus mechanisms
- Distributed verification
No single party controls the network.
Instead, thousands of independent nodes maintain synchronized copies of the blockchain, making manipulation extremely difficult.
This decentralized structure is one reason blockchain technology is considered highly secure.
Common Reasons Transactions Get Delayed
Beginners sometimes panic when transactions remain pending.
Common causes include:
- Low gas fees
- Network congestion
- Blockchain outages
- Wallet synchronization issues
- Exchange processing delays
Most delayed transactions eventually confirm once network conditions improve.
Important Tips for Beginners
Before sending crypto:
- Double-check wallet addresses
- Use trusted wallets
- Keep private keys secure
- Understand network fees
- Send small test transactions first
Crypto transactions are usually irreversible, so accuracy matters.
Final Thoughts
A crypto transaction involves much more than simply clicking “Send.”
Behind every transfer, blockchain networks perform:
- Cryptographic signing
- Validator verification
- Block creation
- Consensus confirmation
- Final settlement
Understanding this process helps beginners navigate cryptocurrency more safely and confidently.
As blockchain adoption grows, knowing how crypto transactions work becomes an increasingly valuable digital skill — whether you are investing, trading, using DeFi, or exploring Web3 applications.
REQUEST AN ARTICLE

Telegraph pole in Breightmet leaves wires exposed in street
C3 AI reports preliminary revenue ahead of consensus
Wells Fargo Boosts Strategy Stake in Q1 2026
Manchester United reach agreement with Casemiro over contract clause amid transfer speculation

US brings back mandatory military draft registration

Steven Gerrard disagrees with Gary Neville over ‘shock’ Chelsea and Arsenal claim | Football


-
 Crypto World4 days ago
HarrisX Poll Found 52% of Registered Voters Support the CLARITY Act
-

 Fashion4 days ago
Weekend Open Thread: Marianne Dress
-

 Crypto World5 days ago
Upbit adds B3 Korean won pair as Base token gains Korea access
-
 NewsBeat5 days ago
NCP car park operator enters administration putting 340 UK sites at risk of closure
-

 Fashion19 hours ago
Coffee Break: Travel Steam Iron
-

 Fashion1 day ago
What to Know Before Buying a Curling Wand or Curling Iron
-

 Tech2 days ago
Auto Enthusiast Carves Functional Two-Stroke Engine from Solid Metal
-

 Politics15 hours ago
What to expect when you’re expecting a budget
-

 Politics3 days ago
Politics Home Article | Starmer Enters The Danger Zone
-
 Business3 days ago
Ignore market noise, India’s long-term story intact, say D-Street bulls Ramesh Damani and Sunil Singhania
-

 Tech1 day ago
GM Agrees To Pay $12.75 Million To Settle California Lawsuit Over Misuse Of Customers’ Driving Data
-

 Crypto World6 days ago
BlackRock CEO Larry Fink Discusses a New Asset Class
-

 Entertainment5 days ago
Sarah Paulson Called Out For Met Gala ‘Hypocrisy’
-
 Sports6 days ago
NBA playoff winners and losers: Austin Reaves is not loving Lakers vs. Thunder matchup, but Chet Holmgren is
-

 Entertainment6 days ago
Bold and Beautiful Early Spoilers May 11-15: Steffy Revolted & Liam Overjoyed!
-

 Crypto World5 days ago
Robinhood says Wall Street is building onchain
-

 Entertainment5 days ago
General Hospital: Ric & Ava Bombshell – Ric’s Massive Secret Exposed!
-

 Politics5 days ago
Simon Cowell Says He Was ‘Horrible’ To Susan Boyle During BGT Audition
-

 Tech6 days ago
Apple and Samsung are dominating smartphone sales so thoroughly that only one other company makes the top 10
-

 Fashion6 days ago
The Best Work Pants for Women in 2026
You must be logged in to post a comment Login