

Crypto World
Ripple Prime Joins DTCC Tokenization Push With BlackRock and JPMorgan in 2026

TLDR:
- Ripple Prime joins 50+ firms in DTCC’s tokenization working group, including BlackRock and JPMorgan.
- DTCC plans limited live production trades in July 2026, with a full service rollout set for October 2026.
- The SEC issued a No-Action Letter in December 2025, authorizing DTC’s tokenization service for three years.
- Ripple Prime gains access to DTCC clearing rails, helping link tokenized securities with XRP Ledger liquidity.
Ripple Prime has joined the Depository Trust & Clearing Corporation’s (DTCC) tokenization initiative alongside BlackRock, JPMorgan, and more than 50 other institutions.
The service targets tokenized equities, ETFs, and U.S. Treasuries, with limited production trades set for July 2026 and a full rollout planned for October 2026.
The move places Ripple Prime at the center of one of the most closely watched developments in institutional finance this year.
Ripple Prime Steps Into a Historic Institutional Push
More than 50 organizations are collaborating within DTCC’s Industry Working Group to help shape the service, representing a broad cross-section of the financial sector.
Major participants include JPMorgan, Bank of America, Citadel Securities, Invesco, HSBC, Charles Schwab, BlackRock, Nasdaq, NYSE, Robinhood, and Wells Fargo.
Ripple Prime is the prime brokerage born from the $1.25 billion Hidden Road acquisition. Its presence in the working group puts it directly alongside institutions that collectively manage trillions in assets. That positioning carries weight well beyond the digital asset sector.
From the digital assets sector, Ripple Prime joins USDC issuer Circle, digital asset infrastructure firm Fireblocks, tokenization leader Ondo Finance, and exchanges Kraken and Backpack.
Together, these firms represent the crypto-native layer of what is otherwise a largely traditional financial initiative.
Social media reactions followed quickly after the announcement. Account @InvestWithD noted that Ripple Prime is helping test, validate, and shape institutional infrastructure alongside Wall Street’s biggest players.
The post also clarified that Stellar is separately positioned as the public blockchain for DTCC’s multi-chain strategy — a point that had caused confusion among many observers.
What the DTCC Initiative Means for Ripple Prime
DTCC is working to connect traditional clearing and settlement rails with blockchain-based representations of real-world assets.
Rather than building separate systems, the goal is to embed tokenization directly within existing post-trade infrastructure.
The target assets are those already held inside its subsidiary, The Depository Trust Company — Russell 1000 equities, major ETFs, and U.S. Treasuries.
The SEC issued a No-Action Letter in December 2025 authorizing DTC to operate a defined tokenization service for three years.
That ruling provided the regulatory foundation institutions needed to participate openly. It also signaled broader federal comfort with tokenized securities operating within established financial systems.
Ripple Prime’s participation grants it access to DTCC clearing rails as a prime broker, a direct view into how tokenized securities will be issued and settled, and the ability to design products linking DTCC-based assets with XRP Ledger-based collateral and liquidity. Those capabilities stand to strengthen Ripple Prime’s offering across institutional markets.
For Ripple Prime, securing a seat alongside JPMorgan, BlackRock, Bank of America, and Goldman Sachs elevates its credibility massively across institutional markets.
Whether XRP plays a direct settlement role remains an open question, but Ripple’s formal place in this process is now confirmed.


Grayscale is challenging a key assumption many traders use to frame Bitcoin’s price cycle: the idea that bottoms reliably line up with the traditional four-year, halving-driven rhythm. In a Wednesday research note, the firm’s head of research, Zach Pandl, suggested that Bitcoin may have already found a floor—potentially pointing to a cycle low as early as September or October—if upcoming macro conditions remain supportive.
Pandl’s argument centers on Bitcoin’s increasing sensitivity to broader economic variables. Rather than treating the halving cycle as the dominant force, Grayscale says macro factors—especially Federal Reserve policy—may be doing the heavy lifting for price direction right now.
Key takeaways
- Grayscale says Bitcoin’s cycle low could arrive earlier than the historical four-year pattern, with September or October cited as a potential window.
- Zach Pandl argues Bitcoin is increasingly “macro-driven,” implying that rate expectations may determine when price bottoms.
- CME FedWatch data at the time of Grayscale’s note showed markets pricing about a 66% chance the Fed holds rates on July 29, down from 88% a week earlier.
- Despite the macro thesis, Grayscale warns regulation could still cap recovery momentum, particularly if the CLARITY Act fails to pass this year.
- Other analysts still expect a later bottom, including a view that a trough may not appear until October–December 2026.
Why Grayscale thinks the cycle floor may be sooner
Grayscale’s framing departs from the more rigid “four-year cycle” approach. In the firm’s report, Pandl wrote that if the Federal Reserve “forgoes rate hikes” and economic growth remains resilient, Bitcoin “may already have bottomed.” That would imply the cycle low could come earlier than some models anticipate, potentially in September or October.
This matters for investors because it changes how risk is likely to be assessed around typical cycle milestones. If macro conditions are now the primary driver, historical calendar-based expectations may be less reliable—making forward-looking indicators (like real rates and central bank guidance) more important than fixed cycle timing.
The Fed’s meeting and shifting rate odds
A central element of Grayscale’s view is that the Fed remains the most actionable near-term variable for Bitcoin. Pandl said macro factors place Bitcoin in the “driver’s seat,” adding that Bitcoin could “bottom when these macro factors turn around.”
The next scheduled rate decision cited in Grayscale’s discussion is due on July 29. According to CME Group’s FedWatch tool referenced by Grayscale, market participants were pricing in a 66% chance the Fed will hold interest rates unchanged—down from 88% a week earlier. The change highlights how quickly expectations for policy path can evolve, and why Grayscale sees macro shifts as central to the timing of a market bottom.
Grayscale also connected prior Bitcoin bear markets to periods of slowing economic growth alongside rising real interest rates. In that framework, the direction of real rates—more than nominal liquidity narratives—has historically aligned with whether downside pressure persisted or eased.
Regulatory uncertainty remains a drag on upside
Even if macro conditions improve, Grayscale cautioned that policy risk could still limit how far Bitcoin can recover. In a June 26 Grayscale report titled “Two scenarios for the Bitcoin bear market,” Pandl argued that regulatory uncertainty may force continued “deleverage” among certain crypto treasury-related entities.
Specifically, Grayscale suggested that if the CLARITY Act does not pass this year, Strategy and other treasury companies may continue to reduce leverage, a process that could lead Bitcoin to “fall moderately further.”
This point is important because it introduces a potential mismatch: macro might be stabilizing, but balance-sheet pressure within parts of the crypto market could still weigh on prices. For market participants, the takeaway is that “macro-driven” doesn’t automatically mean “macro-only”—regulatory outcomes can influence liquidity and forced selling dynamics even when economic data looks better.
Competing views on how late the bottom could be
Grayscale’s earlier-bottom thesis is not universally shared. Earlier this year, crypto analysts pointed to market structure and long-term investor behavior as signals that a bottom could be approaching sooner rather than later. For example, K33 had argued that Bitcoin’s supply held at a loss could signal cycle timing, noting that historically Bitcoin has tended to bottom weeks after more than half of supply moved underwater. Separately, Swan Bitcoin CEO Cory Klippsten told Cointelegraph in a June interview that record long-term holdings—reaching an all-time high of 14.7 million Bitcoin—could indicate an imminent bottom.
Still, other analysts have suggested that the trough may not arrive until later. Lebit Mining Pool founder Jiang Zhuoer predicted that Bitcoin’s bottom could fall between October and December 2026—roughly six months after Strategy’s Multiple to Net Asset Value (mNAV) indicated its cycle low.
That contrast underscores a broader uncertainty for traders and portfolio managers: different approaches—cycle timing, macro signals, supply-at-loss statistics, or balance-sheet metrics—can point to different windows. The question for readers is not only whether Bitcoin bottoms, but whether the market is responding to the same underlying regime shift that each model assumes.
What to watch next
With the Fed decision on July 29 in focus and regulatory developments still capable of influencing deleveraging pressure, investors should track both macro indicators (especially real-rate expectations) and any signs that the CLARITY Act timeline or related market balance-sheet activity is changing. Grayscale’s thesis hinges on “macro turning around,” but whether that translates into a durable cycle low may depend on policy risk and crypto-specific liquidity conditions as much as on economics.

Robinhood (HOOD) CEO Vlad Tenev’s X account was compromised on Thursday and used to promote a fake memecoin as traders have piled into tokens on the brokerage’s recently-launched blockchain network.
The now-deleted post introduced a token called Vladhood ($VLAD) as the “official Robinhood chain mascot” and falsely claimed it would be listed in the Robinhood app. It included a blockchain wallet address and described the token as part of the company’s focus on Robinhood Chain.
“Does Robinhood love memes? The answer is yes,” the post read.
Robinhood later confirmed the account had been hacked.
“Heads up: Our CEO Vlad Tenev’s X account was compromised and posted a fake promotion for a meme coin,” the company said through its communications account on X. “We’re working with X to restore access and the post has been removed.”

The incident came as Robinhood’s newly launched blockchain has become a hotbed of speculative trading.

Empery Digital has committed $20 million to Cardinal Data Power, purchasing an approximately 8% stake in the private developer behind “powered” data center campuses designed for AI and high-performance computing workloads. The capital injection is tied to Cardinal Data Power’s Series A round of roughly $70 million and is intended to help advance a 750-megawatt campus project in West Texas.
While the investment highlights growing demand for large-scale compute infrastructure, it also lands in the middle of Empery’s own strategic shift away from its earlier Bitcoin treasury approach. Over the past two months, the company sold about 1,400 BTC for approximately $87.1 million, leaving it with 1,514 BTC after the transactions.
Key takeaways
- Empery Digital invested $20 million for an ~8% stake in Cardinal Data Power as part of a Series A of about $70 million.
- Cardinal’s West Texas powered data center campus is expected to begin delivering power in 2027, expand to around 1 GW by 2029, and ultimately exceed 5 GW.
- Empery’s Cardinal investment follows a reduction in its Bitcoin holdings, after it sold roughly 1,400 BTC over two months.
- Across the broader market, Bitcoin treasury firms are splitting between continued accumulation and exits or restructurings.
- Investors are watching whether corporate Bitcoin strategies increasingly prioritize operational assets—such as AI infrastructure—over pure balance-sheet accumulation.
Empery backs AI-focused “powered” campus development
Cardinal Data Power builds data center sites that integrate power generation, natural gas supply, and electrical infrastructure into a single development model. According to Empery Digital, the goal is to accelerate the delivery of large-scale computing campuses for artificial intelligence and HPC customers.
The company’s current plan centers on a West Texas campus with an initial scale of 750 MW. Cardinal expects first power in 2027, then scaling to about 1 gigawatt by 2029. The longer-term target is to exceed 5 gigawatts, implying a phased buildout designed to support expanding demand as AI workloads and compute capacity requirements grow.
For investors and data center developers, the appeal of “powered” campus design is that it aims to reduce bottlenecks often associated with securing power capacity and the infrastructure required to deliver electricity at the scale large AI deployments demand. Empery’s decision to place capital into this model suggests it sees AI infrastructure as a near-to-medium term driver of value creation rather than relying solely on financial asset appreciation.
Bitcoin treasury strategy under pressure at Empery
Empery’s investment decision comes during an ongoing adjustment to its treasury posture. Earlier this year, the company moved away from an electric powersports business and adopted a Bitcoin treasury strategy in mid-2025, positioning Bitcoin holdings as a key part of its balance sheet.
However, the company recently reported that it sold about 1,400 BTC over a two-month period for approximately $87.1 million. Empery said it intends to use those proceeds to fund AI infrastructure investments and repay debt.
After the sales, Empery’s Bitcoin holdings dropped to 1,514 BTC. BitcoinTreasuries.NET data indicates Empery previously held as many as 4,081 BTC before beginning to trim its position in March.
The reduction appears to have taken place amid shareholder activism: the filings and coverage referenced in the source say that shareholder Tice P. Brown urged the company to abandon its Bitcoin treasury strategy and called for the resignation of the chief executive officer and the board. The pressure helps explain why Empery’s corporate narrative is shifting from a “hold Bitcoin” approach toward funding operational and infrastructure projects—at least in part using realized value from earlier BTC holdings.
Bitcoin treasury firms diverge: unwind, restructure, or persist
Beyond Empery, the broader Bitcoin treasury landscape continues to show a wide range of strategies and outcomes. Some companies remain committed to accumulation, while others are winding down positions, changing corporate direction, or revising how Bitcoin appears on their balance sheets.
Satsuma Technology is one of the clearest examples of an exit. According to the source, shareholders voted overwhelmingly on July 20 to sell the company’s Bitcoin holdings, return substantially all of its capital to investors, and delist from the London Stock Exchange. More than 90% of votes cast supported both the capital return and delisting.
Meanwhile, a different kind of change played out through attempted consolidation. The proposed merger between Tether-backed Twenty One Capital, Strike, and Bitcoin miner Elektron Energy was scrapped earlier this week. The source notes that Strike will remain a standalone company while discussions between Twenty One and Elektron continue. Even after the abandoned deal, Twenty One remains among the largest publicly tracked corporate Bitcoin holders with 43,514 BTC, ranking behind Strategy.
Taken together, these moves show that the corporate Bitcoin treasury model is not static. Some firms treat BTC accumulation as a long-term thesis; others appear to conclude that capital can be deployed more effectively elsewhere or that shareholder appetite is better aligned with liquidity and balance-sheet simplification.
A new playbook: Bitcoin alongside permanent-capital business ownership
Another strand of development comes from efforts to reframe Bitcoin’s role inside corporate structures. The source says Bitcoin analyst Lyn Alden co-founded Orange Juice HODLINGS, a permanent-capital holding company backed by Mexican billionaire Ricardo Salinas. It reportedly launched with $40 million in initial funding.
Rather than using Bitcoin strictly as an asset to accumulate and hold, the described plan is to acquire and retain profitable businesses indefinitely, while using Bitcoin as a treasury reserve asset. The strategy aims to combine long-term ownership of operating companies with a Bitcoin-backed balance sheet—an approach that differs from both pure accumulation and pure exit.
For readers trying to understand where the market may be headed, this is a meaningful shift in framing. It suggests corporate actors may increasingly treat Bitcoin as one component of a diversified capital stack, rather than the sole centerpiece of a treasury thesis—particularly as institutional narratives around AI infrastructure, compute scaling, and power availability gain traction.
What to watch next
With Empery using realized Bitcoin proceeds to fund AI infrastructure and with Cardinal’s campus ramp targeting multi-year power delivery milestones, investors should watch for how quickly capital commitments translate into construction progress, power milestones, and incremental financial disclosures. At the same time, the broader split in corporate treasury outcomes—unwind versus restructure versus hybrid models—will likely shape how future corporate Bitcoin strategies evolve under shareholder pressure and shifting capital allocation priorities.

Wall Street is banking heavily on exchange-traded funds that give investors artificial intelligence exposure, according to J.P. Morgan Asset Management.
The firm’s “Guide to ETFs,” which came out this month, finds it’s a top five theme by assets under management — even as volatility hit the group in the second quarter.
“Many [themes] are morphing towards AI and the ecosystem surrounding AI,” Jon Maier, the firm’s chief ETF strategist, told CNBC’s “ETF Edge” this week.
Maier, who led the insights team that published the report, also highlighted an overlapping relationship between AI-themed ETFs and infrastructure.
“It’s all kind of feeding into the AI story … the applications, the energy [and] the AI models,” he said.
Go with the flow? ETFs vs. mutual funds
JPMorgan’s Guide to ETFs also found that mutual fund overall inflows are meaningfully tapering off while more money is flowing into ETFs.
“That’s only going to continue,” said Maier, who added the report’s data showed negative inflows into mutual funds overall during the past several years.
He also suggests that ETFs have become more attractive to retail investors because of the tax benefits.
“They typically don’t pay a capital gain [tax],” he said.
Maier contends mutual funds are a different story.
“Imagine if you bought a mutual fund in 2022 and you’re down 20%, 30%, 40%, depending on what part of the market you bought, and you still got a capital gain of 6%. You’re not happy,” he said.

Hackers took over the X account of Robinhood CEO Vlad Tenev on Thursday. They used it to push a new crypto coin, Vladhood (VLAD), that has already been flagged as a likely scam.
The fake post called VLAD the official mascot of Robinhood Chain. It even said the coin would be listed in the Robinhood app.
Inside the Robinhood CEO X Account Hack
Robinhood’s own accounts stayed silent. So did Robinhood Crypto. That was the first clue the post was fake.
The message started with a question. Does Robinhood love memes? It answered yes, then shared the coin’s address and signed off, “Welcome to the Hood.”

The post has since been deleted.
A blockchain tracker for Robinhood Chain marks the coin as a likely scam. The token holds no real money. It has changed hands about 1,868 times since launch.
According to on-chain monitoring by MLM, the attacker generated around 650 ETH in proceeds from the VLAD token, worth approximately $1.2 million to $1.3 million.
Scams like this keep hitting the network. Reports of rug pulls have multiplied. The trick is not new. A fake coin named after Coinbase boss Brian Armstrong crashed this month, a lesson about trusting posts from executive accounts.
Meme Coins Keep Testing Robinhood Chain
Robinhood Chain went live on July 1. It is a new blockchain that Robinhood built on Ethereum. The company wants it to power tokenized stocks and other real-world assets.
But memecoins took over fast. The network now handles millions of trades a day. Risky meme coins drive most of it, and recently pushed it to record trading volume. Total trading has topped roughly $9 billion, according to Entropy Advisors.
One coin, the Cash Cat meme coin, has led the pack. Some experts worry this meme coin trading boom could hurt Robinhood’s bigger plans for tokenized stocks.
Tenev has welcomed the fun. He once posted that the chain “works great for memes too.” Now that same hype has been turned against him.
The post Robinhood CEO Vlad Tenev Hacked, Exploiter Makes $1.2 Million Promoting Fake Token appeared first on BeInCrypto.


Bernstein said that it remains overweight on the Bitcoin mining sector, citing the growing partnerships between Bitcoin mining companies that are necessary to address the power constraints of artificial intelligence (AI) data centers.
The investment manager’s Bitcoin mining industry deal tracker registered a new AI-related deal every week in July, with combined deals standing at more than 7.5 gigawatts or the contracted equivalent of $150 billion in multi-year contracts, according to a Thursday research note shared with Cointelegraph.
The analysts said that third-party computing capacity from Bitcoin miners will remain highly valuable as access to power remains the AI industry’s real bottleneck amid growing political pushback against building new US data centers.
Bitcoin mining stocks logged double-digit gains on Monday after Bitcoin mining companies Hut 8 and IREN announced major AI infrastructure deals. Hut 8 announced a 15-year, $9.8 billion lease for its AI data center campus and IREN disclosed $2.8 billion in cloud services contracts with AI developers.
“IREN is beginning to convert that infrastructure advantage into contracted and more predictable revenue,” said Seeking Alpha contributor The Curious Analyst on Thursday. “The biggest risk to my thesis is execution,” they said. The contributor rates IREN a strong buy.
July sees slew of AI-miner tie-ups
Other publicly traded Bitcoin mining companies have also expanded into AI. Earlier in July, MARA Holdings announced plans to acquire a Texas site with up to 2 gigawatts of capacity to expand its AI and digital infrastructure business.
Days earlier, TeraWulf signed a 20-year data center lease with AI startup Anthropic, a deal the company said could generate roughly $19 billion in contract revenue.
Bitcoin mining infrastructure company Bitdeer has also expanded into AI cloud services and high-performance computing.
Most of the miner stocks were poised for gains on Thursday, based on premarket activity. HUT 8’s shares were up 5.23%, IREN was up 1.89% and TeraWulf was up 1.49%. Sector tracking exchange-traded fund CoinShares Bitcoin Mining ETF (WGMI) was up 1.47% ahead of the Nasdaq open. Bernstein has an outperform rating on all of the stocks it named, except for MARA, which it rates as market perform.
Related: Foundry asks Bitcoin miners to vote on BIP-110 support
AI data centers face political pushback
Bernstein’s research note said that Bitcoin miners and third-party computing power providers will remain important for AI companies, as the construction of new data centers is facing growing bipartisan political pushback.
On Wednesday, Texas Democratic Senate candidate James Talarico reportedly shared a proposal to create stronger local approval processes and to repeal tax breaks for AI data centers.
In April, US Senator Ron Wyden shared concerns that AI data centers in his home state of Oregon could worsen water scarcity during persistent droughts. He said that large data centers can consume up to 5 million gallons of water per day and asked large data center operators to explain how they would reduce groundwater withdrawals to protect the local water supply.
In March, President Donald Trump’s administration published a Ratepayer Protection Pledge aiming to expand AI infrastructure without increasing electricity bills for households and small businesses.
In January, several state governors published plans to expand the grid to meet the rapidly growing demand from AI data centers, but stated that new data centers should bear the costs they create, rather than shifting these to existing residential customers and small businesses.
Magazine: Bitcoin’s quantum dilemma: Bigger blocks or STARK proofs?
Ether is becoming increasingly attractive from a valuation standpoint, particularly relative to Bitcoin, but onchain data suggests the market has yet to reach a definitive cycle bottom, according to CryptoQuant.
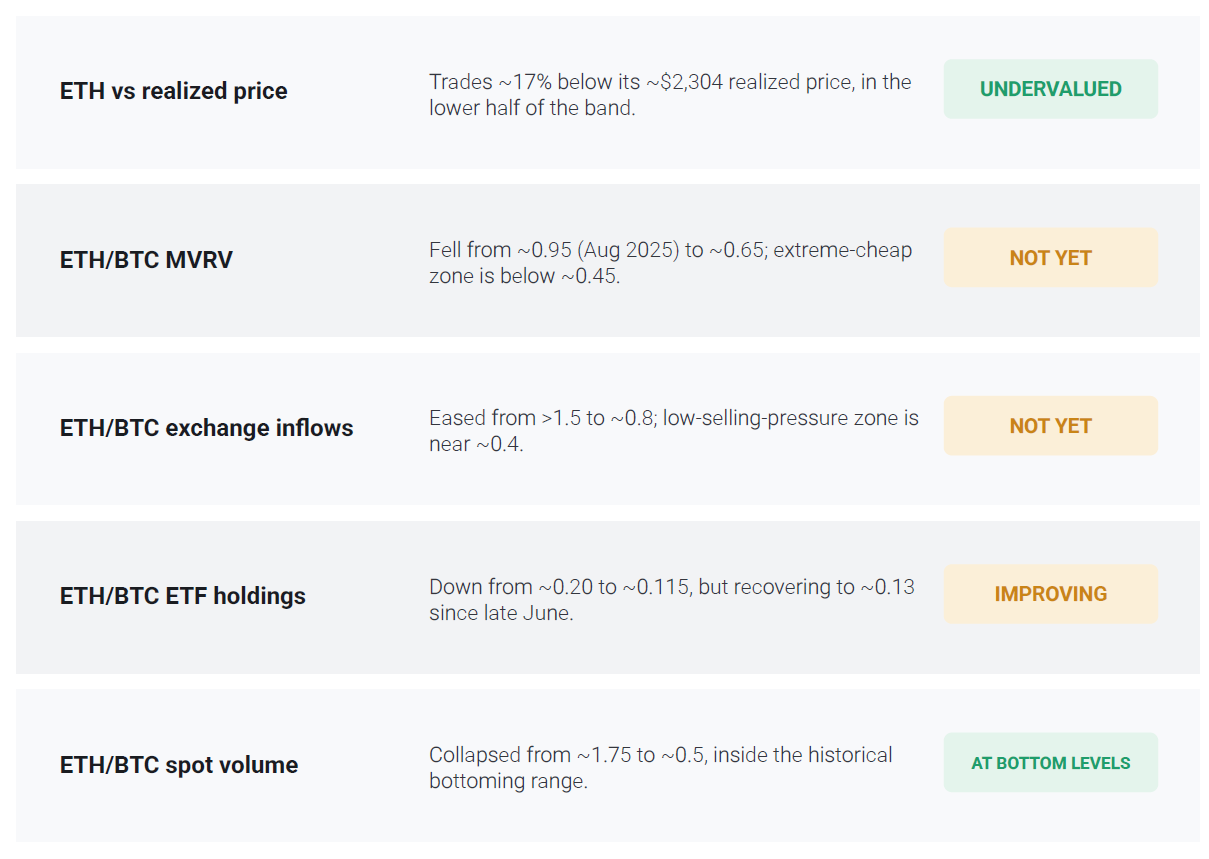
In its latest weekly report, the analytics company said Ether (ETH) is trading roughly 17% below its realized price, or the average onchain acquisition cost of all ETH in circulation, of about $2,300. Historically, ETH trading below its realized price has coincided with periods of market undervaluation and long-term bottoms.
Ether is also showing signs of improving relative to Bitcoin (BTC). CryptoQuant said that ETH’s market value-to-realized value (MVRV) ratio has retreated from extreme overvaluation, exchange inflows have declined, exchange-traded fund (ETF) holdings have begun to recover after months of weakness, and ETH/BTC spot trading volumes have fallen into a range historically associated with market bottoms.

CryptoQuant says two of five key ETH bottoming indicators have been confirmed. Source: CryptoQuant
Even so, only two of CryptoQuant’s five bottoming indicators have reached historical reversal levels. The remaining metrics are improving but have yet to reach the extremes that have marked previous cycle lows, suggesting Ethereum’s bottom may still be forming.
The report comes as Ether briefly climbed above $1,950 this week and Bitcoin topped $67,000, buoyed by optimism surrounding the US CLARITY Act. At the same time, some market analysts have pointed to the potential for capital to rotate out of richly valued AI stocks and back into crypto, a shift that could further support Ether if risk appetite broadens.
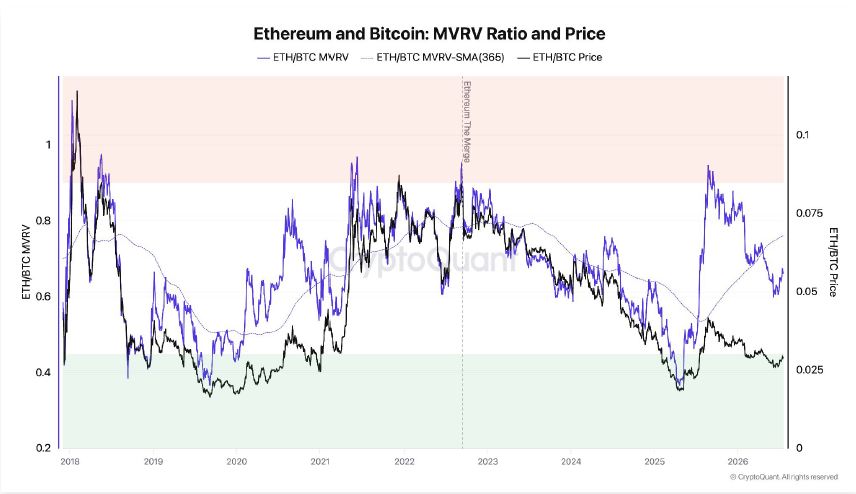
The ETH/BTC MVRV ratio has fallen from nearly 0.95 in August 2025 to around 0.65, signaling that Ethereum has become significantly cheaper relative to Bitcoin. Source: CryptoQuant
Related: Grayscale plans regular cash payouts from ETH, SOL staking rewards
Ethereum supply tightens as exchange outflows and staking climb
Ethereum has shown several constructive onchain signals over the past month. During the week beginning June 29, withdrawal activity on Binance, the world’s largest crypto exchange by trading volume, climbed to its highest level in more than three years.
Analysts generally interpret sustained exchange outflows as a sign that investors are moving assets into self-custody or staking rather than keeping them on exchanges for potential sale, although such flows do not guarantee accumulation.
Meanwhile, a record 34% of Ethereum’s circulating supply is now staked, according to Staking Rewards. As Cointelegraph previously reported, higher staking participation reduces the amount of ETH readily available for trading, potentially easing short-term selling pressure if demand remains resilient.
Tom Lee’s Bitmine Immersion Technologies, the biggest corporate ETH holder, continues to accumulate Ether, boosting its holdings by 325,000 ETH over a one-month period, despite sitting on large unrealized losses. It has set a target to hold 5% of the second-biggest crypto.
Related: Will the US get CLARITY this week? Bitcoin’s new $80K target: Hodler’s Digest, July 19


A hacker reportedly took over Robinhood CEO Vlad Tenev’s X account to promote a fake “VLAD” memecoin, posting what appeared to be a malicious token contract address.
Cathie Wood’s ARK Invest has purchased 220,012 Circle Internet Group shares worth about $13.9 million as CRCL stock has fallen below $64 and every major daily moving average.
Summary
- ARK Invest purchased 220,012 Circle shares worth about $13.9 million during CRCL’s decline.
- CLARITY Act progress could improve regulatory certainty for Circle and other digital-asset companies.
- CRCL remains below major moving averages despite an improving daily MACD signal.
According to ARK Invest’s trading disclosure, the firm divided the purchase among three actively managed exchange-traded funds. The ARK Innovation ETF acquired 159,517 shares, while the ARK Next Generation Internet ETF and ARK Fintech Innovation ETF added 42,400 and 18,095 shares, respectively.
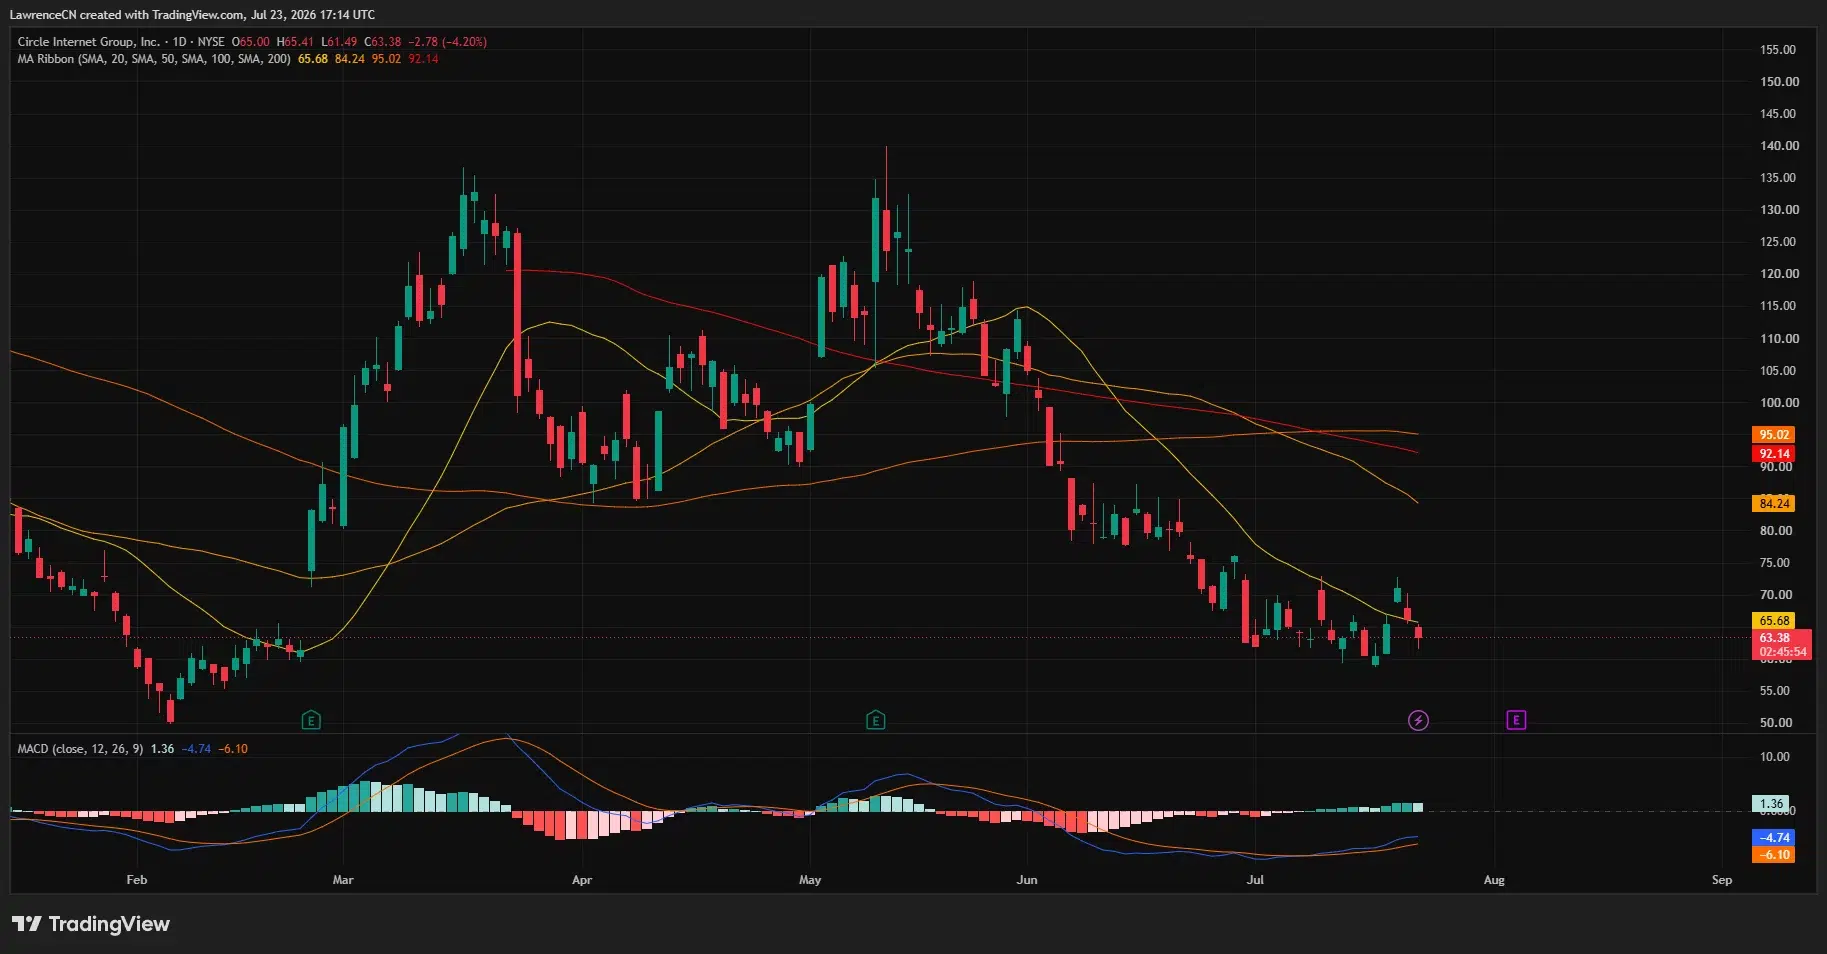
The transaction extended ARK’s buying during a steep decline in Circle’s market value. CRCL traded at $63.38 on July 23 after falling 4.20%, with the session producing a high of $65.41 and a low of $61.49, according to the daily TradingView chart.
Circle’s stock has struggled as weaker sentiment toward crypto-linked companies has reduced investors’ willingness to hold volatile digital-asset equities. Circle operates USDC, a dollar-backed stablecoin used across exchanges, payment services and decentralized finance applications.
Wood’s purchase suggests ARK remains willing to increase its exposure during the decline, although the investment manager has not guaranteed that CRCL has reached a bottom. ARK describes its investment approach as focused on companies tied to disruptive technologies and long-term growth, a strategy that can leave its funds exposed to sharp price swings.
Earlier this week, ARK used a similar approach with another high-volatility holding. As reported by crypto.news, four ARK funds purchased 170,634 SpaceX shares worth about $20.45 million while the stock traded below its $135 initial public offering price.
SpaceX then climbed 7.10% to $128.37, handing ARK an early unrealized profit on the new position, according to the crypto.news report. Although SpaceX and Circle operate in different industries, the transactions show ARK adding to selected companies after large declines rather than waiting for their charts to confirm a recovery.
CLARITY Act progress offers Circle a regulatory catalyst
Circle’s outlook has also become tied to negotiations over the Digital Asset Market Clarity Act, which could establish federal rules for digital-asset markets and divide regulatory responsibilities between the Securities and Exchange Commission and the Commodity Futures Trading Commission.
Senator Cynthia Lummis released an updated version of the legislation on July 22, combining texts advanced by the Senate Banking and Agriculture committees. In her announcement, Lummis described the coming weeks as a critical window for reaching an agreement that could allow the bill to become law.
Senate Banking Committee Chairman Tim Scott and Senate Agriculture Committee Chairman John Boozman have backed the revised framework. According to Lummis’ official release, Boozman argued that the proposal would give consumers, companies and markets clearer rules while adding safeguards for digital-asset activity.
For Circle, passage could reduce uncertainty surrounding businesses that issue stablecoins or provide related financial services. Such an outcome may make it easier for institutions to assess USDC-based products, but the proposal still requires enough Senate support and final approval before its provisions can take effect.
The latest draft faces political obstacles despite Republican support. Some Democrats have reportedly objected to the proposal’s treatment of crypto-related conflicts involving government officials, an issue that could complicate efforts to secure the 60 votes generally needed to advance legislation in the Senate.
CRCL remains bearish despite improving MACD momentum
CRCL’s daily chart shows that sellers still control the main trend even though one momentum indicator has started to improve. At $63.38, the stock sits below its 20-day simple moving average at $65.68, while the 50-day average is much higher at $84.24.

Longer-term resistance remains even further away. The chart places the 100-day moving average at $95.02 and the 200-day average at $92.14, leaving CRCL below all four trend indicators after a decline from its May peak near $140.
A recent rebound reached the $70–$72 region but failed to hold, according to the chart. Buyers would first need to recover the 20-day average at $65.68 before challenging that recent rejection zone. A daily close above $72 would provide stronger evidence that demand is returning, while the 50-day average at $84.24 would remain the next major obstacle.
On the downside, the July 23 intraday low places immediate support near $61.50. The chart also shows a demand area between $58 and $60, where buyers previously interrupted the decline. A sustained move below $58 would extend the sequence of lower lows and leave CRCL vulnerable to another leg down.
Momentum has offered one early sign of relief. The daily moving average convergence divergence line has risen to minus 4.74, above its signal line at minus 6.10, while the histogram has turned positive at 1.36.
Because both MACD lines remain below zero, the chart indicates that selling momentum has eased without confirming a trend reversal. Until CRCL recovers $65.68 and then $70–$72, ARK’s latest purchase remains a bet against an established downtrend rather than confirmation that Circle stock has formed a durable bottom.
Disclosure: This article does not represent investment advice. The content and materials featured on this page are for educational purposes only.

Bitcoin is stuck near $65,000, and trader Wise Crypto thinks AI spending is a big part of why.
The OG crypto poked above $66,000 earlier this week before losing steam, and the pattern points to money chasing AI stocks instead of crypto while inflation and bond yields keep pressure on risk assets.
Where the Money Is Actually Going
Wise Crypto laid out the case on X Thursday, noting that while spot Bitcoin ETFs have had seven consecutive days of inflows that have raked in just under $1 billion, the number was a small one next to the $6.9 billion that left those same funds in May and June.
Meanwhile, Big Tech is spending somewhere between $190 billion and $205 billion on AI infrastructure this year, with Nvidia’s data center revenue up 92% year over year, and AI-linked stocks have climbed roughly 69% since January. Bitcoin, over that same stretch, is down about 25%.
“Capital is flowing to AI, not crypto,” Wise Crypto wrote, pointing to two-year Treasury yields near 4.3% and ten-year yields near 4.6% as the forces keeping the dollar strong and investors cautious on risk assets.
The price data backs up the stall, as BTC was trading around $65,400 at the time of writing, down 0.6% on the day, after swinging between about $65,300 and $66,300 in the last 24 hours and between $62,500 and $66,900 over the past week. It is still up close to 5% across 30 days but sits roughly 45% below its all-time-high near $126,000 from last October.
“BTC needs lower inflation, falling yields & stronger demand to break $60K-$70K range,” claimed Wise Crypto.
Another market watcher, Ted Pillows, writing in his Thursday market report, pointed to Brent crude being near $94 a barrel after another round of US-Iran strikes, along with a ten-year TIPS real yield of about 2.31%, a post-pandemic high, as the direct drag on non-yielding assets like Bitcoin right now.
“I’d rather watch $64,000 get defended than chase a run back toward $66,500,” he said.
The Technical Levels Traders Are Watching
Michaël van de Poppe has said Bitcoin has already reached its target area, and that holding above the 21-day moving average keeps the door open for near-term gains, with $68,000 marking the next resistance zone and a break above it potentially opening a run to $73,000.
Fellow analyst Axel Adler noted that ETFs have taken in $439 million so far this week, while the so-called Coinbase discount, running for 78 days now, has started to narrow.
Further out, EGRAG CRYPTO flagged a developing double bottom pattern that would need a weekly close above $83,000 to gain traction, with $173,000 the eventual target if the setup plays out, though a weekly close below roughly $51,000 would invalidate it.
A similar reaction zone between $67,900 and $68,300 was pointed to by Bitfinex analysts, who also noted that short-term holders who bought in that range tend to sell once they recover their original positions, a pattern that has capped rallies before and could do so again if $68,000 comes back into play.
The post Analyst: Bitcoin Stuck Near $65K Because Capital Is Flowing to AI appeared first on CryptoPotato.

Grayscale’s Pandel Says Bitcoin Bottom May Precede Cycle Low

St. George Illawarra Dragons vs Gold Coast Titans Tips, Odds, Teams & Predictions – NRL Round 21 2026

Samsung finally switched to silicon-carbon battery on Galaxy Z Fold 8. What’s so special about it?


-

 Fashion6 days ago
Weekend Open Thread – Corporette.com
-

 Politics5 days ago
The House | The City of London can help the new chancellor deliver growth in every postcode
-
 Crypto World5 days ago
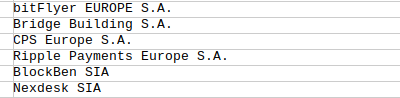
Ripple Payments Joins MiCA With 14 Firms, Does It Mean Anything For XRP?
-
 Crypto World6 days ago
Two July Windows Left: The CLARITY Act’s Senate Fight and What Failure Means
-

 Politics4 days ago
Democrats look to World Cup watch parties to register thousands of voters
-

 Crypto World6 days ago
Ripple wins EU-wide access as ESMA adds it to MiCA register
-

 Crypto World2 days ago
Grayscale Files For Worldcoin ETF, WLD Registers Sharp Rise
-

 NewsBeat3 days ago
Unregistered fitter used Gas Safe logo on business flyers
-
 Tech3 days ago
Sail Virtually Aboard The “Itanic” With IA-64 Emulator
-

 Crypto World7 days ago
Injective Submits SEC Transfer-Agent Registration to Onchain Ownership Records
-
 Tech3 days ago
Turtle Beach Command Series KB7 review: a nifty screen-equipped gaming keyboard
-

 NewsBeat6 days ago
Registration is now open for March for Men with Kev 2026
-
 Business2 days ago
New Jersey voter registration controversy explained: How 6,600 noncitizens got on the rolls, and what happens next
-
 Crypto World7 days ago
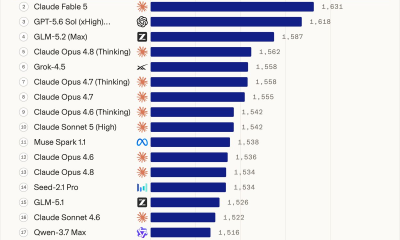
Claude Fable 5 Slips to Second in AI Coding Leaderboard
-

 News Videos7 days ago
Money | Class 12 Economics | CBSE Board Exam 2026-27
-

 Business7 days ago
Banco Bilbao Vizcaya Argentaria, S.A. (BBVA) Discusses Global Macro Environment and Economic Outlook for Core Markets Transcript
-

 Crypto World5 days ago
Kaspersky exposes OkoBot’s 20-module crypto wallet attack
-

 News Videos4 days ago
Big Money Is Entering XRP
-

 Business6 days ago
Airlines warn Sunshine Protection Act could disrupt flight scheduling
-

 NewsBeat6 days ago
Durham County Council to send out electoral registration emails
You must be logged in to post a comment Login