

Crypto World
Russian Experts Split on EU’s New Crypto Sanctions: Adapt or Isolate?



The EU just hit Russia’s crypto harder than ever before. Six Russian experts told BeInCrypto the blow is real, but not deadly. They cannot agree on what comes next.
The new sanctions target 14 crypto platforms in other countries. They also hit 94 Russian banks and the Moscow Exchange. And for the first time, the EU can ban any foreign crypto service that helps Russia dodge the rules.
One Group Says the Market Will Cope
Anton Tkachev, a senior Russian lawmaker, has seen this before. Sanctions are normal now, he says. Firms just plan around them. Blocked sites get replaced fast.
He points to Garantex. Police seized the Russian exchange in early 2025. Within days, its team relaunched it as Grinex. And copycat platforms keep appearing.
First-timers still feel it. Wallets get flagged. Transfers abroad raise questions. Users must prove where their money came from. But Tkachev calls this an operational inconvenience, nothing worse. He points to a “hardening effect” that makes Russian teams sharper.
Nadezhda Surova, a Russian digital-economy adviser, agrees the market can cope. It is “demonstrating resilience to sanctions pressure,” she says, after adapting to 20 earlier rounds.
After the EU’s earlier sector-wide ban, she expects trading to move elsewhere. That means decentralized apps, peer-to-peer deals, and stablecoins.
It also flows to friendly countries. Kyrgyzstan is a good example. It had 126 licensed crypto firms and $4.2 billion in volume by late 2024, according to TRM.
Dmitry Zuev, a crypto executive at NGE Farm, says it is “premature to draw conclusions” this early. He thinks the pain will hit cross-border payments most. For normal companies, he adds, Russia’s new crypto law matters more than these sanctions.
The Other Group Sees Isolation
Maria Agranovskaya, a Russian crypto lawyer, is more worried. She calls this the first big, direct strike on Russian crypto. Her verdict is “critical, but not fatal” for now. The EU’s first crypto penalty came last year, on a ruble-backed coin. This time it goes much further.
She says the new rules threaten platforms Russians use in Kyrgyzstan, the UAE, and Georgia. The result, she warns, is isolation and a growing “gray” market. She quotes former minister Andrey Nechayev, who sees a “closed crypto market within the Russian Federation.”
The squeeze is already showing. One ruble-backed coin, A7A5, saw daily transfers crash from over $1.5 billion to about $500 million after sanctions, Elliptic found. A big exchange, Uniswap, blocked the coin. Some traders even had accounts frozen when their funds were linked to it.
Alexey Zyuzin, who heads a Russian crypto-industry group, thinks the market will split in two.
“Two circuits are likely to form. The first is a legal domestic market under the control of the Russian regulator… The second is a cross-border segment, where elevated sanctions and technological risks will persist.”
The most exposed, he says, are firms that rely on foreign payments.
Nikolai Zagvozdkin, a crypto lead at Russian media group RBC, says the full target list is not out yet. Still, he sees a clear signal. Europe now treats crypto as key to Russia’s trade. Exchanges will check harder, with more freezes and refusals.
“Working with crypto will become more expensive, slower, and somewhat less transparent.”
What Will Decide the Damage
Everyone agrees on one thing. It all depends on who the EU actually targets. The full list is not public yet. Early counts put it near 10 or 11 platforms. If the rules touch every service used by Russians, the pain spreads wide. If they stop at sanctioned banks and known evaders, the market adapts. It has done so before, just within tighter limits.
The post Russian Experts Split on EU’s New Crypto Sanctions: Adapt or Isolate? appeared first on BeInCrypto.

Zcash price has fallen toward the $500 psychological support as a 4-hour breakdown, leveraged liquidations, and caution before the Ironwood upgrade have weakened market sentiment.
Summary
- Zcash price has fallen toward $500 after losing $520 and triggering more than $2 million in long liquidations.
- Bulls must reclaim $530 to neutralize the bearish structure, while $550 remains the main breakout level.
- A daily close below $477 could expose $466 and the rounded-top target near $371.
According to data from crypto.news, Zcash (ZEC) price traded near $502 on July 24 after losing about 5.5% over the past week. Sellers took control after the token lost $520, while more than $2 million in long positions were liquidated over 24 hours. Automated stop orders added pressure once price slipped through intermediate support at $510.
Outside crypto, Thursday’s technology rout reduced demand for risk assets. The Magnificent Seven erased about $797 billion in market value after Alphabet and Tesla’s earnings raised concerns over heavy artificial intelligence spending. The Nasdaq Composite fell more than 2%, while Tesla dropped 14% and Alphabet lost almost 7%.
Oil and bond markets added another obstacle. Brent crude briefly moved above $100 after Houthi attacks on two Saudi tankers raised fears of disruption in the Red Sea. The 10-year U.S. Treasury yield reached an 18-month high near 4.70%, making speculative assets less attractive as traders reconsidered expectations for lower interest rates.
Crypto funds also lost institutional capital during the selloff. U.S. spot Bitcoin exchange-traded funds recorded $225 million in net outflows on July 23. BlackRock’s IBIT accounted for $202 million of the withdrawals, extending the defensive mood into altcoins such as ZEC.
Zcash price must reclaim $530 to repair its short-term structure
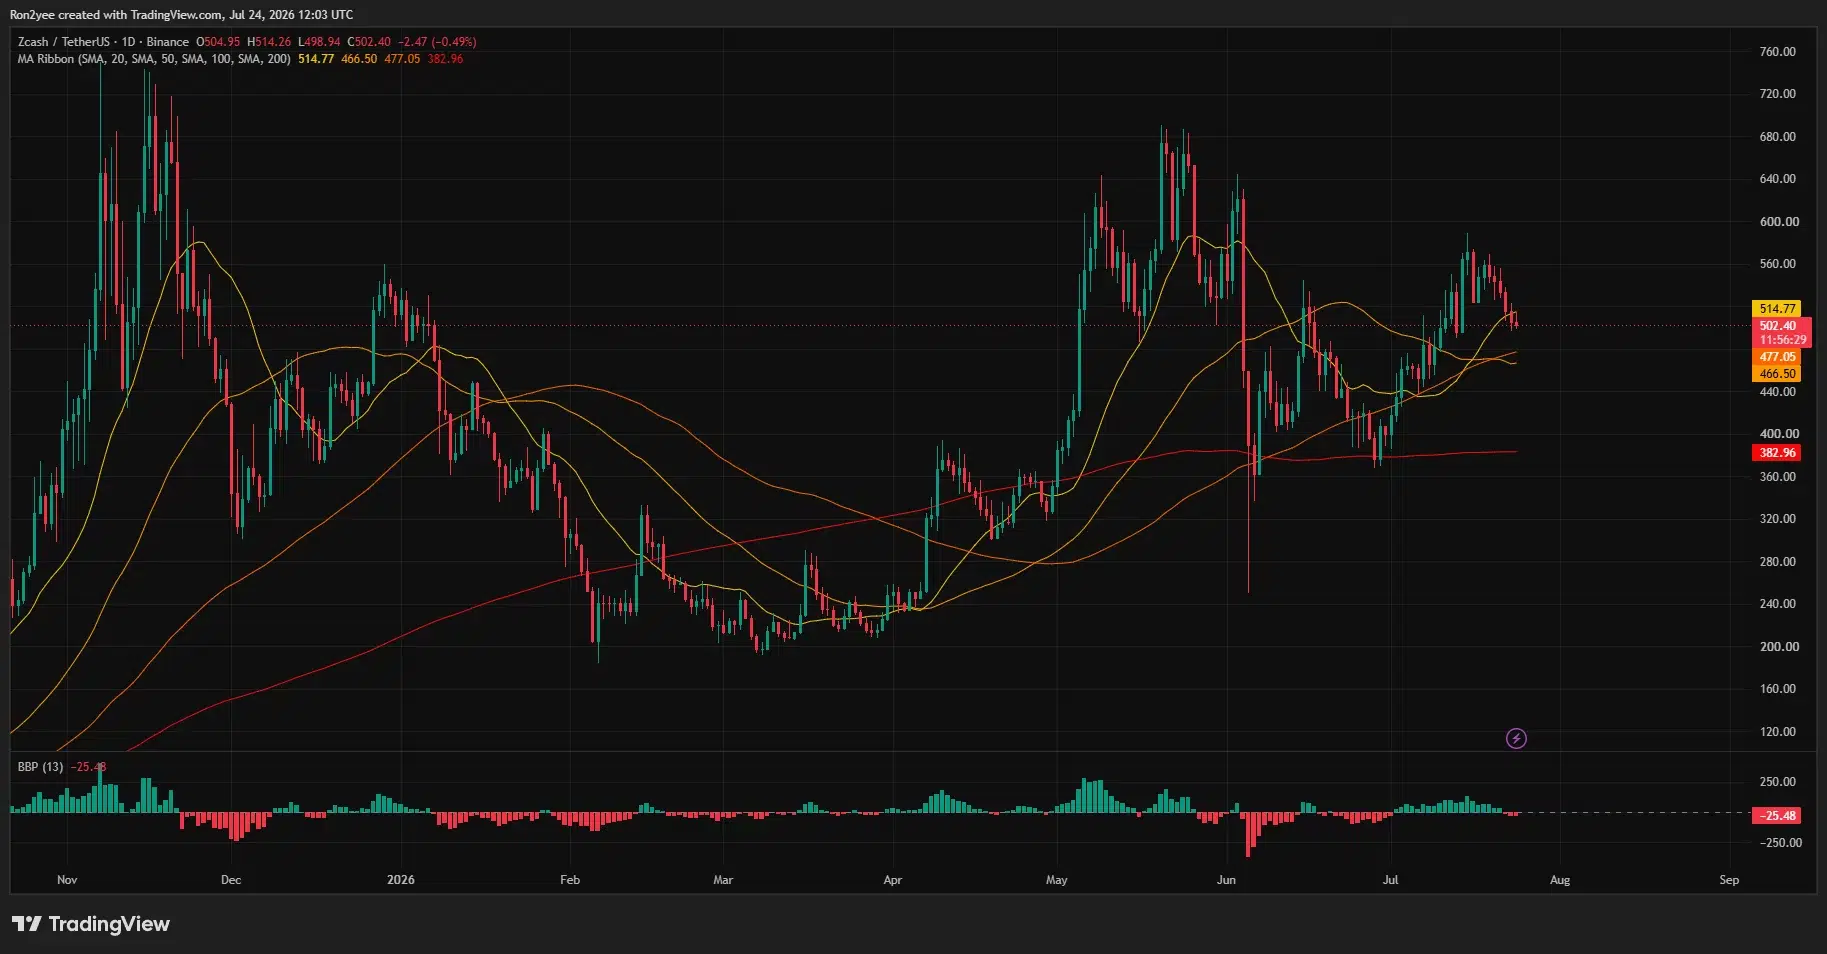
On the daily chart, ZEC has fallen below its 20-day simple moving average at $514.77 but remains above the 50-day SMA at $477.05 and the 100-day SMA at $466.50. Those averages form the first major support area if bulls cannot hold $500. The 200-day SMA sits much lower at $382.96.
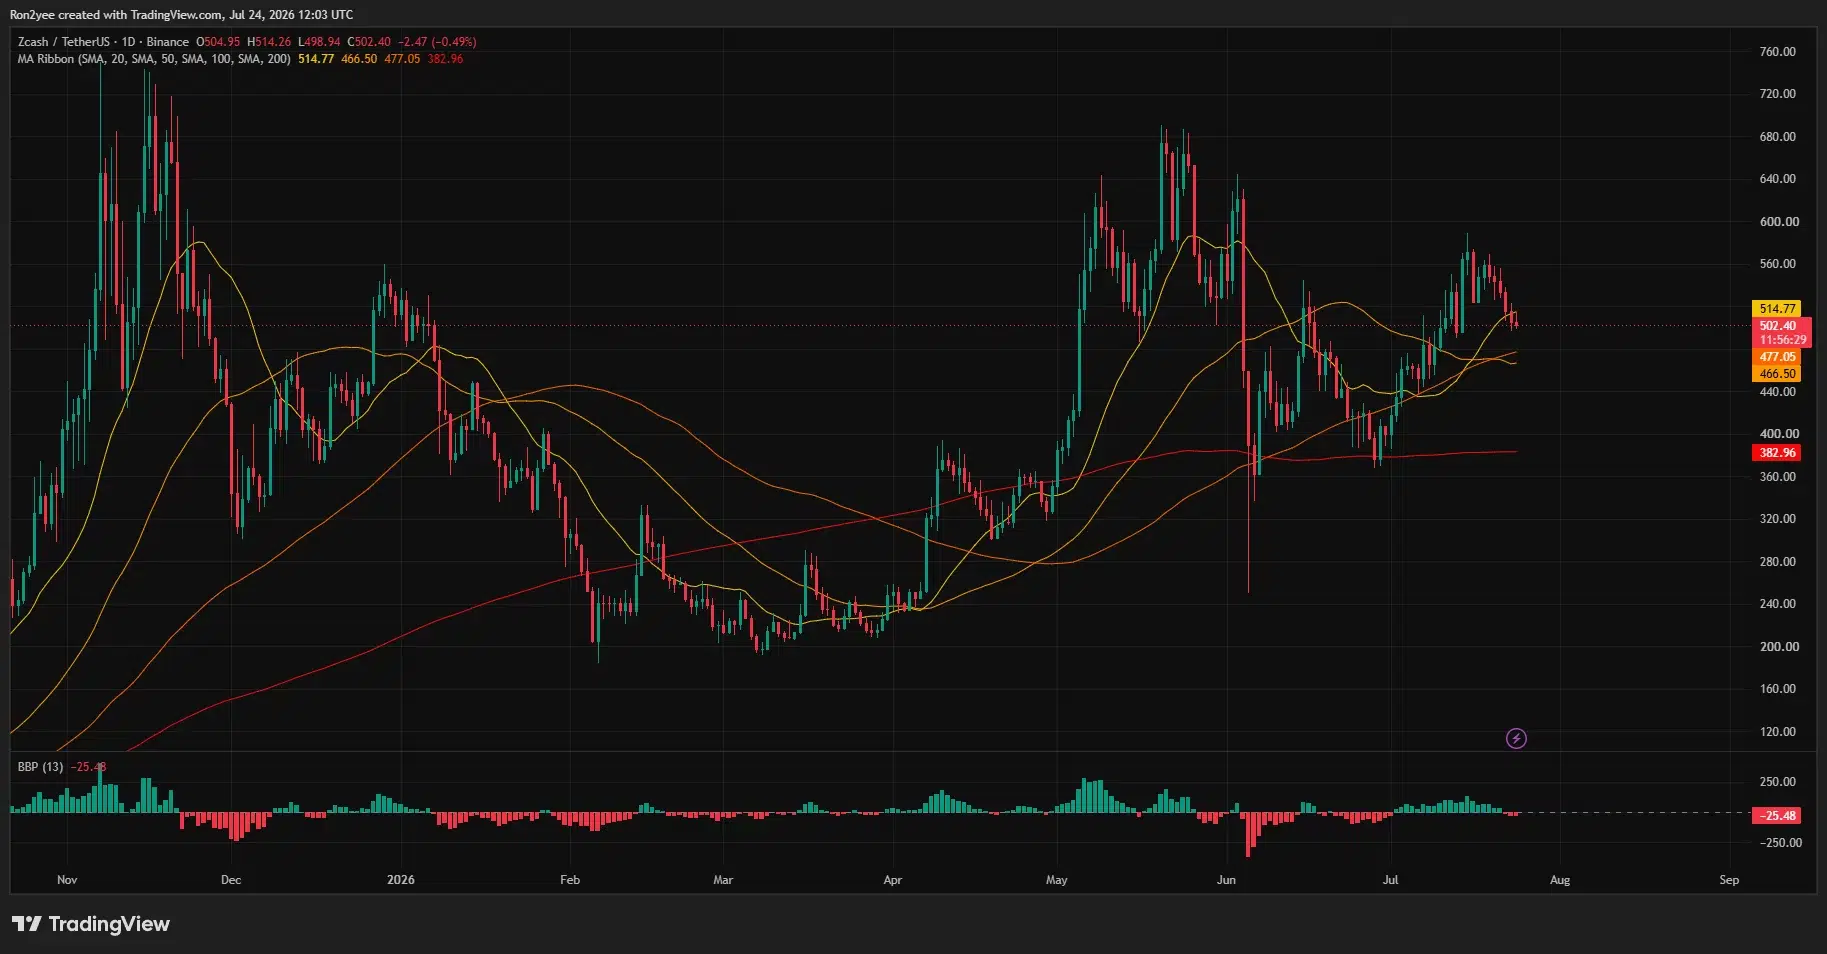
Bear-bull power has dropped to minus 25.48, which shows that sellers have gained control after ZEC’s rejection near $570. However, the token remains above its medium- and long-term averages, leaving the daily recovery structure intact unless price closes decisively below the $466–$477 zone.
The 4-hour chart carries a more bearish setup. ZEC has formed a rounded-top structure since its July 15 peak near $580, with price now testing the $500 area. A confirmed breakdown could extend toward $470 before exposing the pattern’s main support and projected target around $370.69.
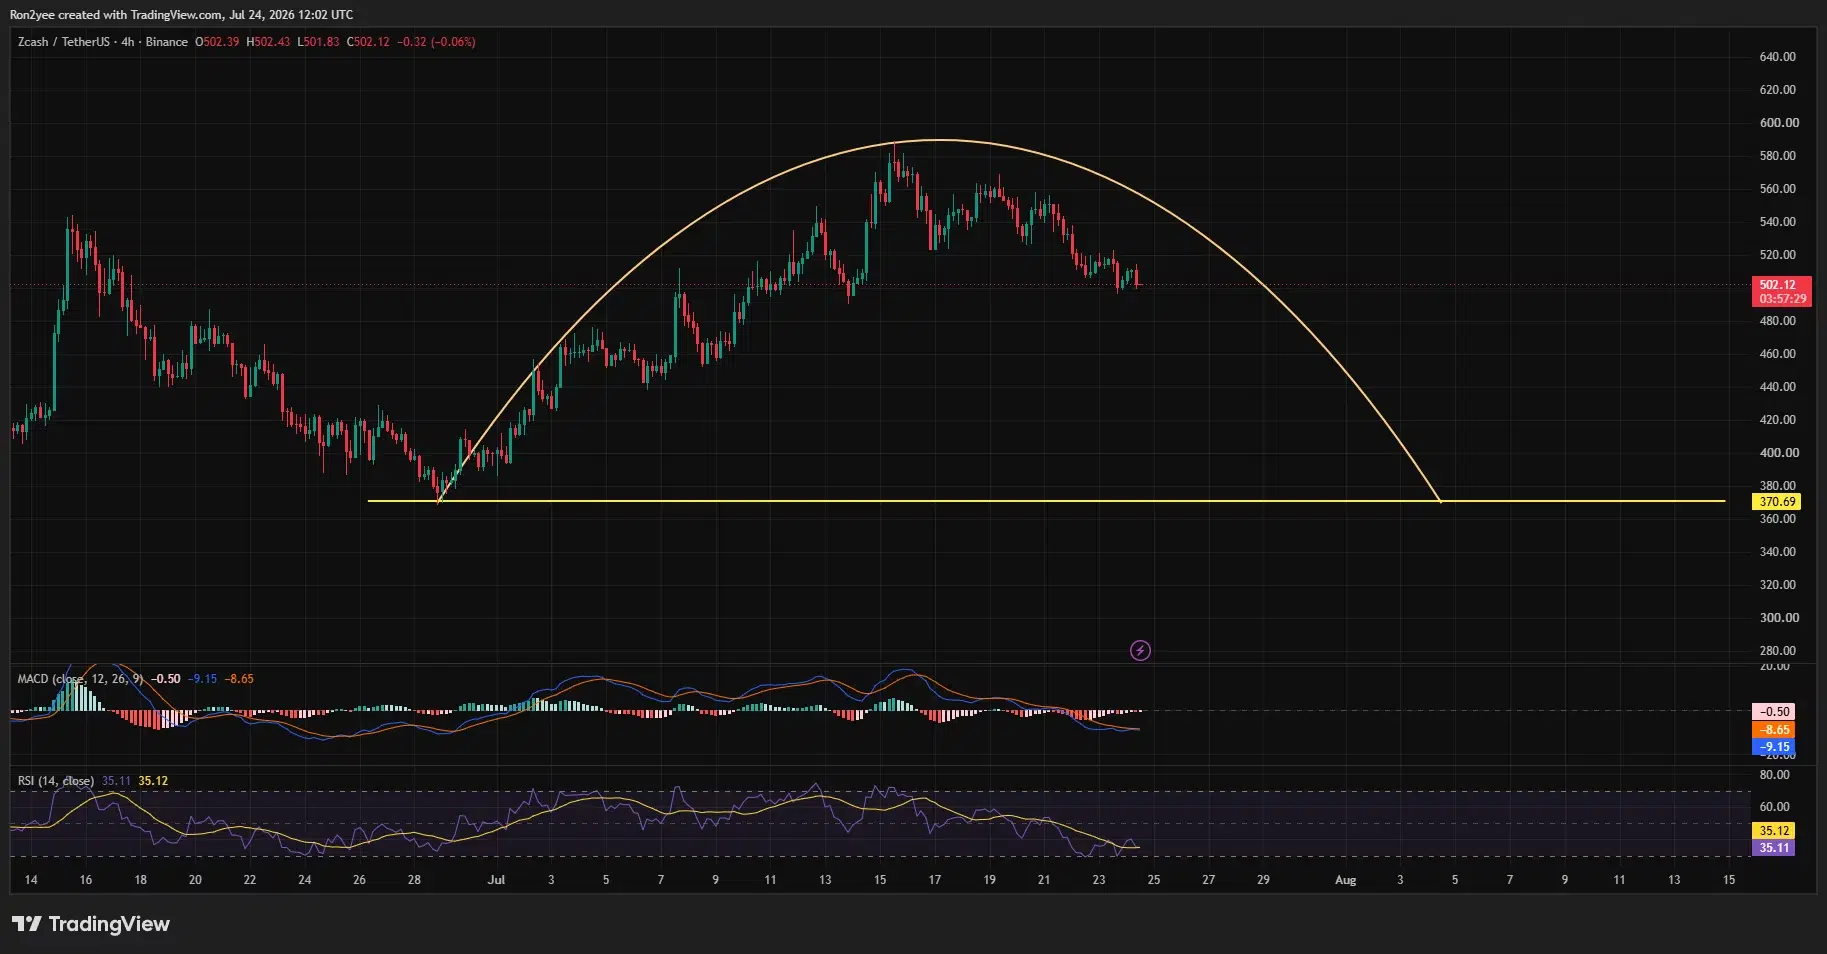
Momentum readings have yet to confirm a reversal. The 4-hour Relative Strength Index stands at 35.11, close to oversold territory but still above 30. The Moving Average Convergence Divergence line remains below its signal line at minus 9.15 versus minus 8.65, while the negative histogram shows that sellers retain an advantage.
According to trader Ardi, $500 has become the main liquidity pivot after ZEC lost $520. The trader expects a brief move below the threshold before any sustained recovery and wrote:
“A reclaim of $530 would return the chart to neutral and likely begin a sideways consolidation phase.”
Ardi identified $550 as the level that would fully break the current bearish structure. Beyond it, $620 would become the next macro breakout barrier. Failure to protect $500, however, could force the trader to close the remaining long position established near $425.
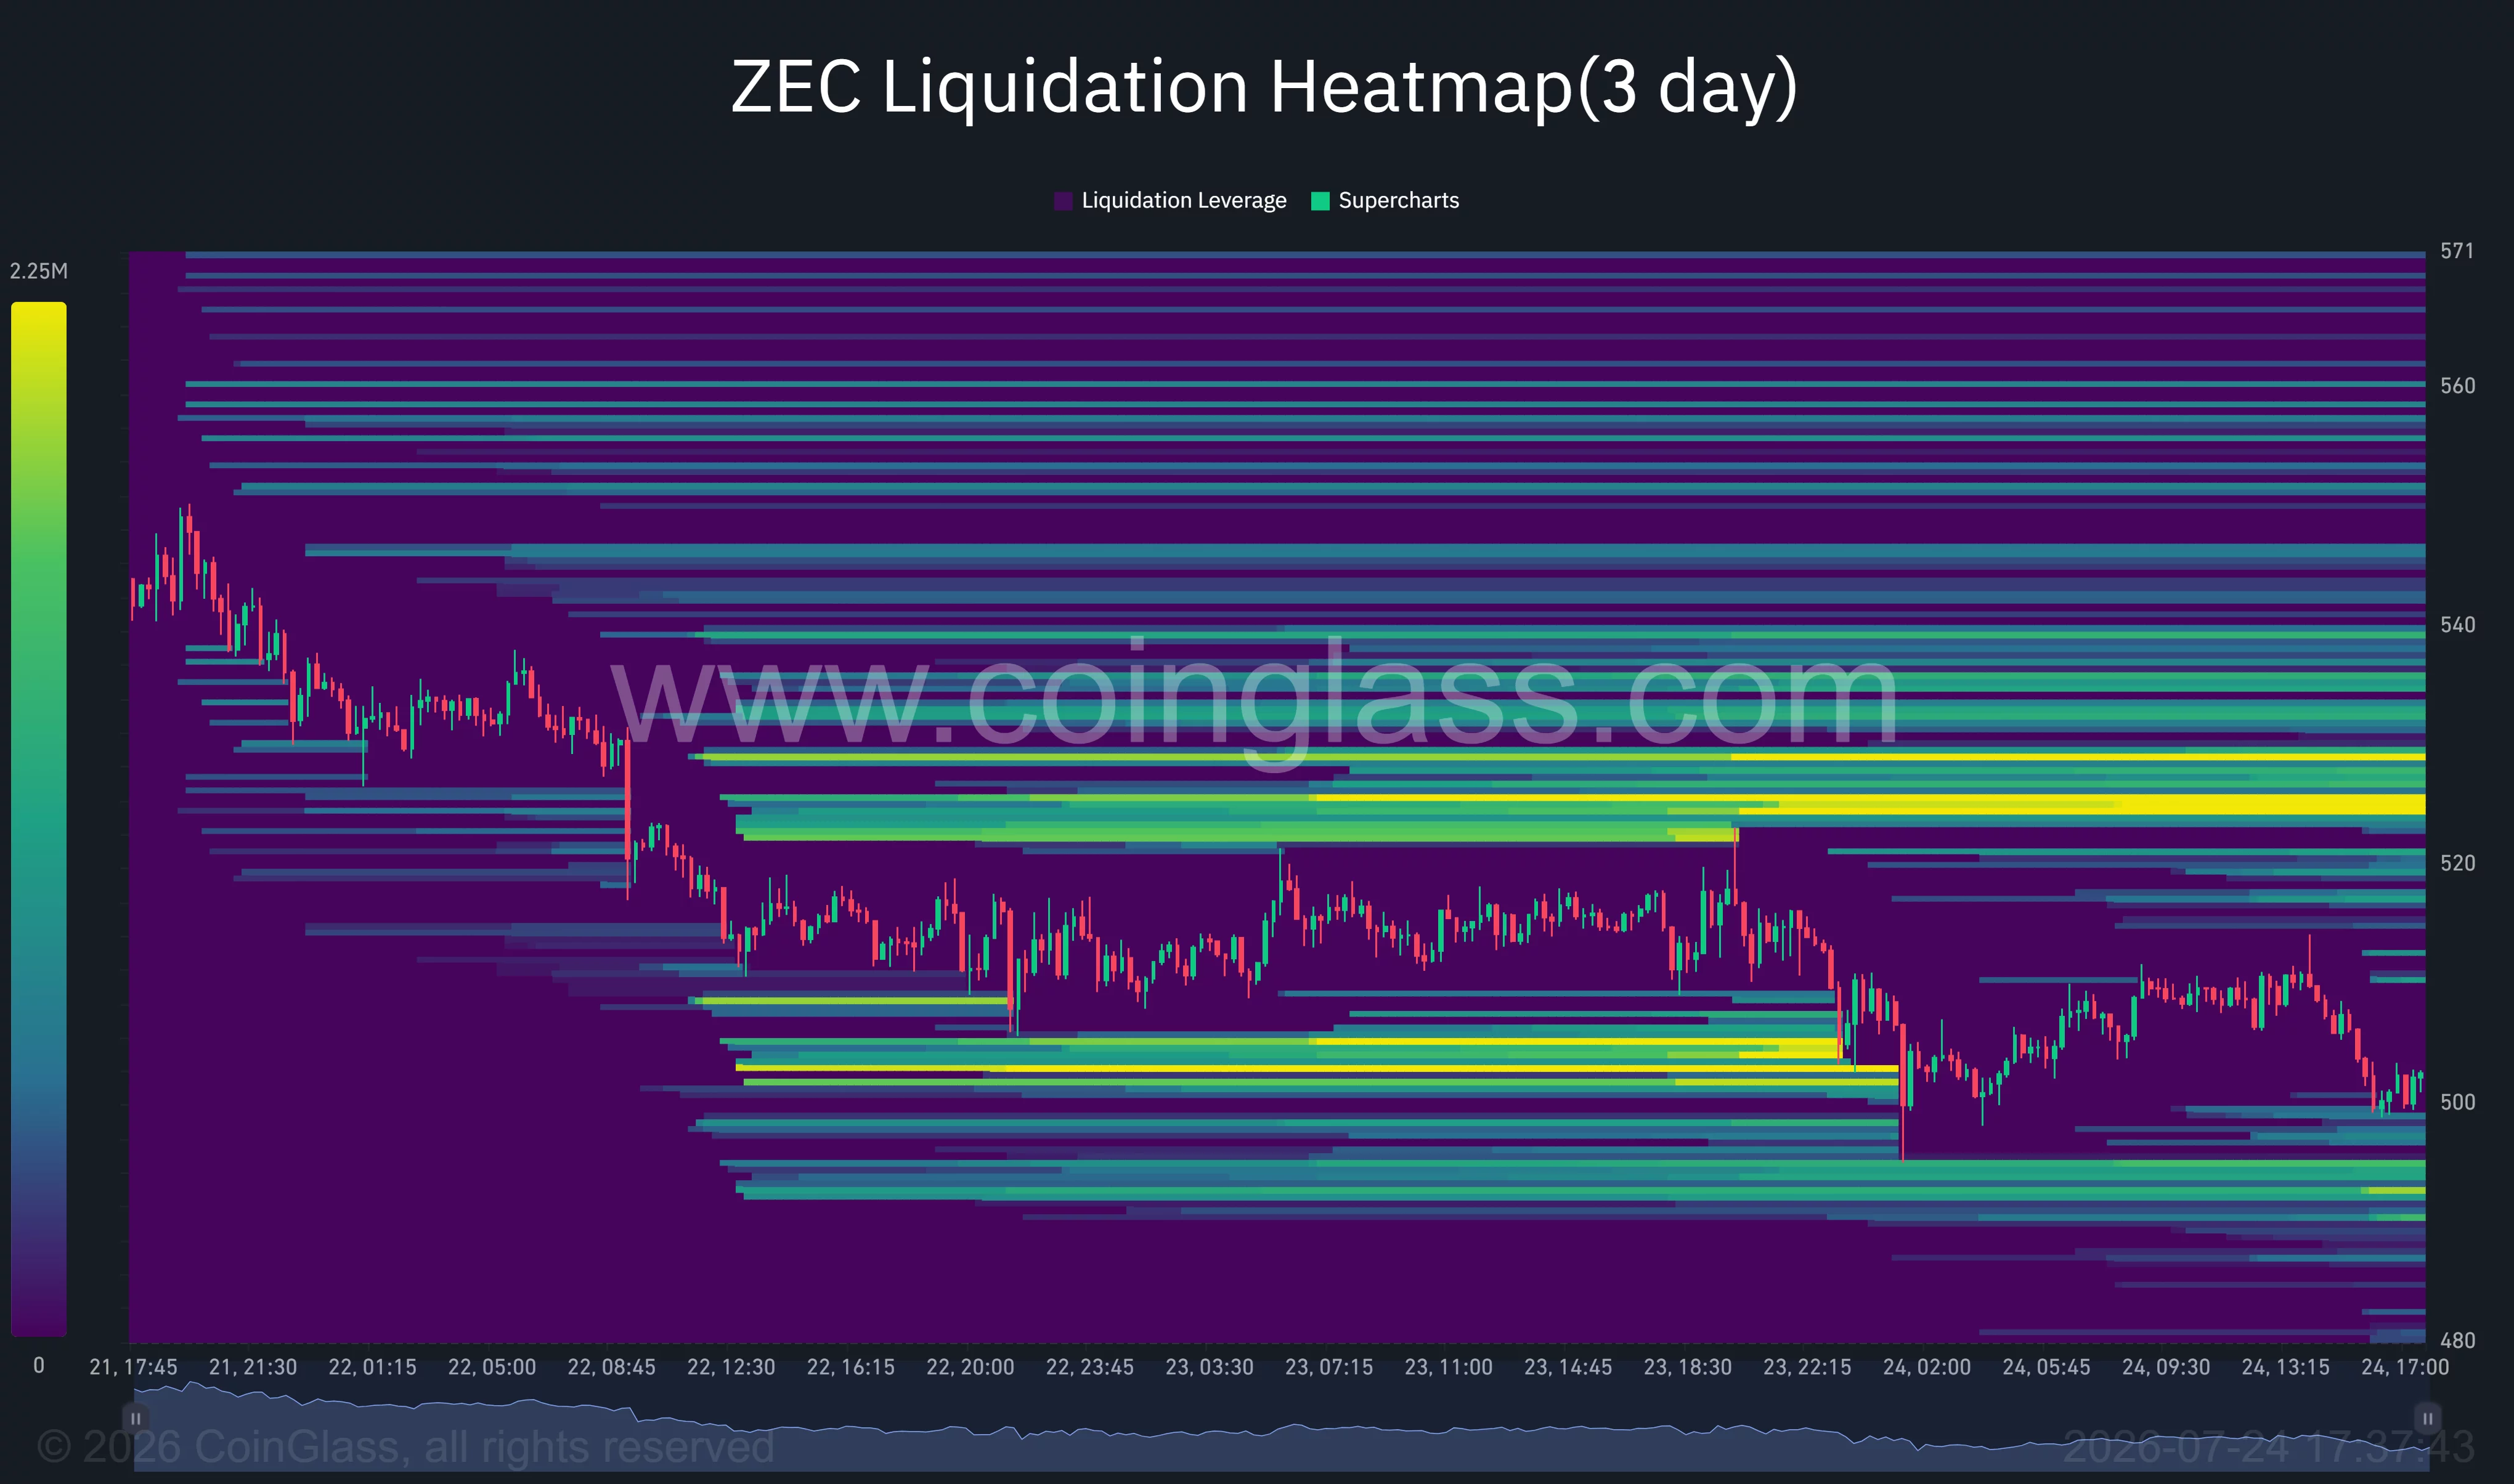
CoinGlass’s three-day liquidation heatmap places the strongest overhead concentration between $524 and $529. A rebound into that band could force short sellers to exit and help ZEC challenge Ardi’s $530 neutral level. Below the market, another dense leverage pocket sits around $490–$494, making that range a likely destination if $500 gives way.
Derivatives traders have not turned fully bearish. ZEC’s funding rate remained positive at approximately 0.0076%, showing that long positions still pay shorts. Yet falling open interest and weaker spot volume show that fewer traders are willing to carry leverage through the current decline, limiting the fuel available for an immediate rebound.
Loss of $477 would invalidate the remaining bullish setup
Ironwood, also known as NU6.3, will activate at block 3,428,143 on July 28. The upgrade will retire the vulnerable Orchard shielded pool and introduce a corrected pool. Funds leaving Orchard must pass through an accounting turnstile designed to prevent more ZEC from exiting than originally entered.
Zcash founder Zooko Wilcox has explained that the process cannot identify individual counterfeit coins or prove that the flaw was never exploited. Temporary wallet and exchange interruptions may occur as service providers update their systems, giving short-term traders another reason to reduce exposure before activation.
Zakura offers a longer-term counterweight to those concerns. The new Rust-based full-node client targets 50,000 private transactions per second and can reportedly start from a pruned snapshot in under two minutes. Still, the development has not stopped the current price correction.
A daily close below the 50-day SMA at $477.05 would weaken the primary recovery thesis and expose $466.50, followed by the June support region near $370. Continued ETF withdrawals, high Treasury yields, another oil spike, or complications during Ironwood activation would increase that downside risk. Bulls must first defend $500 and reclaim $530 before ZEC can make another attempt at $550.
Disclosure: This article does not represent investment advice. The content and materials featured on this page are for educational purposes only.
In the summer of 2024, a meme coin named DADDY went viral on crypto X, and its price skyrocketed within days. The controversial influencer Andrew Tate supported the token, and in the following months and years, his announcements or actions have triggered substantial price volatility.
Just a few days ago, he was arrested, which resulted in a major price decline for DADDY. Check out what exactly happened.
Tate Behind Bars
Besides being famous for his successful kickboxing career, Tate has also made global headlines due to his legal troubles. Over the years, he has faced multiple charges in the UK, Romania, and the USA, and has been arrested on numerous occasions.
On July 19, he and his brother (Tristan Tate) were once again detained in Miami after the British authorities issued 38 new criminal counts against them, including rape, actual bodily harm, and human trafficking.
“We have decided to prosecute Andrew and Tristan Tate for further offenses including rape, arranging or facilitating trafficking for sexual exploitation and offenses relating to indecent images of a child,” Malcolm McHaffie, head of the Special Crime Division at the CPS, said.
Andrew Tate, who denies the allegations, is due to face trial in Britain later this year, and according to his recent X post, he has been situated in a Special Housing Unit (SHU). He described his current location as “the highest level of security which exists,” claiming he has no contact with the outside world, is not allowed visitations, and has a neighbor who is “a cannibal who screams throughout the night.”
Several X users found his remarks controversial, questioning how he could still be tweeting when supposedly cut off from the world beyond prison walls.
And while his ability to interact with social media from behind bars may be surprising, the price action of the meme coin DADDY is anything but. Its price has tumbled by roughly 40% since his arrest, currently trading at a mere $0.0092 (per CoinGecko), while its market capitalization has shrunk from $8 million to less than $5 million.

DADDY: From a Crypto Sensation to a Worthless Token
Nearly two years ago, the token saw the light of day, and it acted as an opposition to MOTHER (another meme coin which is affiliated with the Australian model Iggy Azalea). Being widely known as a misogynist and one who often praises male dominance, Tate supported DADDY for “the patriarchy.”
His backing and the huge initial hype triggered a serious pump for the token, whose price briefly jumped to nearly $0.30, while its market capitalization was aiming at $100 million.
However, DADDY doesn’t rely on fundamentals but on clear speculation and enthusiasm on social media, so what happened next should come as a surprise. The price entered a steep downward trend, only worsened by the insider trading accusations directed at Tate.
The post Andrew Tate’s Meme Coin Crashes 40% Since His Arrest: Details appeared first on CryptoPotato.
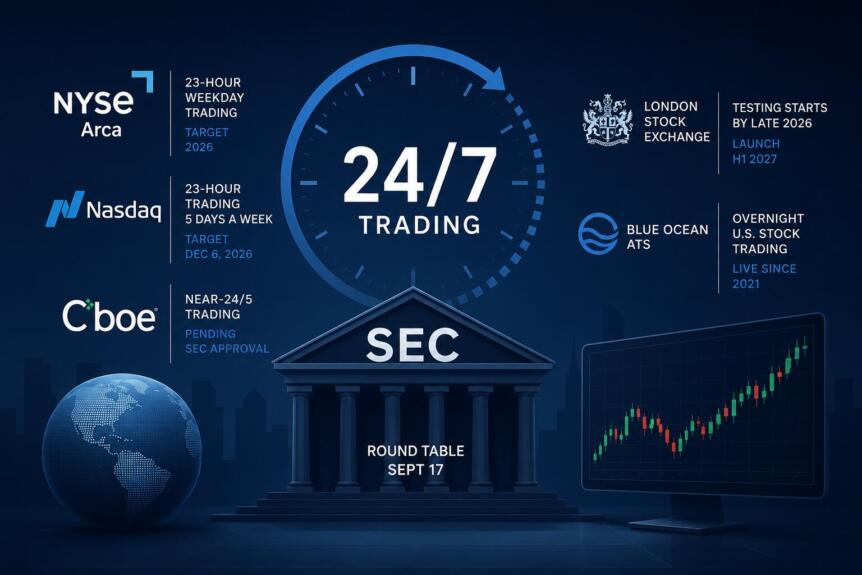
The SEC in the U.S. is scheduled to review the future of longer hours of the stock market after multiple exchanges in the nation have embarked on the journey of adopting trading that goes on almost through the day and night.
In a post made by Coin Bureau on X, it has been revealed that the SEC will organize a roundtable meeting on September 17, 2026 to discuss the implications of 24-hour trading in American financial markets.
SEC Plans Roundtable on Extended Trading Hours
According to Coin Bureau, it is reported that the SEC plans to organize a roundtable meeting to discuss the adoption of 24-hour trading for the U.S. stock exchange markets. The meeting will be held on September 17 and will revolve around the impact such changes will have on trading operations and the trading infrastructure.
The decision comes after rising interest from exchanges looking to extend their trading times. Even though the SEC has not granted permission for a national conversion to 24-hour trading, the discussion is a clear indication that the regulator is assessing proposals by exchanges.
Major Exchanges Advance 23-Hour Trading Plans
NYSE Arca is set to roll out 23-hour trading on weekdays and hopes for an implementation in 2026, based on information cited by Coin Bureau.
Nasdaq is planning to initiate 23-hour trading from December 6, 2026.
In the meantime, Cboe plans to roll out nearly 24/5 trading pending approval from the Securities and Exchange Commission. Across the globe, the London Stock Exchange is set to commence trials of extended hours trading by the end of 2026 and roll out a more comprehensive implementation in the first half of 2027.
Blue Ocean ATS Already Operates Overnight Trading
In contrast to other exchanges that are currently in the process of formulating their proposals, Blue Ocean ATS has provided its users with overnight U.S. stock trading since 2021. The company’s current system shows that an extended trading setup is operational, but it is used by a different category of customers.
With an increase in applications from exchanges for extending their trading periods, investors will have greater freedom to react to events beyond regular trading hours. Any further implementation will be subject to regulators’ decisions after their review process at the SEC.
Crypto Markets Provide a Reference for Continuous Trading
The cryptocurrency trading markets, from inception, have followed a trading model that is operational for 24 hours a week without market hours constraints. The current propositions being made by exchanges seem to indicate an increasing desire to extend similar flexibility to equity traders.
As things stand now, the SEC’s roundtable discussion is what constitutes the next phase in determining how extended trading can be integrated into the American financial framework. In any case, any modifications to market hours will have to be first sanctioned by the regulators.
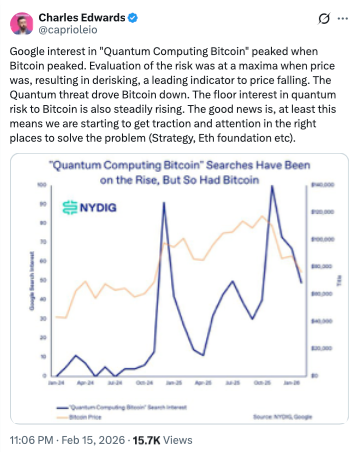
Bitcoin developers need to swallow their pride and outline a clear plan to harden the blockchain against quantum computing attacks, according to Capriole Investments founder Charles Edwards. He says the day they finally bite the bullet, the price will respond very quickly.
“If the Bitcoin core team says in two or three months: ‘this is our roadmap, we’re gonna solve it in the next two years, these are the rough steps we’ll take,’ that would be amazing news,” Edwards tells Cointelegraph on Trade Secrets.
“I think that would discount a lot of the risk pretty much overnight,” Edwards says.
The question of whether Bitcoin developers should modify the network to make its cryptography quantum-resistant has sparked heated debate within the Bitcoin community, with some arguing that major changes could conflict with Bitcoin’s core ethos. Others claim quantum computers are many years away, and a rushed cure could be worse than the disease.
Charles Edwards says a clear roadmap could push price up “very quickly”
Edwards often highlights the risk of quantum computing to Bitcoin to his 132,800 X followers. The fear is that, one day, powerful enough quantum computers could break the cryptography that protects the Bitcoin network and potentially compromise Bitcoin wallets.
The uncertainty has impacted investor sentiment, and some analysts say it has contributed to the downfall in Bitcoin’s price. The world’s largest asset manager, BlackRock recently pointed to quantum computing as a potential long-term risk in materials for spot Bitcoin ETF investors.
However, Edwards says if Bitcoin developers outline a clear roadmap to address the quantum threat, as some other chains have already done, it could send Bitcoin’s price higher “very quickly.”
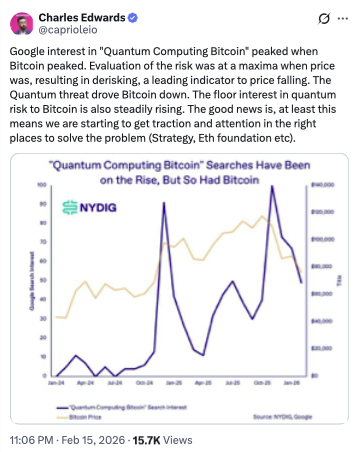
Source: Charles Edwards
“Double digits probably,” Edwards predicts. He adds the quantum issue is “somewhat counterintuitively an upside catalyst potential,” because it is currently on the back burner and the Bitcoin Improvement Proposals (BIPs) to date are “not really” a genuine solution.
Edwards is no stranger to making high-conviction calls on Bitcoin. Based in Melbourne, Australia, he founded Capriole Investments in 2019, a hedge fund focused on Bitcoin and digital assets. The firm uses a combination of quantitative models, AI, and macroeconomic analysis to guide its investment strategy across crypto markets.
Related: StarkWare CEO suggests 4% annual Bitcoin inflation to replace 21M cap
Charles Edwards says Bitcoin is 40% below its fair value
A growing number of observers worry the risk could become more serious if Bitcoin developers fail to make the necessary changes to the network before 2030. Ethereum is due to complete it’s post quantum overhaul by 2029, which will shine a spotlight on Bitcoin’s own preparations.
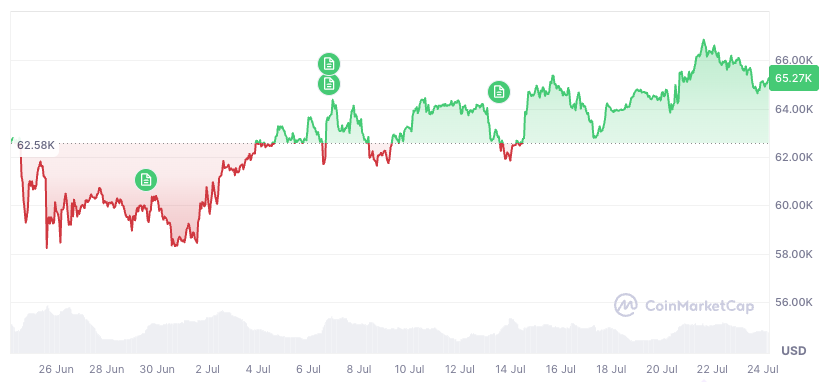
Bitcoin is trading at $65,270 at the time of publication. Source: CoinMarketCap
Edwards estimates that Bitcoin is currently around 40% below what he considers its fair value based on energy value, while arguing that quantum risk accounts for roughly a 30% discount. “That means it’s more than priced in,” Edwards said. Bitcoin is trading at $65,270 at the time of publication, roughly 49% below its October all-time highs of $126,100.
Edwards clarifies that Bitcoin’s current price reflects the quantum risk based on the information available today, rather than any unknown future developments that could accelerate the threat and tank the price further.
His estimate is based on the timelines outlined by leading quantum computing companies and researchers for when “Q Day” could arrive, the point at which quantum computers become powerful enough to reverse engineer private keys from public keys.
“That sits in that four to five year range, give or take, a few years,” Edwards says.
Edwards says he also factors in the time Bitcoin would need to develop and implement a solution, which BIP-360 author Ethan Heilman estimates could take years.
“If we’re gonna get into maths, it’s pretty simple; it is just an aggregation of those expert opinions. So it’s based on that, and based on the fact that there’s currently no solution for Bitcoin.”
“That risk again falls significantly if there’s a solution or if there’s a roadmap to a solution. But it also could grow if tomorrow we find out that Google is, you know, twice as far ahead on their roadmap to Q Day or some other major company,” he said.
“It’s priced in today, but it’s not to say that it can’t get worse or better. It’s just I think it’s skewed more probabilistically to the upside from here,” Edwards says.
Magazine: Bitcoin’s quantum dilemma: Bigger blocks or STARK proofs?
Cointelegraph publishes long-form journalism, analysis and narrative reporting produced by Cointelegraph’s in-house editorial team with subject-matter expertise. All articles are edited and reviewed by Cointelegraph editors in line with our editorial standards. Content published in here does not constitute financial, legal or investment advice. Readers should conduct their own research and consult qualified professionals where appropriate. Cointelegraph maintains full editorial independence.

Bitcoin price is holding up better than many risk assets despite a bearish prediction. BTC is trading near $65,500 after briefly slipping toward $64,600 intraday. That relative resilience stands out after the recent wave of selling. Still, the next move remains less certain than the rebound suggests.
The latest pullback followed renewed pressure across risk assets as investors trimmed exposure to growth and technology names. Bitcoin remains well below its cycle high near $126,000, while market value has contracted sharply. Meanwhile, margin-related selling added pressure as some traders liquidated BTC to meet collateral calls.
At the same time, weakness in major technology stocks has weighed on market sentiment. Heavy selling in large-cap names has made institutional investors more cautious. As a result, crypto has struggled to attract fresh momentum despite Bitcoin’s relative strength.
Whether BTC has carved out a tradable floor or is simply pausing before another leg lower depends on several technical and liquidity signals. Bulls must defend nearby support while reclaiming higher resistance levels. Otherwise, another wave of selling could keep the price under pressure before a stronger recovery begins.
Discover: The Best Token Presales
Bitcoin Price Prediction: Recover Above $70,000 While ETF Outflows Continue?
BTC is unlikely to reclaim higher levels quickly. Trading near $65,500, Bitcoin remains below the key resistance around $68,000. That area turned into resistance after the recent breakdown. Reclaiming it likely requires stronger macro sentiment or a clear improvement in spot ETF demand.
Spot Bitcoin ETFs have continued to see net outflows over its last session, showing institutions remain cautious. That is more than short-term noise. Until ETF demand steadies, the current trend lacks a strong catalyst for a sustained reversal.

Meanwhile, stronger support sits between $60,000 and $62,000, a zone that could come into focus if selling pressure returns. Bitcoin volatility has also compressed after recent swings. Historically, that setup often precedes a larger move instead of a slow, sideways grind.
The bullish case sees ETF flows stabilize, macro data support risk assets, and BTC reclaim $68,000. That could open the door to retesting $72,000. The base case keeps Bitcoin trading between $64,000 and $68,000 as markets await fresh catalysts. However, a sustained break below $64,000 could expose the $60,000 to $62,000 support zone. The trend remains cautious until price proves otherwise.
Trade BTC on Bybit and Get a Chance to Win Our $1,000 USDT Airdrop
Bitcoin Hyper Targets Early-Mover Upside as BTC Tests Critical Support
Here’s the uncomfortable truth for spot BTC holders: at current prices near $65,500, the risk-to-reward profile is less attractive than it was months ago. A recovery to $72,000 offers roughly 10% upside, while a drop to the $60,000 support zone implies about 8% downside. That makes chasing momentum less compelling unless Bitcoin reclaims key resistance.
As a result, some active traders are rotating into earlier-stage infrastructure and ecosystem plays tied to Bitcoin. Those assets have not appreciated as much as BTC during this cycle, giving them more room to run if market sentiment improves.
Bitcoin Hyper ($HYPER) is positioning itself as the first Bitcoin Layer 2 with Solana Virtual Machine (SVM) integration, targeting Bitcoin’s three core limitations: slow transactions, high fees, and near-zero programmability.
The presale has raised $33 million at a current price of $0.0136836, with staking available for early participants. The project has attracted attention for its decentralized canonical bridge for BTC transfers and sub-Solana-latency execution.
Research Bitcoin Hyper before the current presale stage closes.
Discover: The Best Crypto to Diversify Your Portfolio
The post Bitcoin Price Prediction: BTC USD Shrugging Off $800 Billion AI Sell-Off appeared first on Cryptonews.
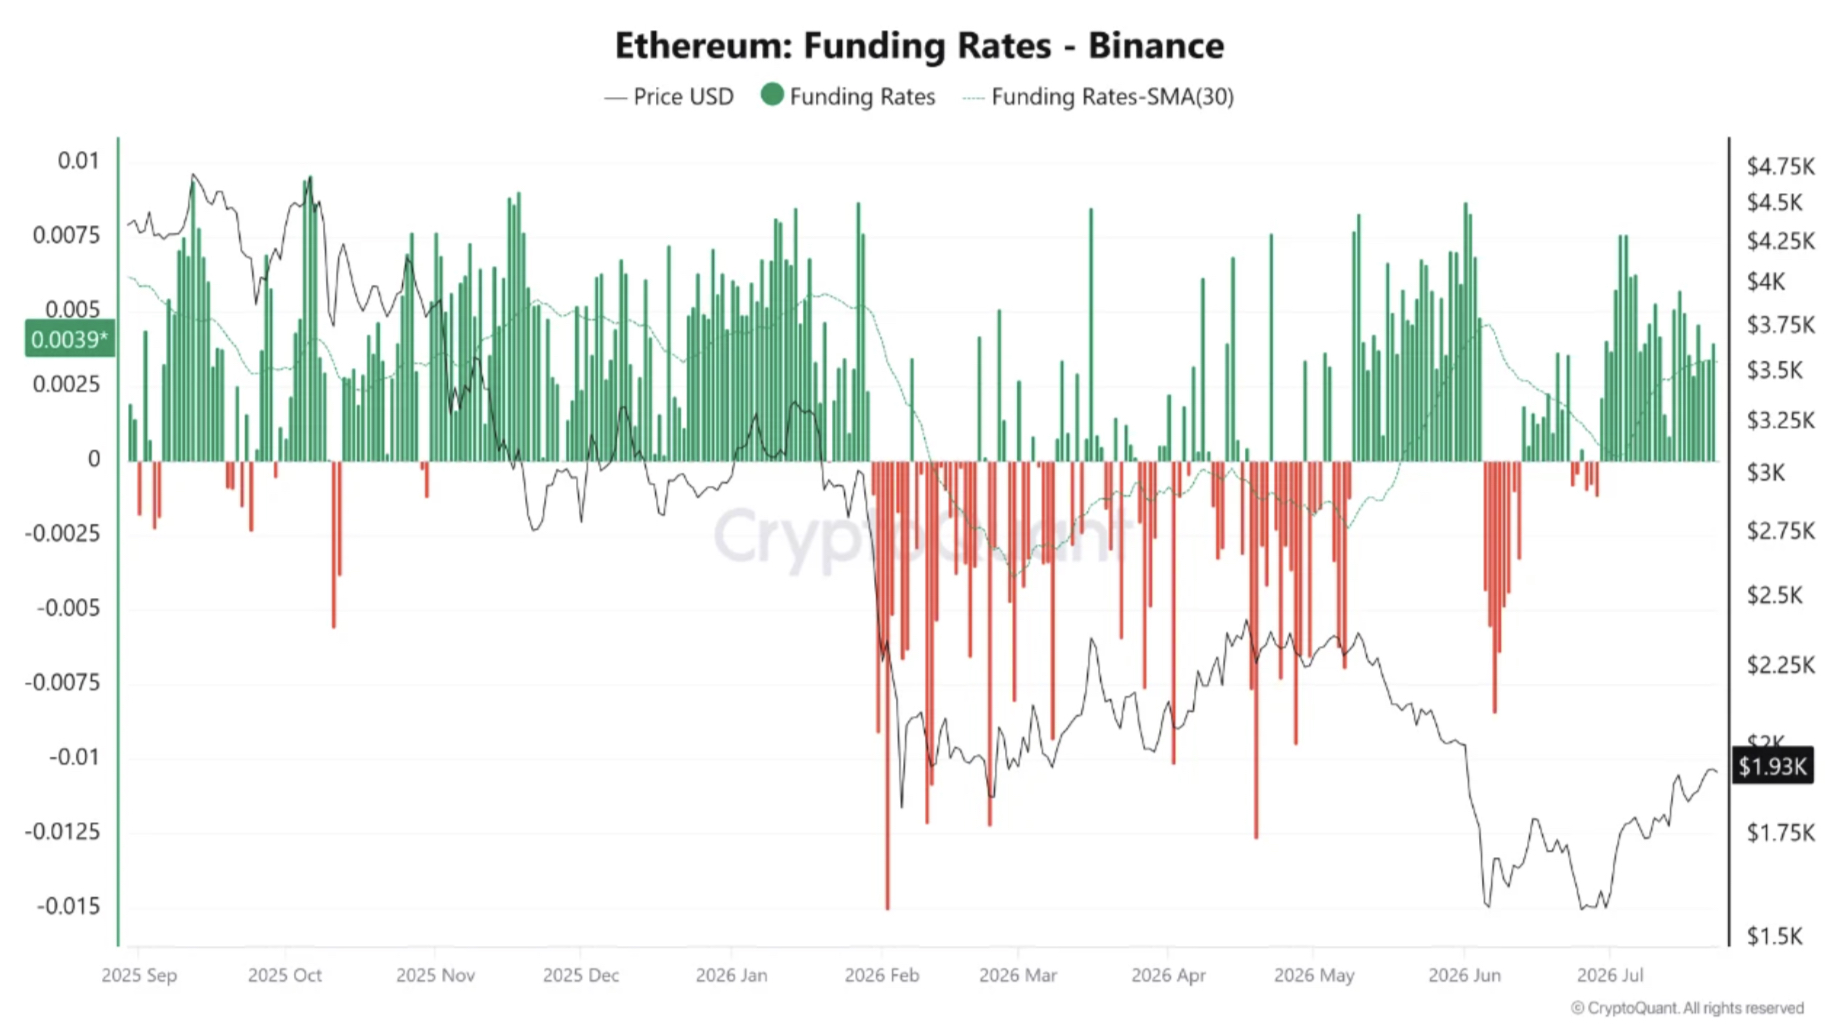
Ethereum price is approaching a key technical inflection point, trading at $1,880 after slipping about 0.3%, intensifying its bearish prediction. Despite the softer price action, derivatives data show one of the strongest funding signals in months. The steady move, rather than a sharp rally, makes this setup worth watching.
Whether Ethereum is building a base for a sustained breakout or setting a trap for late longs depends on resistance overhead. The market has yet to deliver a decisive move. For now, traders remain focused on whether buyers can maintain momentum without chasing prices.

The 30-day simple moving average of Ethereum’s perpetual funding rate on Binance has climbed to its highest level in six months. The OI weighted funding rate has also turned positive, meaning long positions are paying shorts again. That shift reflects improving sentiment without reaching extreme levels.
Meanwhile, open interest has eased slightly, suggesting some leveraged positions were cleared while bullish positioning remained intact. Rising funding alongside stable or slightly lower open interest usually points to growing confidence instead of excessive speculation. Upcoming United States inflation data could provide the catalyst that finally pushes Ethereum out of its current range.
Discover: The Best Crypto to Diversify Your Portfolio
Ethereum Price Prediction: Break $2,000 and Target $2,500 This Week?
ETH is currently trading near $1,880, making the original price range outdated. Traders are now watching the $1,860 to $1,930 area as the immediate battleground. The 50-day SMA remains the first major resistance, while the 200-day SMA sits much higher and continues to cap the longer-term trend.
If ETH holds above recent support and breaks through the 50-day SMA with strong volume, momentum could accelerate. That would expose the next resistance zone around $2,000 to $2,100. Positive funding rates could add fuel if short sellers are forced to cover.

The base case remains a consolidation period between $1,860 and $1,930. That would allow the market to absorb recent positioning before making a clearer directional move. Funding remains positive, but it has not reached levels that typically signal excessive speculation.
A sustained break below $1,860 would weaken the current structure and shift attention toward $1,750. If that level fails, ETH could revisit the $1,600 to $1,500 region. Elevated funding without a convincing breakout still leaves the market vulnerable to a long squeeze.
Longer term, the outlook remains constructive if macro conditions improve and Ethereum adoption continues expanding. However, the next several trading sessions should reveal whether buyers can reclaim key moving averages or remain stuck below resistance.
Trade ETH on Bybit and Get a Chance to Win Our $1,000 USDT Airdrop
Bitcoin Hyper Targets Early-Mover Upside as Ethereum Tests Key Levels
ETH at below $2,000 is still trading below both major moving averages. The upside potential is real, but it’s working against overhead resistance at every step. For traders who want Bitcoin-ecosystem exposure at a stage where the asymmetry is structurally different, early-stage infrastructure plays offer a different risk profile entirely. That’s the entry thesis for Bitcoin Hyper ($HYPER).
Bitcoin Hyper is positioning as the first Bitcoin Layer 2 with Solana Virtual Machine (SVM) integration, delivering smart contract execution faster than Solana itself while preserving Bitcoin’s base-layer security.
The project directly targets Bitcoin’s three core bottlenecks: slow throughput, high fees, and absent programmability. As of today, the presale has already raised $32.9 million at a current token price of $0.0136836, with staking available at high APY for early participants.
Hyper also has a Decentralized Canonical Bridge that handles BTC transfers natively, avoiding the trust assumptions that plague most wrapped-BTC implementations. A recent regulatory analysis also covers the CLARITY Act’s implications for Bitcoin L2 infrastructure projects like this one.
For those conducting due diligence, the full breakdown is available via the Bitcoin Hyper presale page.
Discover: The Best Token Presales
The post Ethereum Price Gaining Ground as Its SMA 30D Funding Rate Climbs Highest in Six Months appeared first on Cryptonews.
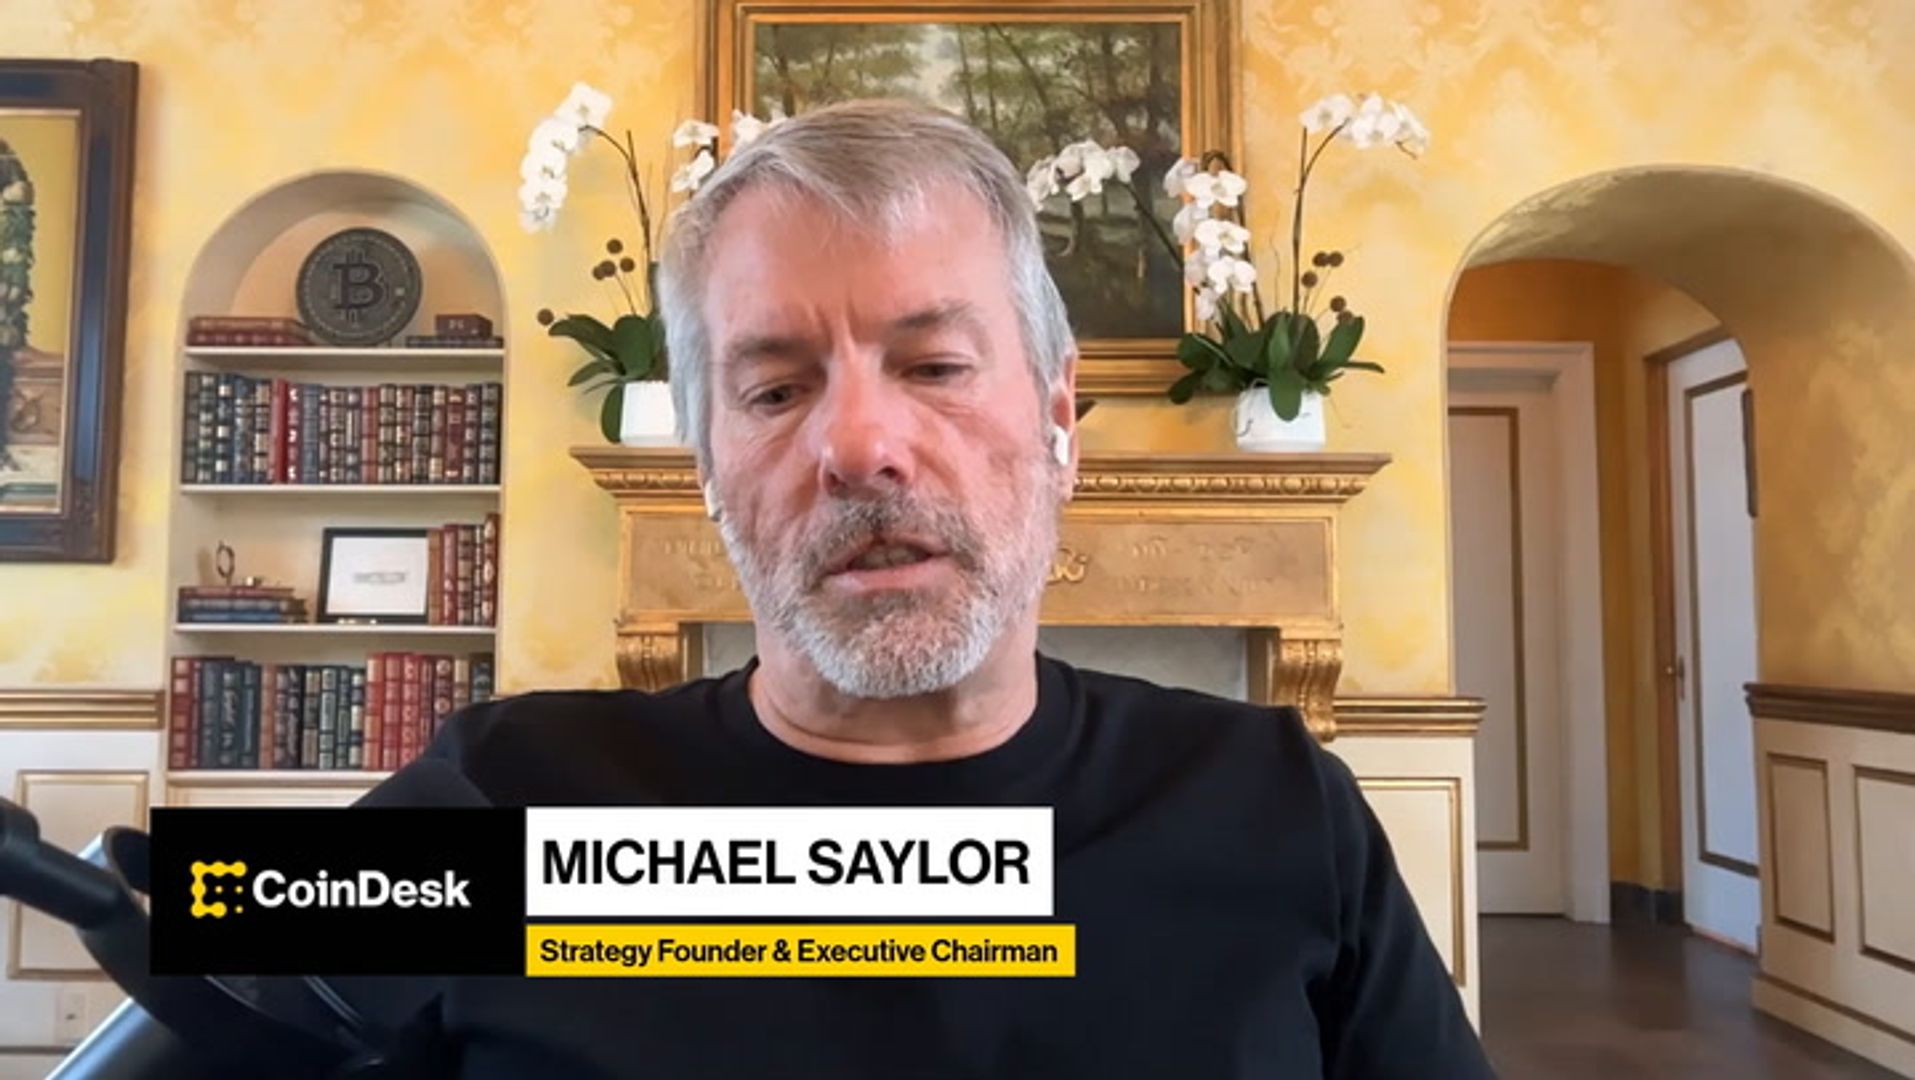
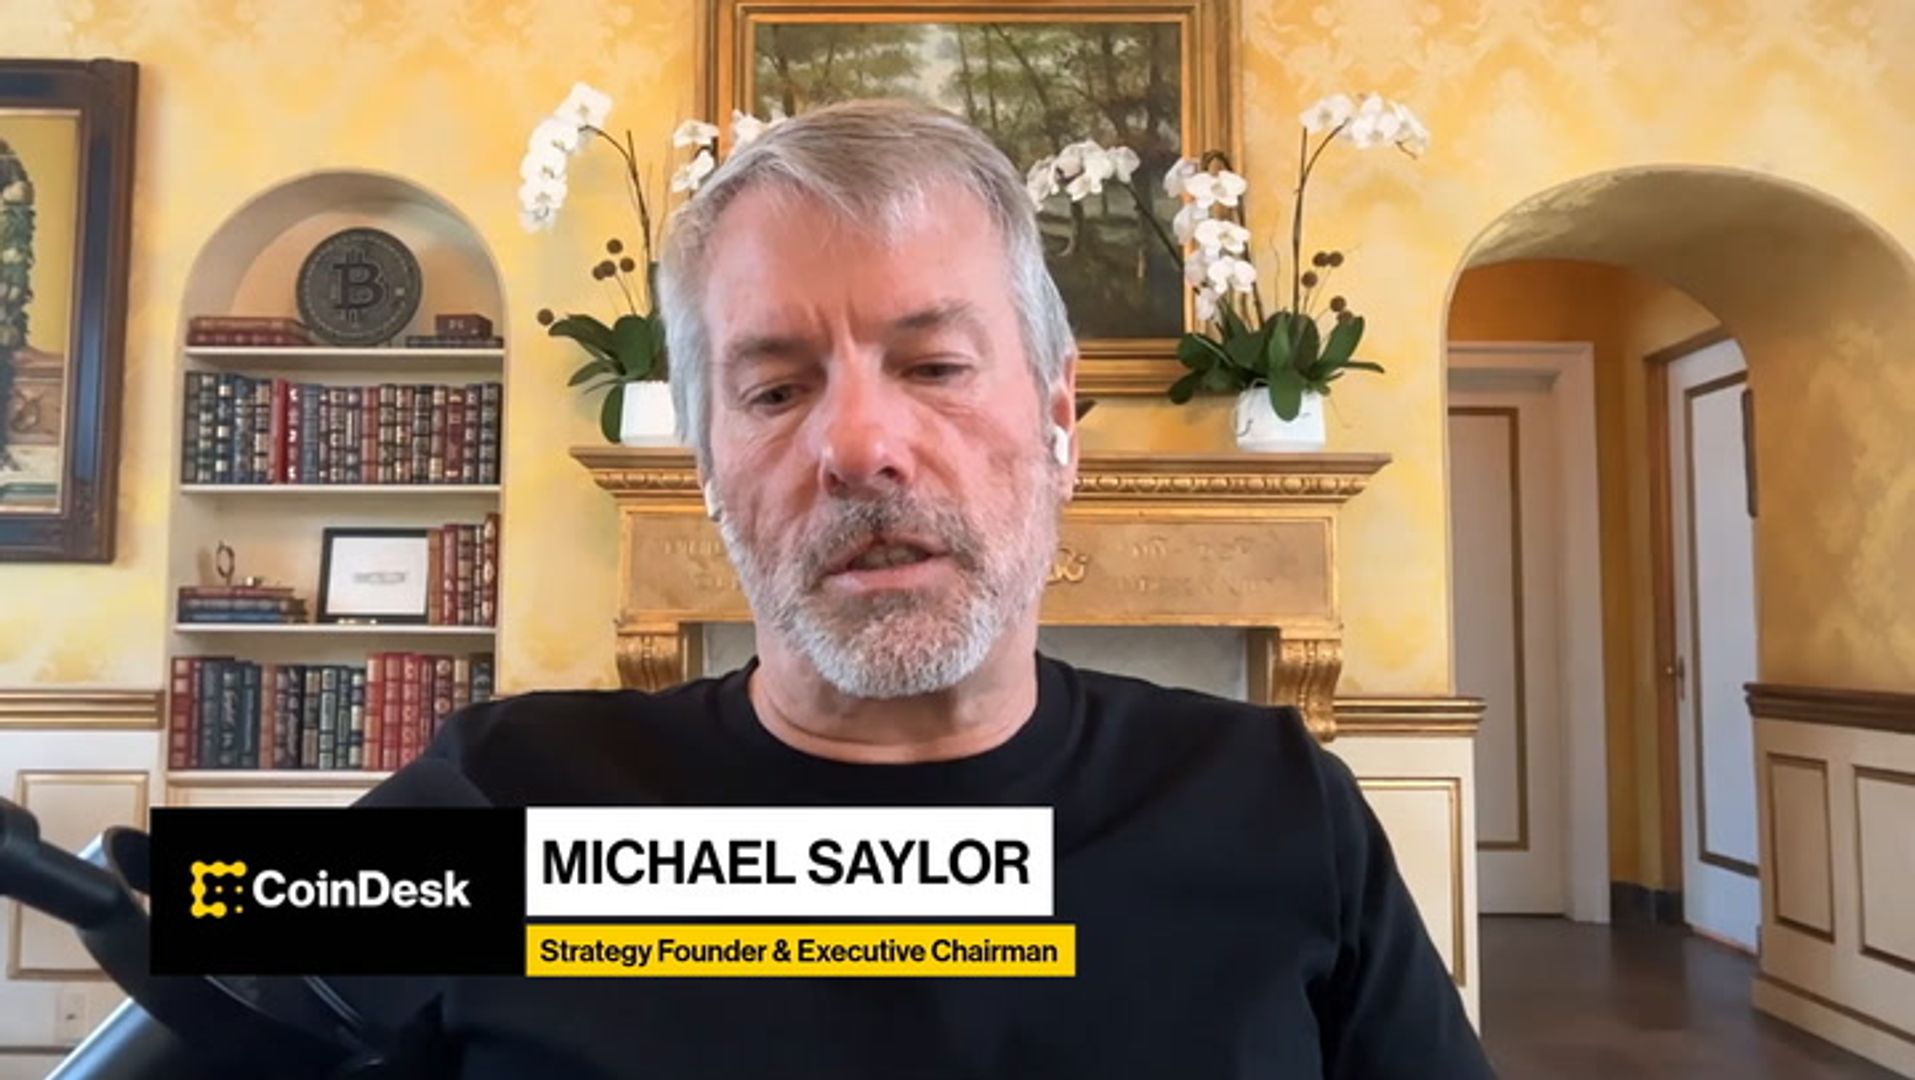
The first metric is the new “Net Reserve”, which currently sits at $36.6 billion. That figure takes Strategy’s $55.6 billion BTC reserve (843,775 BTC), adds $3.2 billion in USD reserves, then subtracts $6.8 billion in out-of-the-money convertible debt and $15.5 billion in notional preferred, the $22.3 billion in senior claims that rank ahead of common shareholders in any liquidation scenario.
The company has also updated its multiple to net asset value (mNAV) formula. Under the old accounting method, the accretion threshold would usually keep the company’s mNAV above 1.0x, making it increasingly difficult to know whether new share issuance was actually beneficial for existing holders. The new formula anchors that threshold permanently at 1.0x — if MSTR trades above it, issuing new shares adds BTC per share for all investors.
According to the company, the formula is: MSTR Price, divided by Net Bitcoin Per Share, representing whether MSTR trades above or below Net Bitcoin Per Share after debt and preferred claims.
The BTC Floor ARR is the minimum sustained BTC growth rate over the credit structure’s duration before restructuring becomes a consideration for the company. Currently, the BTC Breakeven ARR sits at 3.22%, meaning bitcoin only needs to appreciate faster than that rate annually for Strategy to fund all interest and dividend obligations through BTC gains alone, in perpetuity.
Strategy has also introduced new bitcoin market metrics, such as the premium to the 200-week moving average and the Fear and Greed Index.

Bitcoin stayed around $65,000 on Friday after gaining nearly 4% over the past month. New data suggests the market may no longer be facing endless downside risk.
In fact, Bitcoin’s Sharpe ratio has fallen to -23, which, according to crypto analyst Ali Martinez, is a level that could be an optimal window for spot accumulation.
Seller Exhaustion
The Sharpe ratio measures the amount of return generated for each unit of risk or volatility. While a positive reading indicates returns have outweighed risk, a negative one reflects periods of severe drawdowns for investors. Martinez explained the current -23 reading indicates deep seller exhaustion rather than unlimited downside, which creates an “asymmetric” risk-to-reward entry point for long-term BTC investors.
He added that similar Sharpe ratio compressions in 2015, 2019, and 2022 coincided with final bear market capitulation phases.
Martinez had previously identified a rare technical setup on Bitcoin’s monthly chart that has historically appeared near the end of previous bear markets. While on-chain metrics such as MVRV and CVDD still indicate a possible cycle low between $40,000 and $50,000, Martinez said that a setup of three technical indicators – the RSI near 43.65, the CMO around -71, and a test of the 50-month moving average – historically appeared near major market bottoms.
A similar view has also been put forward by Grayscale, which said that BTC’s market bottom may be determined more by macroeconomic conditions than by the traditional four-year cycle.
While the cycle model suggests Bitcoin could bottom around September or October, the asset manager argued that it has matured and is increasingly influenced by broader economic trends, including US Federal Reserve policy and real interest rates. According to Grayscale, if the Fed avoids further rate hikes and economic growth remains resilient, BTC may have already reached its low.
$75K Hurdle
Not everyone, however, is convinced of that. For instance, trader Ardi said he would need to see the asset break above $75,000 before considering the asset’s $57,000 low as the final bottom of the current market cycle.
The trader argued that $75,000 represents the neckline of the previous range’s double-bottom pattern, and reclaiming that level would be the earliest sign that the higher-timeframe downtrend from $126,000 is beginning to lose validity. Even then, Ardi argued that a breakout alone would not be sufficient.
He said BTC would also need to either sustain an extended rally or trade sideways for several months, similar to its February rally, allowing time to strengthen the case that a lasting bottom has formed. At present, Ardi believes the evidence still weighs against that scenario. He went on to add that Bitcoin has not gone through a “genuine” bottoming phase or a late-stage capitulation, but has instead continued “grinding lower.”
He also pointed out that accepting $57,000 as the cycle low would imply the “shallowest” bear-market drawdown on record and a trough arriving roughly three months earlier than in previous cycles, despite the broader market structure remaining bearish.
The post Bitcoin’s Sharpe Ratio Signals an ‘Optimal’ Spot Accumulation Window appeared first on CryptoPotato.


Eight months ago the XRP ETFs launched faster than any product since Ethereum. The bid has since decayed 99%, from $200 million weeks to zero-flow days, leaving $1.49 billion invested, $997 million remaining, and a recovery thesis outsourced entirely to a Senate vote. Here is the full autopsy of a bid, and what its flatline actually prices.
Summary
- US spot XRP ETFs launched in November with $667 million in their first month, reaching $1 billion faster than any crypto product since Ethereum’s funds, on an eight-week inflow streak that ran even while Bitcoin funds bled.
- The bid then decayed by roughly 99%: weekly flows fell from above $200 million to low single-digit millions, the streak ended July 13, and July’s tape shows zero-flow days punctuated by one $7.29 million outflow, the largest since March.
- The wreckage is precise: $1.49 billion in cumulative inflows now marks against roughly $997 million in net assets, an unrealized deficit near $493 million, with 82% of assets concentrated in three funds and several products flatlined entirely.
- The one institutional trophy, Goldman Sachs’s $153.8 million position across four funds, is a December-dated 13F snapshot that Bloomberg analysts read as trading-desk facilitation, inside a complex that remains 84% retail-held.
- The flows have now stabilized at approximately nothing, which the optimistic read calls a floor, and the recovery case has converged on a single external event: the CLARITY Act vote whose odds trade near a coin flip this week.
There is a specific moment in the life of every investment product when its story stops being about demand and starts being about anatomy, and for the US spot XRP ETFs that moment can be dated: Monday, July 13, when the daily flow printed zero and an eight-week inflow streak, the product class’s last living narrative, quietly ended. What launched in November as the fastest-growing crypto fund complex since Ethereum’s, $667 million in month one, a billion dollars faster than anyone forecast, institutional validation in fund form, now trades as a case study. The buyers did not rotate, rebalance, or pause. They stopped: from weeks above $200 million to weeks near $2 million, from streak to zero-days, from launch euphoria to a July whose single best session, $6.78 million, amounts to one percent of the early pace. What remains is $1.49 billion of invested capital marking against $997 million of assets, three funds carrying 82% of everything, and a recovery thesis that no longer references the product at all, only a Senate vote. This piece is the full anatomy: how the bid died, what the wreckage precisely looks like, what the lone institutional trophy in the filings actually shows, and what the flatline, honestly read, prices for the asset underneath it.
The decay curve, dated
The complex’s eight months divide into three phases so distinct they could belong to different products.
Phase one, the launch bid, ran from November into the winter: $667 million in the first month across seven issuers, the fastest accumulation to $1 billion since Ethereum’s funds, weekly prints above $200 million, and the statistic the marketing decks will never retire, an inflow streak that persisted through weeks when Bitcoin ETFs bled, which was read at the time as evidence of a distinct, durable XRP allocator base. The reading had support: the products launched into the afterglow of the SEC’s surrender, the commodity classification, and the first wave of bank-desk research initiating coverage with conditional price targets in the double digits.
Phase two, the decay, occupied the spring: weekly flows stepped down from nine figures to eight to seven, May still collected over $100 million for the month, and by June the run-rate had thinned to low single-digit millions per week, a decline of roughly 99% from peak that no single event explains and one variable tracks perfectly, the token’s price, which fell from above $2.40 in January to the $1.10s, converting every earlier allocation into a loss and every allocator’s quarterly review into an uncomfortable meeting. Fund flows follow performance with a lag in both directions; the launch streak was the up-lag, and the decay was the down-lag arriving on schedule.
Phase three, the flatline, is July: six sessions of exactly zero flows in the month’s first half, a $7.29 million single-day outflow on July 9, the largest since March, the streak’s formal end on July 13, then a stretch from July 10 through July 20 of zeros and small positives, crowned by the month’s best day, $6.78 million on July 16, driven by two issuers’ desks. The freshest coverage frames the stabilization as survival, the product has not seen an outflow day since July 9, and the framing is technically true and proportionally absurd: the bid that defined the launch is not resting, it is absent, and its absence has become stable. That is what the anatomy shows. The interesting questions are in the tissue.
The wreckage, itemized
Four numbers, current as of this week’s data, describe the complex more honestly than any narrative.
$1.49 billion against $997 million. Cumulative net inflows since launch stand near $1.49 billion; total net assets stand near $997 million, roughly 1.45% of XRP’s market capitalization, with about 971 million XRP in custody. The gap, approximately $493 million, is the unrealized loss the allocator base collectively carries, the arithmetic consequence of buying a token averaging well above $1.50 that now trades near $1.10. Every future flow decision the complex’s holders make is made against that deficit, which is the single most important fact in any forecast of the flows resuming: the marginal buyer is being asked to average down into a product whose existing buyers are 33% underwater on invested capital.
82% in three funds. Bitwise holds $312.8 million in assets on $498.3 million of cumulative inflows; Canary $253.2 million on $467.0 million; Franklin $252.2 million on $415.6 million. Together, the top three hold roughly 82% of complex assets, which means the seven-fund complex is functionally a three-fund market with a long tail of products printing zeros. Category-level flow headlines obscure this: an inflow day increasingly means one or two distribution desks had a decent Thursday, and a diversified institutional bid, the launch thesis, would not produce this shape.
84% retail-held. The complex’s ownership base, per the issuer-side analysis that accompanied the spring’s institutional reporting, remains 84% retail, against 48.8% institutional participation in the comparable Solana products, a gap that quantifies how much of the launch narrative, the institutions are here, was distribution, not description. Which frames the trophy correctly.
The Goldman position, read properly. Goldman Sachs’s 13F disclosed $153.8 million across four XRP funds, roughly $40 million in Bitwise, $38.5 million in Franklin, $38 million in Grayscale, $36 million in 21Shares, making it the largest disclosed institutional holder, accounting for 73% of the top 30 institutions’ combined $211 million. The number did real narrative work all spring, and its caveats are the anatomy lesson: it is a December 31 snapshot, disclosed in March, of positions that may not exist today; Bloomberg’s analysts read the four-fund construction as consistent with trading-desk facilitation and client positioning instead of proprietary conviction; and as this publication’s own guide to how to read the Goldman position argues, the form is a rear-view mirror with a 45-day delay, structurally incapable of showing whether the bank held, added, or exited through the subsequent drawdown. The largest institutional XRP position on record is, read strictly, evidence that Goldman’s clients wanted exposure in December. The flows since are evidence of what everyone wanted after.
The geography of the remaining bid
One more layer of the anatomy deserves its own examination, because the aggregate US flow numbers conceal a compositional fact with real information in it: through the American flatline, the marginal bid for exchange-traded XRP exposure migrated abroad.
Through the spring decay, European venues carried a share of global XRP product flows out of proportion to their size, with Swiss and broader European ETP wrappers at times representing the substantial majority of weekly net inflows worldwide while the US complex printed its zeros. The absolute sums are modest, European crypto ETPs are an older, smaller, steadier market, but the composition matters for what it falsifies and what it suggests. It falsifies the strongest form of the exhaustion reading: if the asset’s entire allocator universe were fully purchased, the European bid would have flatlined alongside the American one, and it did not. And it suggests where the marginal buyer actually lives: in jurisdictions where the asset’s legal status was never contested, where MiCA-era frameworks settled classification questions years earlier, and where the products consequently trade as ordinary alternatives allocations, not as bets on a Senate calendar.
Read that way, the geographic split becomes the cleanest natural experiment available on the outsourced thesis. The American flows died in the jurisdiction where the asset’s status remains hostage to legislation; the European flows persisted, modestly, in jurisdictions where it does not. If legal permanence is truly the binding constraint on institutional allocation, the CLARITY experiment has already run abroad, and its result, steady but unspectacular demand, prices the upper bound of what passage realistically unlocks: not the JPMorgan-forecast flood, but a normalization to the European pattern, mid-single-digit millions weekly, compounding quietly, unheroically, forever. That is a real bull case, and it is a fraction of the one being marketed.
The alternative reading restores the American market’s exceptionalism: US wealth-management distribution is an order of magnitude deeper than Europe’s, the RIA channel that turned Bitcoin’s ETFs into a $52 billion complex has no European equivalent, and the launch month’s $667 million showed what that distribution can move when it has a story to sell. On this reading, Europe measures the floor of post-CLARITY demand and America’s launch month measured the ceiling, and the truth, as usual, books a room between them. Either way, the geographic ledger deserves a place in every flow analysis this complex receives, because it is the one dataset showing what XRP demand looks like when Washington is not the variable, and it has been quietly reporting that answer, in Swiss francs, all year.
The regulated-channel counterpoint
One dataset complicates the pure decay story, and honesty requires it: while the spot complex flatlined, the regulated derivatives channel set records.
CME’s XRP futures built to a peak of $1.4 billion in open interest with 29 large open-interest holders, a record for the venue, even as total XRP derivatives open interest across all venues collapsed from its $10 billion peak by margins reported between 75% and 96%, a deleveraging that wiped out the offshore, retail-levered complex. The split matters because the two channels answer different questions: aggregate open interest tracks speculative leverage, which is gone, while CME positioning tracks the institutions that clear through Chicago, which grew through the wreckage. The honest synthesis is narrower than either headline: the levered retail market deflated, a smaller regulated market matured, and neither flow bought spot tokens, which is why the ETF shelf and the price both starved while the derivatives venue celebrated. Institutional infrastructure and institutional demand are different things, a distinction this asset’s whole history keeps teaching. For the underlying distribution picture, crypto.news has also mapped the supply map under the products.
What the flatline prices
Strip the anatomy to its meaning and three readings compete, with the tape currently endorsing the bleakest.
The floor reading, the optimists’ case, holds that the shakeout is complete: outflows never cascaded, the post-July 9 tape shows zero net redemption, the deficit is carried rather than capitulated, and a stabilized base at $1 billion of assets is the platform a catalyst builds on. Its evidence is real, the complex genuinely did not unwind the way GBTC-era products did, and its weakness is that a floor with no bid above it is just a ledge.
The exhaustion reading holds that the launch consumed the entire natural buyer base: the crypto-native allocators, the RIA early adopters, and the bank desks servicing client curiosity all bought in the first two quarters, at prices 40% above the current market, and no second cohort exists at any price the first cohort’s losses will allow advisers to recommend. On this reading the flatline is not a floor but a completed distribution, and the zero-days are what a fully-sold product looks like.
And the outsourced reading, the one the complex’s own defenders now lead with, holds that the flows return when Washington acts: legal permanence unlocks the institutional allocation the launch never actually contained, the 84% retail share inverts, and the JPMorgan-style first-year forecasts the complex undershot get a second life under a market-structure law. This is the reading that matters, because it is the one being priced, and its honest form is uncomfortable: it concedes the product failed to generate durable demand on its own and converts the entire recovery case into a claim about one bill, whose cloture count stands unresolved this very week, whose passage odds trade near a coin flip, and whose own conditional structure, as this publication’s analysis of the conditional targets riding these flows showed, was already the load-bearing wall under every double-digit XRP forecast. The ETF complex, the price targets, and now the flow-recovery thesis have all converged on the same single point of failure. That is not diversification of catalysts. It is concentration, in a legislature, measured at 41% on Polymarket, and the flatline is what an asset looks like while it waits on it.
What to watch
The weekly prints against the zero line. The complex has proven it can avoid outflows; the open question is whether anything above $10 million a week ever returns without a legislative trigger. Sustained mid-eight-figure weeks would falsify the exhaustion reading on their own.
The concentration ratio. Watch whether the three-fund share of assets rises above 82%, consolidation continuing, or whether the tail products show life, the only clean signal of a broadening buyer base instead of two sales desks working.
The CLARITY binary, and the day after. Passage would run the outsourced thesis’s experiment in real time: the flows either arrive within weeks, validating everything, or they do not, which would be the most damaging data point in the asset’s institutional history, because it would exhaust the last explanation. Failure of the bill runs the mirror experiment on the deficit’s holders. That is the event the recovery thesis waits on.
The Q1 13F cycle’s ghosts. The May filings covering the drawdown quarter will show whether Goldman and the top-30 cohort held through the decline. A largely intact institutional roster supports the floor reading; a vanished one completes the anatomy.
Eight months ago the XRP ETFs were the proof that institutional demand existed. The anatomy shows what they actually proved: that distribution existed, that a launch window monetized it, and that demand, the durable kind that buys drawdowns, was never located. The complex now holds $997 million, a $493 million scar, and one hypothesis left to test, scheduled for a Senate floor that has not yet set the time. Products usually die of redemption. This one’s fate is stranger: fully built, fully priced, and waiting, with the rest of its asset class, for Washington to tell it whether the buyers were ever real. For context, crypto.news has explained he flow machinery itself.
Frequently asked questions
What happened to the XRP ETF inflows?
They decayed roughly 99% from launch. The products drew $667 million in their first month from November and sustained an eight-week inflow streak, but weekly flows fell from above $200 million to low single-digit millions by summer. The streak ended July 13, July logged six zero-flow sessions and a $7.29 million outflow day, and the month’s best session brought just $6.78 million.
How much money is in the funds now, and what is the loss?
Cumulative net inflows stand near $1.49 billion, while total net assets are roughly $997 million, about 1.45% of XRP’s market capitalization, with approximately 971 million XRP in custody. The gap of roughly $493 million represents unrealized losses on invested capital, reflecting purchases made at substantially higher token prices than the current $1.10 area.
Which funds dominate the complex?
Three of seven: Bitwise with $312.8 million in assets, Canary with $253.2 million, and Franklin with $252.2 million, together roughly 82% of all complex assets. The remaining products frequently print zero daily flows, meaning category-level inflow headlines usually reflect activity at one or two distribution desks, not broad-based demand.
Does Goldman Sachs’s position change the picture?
Less than headlines suggested. Goldman’s $153.8 million across four funds, disclosed in its Q4 2025 13F, made it the largest institutional holder, about 73% of the top 30 institutions’ combined exposure. But the filing is a December 31 snapshot published in March, Bloomberg analysts read the construction as trading-desk facilitation rather than directional conviction, and the complex overall remains 84% retail-held.
How does the CME futures record fit the story?
As a counterpoint about a different market. CME’s XRP futures reached a record $1.4 billion in open interest with 29 large holders even as total XRP derivatives open interest collapsed as much as 96% from its $10 billion peak. The regulated channel matured while offshore leverage deflated, but neither development bought spot tokens, which is why the ETF flows and the price starved simultaneously.
Is the recent stabilization a positive signal?
It is the debated question. Since the July 9 outflow, daily flows have been zero or slightly positive, no redemption cascade has occurred, and the deficit is being carried rather than capitulated, the floor reading. The skeptical reading calls the same tape exhaustion: the natural buyer base fully purchased during launch and no second cohort exists at current prices. The flatline is consistent with both until something moves.
Why does everything now depend on the CLARITY Act?
Because every other catalyst has been consumed. The SEC resolution, the launches, and the bank coverage all occurred, and the flows died anyway, leaving legal permanence as the last untested explanation for why institutional allocation has not arrived. The recovery thesis for the flows, the analyst price targets, and the asset’s broader institutional case have converged on the same legislative binary, currently priced near a coin flip.
What should investors watch next?
Weekly flows against the zero line, with sustained mid-eight-figure weeks as the falsifier of the exhaustion reading; the three-fund concentration ratio, for any sign of a broadening base; the Q1 13F filings covering the drawdown quarter, to see whether the institutional roster held; and the CLARITY vote itself, whose aftermath in either direction runs the decisive experiment on whether the buyers return. This is not investment advice.
Disclaimer: This article is for information and educational purposes only and does not constitute financial or investment advice. Flow figures and asset values change daily and reflect data available at the time of writing. Nothing here is a recommendation to buy, sell, or hold any asset or fund. Always do your own research. Information is accurate as of July 24, 2026.
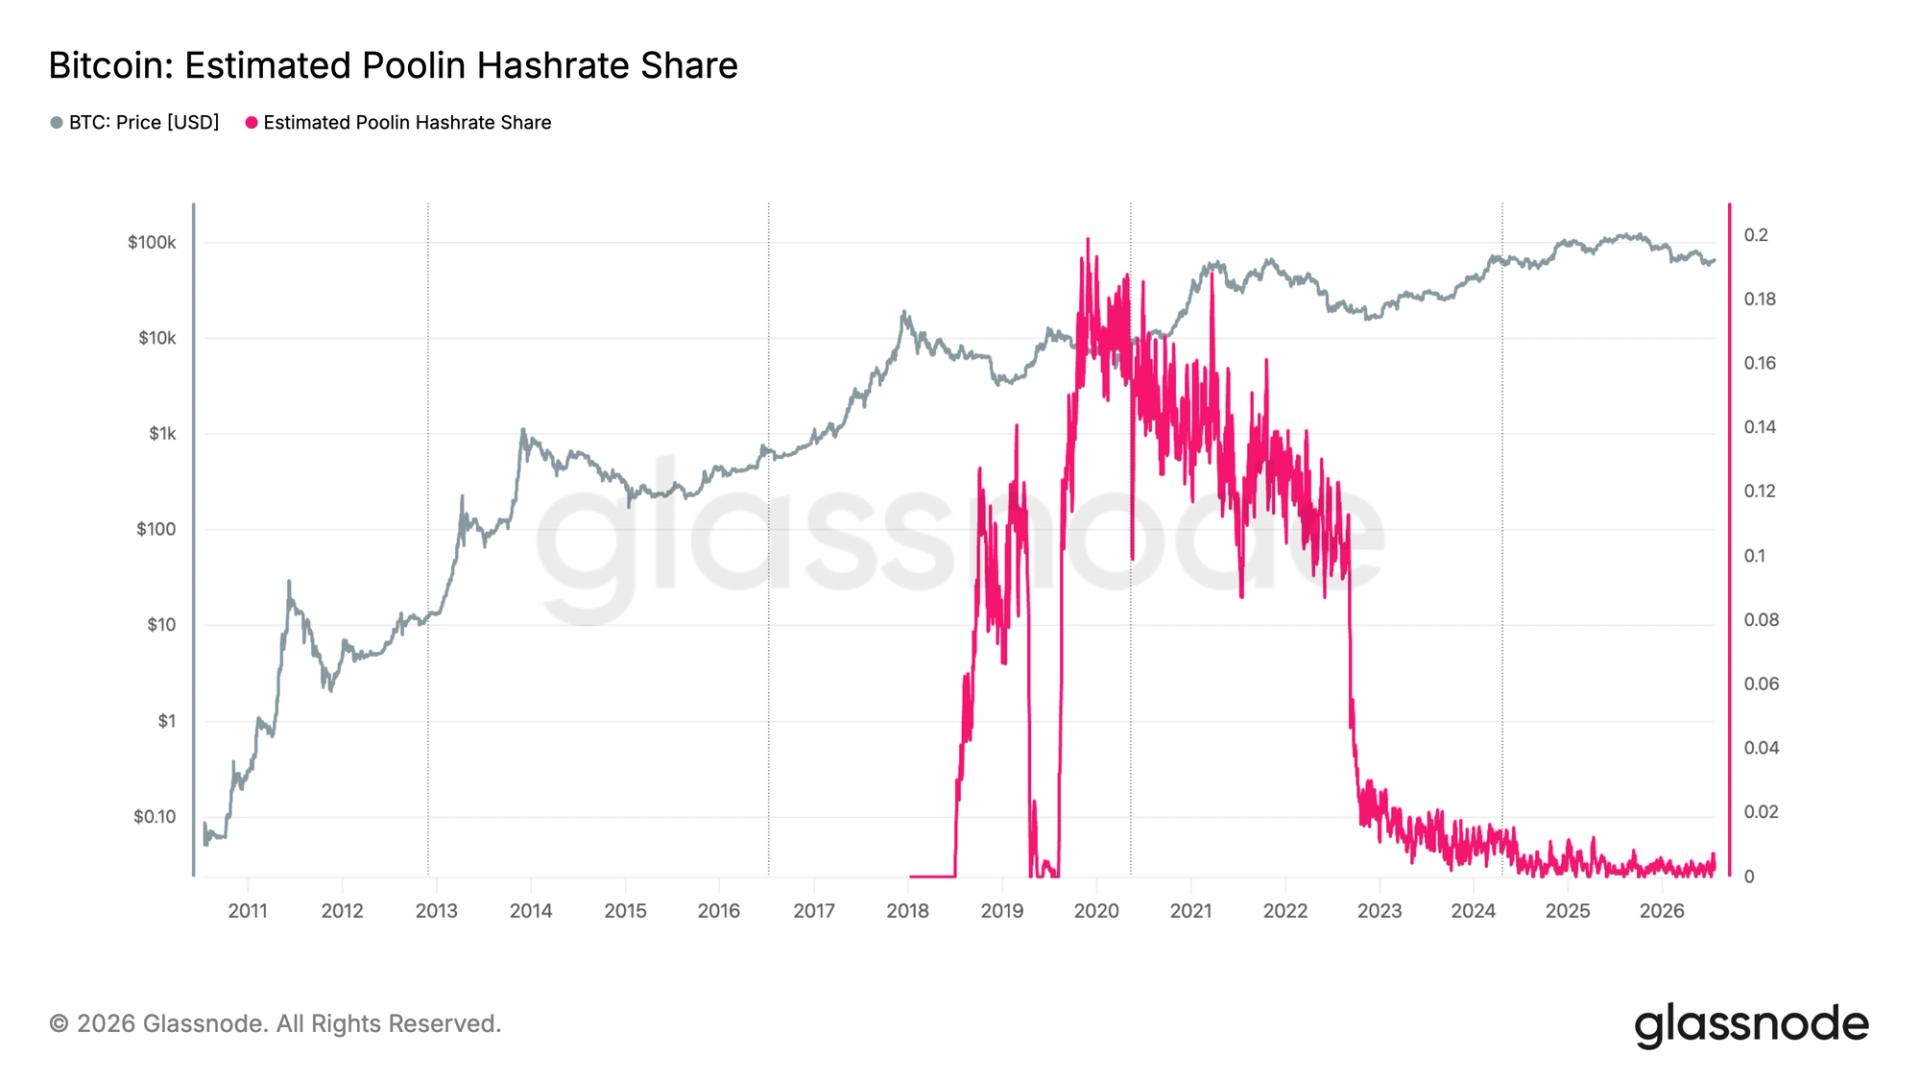
Bitcoin mining company Poolin has filed for bankruptcy alongside its two U.S. affiliates Lonestar Dream and Lonestar Taproot with estimated liabilities between $100 million-$500 million, TheEnergyMag reported on Friday.
The Singapore-based firm, which once dominated the industry, filed for Chapter 11 protection in New Jersey on July 22 with debts of around $173 million,
A $52 million bid for two mining sites in West Texas is currently on the table from Thor CALAP LLC. The sites represent the better part of the company’s assets.
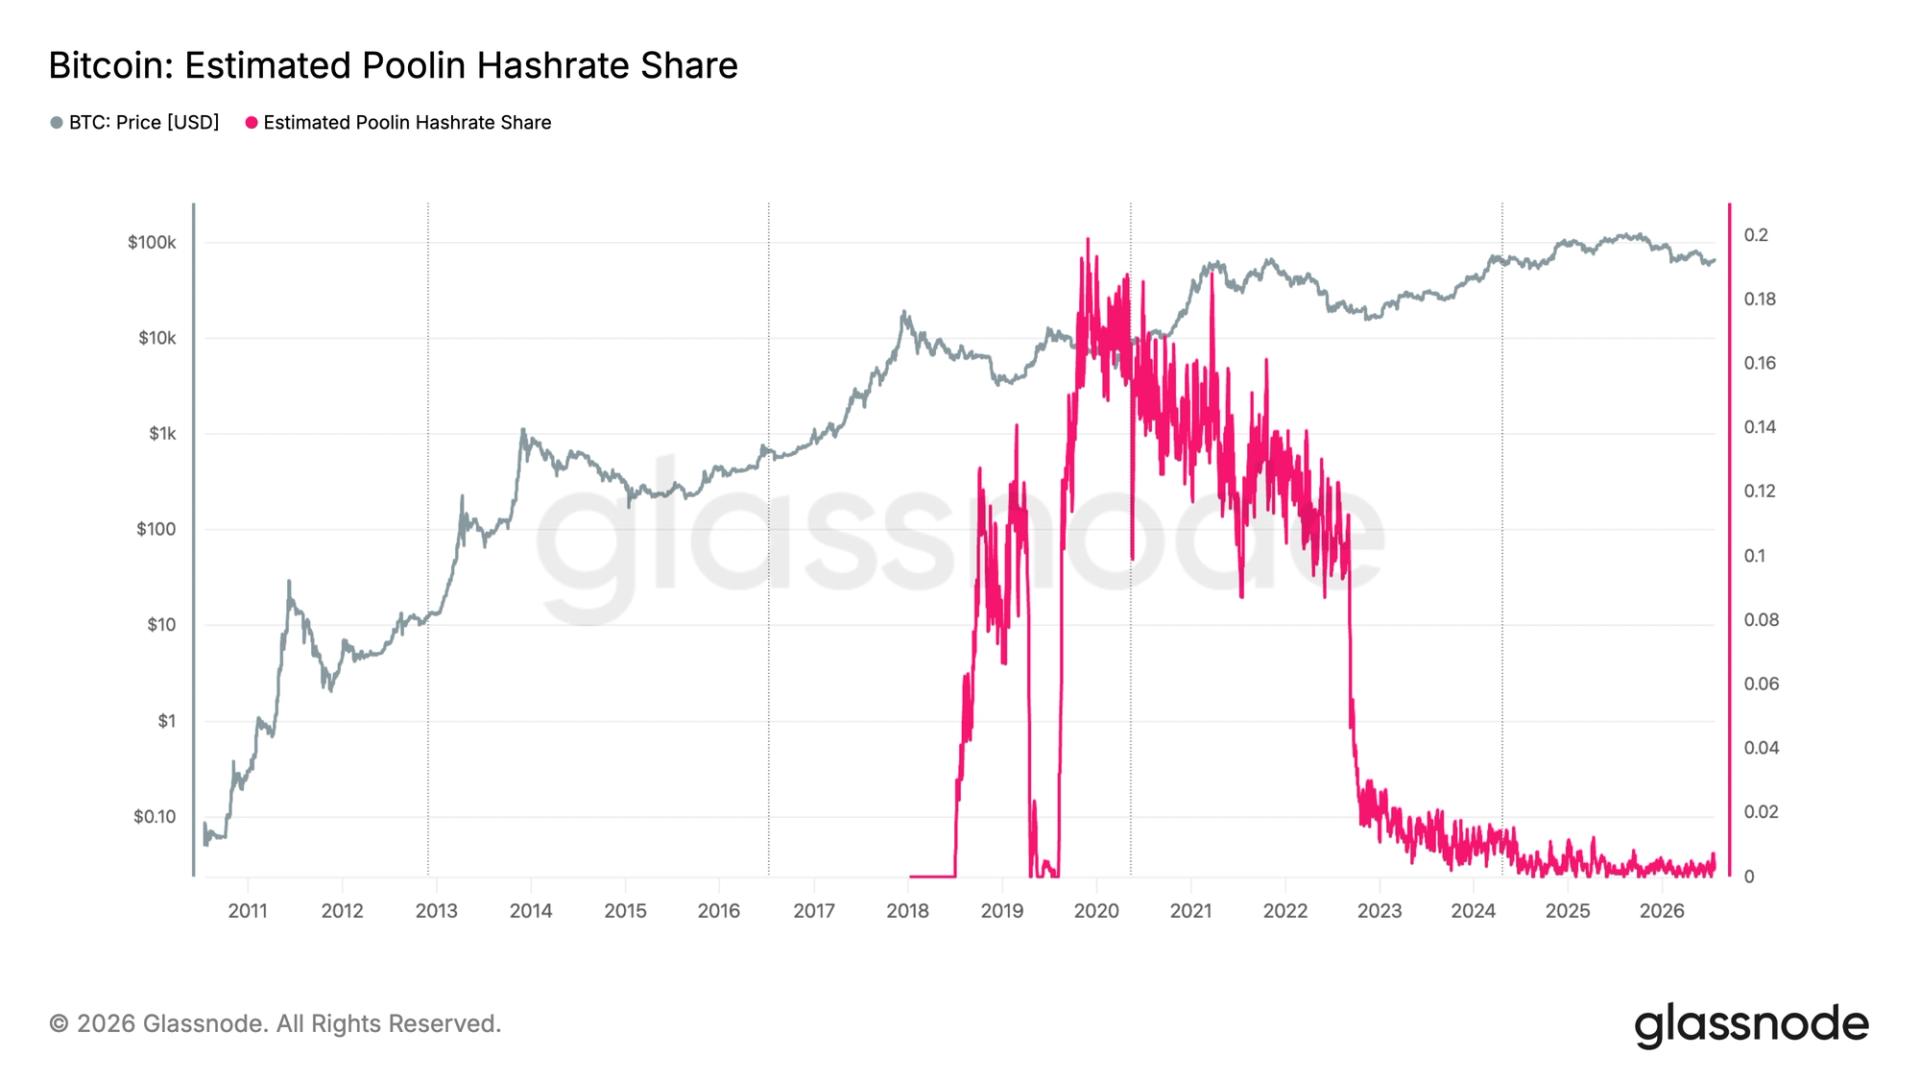
Poolin was one of the biggest mining pools in bitcoin at its peak meaning more bitcoin was being mined through Poolin than through any other single pool on earth. Glassnode data shows its share of global hashrate reached roughly 18-20% in 2019.
Users were already complaining about withdrawal delays on Poolin’s Telegram channels in late 2022, a period plagued by crypto companies facing liquidity squeezes as that year’s market downturn came to a head. Co-founder Kevin Pan acknowledged in a WeChat post that the company was “facing liquidity problems” while insisting user funds were safe.

Slopsquatting, Phantom Domains, and HalluSquatting Are the Same AI Attack

Apple Stock: Q3 Is About Cameras, Not AI – Here’s Why That’s A Good Thing (NASDAQ:AAPL)

Can bulls defend $500 support as Zcash faces Ironwood upgrade?


-

 Fashion7 days ago
Weekend Open Thread – Corporette.com
-

 Politics6 days ago
The House | The City of London can help the new chancellor deliver growth in every postcode
-
 Crypto World6 days ago
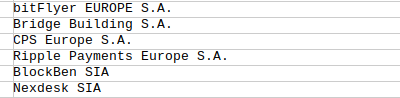
Ripple Payments Joins MiCA With 14 Firms, Does It Mean Anything For XRP?
-

 Politics5 days ago
Democrats look to World Cup watch parties to register thousands of voters
-

 Crypto World7 days ago
Ripple wins EU-wide access as ESMA adds it to MiCA register
-

 Crypto World3 days ago
Grayscale Files For Worldcoin ETF, WLD Registers Sharp Rise
-
 Tech4 days ago
Sail Virtually Aboard The “Itanic” With IA-64 Emulator
-

 NewsBeat4 days ago
Unregistered fitter used Gas Safe logo on business flyers
-
 Tech3 days ago
Turtle Beach Command Series KB7 review: a nifty screen-equipped gaming keyboard
-

 News Videos5 days ago
Big Money Is Entering XRP
-
 Business2 days ago
New Jersey voter registration controversy explained: How 6,600 noncitizens got on the rolls, and what happens next
-

 Crypto World6 days ago
Kaspersky exposes OkoBot’s 20-module crypto wallet attack
-

 Business7 days ago
Airlines warn Sunshine Protection Act could disrupt flight scheduling
-
 Entertainment3 days ago
Johnny Depp’s R-Rated Gothic Cult Classic Gets New Release Ahead of Sydney Sweeney Remake
-

 NewsBeat6 days ago
Durham County Council to send out electoral registration emails
-

 Crypto World6 days ago
MiCA Licensing Faces Delays as ESMA Adds 14 CASPs to Register
-

 Crypto World2 days ago
Ethics, other provisions in crypto Clarity Act to be further discussed
-
 NewsBeat3 days ago
Shanghai science forum photos show China’s AI and robotics advances in rivalry with US
-

 Crypto World6 days ago
Chip Stocks Enter Bear Market After Moonshot Ai Unveils Kimi K3 Model
-

 Tech4 days ago
Watch Flock Safety CEO Garrett Langley discuss the future of surveillance at TechCrunch Disrupt 2026
You must be logged in to post a comment Login