

Crypto World
Sam Altman ChatGPT AI Predicts Shock XRP Price By End of 2026

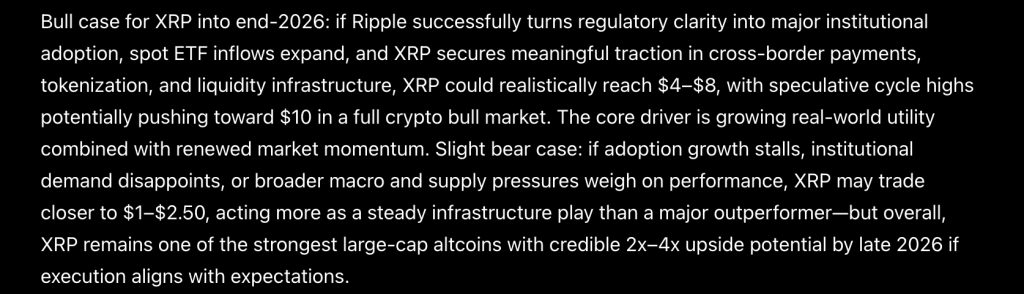
XRP holders have been staring at the same $1.20 to $1.60 range and price prediction for months, Sam Altman’s ChatGPT AI quietly ran the numbers and landed on a predicts that makes that range look like a launchpad.
$4 to $8 by end-2026, with a speculative cycle high potentially pushing toward $10.
ChatGPT’s framework is built around a single core thesis: real-world utility finally meeting institutional capital at the same moment.
Regulatory clarity is no longer a future event; it is the present reality, and the AI argues that the market has not yet fully repriced what that means.
Spot ETF inflows are expanding the institutional demand channel in real time. XRP is securing meaningful traction in cross-border payments, tokenization infrastructure, and liquidity corridors simultaneously, which means the utility argument is no longer concentrated in 1 use case that can be disrupted.
The combination of all 3 moving together is what ChatGPT calls the core driver, and it frames the 2x to 4x upside as credible rather than speculative, given where Ripple’s enterprise pipeline sits today.
The bear case is honest and specific. If adoption growth stalls, institutional demand disappoints, or macro and supply pressures weigh on performance, ChatGPT sees XRP trading closer to $1 to $2.50, acting more as a steady infrastructure play than a major outperformer.
That is not a collapse scenario; it is a slow bleed scenario, which, for long-term holders, is arguably the more frustrating outcome.
The AI is clear that XRP remains one of the strongest large-cap altcoins in the market, but execution has to align with expectations for the upper targets to materialize.
XRP Price Prediction: Just Needs to Clear $1.60 and the Sequence of ChatGPT AI Predicts Begins
XRP price is trading at $1.3825 on the daily, and the chart has laid out exactly what the bull case looks like at each step.
4 levels are marked in sequence: support at $1.20, resistance at $1.60, then targets at $2.40, $3.10, and $3.64. Each one is a gate. None of them opens until the previous one closes behind it.
The immediate problem is that price has pulled back from the recent $1.50 push and is now sitting at $1.38, closer to support than resistance.
That gives the setup a different feel than it had 2 weeks ago. The $1.20 support zone marked in red is not far below current price, and with RSI cooling off, the next few daily closes matter more than usual.
Resistance remains $1.60, the level that has defined the ceiling of this entire recovery phase since February. Nothing above it is relevant until it breaks.
Above $1.60 the path the chart projects is a move to $2.40, consolidation, then continuation toward $3.10 and $3.64, which sits right inside ChatGPT’s $4 to $8 range as the first meaningful milestone.
ChatGPT’s $4 to $8 call needs the chart to hold $1.20 first. Right now, that floor is closer than the ceiling.
Discover: The best crypto to diversify your portfolio with
ChatGPT Says That Bitcoin Hyper Could Outperform XRP Next
Large-cap upside is getting harder to find. Bitcoin recovering to previous highs from here is a single-digit percentage move. That math pushes risk-tolerant capital toward earlier positioning.
Bitcoin Hyper is built for exactly that rotation. The project is building a Bitcoin Layer 2 using the Solana Virtual Machine, enabling developers to access smart contract functionality and near-zero fees without leaving Bitcoin’s security model behind. The gap it is targeting is real and has been sitting open for years. No other major blockchain has solved native high-speed programmability on top of Bitcoin.
The presale is at $0.013679 with over $32 million raised and staking incentives available for early participants.
The risk profile deserves honesty. Execution is unproven. Post-launch liquidity is unknown. Adoption does not follow automatically from good infrastructure. Every early-stage play comes with those question marks and this one is no different.
What is different is the entry point. The upside that institutional capital cannot access at Bitcoin’s current market cap is still fully available here. That is the tradeoff. Higher potential, higher risk, and a window that closes once the market catches up.
The post Sam Altman ChatGPT AI Predicts Shock XRP Price By End of 2026 appeared first on Cryptonews.


An active exploit on the Verus-Ethereum Bridge has resulted in $11.58 million in losses, according to security firm Blockaid.

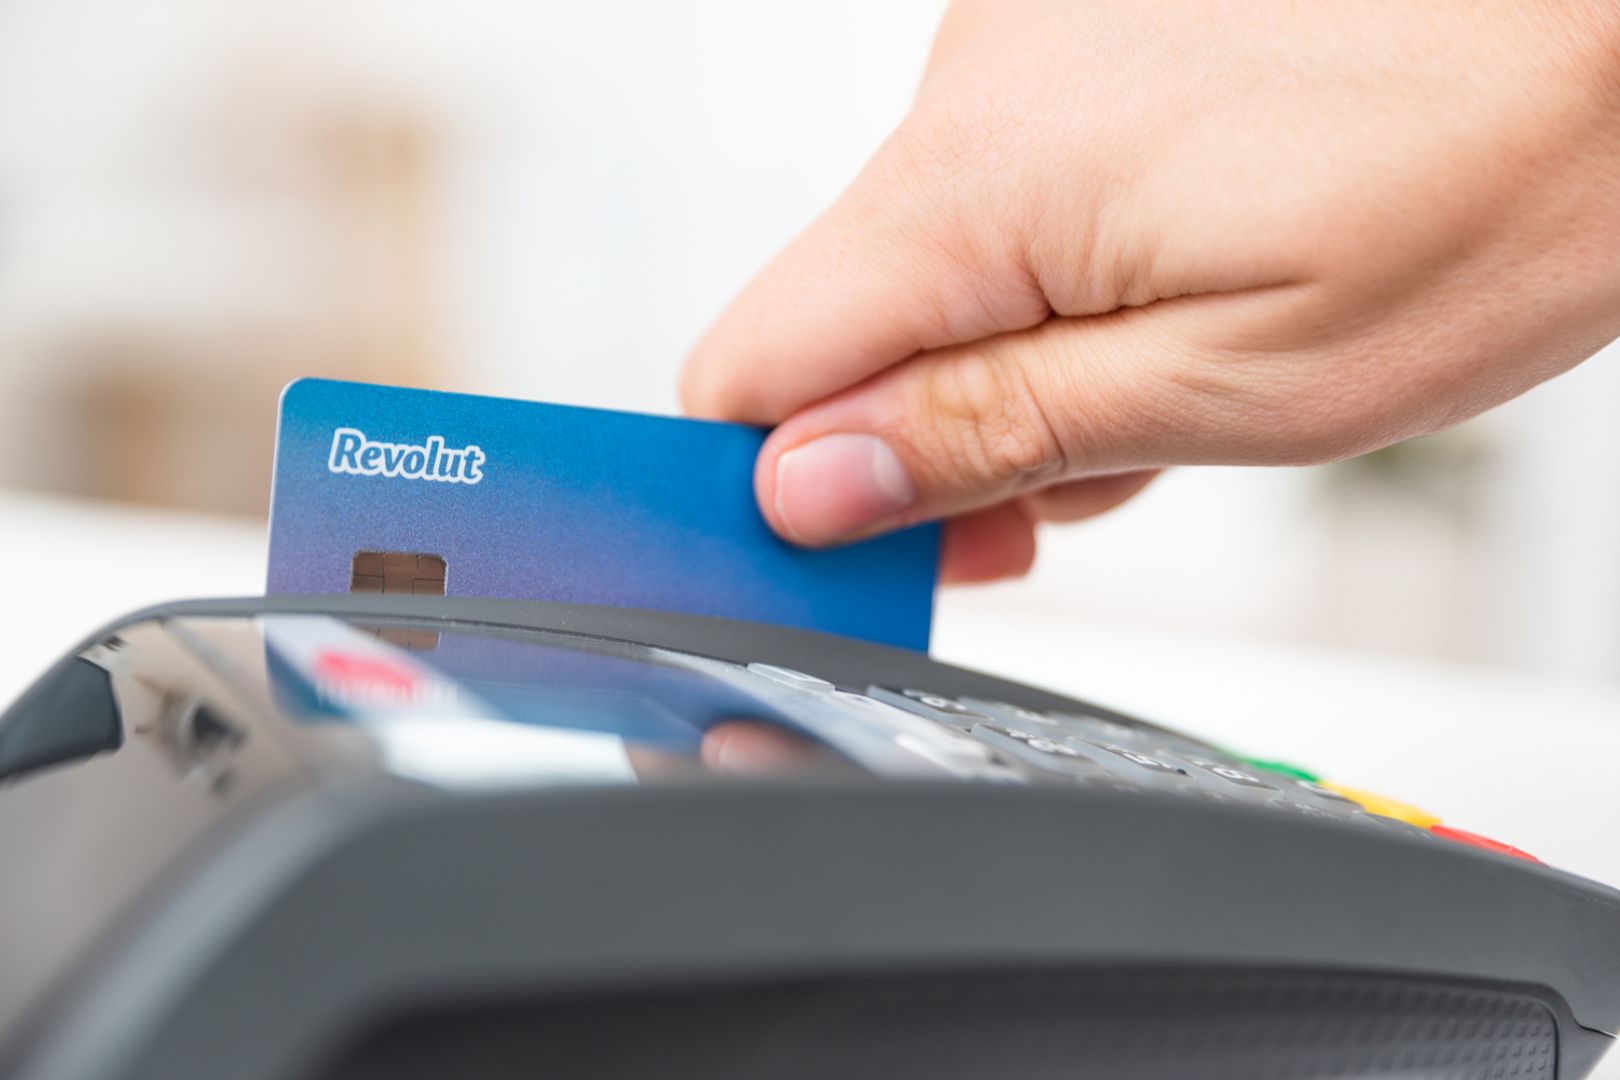
The European fintech giant is launching a physical debit card that lets users spend the popular meme coin anywhere Visa and Mastercard are accepted with zero extra exchange fees.

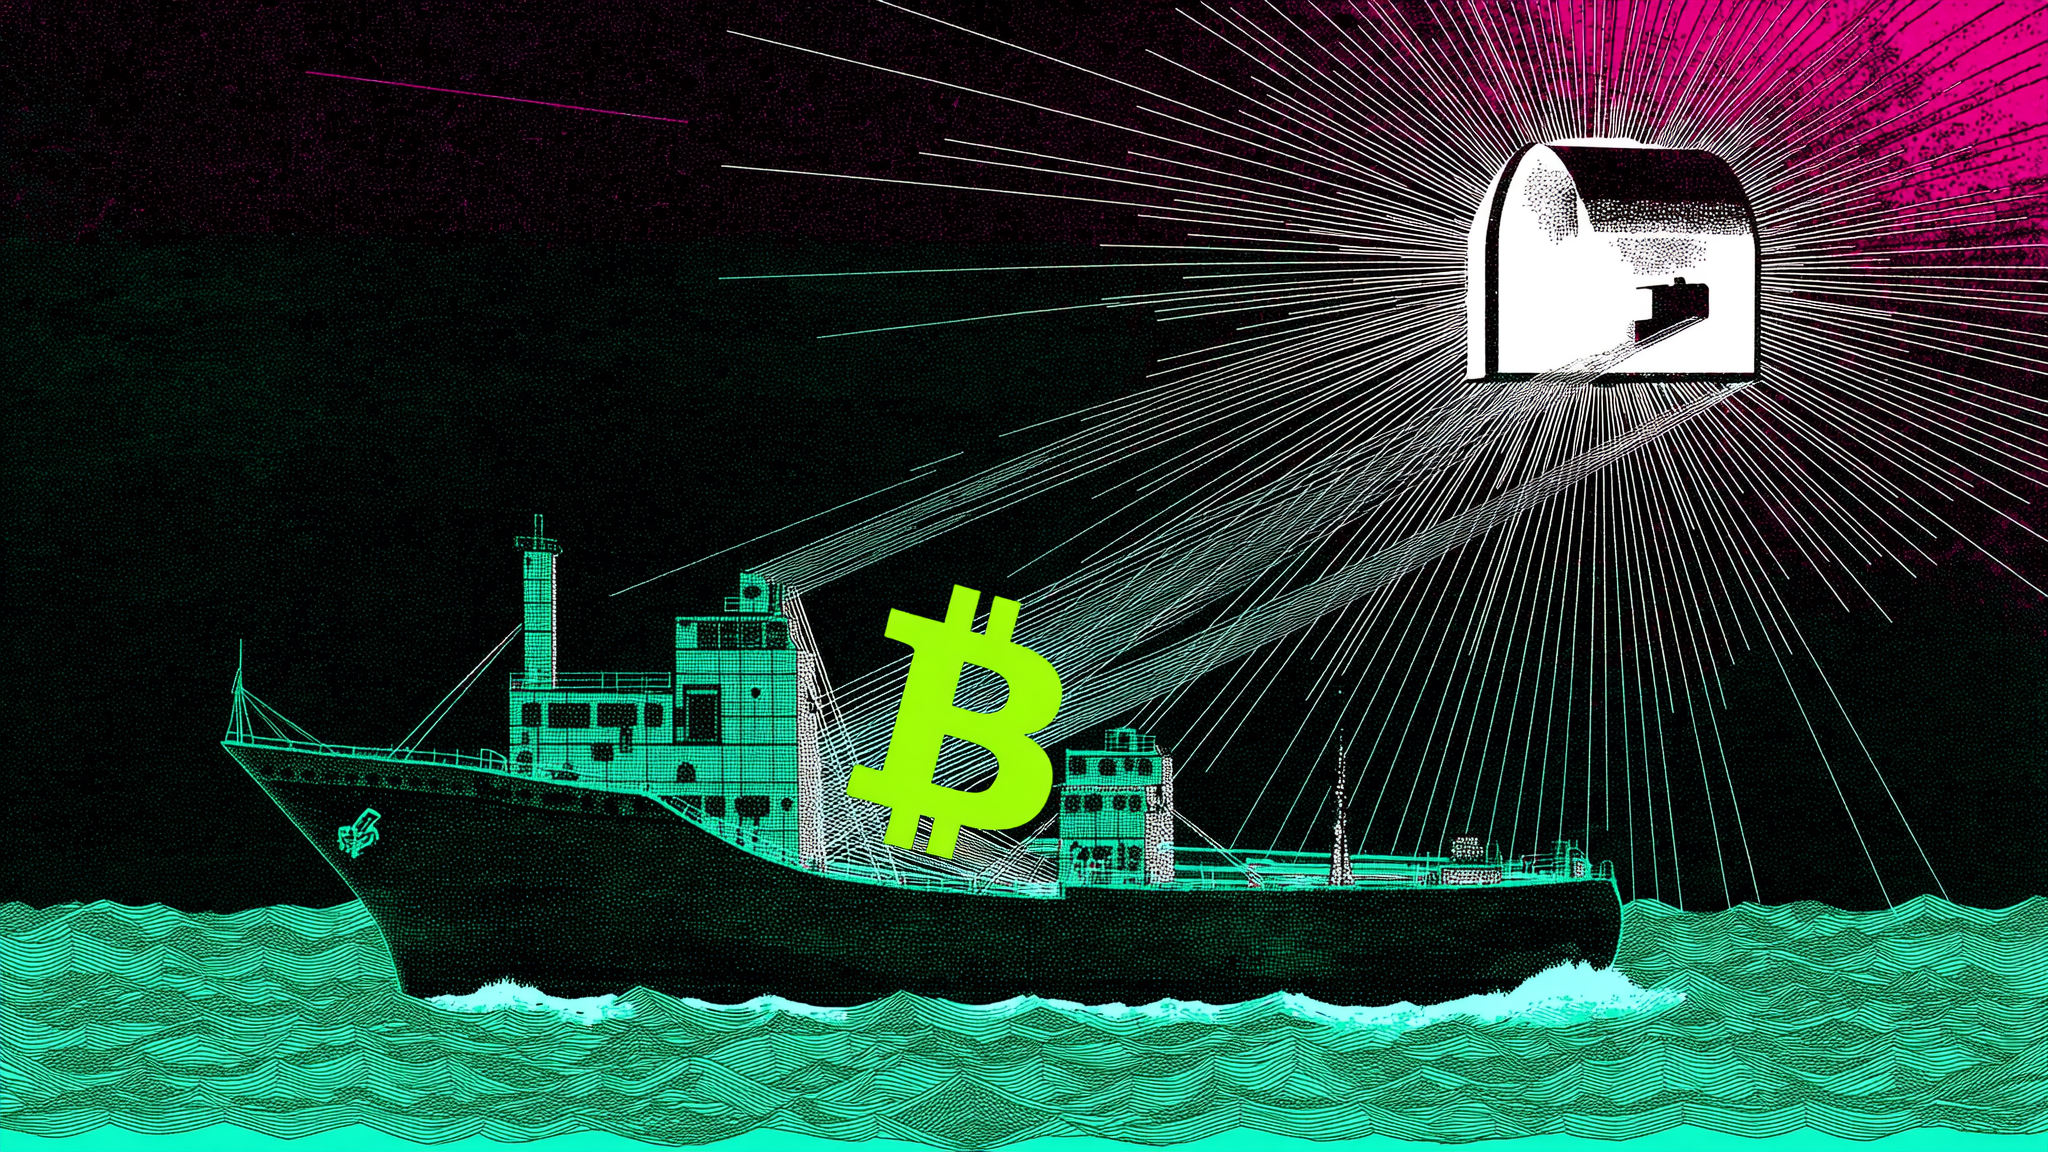
Iran has unveiled Hormuz Safe, a Bitcoin-backed insurance service enabling shipping companies to obtain coverage for transiting the Strait of Hormuz.
A U.S. jury handed Elon Musk a decisive loss on May 18, 2026, ruling he waited too long to sue OpenAI and CEO Sam Altman.
The verdict means Musk’s high-stakes claims of mission betrayal are over, clearing OpenAI’s path to commercial dominance.
OpenAI Wins: Musk’s AI Suit Crushed by Time Limit
The advisory jury in U.S. District Court for the Northern District of California found Musk’s breach of charitable trust and unjust enrichment claims time-barred.
Follow us on X to get the latest news as it happens
Musk co-founded OpenAI in 2015 as a nonprofit, donated tens of millions, and left the board in 2018.
He sued in 2024, arguing the shift to for-profit with Microsoft funding violated founding promises. Jurors agreed he knew of the changes years earlier.
Judge Yvonne Gonzalez Rogers is expected to accept the jury’s advisory finding, dismissing the liability phase.
Musk had sought over $130–150 billion in remedies, Altman’s removal, and structural reversal, now off the table.
Crypto Markets React Calmly
Crypto traders showed little panic. Bitcoin and major altcoins held steady, highlighting “Musk fatigue” in volatile markets.

The outcome strengthens centralized AI leaders like OpenAI (valued near $850B+), potentially sidelining decentralized AI-crypto projects that champion open-source and non-profit models.
Tesla (TSLA) faces short-term pressure as Musk’s xAI pushes forward without courtroom distractions in the AI race.

Musk has repeatedly called most cryptocurrencies “scams” while Tesla holds significant Bitcoin.
The ruling affirms that donors challenging nonprofit-to-profit pivots years later face steep hurdles.
It reduces legal uncertainty for Big Tech AI investments and boosts OpenAI’s IPO prospects alongside its Microsoft ties.
Musk’s team is expected to appeal, with final judgment from the judge coming soon.
OpenAI advances toward public listing, while crypto-AI initiatives may accelerate decentralized alternatives to challenge corporate control.
Investors should track TSLA volatility, Bitcoin’s correlation with AI news flow, and xAI developments for emerging opportunities in this high-stakes tech-crypto intersection.
Neither Sam Altman nor Elon Musk had commented on this development as of this writing.
The post Elon Musk Loses OpenAI Battle: Jury Rules “Too Late” appeared first on BeInCrypto.

Tether and Circle are still competing for stablecoin dominance, with Tether’s USDT representing approximately 63% market share on CoinGecko’s Top USD Stablecoins chart, and Circle’s USDC representing approximately 25%.
This dominant duopoly hasn’t been meaningfully threatened despite the emergence of new competitors like USD1, issued by the Trump-affiliated World Liberty Financial.
The two coins still retain substantial differences, including in how their reserves are constructed and maintained and how they’ve each approached important political questions in Washington D.C.
USDT and USDC growth
In the United States the GENIUS Act, which was signed into law on July 18 last year, sets the regulatory guidelines for stablecoins. This newfound legitimacy may have helped contribute to this growth.
Circle seems to believe it’s prepared for this, claiming that it was “responsible before it was required” and is “ready now”; Tether, meanwhile, is launching USAT, led by former White House advisor Bo Hines, to target the US.
Circle’s stock is publicly traded, and its stock price has increased by more than 50% so far this year. Data from Yahoo Finance says the market capitalization for Circle is approximately $34 billion.
Tether is still privately held, so its valuation is far less definite. It also reportedly tried to raise funds at a valuation of $500 billion, something that led investors to balk.
USDT and USDC reserves
Tether’s attestation suggests that it holds approximately $8.2 billion as “equity,” which represents the difference between its stated value of assets and its liabilities (issued tokens).
This makes up approximately 4% of its market capitalization.
Circle’s attestation, meanwhile, suggests that it has approximately $76 million more in assets than it has circulating USDC. This represents approximately 0.1% of its market capitalization.
Read more: Tether Investments: What a $100B stablecoin empire does with its profits
Tether’s more aggressive reserve compositions contribute to its massive profits, and it claims to have earned $10 billion in profits last year.
Circle’s 10-K annual filing with the SEC shows that it’s still losing money, recording a loss of nearly $70 million for 2025 — though a portion of that could be attributed to the large amount of stock-based compensation related to going public.
Stablecoins in Washington
Both Tether and Circle are active in Washington D.C., advocating for regulations that will benefit their respective businesses.
In some cases they have also become increasingly entangled with members of Donald Trump’s administration.
Howard Lutnick, the commerce secretary, was scrutinized after his nomination due to the ties between the firm he founded, Cantor Fitzgerald, and Tether.
Cantor serves as one of the most important custodians for this stablecoin, and Tether has become increasingly important to other parts of Cantor’s business.
This has included Tether partnering with Cantor as one of the key custodians for its new US-targeted USAT stablecoin, working with Twenty One on its special purpose acquisition company listing, and perhaps most controversially, reportedly lending Lutnick family members money.
Specifically, Tether reportedly loaned money to an entity called Dynasty Trust A, one of the trusts that benefits the Lutnick children and that acquired Cantor Fitzgerald when Howard divested it due to ethics concerns.
This loan is reportedly collateralized by a convertible note that would convert to equity in Tether.
The loan has also sparked ethical concerns once it was reported by Bloomberg. This has included calls from Senator Elizabeth Warren and Senator Ron Wyden to release documents related to this loan.
The size of the loan is still unknown.
Coinbase, which owned a stake in Circle and maintains agreements that entitle it to large payments from Circle’s income, was a donor to Trump’s fortified ballroom project.
Circle, meanwhile, had previously donated to Trump’s inaugural committee.
Both have become important funders of lobbyists over the last several years.
Coinbase reportedly withheld its support for the bill until it restored yield for stablecoins, and this may have slowed the CLARITY Act.
Read more: Tether challenges USDC Solana hegemony with $127.5M Drift bailout
Among the less consequential changes as these giants vie for dominance have been Pornhub choosing to replace its payout option for models who partner with the program.
The platform had originally adopted USDC following a choice by PayPal to cut it off.
In the Solana decentralized finance space, Tether has made aggressive moves, including funding a bailout of Drift that would see the protocol “transition its settlement asset from USDC to USDT.”
Got a tip? Send us an email securely via Protos Leaks. For more informed news and investigations, follow us on X, Bluesky, and Google News, or subscribe to our YouTube channel.
Key points:
- Bitcoin has pulled back to the $76,000 level, a crucial near-term support level to watch.
- Several major altcoins have broken below their near-term support levels, indicating that the bulls have given up.
Bitcoin (BTC) came under pressure on Monday after US President Donald Trump warned Iran that the “clock is ticking” and they better get moving fast. Analyst CryptoRover said in a post on X that a potential US military operation against Iran “is extremely dangerous for $BTC.”
Institutional investors also seem to be turning cautious in the short term. According to SoSoValue data, spot BTC exchange-traded funds recorded $1 billion in weekly net outflows. That was the first net outflow after six successive weeks of inflows totaling $3.4 billion.

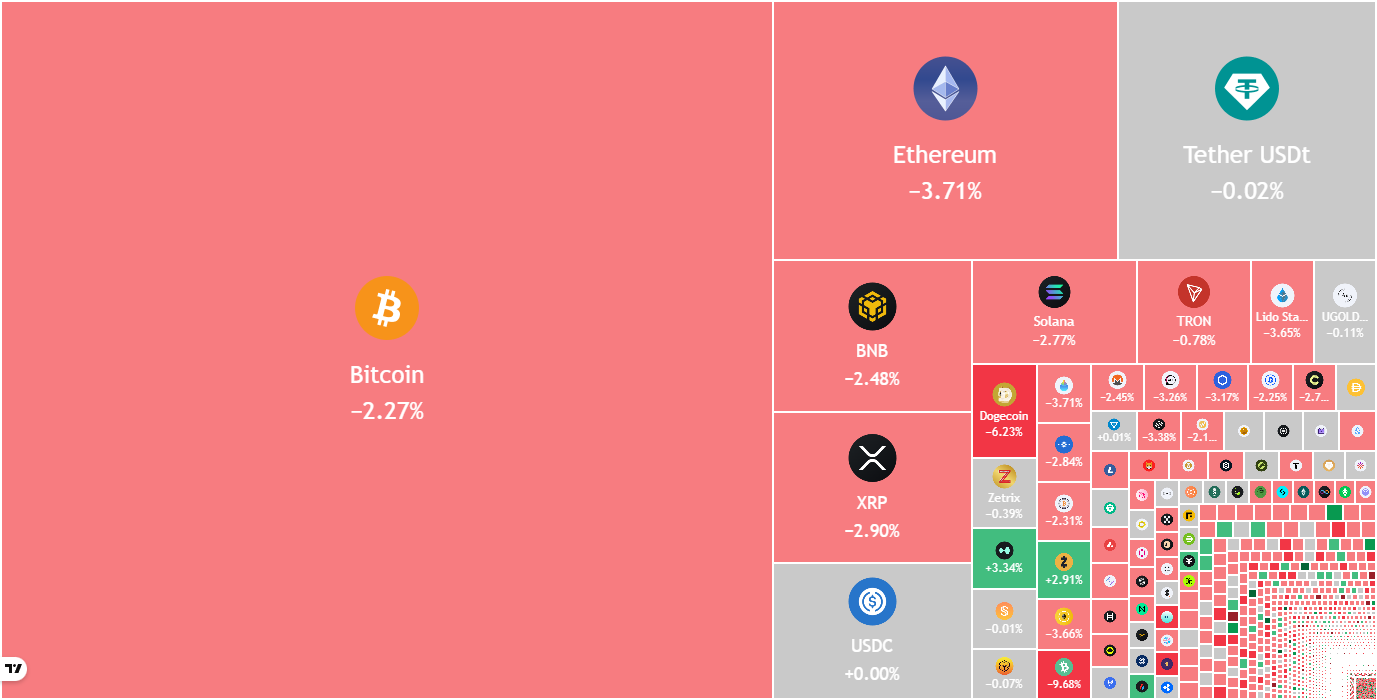
Crypto market data daily view. Source: TradingView
While several traders are cautious on BTC’s prospects in the near term, Michael Saylor’s Strategy, the world’s largest public Bitcoin holder, continued to buy BTC. Strategy purchased 24,869 Bitcoin for $2.01 billion between May 11 and 17, boosting its holdings to 843,738 BTC, per Monday’s 8-K filing with the US Securities and Exchange Commission.
Could BTC and the major altcoins bounce off their crucial support levels? Let’s analyze the charts of the top 10 cryptocurrencies to find out.
S&P 500 Index price prediction
The S&P 500 Index (SPX) rallied to a new all-time high of 7,517 on Thursday, where short-term traders booked profits.
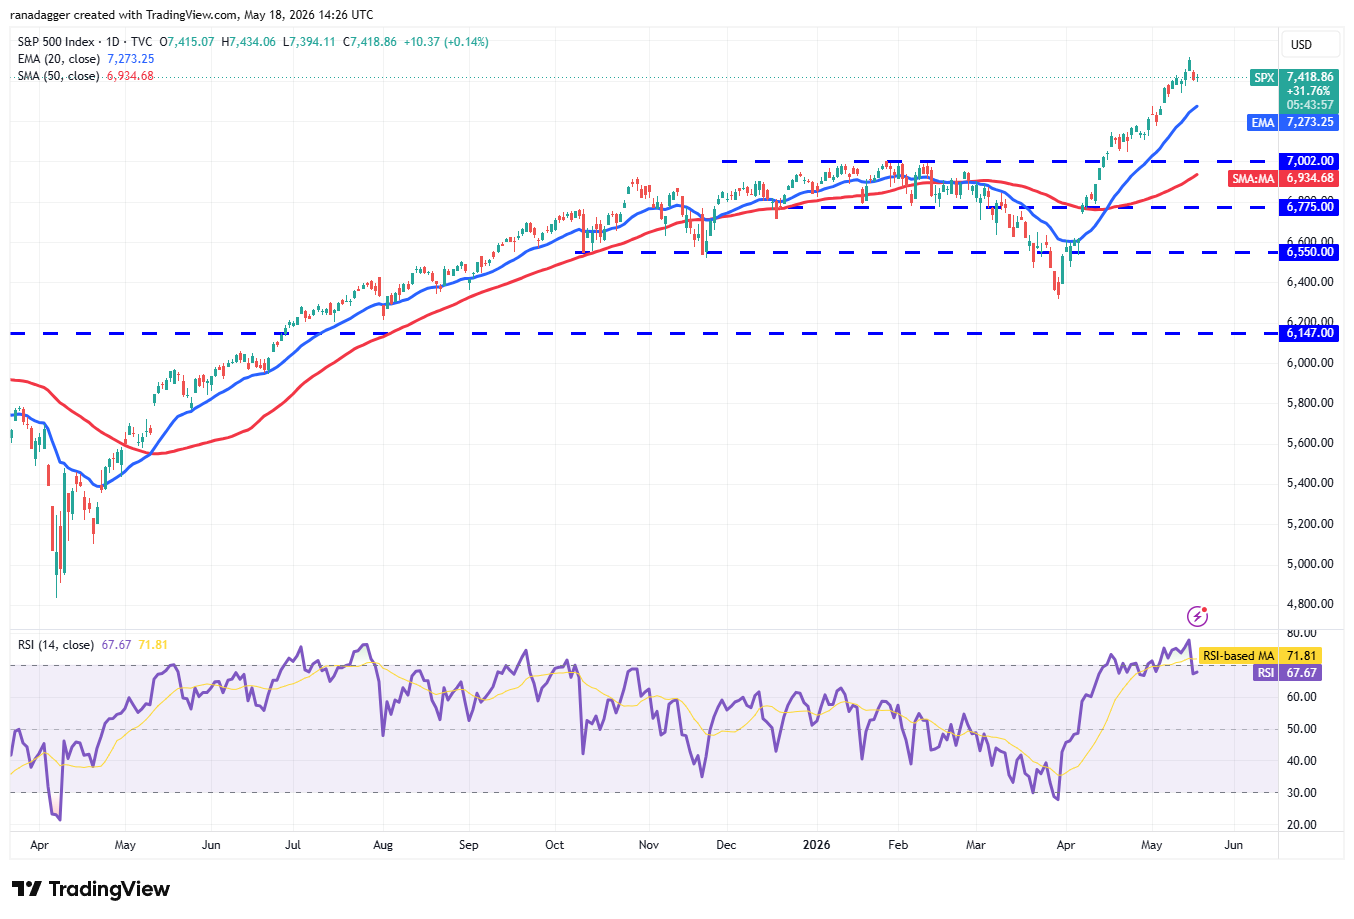
SPX daily chart. Source: Cointelegraph/TradingView
The index may pull back to the 20-day exponential moving average (7,273), a crucial support level to watch. If the price rebounds off the 20-day EMA with strength, it suggests a positive sentiment. That increases the likelihood of an uptrend resuming toward the 8,000 level.
Sellers will have to tug the price below the 20-day EMA to weaken the bullish momentum. If they do that, the index may witness a deeper pullback to the 7,002 level.
US Dollar Index price prediction
The US Dollar Index (DXY) turned up from the 97.74 support and broke above the moving averages.
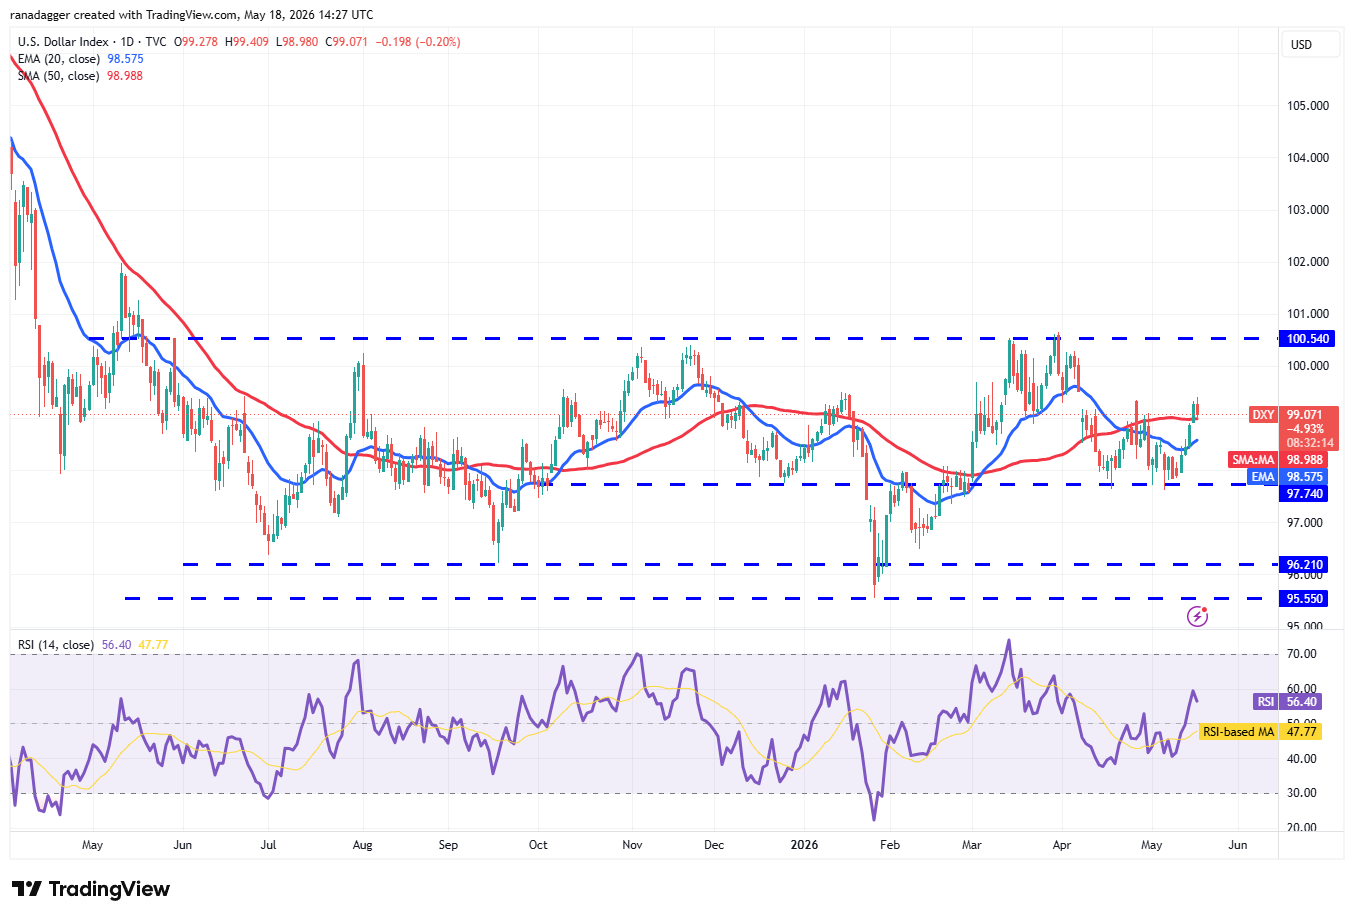
DXY daily chart. Source: Cointelegraph/TradingView
There is minor resistance at 99.34, but if the bulls sustain the price above it, the index may reach the stiff overhead resistance at 100.54. Sellers are expected to fiercely defend the 100.54 level, as a break and close above it would signal the start of a new uptrend. The index may then surge to 101.97.
Conversely, if the price turns down from the current level or from the 100.54 resistance and breaks below the 50-day simple moving average (98.98), it suggests that bears remain active at higher levels. That may keep the index range-bound between 97.74 and 100.54 for a few more days.
Bitcoin price prediction
BTC continued its slide and has reached the 50-day SMA ($75,627), suggesting bears are attempting to take charge.
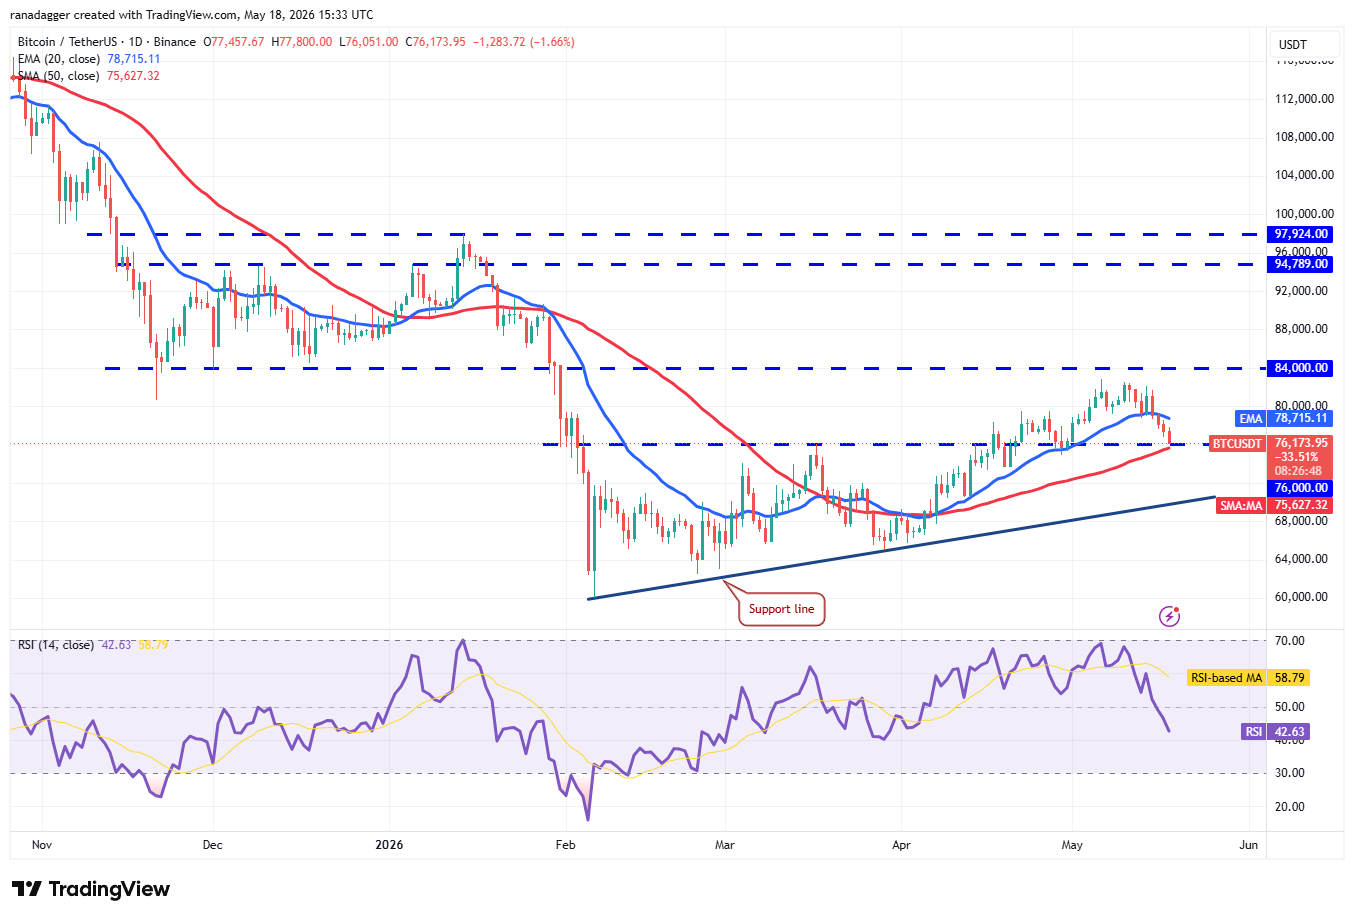
BTC/USDT daily chart. Source: Cointelegraph/TradingView
Buyers will have to sustain the BTC price above the 50-day SMA to retain the advantage. The first sign of strength will be a close above the 20-day EMA ($78,715). That opens the door to a rally toward the $84,000 resistance.
Instead, if the price closes below the 50-day SMA, it increases the risk of a drop to the support line of the ascending channel pattern. Buyers are expected to vigorously protect the support line, as a break below it may sink the BTC/USDT pair to $65,000.
Ether price prediction
Ether (ETH) continued its downward march and closed below the support line of the ascending channel pattern on Sunday.
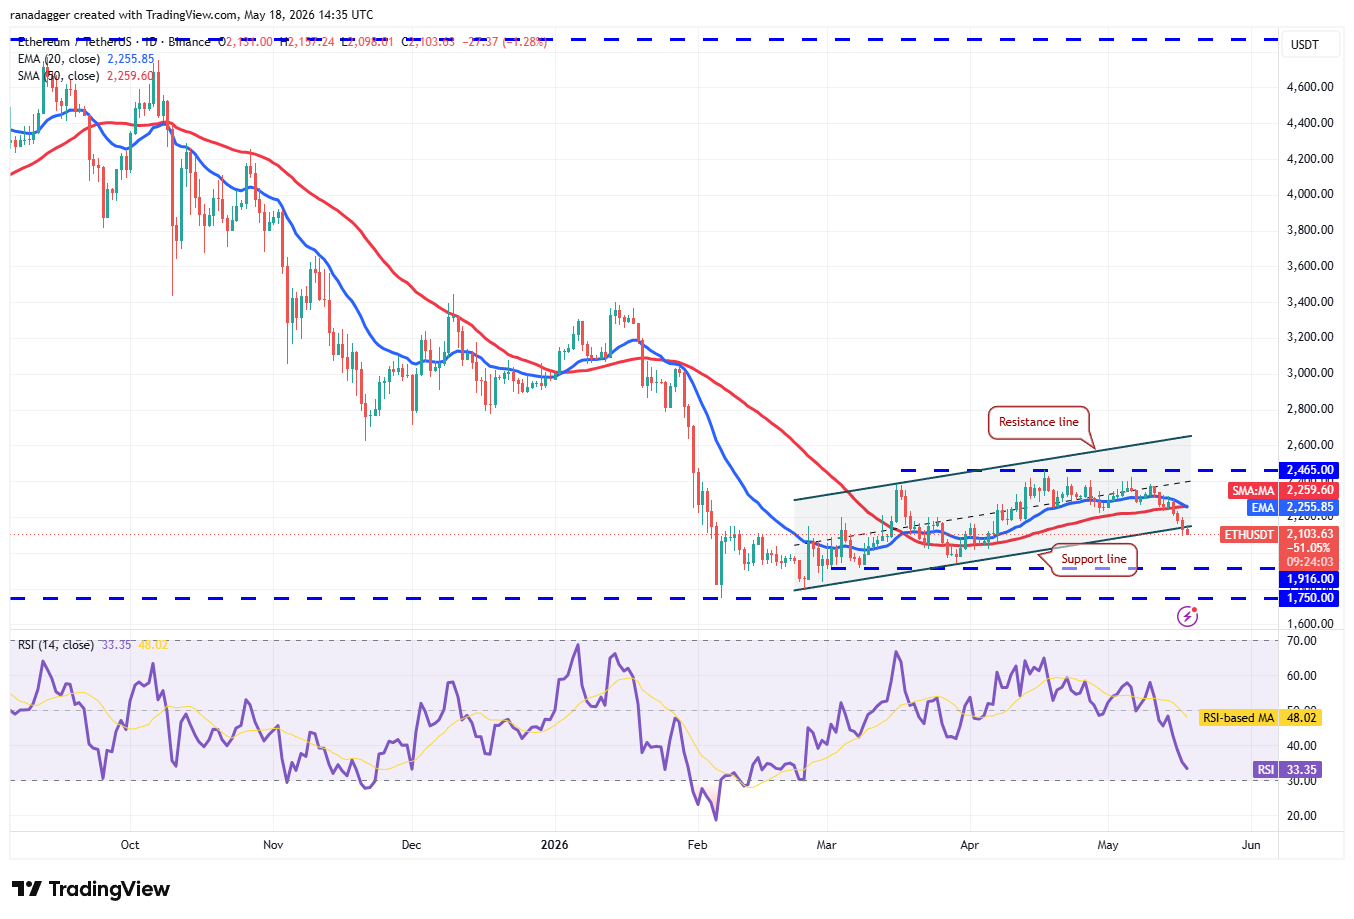
ETH/USDT daily chart. Source: Cointelegraph/TradingView
The 20-day EMA ($2,255) has begun to turn lower, and the RSI is near oversold territory, indicating that bears are in control. Any recovery attempt is expected to face selling at the 20-day EMA. If the ETH price turns down sharply from the 20-day EMA, the likelihood of a drop to $1,916 increases.
Buyers have an uphill task ahead of them. They will have to drive and maintain the ETH/USDT pair above the moving averages to signal a comeback.
XRP price prediction
XRP (XRP) has dipped below the 50-day SMA ($1,39), indicating that the bears are attempting to gain the upper hand.
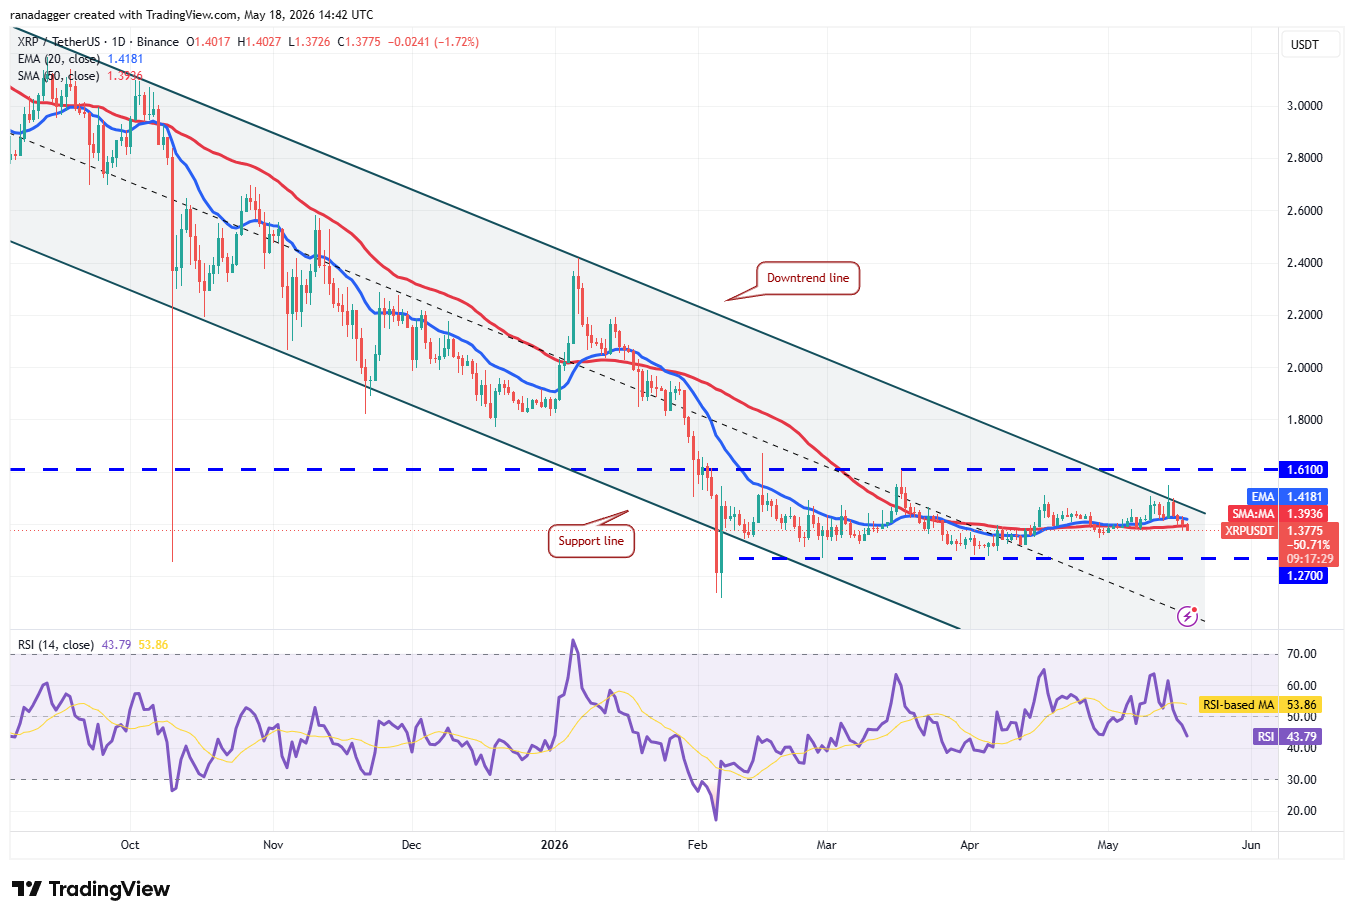
XRP/USDT daily chart. Source: Cointelegraph/TradingView
If the price closes below the 50-day SMA, the next likely stop is the solid support at $1.27. Buyers are expected to defend the $1.27 level with all their might, as a close below it may sink the XRP/USDT pair to $1.11 and later to the psychological level at $1.
Buyers are expected to face selling at the downtrend line and then at the $1.61 level. A break and close above the $1.61 resistance signal a short-term trend change. The XRP price may then march to $2 and subsequently to $2.40.
BNB price prediction
BNB (BNB) pulled back from the $687 overhead resistance and broke below the 20-day EMA ($648).
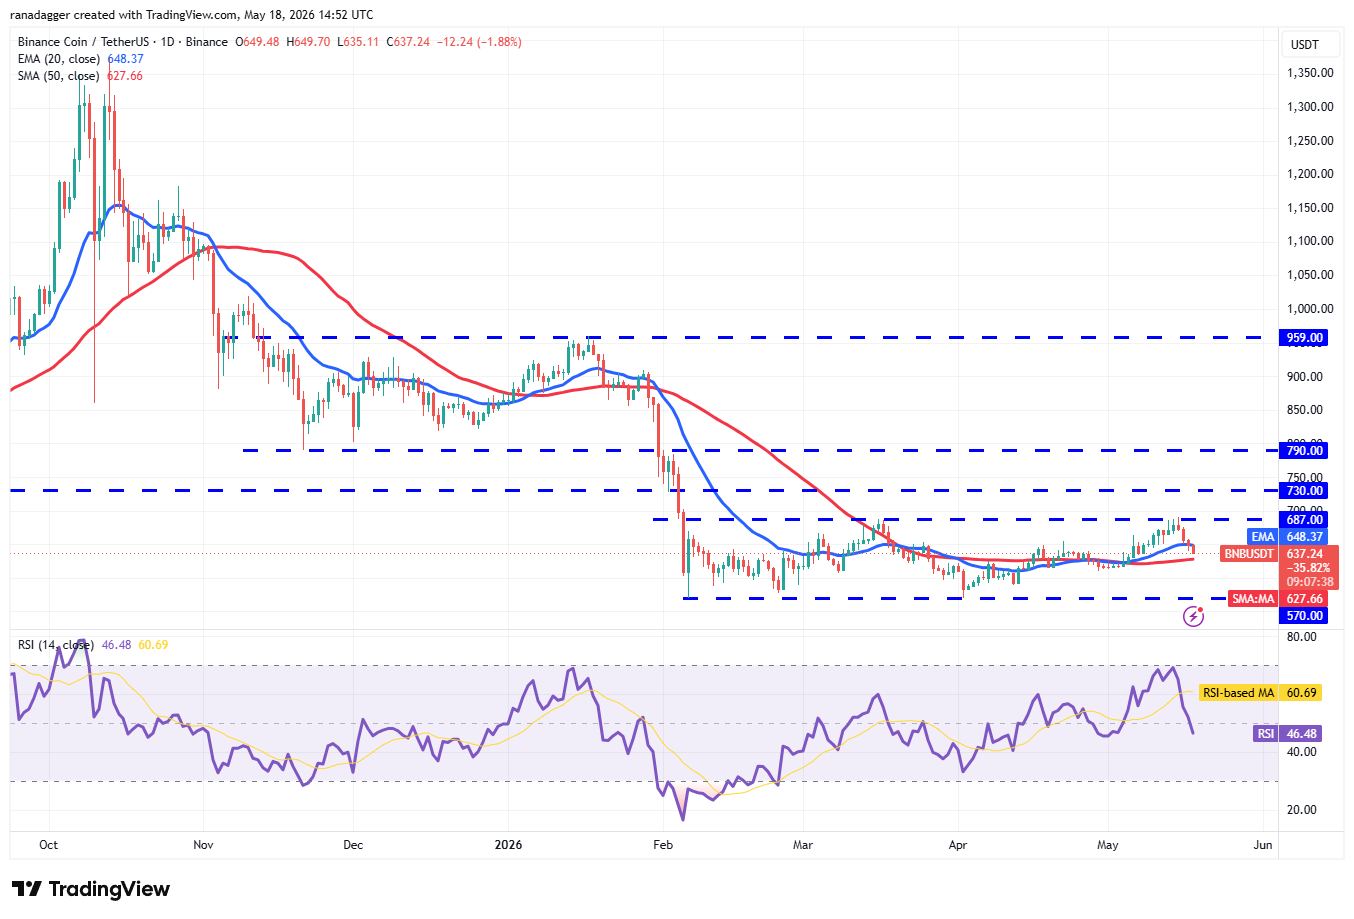
BNB/USDT daily chart. Source: Cointelegraph/TradingView
There is minor support at the 50-day SMA ($637), but if the level cracks, the BNB/USDT pair may plummet to the solid support at $570. This is a crucial level to watch out for, as a close below $570 indicates the start of the next leg of the downtrend. The pair may then collapse toward $500.
On the contrary, if the BNB price turns up from the 50-day SMA, it suggests demand at lower levels. Buyers will have to thrust the price above the $687 resistance to indicate strength. The pair may then rally to $730 and then to $790.
Solana price prediction
Solana (SOL) closed below the 50-day SMA ($85) on Sunday, indicating that the bears are on a comeback.
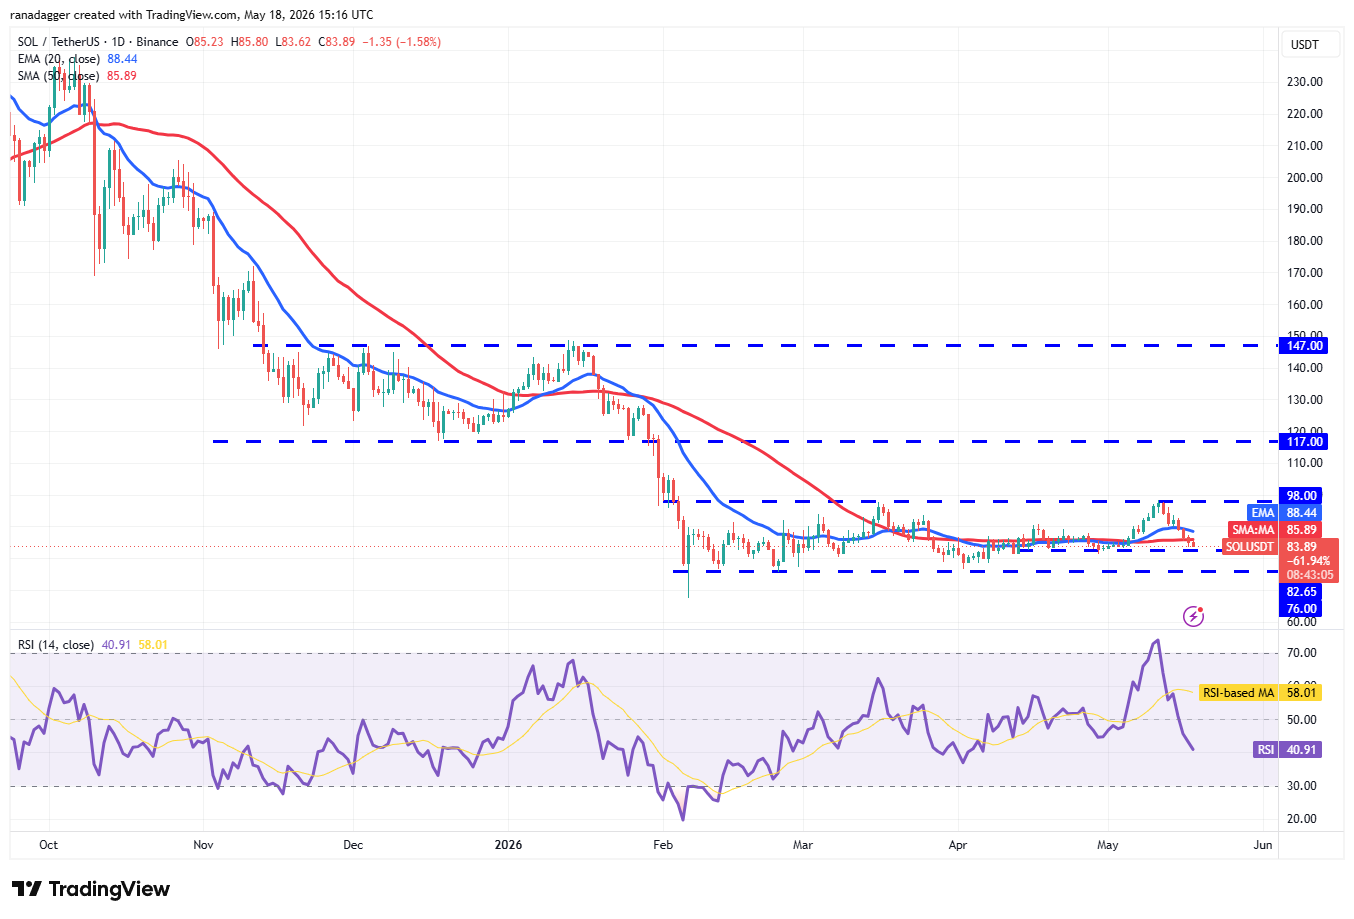
SOL/USDT daily chart. Source: Cointelegraph/TradingView
There is support at $82, but the recovery is expected to face selling at the 20-day EMA ($88). If the SOL price turns sharply down from the 20-day EMA, the likelihood of a break below the $82 support increases. That opens the doors for a drop to the $76 level.
The first sign of strength will be a close above the 20-day EMA. That shows solid buying at lower levels. The bulls will be back in the driver’s seat after the SOL/USDT pair closes above the $98 resistance.
Related: Hyperliquid eyes 55% price rise after Silicon Valley investor’s ‘massive HYPE buy’
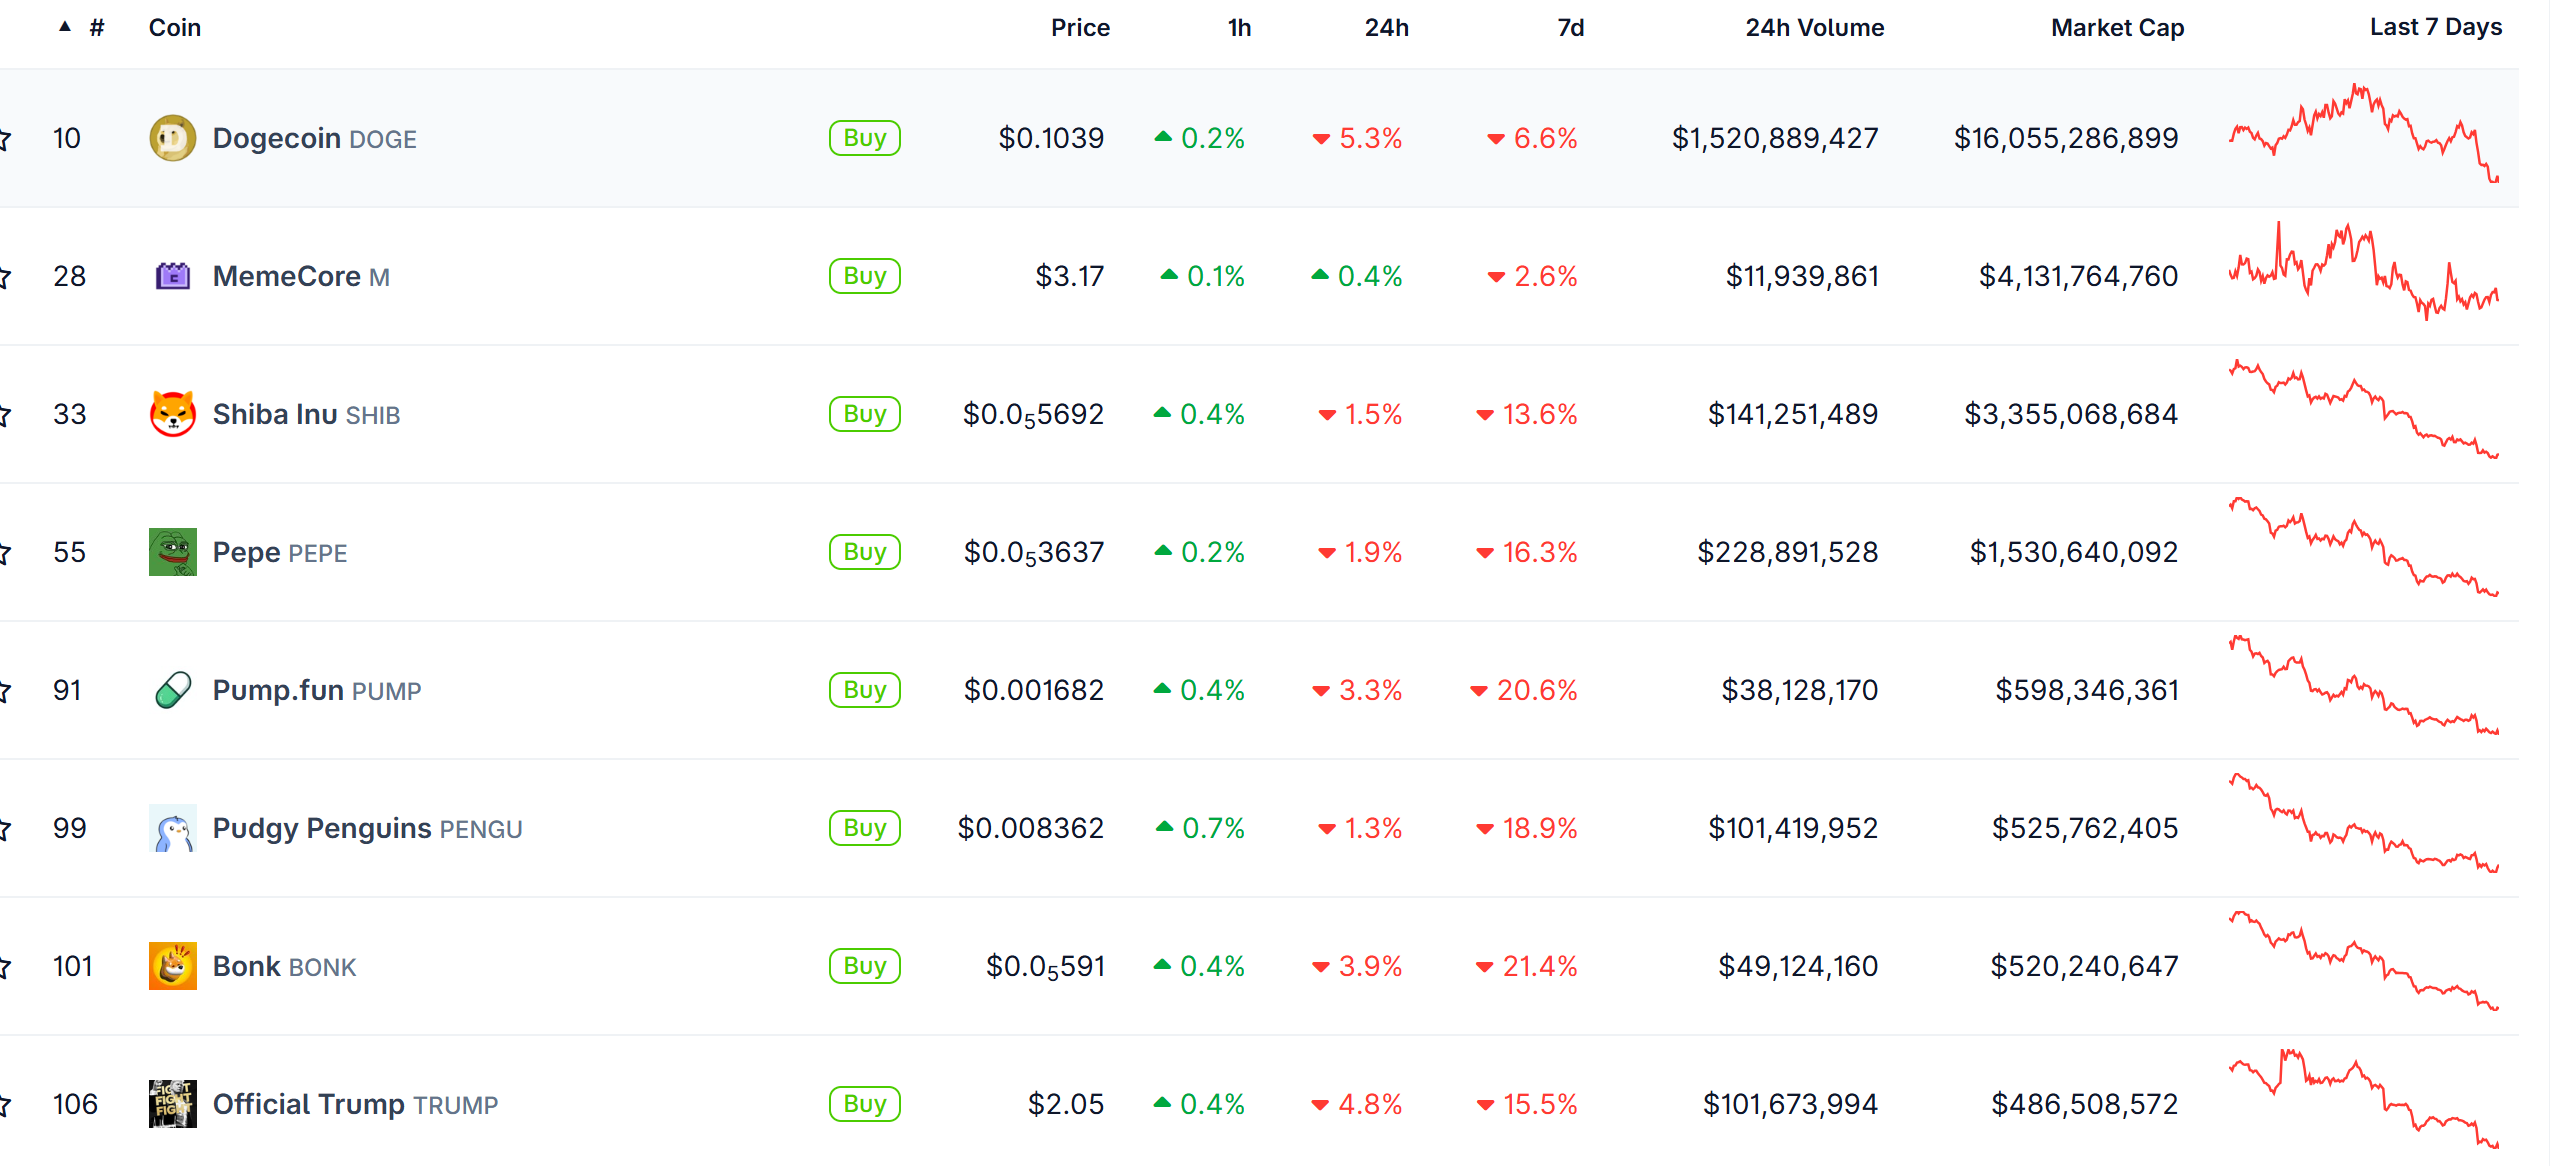
Dogecoin price prediction
Dogecoin (DOGE) has dipped below its 20-day EMA ($0.11), suggesting that bulls have given up in the short term.
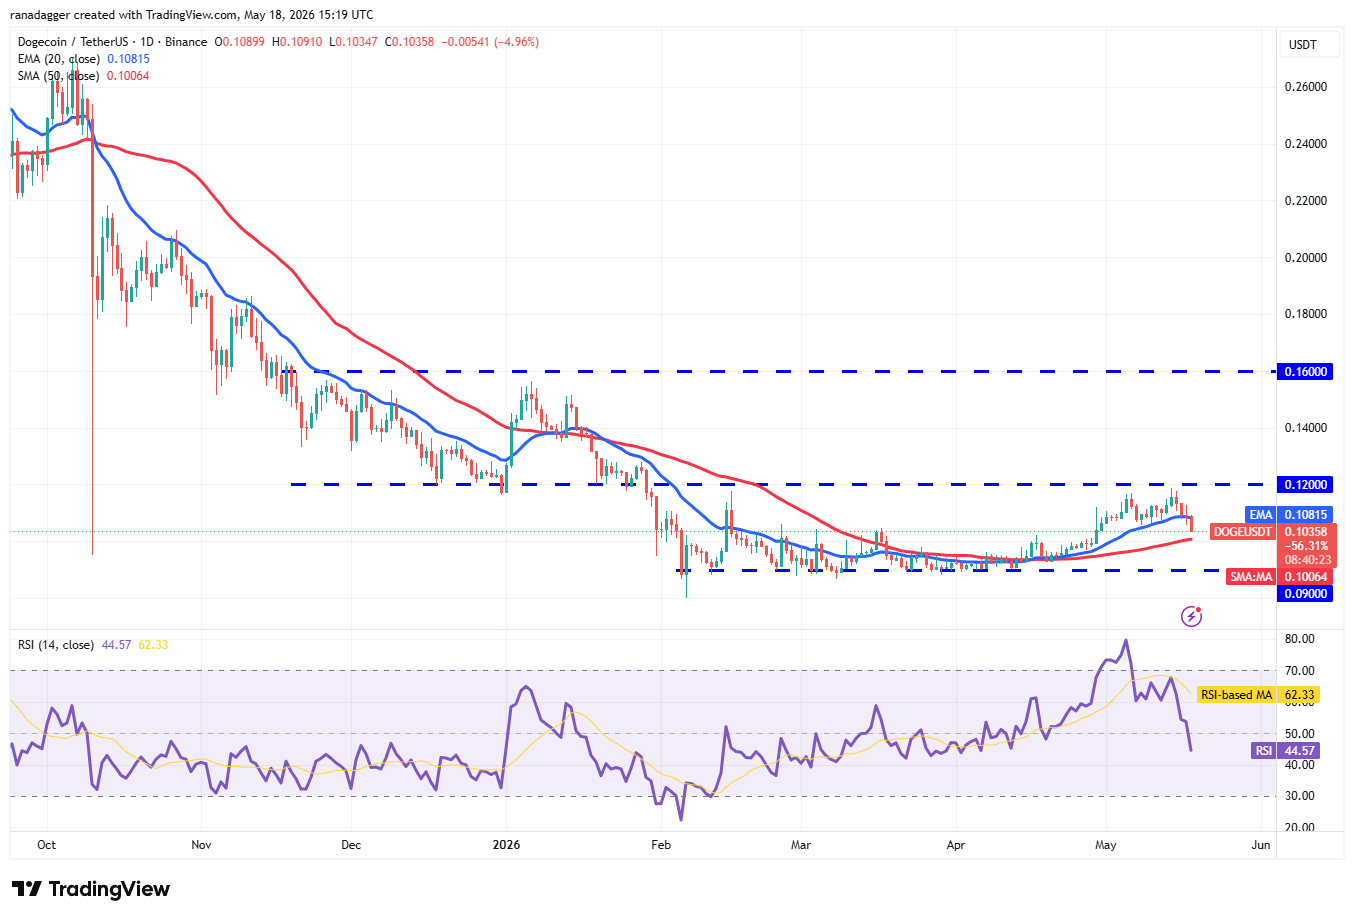
DOGE/USDT daily chart. Source: Cointelegraph/TradingView
The flattish 20-day EMA and the RSI just below the midpoint suggest a range-bound action between $0.09 and $0.12 for some more time.
Buyers will have to push and sustain the DOGE price above the $0.12 resistance to signal the start of a new up move. The DOGE/USDT pair may then climb to $0.14 and later to $0.16.
On the downside, a break and close below the $0.09 support indicates the resumption of the downtrend. The pair may then slump to $0.08.
Hyperliquid price prediction
Hyperliquid (HYPE) has been volatile for the past few days, indicating a tough battle between the bulls and the bears.
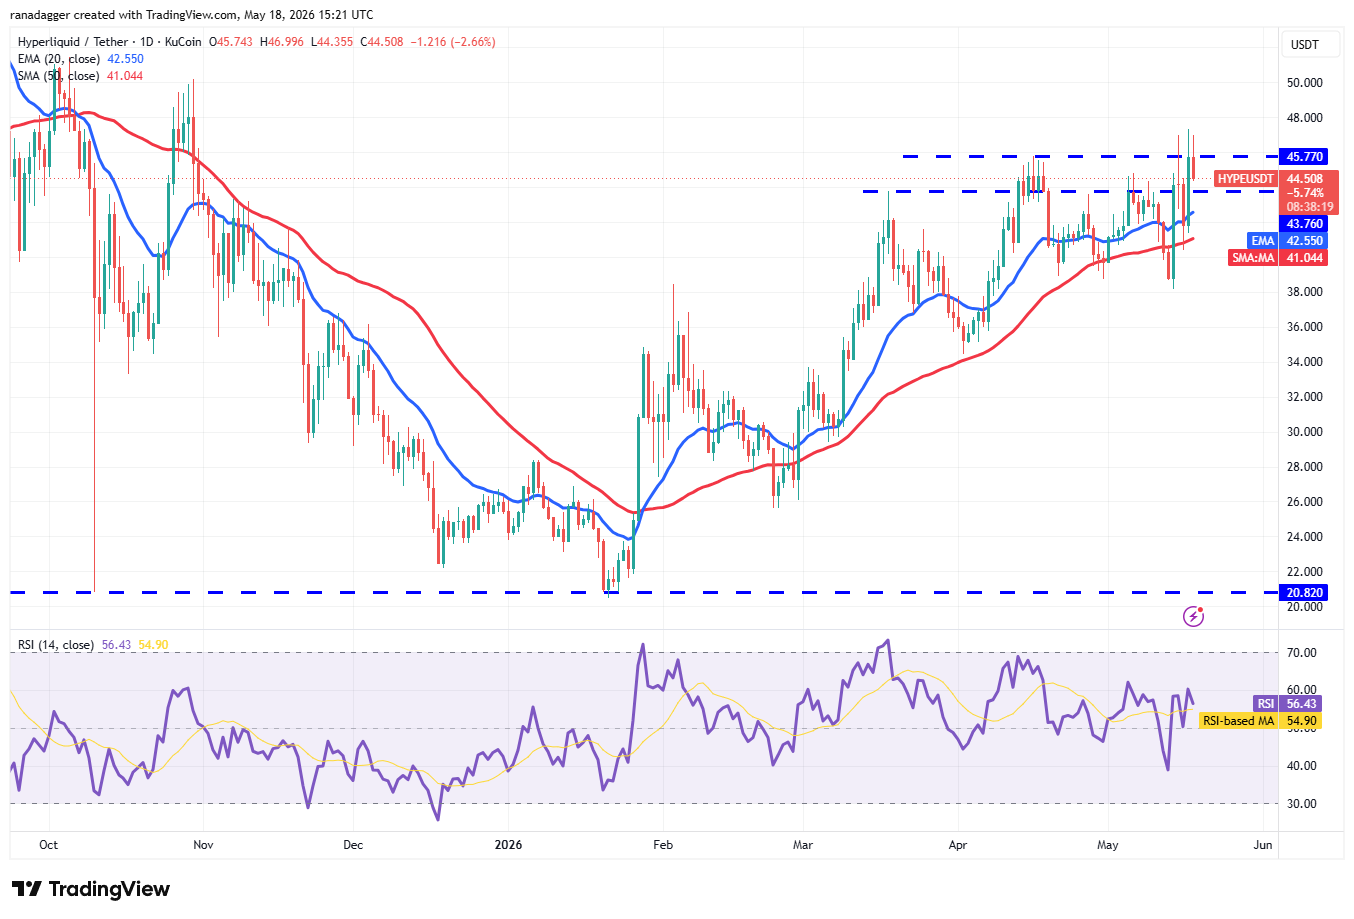
HYPE/USDT daily chart. Source: Cointelegraph/TradingView
The bulls pushed the HYPE price above the $45.77 resistance, but the long wick on the candlestick shows selling at higher levels. Buyers will have to secure a close above the $45.77 level to clear the path for a rally to the $50 to $51.43 zone.
The 20-day EMA ($42.55) is the critical support to watch out for on the downside. A break below it suggests that the HYPE/USDT pair may consolidate inside the $38.17 to $47.32 range for a while.
Cardano price prediction
Cardano (ADA) has dipped below the 50-day SMA ($0.25), indicating that the bears continue to exert pressure.
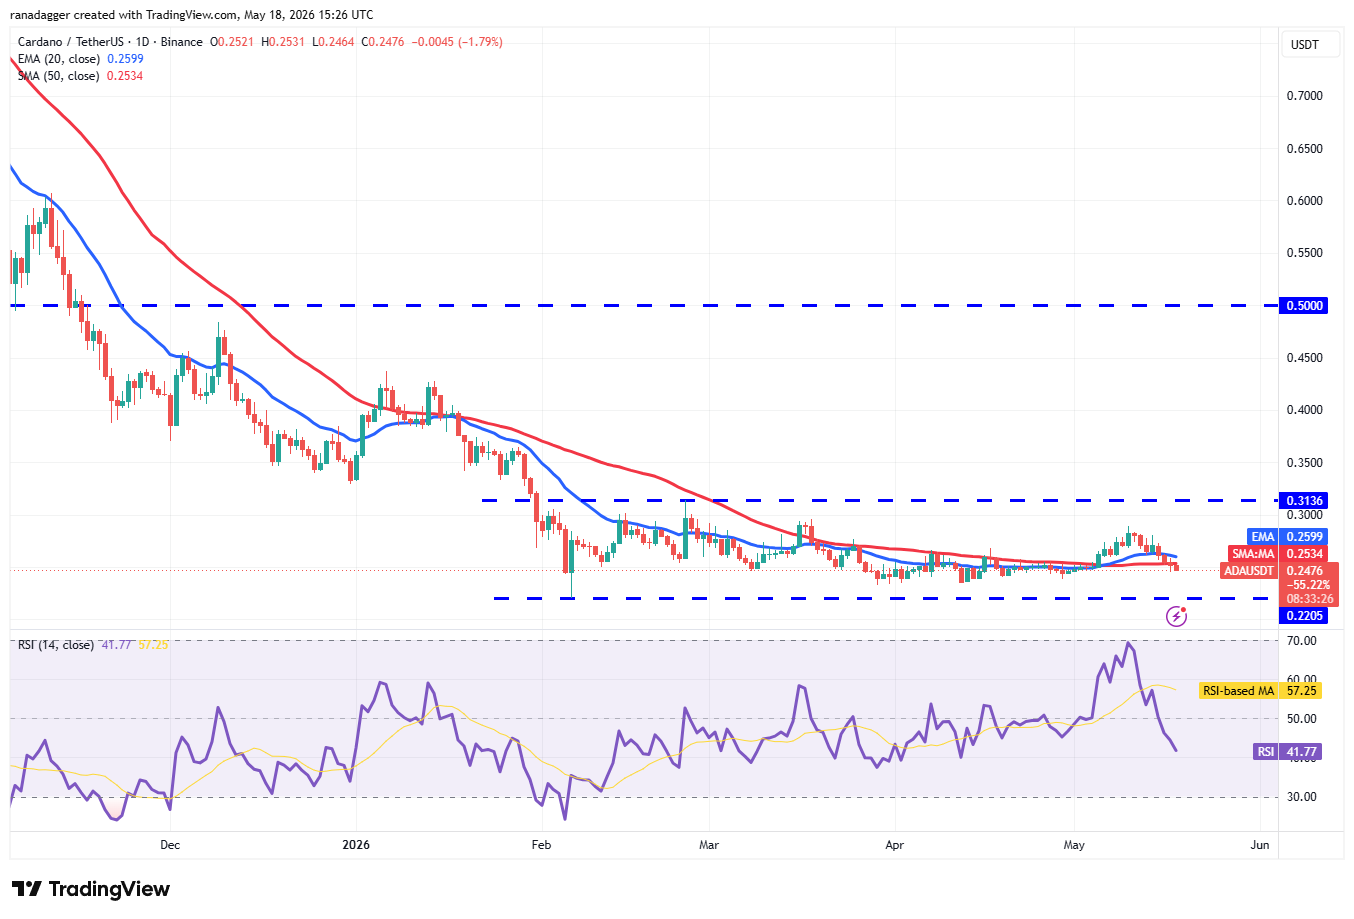
ADA/USDT daily chart. Source: Cointelegraph/TradingView
The flattish moving averages and the RSI just below the midpoint suggest the ADA/USDT pair may oscillate inside the $0.22 to $0.31 range for a few more days.
The next trending move may begin on a close above the $0.31 resistance or below the $0.22 support. If the ADA price turns up and breaks above $0.31, the pair may pick up momentum and soar toward $0.40. Alternatively, a close below $0.22 signals the resumption of the downtrend toward the target objective of $0.13.
Bitcoin is trading at $76.8k as the third week of May opens. It has surrendered the $80k breakout that defined the prior week’s narrative. The short-term bullish trendline that supported the inner rally structure has been broken, and the price has pulled back into the mid-range of the large ascending channel on the daily timeframe. The support zone at $75k is now the line in the sand.
Bitcoin Price Analysis: The Daily Chart
On the daily timeframe, it is evident that the ascending channel breakout has been invalidated, and the asset has returned inside the structure and is now testing the middle portion of the range near $76k–$75k. The 100-day MA has declined to approximately $72k and is approaching from below, providing a rising floor that narrows the downside risk. Yet, the 200-day MA, currently located around $81k, is pushing the price lower from above, after rejecting it decisively.
The support zone at $75k is the critical area to defend, as it represents the most recent bullish order block and short-term swing low. A rebound here and a recovery back above $80k would suggest the pullback was corrective and the broader uptrend intact.
However, if the price breaks below $75k, a further decline back toward the 100-day MA and the $72k demand area would be expected. Such a move would raise questions on whether the recent recovery has been a genuine one or simply another trap for early buyers.

BTC/USDT 4-Hour Chart
The bearish RSI divergence that built through the $80k–82k highs earlier this month has resolved exactly as the pattern suggested. The inner bullish trendline from April has been broken, and the RSI has dropped sharply below 35, approaching oversold on this timeframe for the first time in the past couple of months.
The price is now sitting at the upper edge of the $75k–$76k support zone. A bounce from here, accompanied by a bullish RSI divergence and recovery from oversold values, would signal that the correction is exhausted and another rally toward $80k could be expected.
On the other hand, failure to hold $75k opens the lower support area at $70k–72k, which also aligns with the daily ascending channel’s lower boundary and the 100-day moving average. Therefore, if the $75k zone breaks, buyers would face a critical battle at the $72k region to prevent the market from a deeper crash.

On-Chain Analysis
The Adjusted SOPR has recovered from its February low of below 0.98, which is a reading that confirmed widespread capitulation as sellers offloaded coins below their cost basis, all the way back to 1.005. The metric has just crossed the critical 1.0 threshold that separates profitable from loss-realizing behavior. Historically, the recrossing of 1.0 from below has marked the transition from bear-market behavior to recovery.
The fragility of the current reading matters, though. At 1.005, aSOPR has barely cleared the line, and any meaningful price decline back toward $70–72k risks pushing it below 1.0 again, which would signal that the recovery has stalled and sellers are once again realizing losses. Holding the $75k support zone is therefore not just a technical requirement but an on-chain one, as it is the price level that keeps the aSOPR above 1.0 and the recovery narrative intact.

The post Bitcoin Price Analysis: What’s Next for BTC as Key Trendline Breaks? appeared first on CryptoPotato.
Last week, digital asset investment products experienced $1.07 billion in outflows, according to CoinShares, making it the first negative week after seven straight weeks of gains. It was also the third-largest weekly outflow seen in 2026.
Bitcoin saw the majority of the selling pressure as investors shifted toward a broader risk-off approach amid renewed geopolitical concerns surrounding Iran. However, investor sentiment appeared to stabilize toward the end of the week after news related to the CLARITY Act.
CoinShares found that 11 digital assets continued to attract inflows despite the broader decline, while Thursday recorded $174 million in inflows.
XRP and Solana Defy Market Panic
Bitcoin recorded $982 million in outflow last week, which reduced its year-to-date total to $3.9 billion. Ethereum also faced heavy selling pressure, as $249 million left the asset in its largest weekly decline since January 30. Blockchain equity ETFs were similarly affected, posting a combined $133 million decline amid broader risk-off sentiment.
On the other hand, several altcoins continued to attract investor interest. XRP led with $67.6 million inflows, followed by Solana with $55.1 million. Next up was Ton, which recorded $7.7 million, Sui $4.7 million, Ondo $4.1 million, Chainlink $3.9 million, and Dogecoin $3.2 million. The asset manager explained that investors are increasingly looking past Bitcoin and Ethereum for selective exposure.
According to CoinShares, the latest wave of crypto investment product withdrawals was driven almost entirely by the US, which saw $1.14 billion pulled from funds last week. European markets held up much better, led by Switzerland with $22.8 million and Germany with $22 million. The Netherlands added $7.5 million, while Sweden was the only exception as it recorded a smaller $4 million decline. During the same period, Canada attracted $12.6 million, and Australia saw $4.4 million in fresh investment.
Pressure May Continue
QCP Capital also warned that Bitcoin could remain under pressure after breaking below the $78,000 support level earlier today. The Singapore-based firm said the expiry of more than $4 billion in IBIT options has weakened the stabilizing effect that previously helped keep Bitcoin trading within a tight range.
The broader macro backdrop has also become less supportive, as seen with rising US Treasury yields and USD/JPY moving closer to the 160 level, where intervention risks could trigger a sharp unwind in yen-carry positions and drain a crucial source of global liquidity that has historically supported risk assets.
QCP added that crypto is likely to remain range-bound unless markets see meaningful progress in US-China trade talks or US-Iran negotiations.
The post Bitcoin Bleeds $1B Weekly but XRP and SOL Defy Market Panic appeared first on CryptoPotato.
Crypto World
The Ethereum Foundation is facing a wave of high-profile departures as its internal shakeup deepens


The turnover comes as the foundation undergoes an internal transition tied to a new organizational mandate aimed at redefining its role within Ethereum.

Ether (ETH) extended a downbeat spell last week after hitting resistance near $2,400, with the price sliding to roughly $2,100 on Monday. Market observers described the move as a sign that sellers have regained control, marking a shift in near-term momentum for the largest smart contract platform by market capitalization.
The wave of selling came as liquidity pressure mounted on major venues and investment products, reinforcing a narrative of waning demand. Binance’s exchange data showed that taker sell volume surged as ETH breached crucial downside levels, a signal, according to analysts, of forced risk-off positioning among active traders. In parallel, fund flows underscored a broader withdrawal of institutional interest in Ethereum-related exposure.
According to SoSoValue, US-based spot Ethereum ETFs posted net outflows for five consecutive days, totaling $255 million. Globally, Ethereum-focused investment products rang up about $249 million in outflows for the week ending May 15, the largest weekly figure since early February, according to data tracked by CoinShares. These outflows suggest the market is experiencing a pause or reversal in institutional demand, at least in the near term.
Key takeaways
- Ether drops roughly 12% after rejection at $2,400, with price extending lower toward $2,100 as bears reassert control.
- Binance taker sell volume spikes above $1.1 billion during the downside move, indicating aggressive selling pressure from traders on futures platforms.
- ETF and fund outflows imply waning institutional demand for Ethereum exposure in the short run, potentially constraining upside momentum.
Trading dynamics amid thinning demand
Price action around ETH has reflected a confluence of selling pressure and shifting investor positioning. Data from Binance shows a surge in taker sell volume as ETH moved below the $2,100 level, a pattern that traders sometimes interpret as forced de-risking or short-term bearish pressure from active market participants. CryptoQuant analyst Amr Taha captured the sentiment, noting that while the spikes do not automatically confirm a reversal into a deeper downtrend, they do indicate buyers were unable to absorb selling pressure during the move.
Analysts have increasingly linked price action to a widening macro and sectoral dynamics that have weighed on Ethereum demand. A related thread of analysis has tied ETH selling pressure to external catalysts, with coverage noting that surging oil prices have been identified as a driver of selling pressure in Ether by market commentator Tom Lee. The observation points to a broader risk-off environment where macro shifts can translate into crypto selling, particularly for assets with the most liquidity and sensitivity to market sentiment.
The withdrawal of liquidity from Ethereum-focused investment products aligns with the price action. SoSoValue’s data shows a five-day streak of net outflows from US spot ETH exposure totaling $255 million, a clear sign that institutions are rebalancing away from long ETH bets in the near term. Whale Factor, commenting on the flow trajectory, described the pattern as “heavy sell-side distribution” that has kept price pressure in place for now.
CoinShares’ weekly fund flow report further corroborates the trend, noting that global Ethereum investment products registered about $249 million in outflows for the week ending May 15, the largest weekly number since late January. Taken together, these outflows paint a picture of a market where institutional demand has cooled, at least temporarily, even as spot demand and retail interest remain more tentative.
Where is the support, and what comes next?
From a technical standpoint, investors are watching a cluster of roughly 3.85 million ETH that sits at a cost basis around $2,000–$2,100, according to Glassnode’s cost-basis distribution data. The concentration suggests a sizable cohort of holders could add if prices approach break-even, potentially offering a floor that might limit further downside in the near term.
Analysts remain divided on the vulnerability of ETH to a deeper retreat. Some traders point to a rising wedge pattern on daily charts, which could set the stage for a move toward the next major support around $1,700 if current supports fail to hold. In contrast, others argue that a decisive hold above $2,000 could slow the decline, with a potential bounce narrowly above that level contingent on continued demand and favorable liquidity conditions.
Strategists offered a spectrum of medium-term views. A well-known trader noted that Ethereum breached the $2,100 area after failing to sustain the $2,150 support, suggesting that a defense around the $2,050–$2,070 zone could provide a meaningful bounce if demand returns. Another analyst framed the situation as a test of buyers’ resolve near the lower end of the recent range, warning that a sustained break below the region could open the door to further softening into lower support bands.
Beyond the price action, the narrative around catalysts for a potential ETH rally remains anchored to a mix of macro conditions and on-chain developments. Sharplink’s CEO recently highlighted three catalysts that could help Ethereum reach new highs: the CLARITY Act’s progress in the United States, a broader return of market-wide risk appetite, and the growth of real-world asset tokenization on Ethereum. While these drivers are not immediate guarantees, they represent the structural tailwinds that could shift sentiment back toward Ethereum if liquidity and risk sentiment improve.
For now, traders are inclined to monitor the $2,000 level closely. A firm hold above this threshold could deter further downside and set the stage for a measured recovery, while a break below could expose traders to a test of the next support pockets identified by technical analysts and cost-basis data alike. The balance of on-chain activity, ETF and fund flows, and macro risk appetite will continue to shape the near-term trajectory.
In a related context, market observers have flagged that external factors, such as shifts in oil prices and broader risk sentiment, have historically fed into Ethereum’s price behavior. The interconnectedness of macro trends and on-chain dynamics underscores the importance of watching both liquidity flows and technical levels as the market digests renewed selling pressure and any potential rebound catalysts.
As the week unfolds, traders and investors will be watching three key variables: whether ETH can sustain a bid above $2,000, how ETF and institutional flows trend in the coming days, and whether demand from key market participants returns to supported levels to re-anchor prices above crucial supports.
The immediate question remains whether the current price action marks a temporary pause in a broader downtrend or the start of a longer retracement that could push ETH toward lower basins. Market participants will be closely analyzing liquidity conditions, the pace of outflows or inflows in Ethereum-related vehicles, and the evolving macro backdrop to gauge the durability of any short-term bounce.
Readers should stay tuned to updates on ETF flows, on-chain cost-basis shifts, and technical patterns that could prove decisive for ETH’s near-term path. The coming days may reveal whether the market finds equilibrium near $2,000 or if renewed selling pressure takes the price down to the next set of support levels.
What remains uncertain is how quickly institutional sentiment can reassert itself and whether macro risks ease enough to restore appetite for Ethereum exposure. Market participants will be watching closely to determine if the present pullback is a temporary pause in a longer-term recharge or a precursor to a deeper test of support zones.

The Walt Disney Company (DIS) Q2 2026 Earnings Call Prepared Remarks Transcript

$11.58M Drained in Ongoing Exploit on Verus-Ethereum Bridge

Exclusive: Former Labour Members Are Returning To The Party To Back Andy Burnham
Manchester United reach agreement with Casemiro over contract clause amid transfer speculation

US brings back mandatory military draft registration

Steven Gerrard disagrees with Gary Neville over ‘shock’ Chelsea and Arsenal claim | Football


-

 Crypto World3 days ago
BloFin War of Whales 2026 Grand Prix opens registration for $5M trading championship
-

 Fashion3 days ago
Weekend Open Thread: Theory – Corporette.com
-

 Crypto World3 days ago
E-Estate Announces 1 Year Live: Washington DC Summit as Real Estate Tokenization Enters Its Next Phase
-

 Politics7 days ago
What to expect when you’re expecting a budget
-

 Tech4 days ago
Tech Moves: Microsoft AI leader jumps to OpenAI; former AI2 exec joins Meta; and more
-
Crypto World6 days ago
Bitcoin Suisse expands with Digital Asset License and Investment Business Act Registration Approval in Bermuda
-

 Tech7 days ago
GM agrees to $12.75M California settlement over sale of drivers’ data
-

 Politics6 days ago
Pakistan to enter Chinese capital market as war inflation bites
-

 Crypto World6 days ago
Bitcoin Suisse expands with Digital Asset License and Investment Business Act Registration Approval in Bermuda
-
 Crypto World4 days ago
Google’s Gemini AI Predicts Incredible Solana Price by the End of 2026
-
 Business3 days ago
H&R Real Estate Investment Trust (HR.UN:CA) Q1 2026 Earnings Call Transcript
-

 Tech3 days ago
Google reimburses Register sources who were victims of API fraud
-

 Sports3 days ago
Napoleonic enters 2026 Doomben 10,000 field via Abounding withdrawal
-

 Politics7 days ago
The geopolitics behind the UK’s South Atlantic hantavirus rescue mission
-

 Politics7 days ago
The Board of Deputies just smeared Polanski to suck up to Farage
-

 NewsBeat6 days ago
Comment on Keir Starmer surviving the day as Prime Minister like a turd that wont flush
-

 Fashion6 days ago
The Best-Kept Makeup Secret for a More Defined Face
-
 Entertainment4 days ago
Zara Larsson Has Blunt Response To Chris Brown Diss
-
 Tech5 days ago
Why AI is making typography a boardroom conversation
-

 Politics6 days ago
The Trial of Majid Freeman, Verdict
You must be logged in to post a comment Login