

Crypto World
SEC Approves Nasdaq Bitcoin Index Options

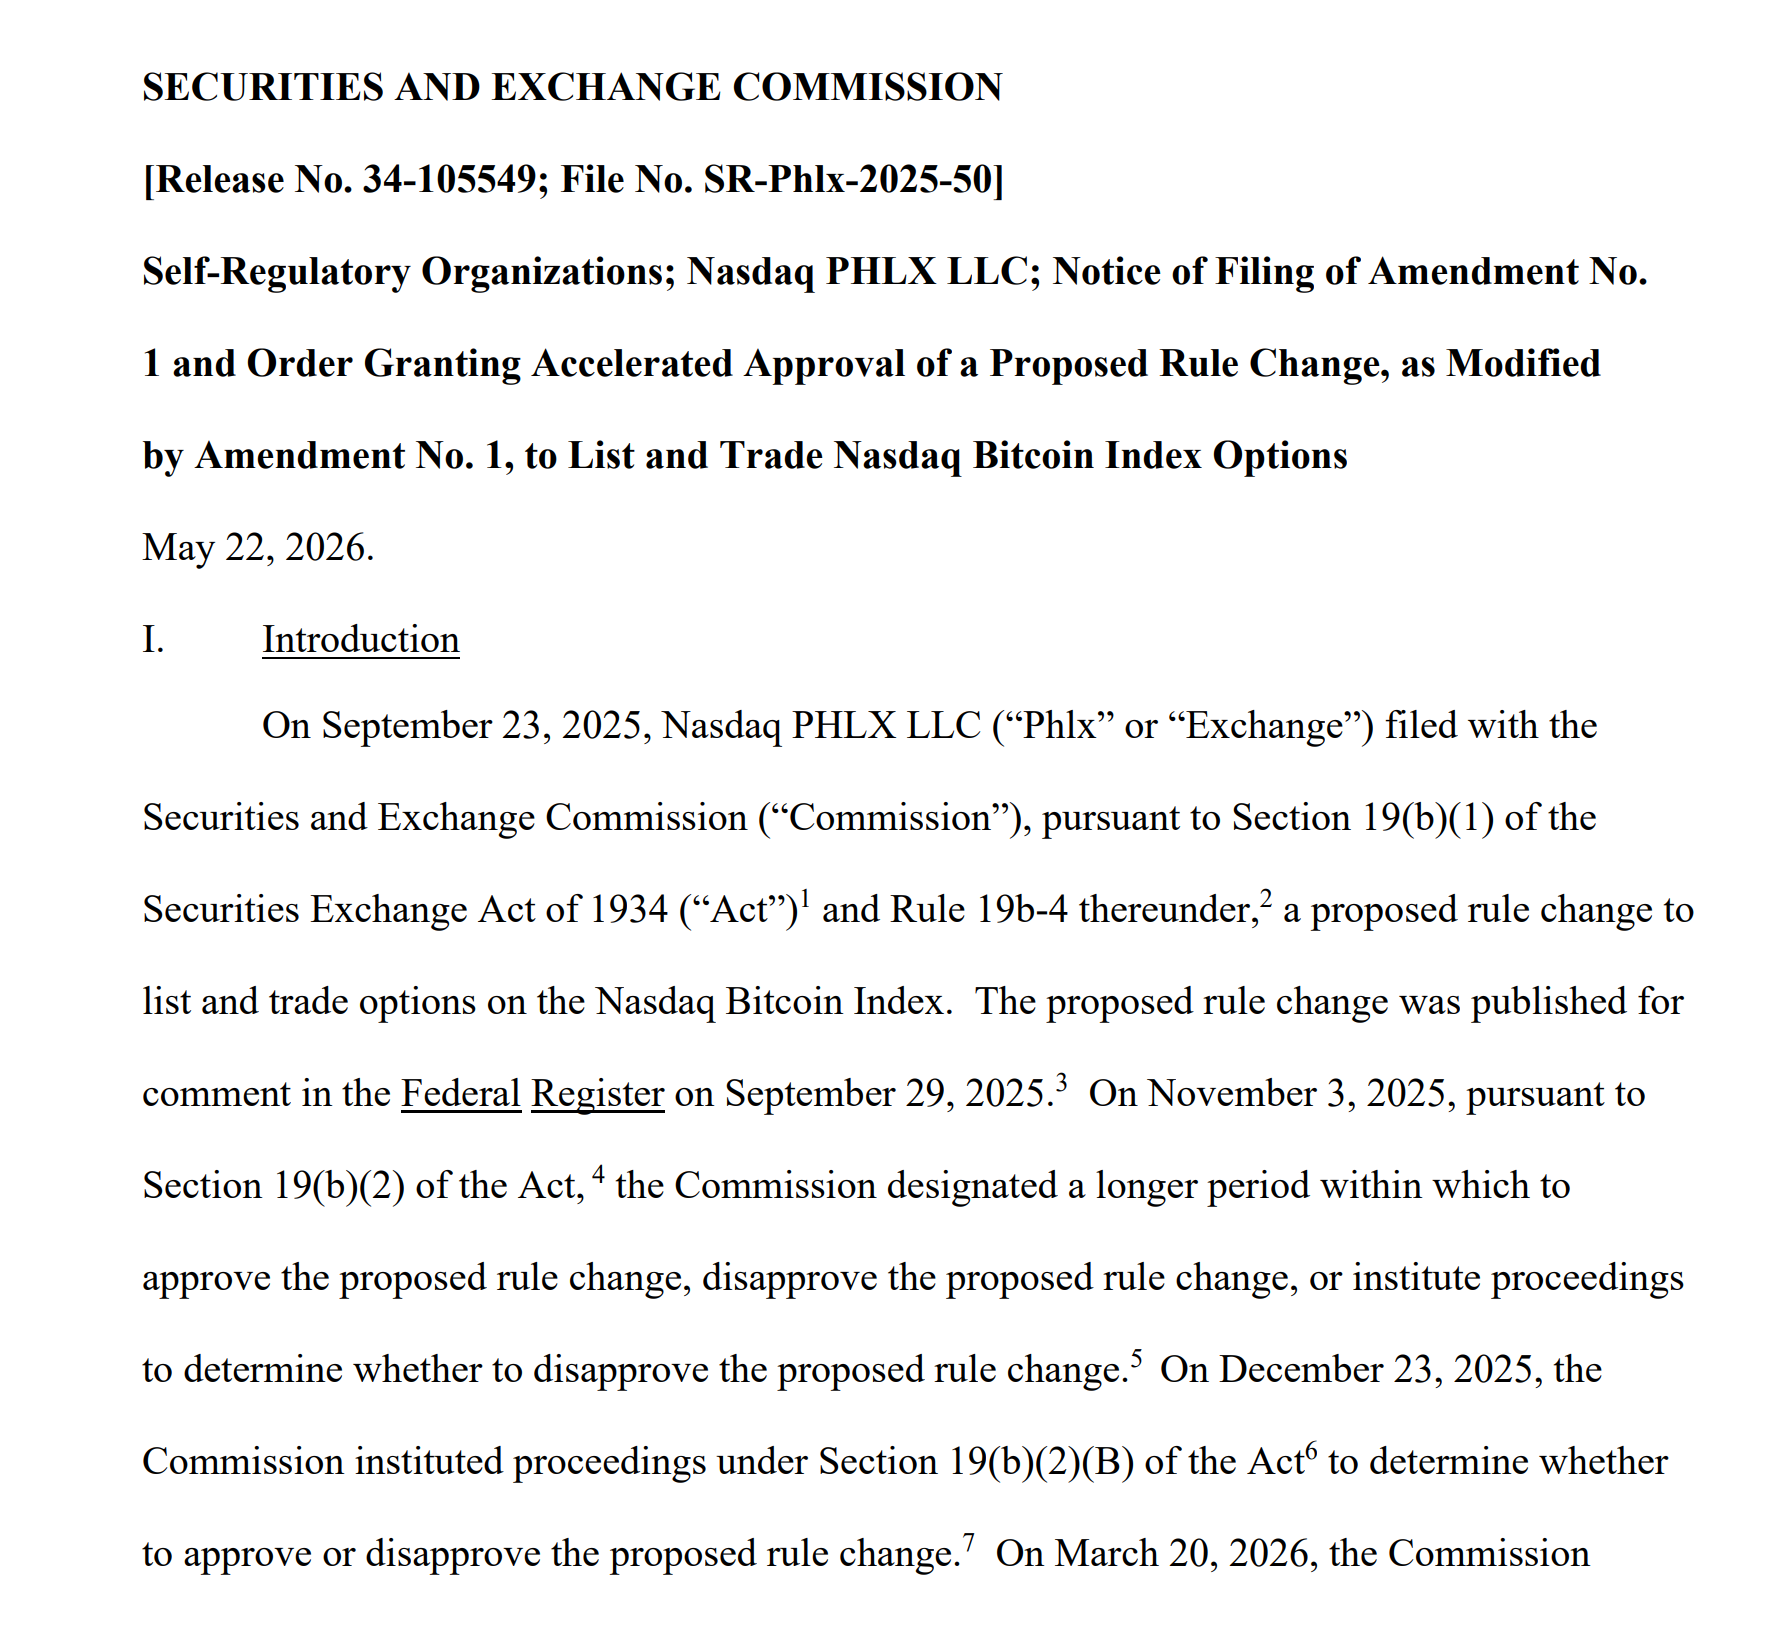
The Securities and Exchange Commission has approved Nasdaq’s proposal to list cash-settled Bitcoin index options on the Philadelphia Stock Exchange.
The options are European-style contracts tied to the Nasdaq Bitcoin Index, a benchmark that tracks one one-hundredth of the CME CF Bitcoin Real Time Index, which updates with data from major cryptocurrency exchanges every 200 milliseconds. The approval was granted on an accelerated basis and published Friday on the SEC’s website.
The new contracts are cash-settled, meaning holders receive the difference between the Bitcoin spot price and the strike price at expiration. Unlike options on spot Bitcoin ETFs, there is no physical Bitcoin involved and no risk of early assignment, offering traders an alternative way to bet on the price of the cryptocurrency.
Source: SEC
The contracts will trade under the ticker QBTC on Phlx, with a minimum increment of $0.01 and a position limit of 24,000 contracts per side, equivalent to roughly 0.12% of Bitcoin’s outstanding supply, the SEC noted in its order.
Related: $1.26B Bitcoin ETF outflows spark ‘contrarian’ buy signal: Santiment
CFTC approval still needed
Despite the SEC green light, the options cannot begin trading until the Commodity Futures Trading Commission grants its own exemptive relief due to Bitcoin’s classification as a commodity, which falls under the CFTC’s jurisdiction.
CME Group, which has offered Bitcoin futures options since 2020, filed a comment letter in October last year arguing the contracts fall under CFTC’s exclusive jurisdiction. In the filing, the SEC noted that Section 717 of the Dodd-Frank Act is not limited to “novel derivative products” and allows for concurrent jurisdiction between the SEC and CFTC when the latter grants exemptive relief.
“The concept of shared jurisdiction between the Commission and the CFTC is not new,” the SEC wrote in the filing, citing existing examples such as mixed swaps and security futures.
Related: Nasdaq and S&P 500 Closed At Record Highs as Tech Stocks Rallied
SEC grows more crypto-friendly
The SEC, under Chairman Paul Atkins, is moving toward a more crypto-friendly regulatory posture. Atkins has moved to drop several high-profile enforcement cases against crypto firms that were initiated under the previous administration, and has publicly called for clearer regulatory frameworks that encourage innovation rather than stifle it.
As Cointelegraph reported, the agency is preparing an “innovation exemption” that would allow blockchain-based tokenized trading of public company shares on decentralized crypto platforms, even without the consent of the companies being tracked.
Magazine: Guide to the top and emerging global crypto hubs — Mid-2026

US President Donald Trump took it to his social media platform Truth Social to declare that oil has begun flowing, jobs are at record levels, and prices in the US are dropping, which will increase affordability.
While there are some controversies about the last few statements, oil prices are indeed dropping now, with USOIL dipping below $73 per barrel.

Today’s decline to $73 and just under it means that USOIL has dropped by roughly 40% since the peak after the war broke out at almost $120 per barrel. However, its price is yet to reach the lows before the US and Israel started the war against Iran.
Trump also said Iran “can never have a nuclear weapon,” which will make the world safer, as part of the Iran-US deal that is reportedly agreed to, but it’s still not signed.
The POTUS also bragged that the “stock markets are roaring, jobs are at records, and prices are dropping (affordability). He explained that the US is “strong, safe, and respected like never before.” He ended his statement with, “YOU’RE WELCOME!”
It’s worth noting that the US CPI numbers for the past two months hit multi-year highs, so the decline in prices and rising affordability have yet to be proven. The US stock market is close to its record level, but not quite there.
Bitcoin’s price, on the other hand, has followed USOIL’s path south in the past 24 hours. Yesterday’s decline was mostly attributed to the US Fed refusing to change the rates and the new Chairman’s hawkish stance.
Today, though, BTC dipped once again to $63,600 after Trump’s statement went live. Although it rebounded to $64,200 immediately, it was stopped once again and now sits well below $64,000.
The post Trump Says ‘You’re Welcome’ as Oil Is Flowing and Prices Are Dumping appeared first on CryptoPotato.


U.S. regulators have proposed requiring certain payment stablecoin issuers to verify customer identities under a new rule issued as part of the GENIUS Act framework.
Summary
- U.S. regulators have proposed requiring certain payment stablecoin issuers to adopt customer identification programs similar to those used by banks and credit unions.
- The proposed GENIUS Act rule would require issuers to verify customer identities while treating permitted payment stablecoin issuers as financial institutions under the Bank Secrecy Act.
- Regulators said secondary market stablecoin transactions generally would not trigger customer identification requirements, limiting the rules to direct relationships between issuers and customers.
The Federal Reserve Board said Thursday that it is seeking public comment on a joint proposal that would require covered stablecoin issuers to maintain effective Customer Identification Programs, or CIPs.
The proposal was issued alongside the Financial Crimes Enforcement Network, the Federal Deposit Insurance Corporation, the Office of the Comptroller of the Currency, and the National Credit Union Administration.
An 117-page notice published by the agencies said the rule would implement provisions of the Guiding and Establishing National Innovation for U.S. Stablecoins Act, known as the GENIUS Act. The proposal would formally treat permitted payment stablecoin issuers as financial institutions under the Bank Secrecy Act and require them to maintain customer identification procedures.
Comments on the proposal will be accepted for 60 days after publication in the Federal Register.
Rule would apply bank style identity checks to stablecoin issuers
The agencies said permitted payment stablecoin issuers would need to collect and verify customer information before opening an account relationship. Required information would generally include a customer’s name, address, date of birth or formation, and identification number.
The proposal would require issuers to adopt risk-based procedures designed to establish a reasonable belief that they know the true identity of each customer. Regulators said those procedures should take into account an issuer’s size, business model, customer base, account types, and methods used to open accounts.
“This is the next step to ensure that permitted payment stablecoin issuers are fully integrated into Bank Secrecy Act regulations,” NCUA Chairman Kyle Hauptman said, adding that the proposal mirrors existing customer identification requirements used by credit unions and sets standards for identifying and verifying account holders.
“It sets clear standards for identifying and verifying account holders and safeguards the interests of credit unions and their members. By establishing robust customer identification requirements, we are reinforcing our commitment to preventing money laundering and terrorist financing in our financial system.”
The proposal follows earlier NCUA rulemakings related to payment stablecoins. The agency said it issued a proposed rule last month covering operational and risk management standards for licensed payment stablecoin issuers and released a separate proposal in February 2026 governing applications from issuers under its jurisdiction.
Regulators exclude most secondary market transactions
The proposed rule draws a distinction between direct dealings with a stablecoin issuer and transactions that occur elsewhere in the market.
Regulators said customer identification requirements would apply when a user establishes a formal relationship with a permitted payment stablecoin issuer through activities such as issuance, redemption, custody, reserve management, or other authorized services.
The agencies also proposed that simply holding or transferring a payment stablecoin would not create an account relationship with the issuer. The document states that secondary market activity, including transfers between users and transactions conducted through intermediaries, generally would not trigger customer identification obligations for the stablecoin issuer.
The agencies said applying customer identification requirements to every stablecoin transfer could be impractical because issuers often do not have direct relationships with users participating in secondary market transactions.
The proposal arrives days after a bipartisan group of U.S. senators urged the Treasury Department to preserve a role for state regulators under the GENIUS Act. In a June 16 letter to Treasury Secretary Scott Bessent, lawmakers led by Senator Cynthia Lummis asked Treasury to provide clearer guidance on how states can obtain certification for their own stablecoin regulatory frameworks.
The GENIUS Act allows issuers with no more than $10 billion in outstanding stablecoins to operate under certified state regulatory regimes. The customer identification proposal states that its requirements would apply not only to federally supervised issuers but also to stablecoin issuers operating under eligible state frameworks established under the law.
Crypto World
International Business Machines (IBM) Stock Slides 4% Following Accenture Revenue Warning

Key Takeaways
- IBM shares declined more than 4% in Thursday’s premarket session following Accenture’s reduced fiscal 2026 revenue outlook
- Accenture revised its annual sales forecast to $71.76B–$72.46B, lowering the previous upper target of $73.16B
- Despite Accenture posting Q3 EPS of $3.80 that surpassed projections, its $18.7B quarterly revenue fell short of the $18.745B analyst forecast
- According to GF Value metrics, IBM trades at approximately 9.9% above fair value at $262.35, carrying a GF Score of 78/100
- IBM’s Q2 financial results are scheduled for release on July 22, with Wall Street projecting $3.00 EPS and $17.85B in revenue
Shares of International Business Machines experienced a significant decline Thursday morning after Accenture revised downward the upper limit of its fiscal 2026 revenue forecast, creating headwinds across the IT services industry.
International Business Machines Corporation, IBM
IBM’s premarket price stood at $251.01, reflecting a 4.32% decline for the session. The stock had previously closed at $262.35 on June 17, marking a 3.1% drop from the day before.
The downturn wasn’t the result of IBM-specific developments. Rather, market participants reacted to Accenture’s adjusted financial projections.
Accenture tightened its annual revenue forecast to between $71.763 billion and $72.460 billion, reducing the prior high-end estimate of $73.157 billion. Market analysts had anticipated $74.006 billion for the full year.
This type of forecast adjustment typically creates downstream effects among industry competitors — and IBM became a casualty of that sector-wide pressure.
From a profitability standpoint, Accenture exceeded expectations on earnings. The company delivered Q3 diluted EPS of $3.80, surpassing the $3.69 analyst estimate. However, quarterly revenue of $18.700 billion narrowly missed the $18.745 billion consensus figure, and the forward-looking guidance adjustment triggered the sector weakness.
Accenture CEO Julie Sweet highlighted robust artificial intelligence demand, citing 104 client agreements worth $100 million or more year-to-date through Q3, representing 13% growth. The firm also revealed intentions to acquire majority ownership in Dragos while purchasing runZero and NetRise outright, expanding its operational technology cybersecurity capabilities.
IBM’s Q2 Financial Release Approaches on July 22
IBM’s quarterly financial disclosure is set for July 22. Wall Street consensus calls for EPS of $3.00 alongside revenue of $17.85 billion for the second quarter.
During Q1, IBM delivered EPS of $1.91, exceeding the $1.81 projection. Revenue reached $15.92 billion, topping the $15.66 billion consensus estimate. This performance extended IBM’s streak of surpassing EPS forecasts to eight consecutive quarters — a pattern investors will monitor closely in the upcoming report.
Current Valuation Analysis
GuruFocus estimates IBM’s GF Value at $238.63, indicating the stock traded at approximately a 9.9% premium relative to this fair value calculation when priced at $262.35.
IBM’s present P/E ratio of 23.2x registers modestly below its five-year median of 24.4x. The forward-looking P/E stands at 21.1x.
The company’s GF Score of 78/100 indicates above-average positioning versus industry peers, with profitability representing the strongest metric at 8/10. Financial strength registers at 5/10, while momentum scores 4/10 — the latter aligning with Thursday’s negative price action.
Notably, insider transaction records show zero activity over the preceding three-month period.
IBM’s 52-week trading range spans from $212.34 to $332.46, positioning Thursday’s premarket level of $251.01 in the lower portion of that spectrum.
The next significant market-moving event for IBM arrives on July 22.


Bitcoin lending platform Ledn has expanded its services to include Tether Gold (XAUt), allowing investors to hold the tokenized asset and borrow against it in much the same way they can borrow against Bitcoin.
Ledn announced Thursday that clients can use XAUt as collateral for loans instead of selling their holdings for cash. Under the company’s existing lending model, client collateral is held one-to-one and is not rehypothecated, lent out or used to generate yield.
Loans are issued and repaid in Tether’s USDT or USAt stablecoins and can be repaid at any time without scheduled monthly payments. Tether launched USAt in the United States in January as a stablecoin designed to comply with the GENIUS Act.
The launch expands the range of digital assets that can be used as loan collateral, giving investors another way to access liquidity without triggering a taxable sale. While Bitcoin-backed lending has become a common feature of the crypto market, the addition of tokenized gold reflects growing efforts to bring real-world assets into digital asset financial services as gold prices hover near record highs.
The new products are rolling out across most jurisdictions where Ledn operates but are not currently available in Canada or the European Union.
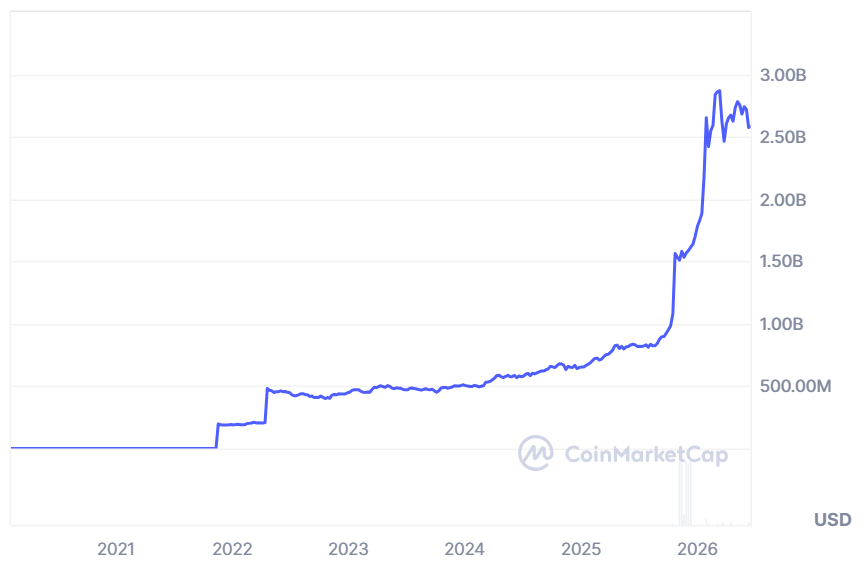
The market capitalization of Tether Gold peaked at around $2.89 billion. Source: CoinMarketCap
Related: Tether makes $150M investment in Gold.com in latest gold play
Tokenized commodities gain traction in RWA market
The announcement comes as commodities play an increasingly prominent role in the tokenization market. According to a recent Token Terminal report, tokenized financial assets have surpassed $43 billion, with commodities accounting for nearly 17% of the market.
Unlike commodity derivatives and futures, tokenized assets such as gold are backed by the underlying asset, giving holders direct ownership while enabling faster transfers and trading on blockchain networks.
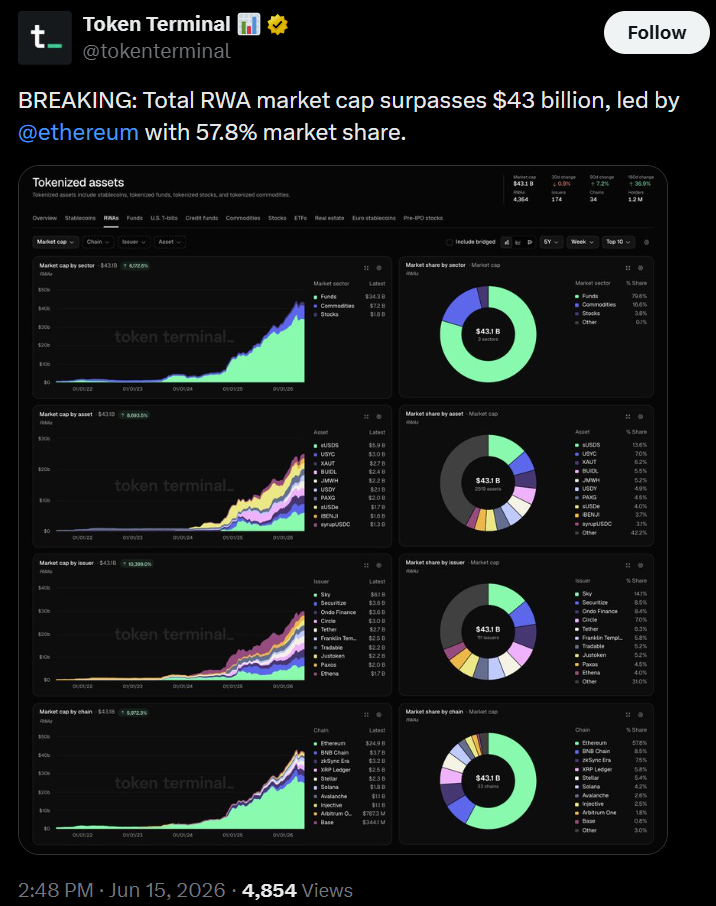
Commodities account for a bigger share of the tokenization market.
Source: Token Terminal
Tether Gold benefited from this year’s rally in bullion prices, with the token’s market capitalization expanding as gold climbed to record highs above $5,600 per troy ounce. The precious metal has since pulled back to around $4,300 an ounce but remains up on the year.


Google, for example, has warned organizations to begin preparing for the transition to post-quantum cryptography and has been integrating quantum-safe cryptographic standards into parts of its infrastructure with a 2029 completion target. The U.S. National Institute of Standards and Technology (NIST) has been leading efforts to standardize post-quantum algorithms and has set timelines for the eventual retirement of certain legacy cryptographic systems.
Within crypto, several major ecosystems have elevated quantum preparedness as a strategic priority. The Ethereum Foundation earlier this year announced a dedicated post-quantum security initiative aimed at researching migration paths for blockchain’s vast ecosystem of wallets, applications and validators. Solana developers likewise published proposals exploring how users and the network could transition to quantum-resistant cryptography if the threat becomes more immediate.
The Algorand Foundation noted that blockchain networks need to begin making preparations well before a so-called “Q-Day,” the hypothetical moment when a quantum computer becomes capable of breaking the cryptography currently used to secure digital assets.
The foundation said its roadmap builds on work it began in 2022, extending those efforts to the rest of the protocol, with the goal of achieving what Algorand describes as broad quantum resilience by the end of 2027. The foundation said it expects to reach that milestone before NIST retires certain legacy cryptographic standards and three years ahead of a timeline set by the U.S. National Security Agency for national security systems.


- Solana price sits at around $71 with strong resistance at $75.95.
- Indicators and EMAs show a bearish market trend.
- Weekly gains contrast with weak momentum and extreme fear sentiment.
Solana price continues to trade in a tight range around the low $70s, with the asset struggling to reclaim the $72 level.
At the time of writing, SOL was trading near $71.26, after a mild 24-hour decline of about 0.7%.
Despite a stronger weekly rebound of roughly 10%, the broader market pattern still shows clear resistance overhead and weakening momentum across multiple technical indicators.
Over the past 24 hours, the Solana price has remained trapped between $70.69 and $74.24, without a decisive trend forming.
Technical structure still favours sellers
Looking at the charts, Solana (SOL) remains under pressure from a layered resistance structure formed by major moving averages.
Recent price movements show that SOL has only managed to reclaim the 10-day exponential moving average (EMA), while the 20-day, 50-day, 100-day, and 200-day EMAs are all positioned above the current price level.

This configuration confirms that the broader trend remains bearish, as rallies continue to encounter resistance before reaching higher momentum zones.
The most immediate technical barrier is located at $75.95, a level that must be cleared to signal a potential shift in trend direction.
If this level is broken, projections place the next resistance at $83.32.
On the downside, structural support is clearly defined at $62.40.
A breakdown below $62.40 would expose the Solana price to deeper losses, extending the current corrective phase and potentially triggering accelerated selling pressure.
Notably, the daily Relative Strength Index (RSI) is positioned at 44.38, reflecting a neutral condition and suggesting indecision in short-term price direction.
However, the weekly RSI has dropped to around 33.07, placing it near the oversold territory and signalling that while selling pressure has been persistent over a longer timeframe, we could see some bullish recovery soon.
The overall market sentiment remains weak
Sentiment conditions continue to reflect caution across the broader market.
The Fear and Greed Index is positioned near 15, a level typically associated with extreme fear.
Such an environment often coincides with defensive positioning, reduced risk appetite, and lower conviction in upward price movements.
Derivative market data also supports this cautious outlook, with the funding rates remaining negative in recent sessions, while short positioning has increased relative to long exposure.

In addition, the long-to-short ratio has remained below equilibrium levels, indicating that traders are still leaning toward downside protection rather than sustained bullish positioning.
At the same time, Solana has recorded modest institutional inflows, including small allocations into Solana ETFs totalling just over $1 million.

However, these inflows remain limited in size and have not been sufficient to offset broader bearish positioning in derivatives markets.

Key Highlights
-
CoinMENA partners with Standard Chartered for enhanced UAE fiat payment infrastructure
-
Partnership improves funding channels, settlement mechanisms, and operational clarity
-
Standard Chartered broadens services to licensed UAE digital asset platforms
-
CoinMENA strengthens client fund safeguards through enhanced banking infrastructure
-
UAE digital asset platforms increasingly compete on regulated fiat access and settlement quality
The UAE’s digital asset sector has secured another significant banking partnership as CoinMENA announced collaboration with Standard Chartered for fiat payment infrastructure. This arrangement enhances local currency accessibility for platform users and verified partners. The development demonstrates how banking relationships increasingly influence competitive dynamics among licensed digital asset platforms.
CoinMENA Enhances Fiat Payment Infrastructure
Through this partnership, CoinMENA will leverage Standard Chartered’s banking systems to facilitate fiat entry and exit points across the UAE. The platform will implement protected client fund accounts alongside virtual account-based payment mechanisms. Consequently, users can expect improved visibility into funding movements and enhanced settlement workflows.
This collaboration provides CoinMENA with more robust banking foundations as digital asset oversight continues developing throughout the region. The arrangement enables accelerated funding processes, improved transaction monitoring, and enhanced clarity for authorized counterparties. Accordingly, this partnership extends beyond simple payment access to deliver comprehensive operational infrastructure.
CoinMENA functions within an ecosystem where fiat connectivity remains critical for crypto platforms. While users engage with digital assets through blockchain networks, exchanges require traditional banking for local currency operations. Consequently, dependable banking partnerships enhance platform credibility, market liquidity, and user satisfaction.
Standard Chartered Expands Support for Licensed Digital Asset Platforms
Standard Chartered’s involvement illustrates how established financial institutions can facilitate regulated digital asset operations without directly operating trading venues. The institution will deliver payment processing and account management infrastructure rather than proprietary cryptocurrency trading platforms. This model enables banks to participate in sector expansion while maintaining distinct operational frameworks.
The UAE has developed among the region’s most dynamic digital asset ecosystems through comprehensive licensing frameworks and regulatory oversight. Authorities have enabled virtual asset service providers, payment processors, stablecoin initiatives, and financial technology operators. Nevertheless, these enterprises require established banking relationships to achieve meaningful scale.
CoinMENA benefits from this evolution because regulated infrastructure now carries equal importance to platform capabilities. Robust fiat connectivity enables exchanges to accommodate retail customers, high-net-worth individuals, and institutional participants. Simultaneously, Standard Chartered reinforces its presence within UAE digital finance infrastructure development.
UAE Digital Finance Landscape Grows More Competitive
The CoinMENA partnership emerges as additional fintech operators advance their UAE market strategies. Revolut recently obtained Stored Value Facilities and Retail Payment Services authorizations from the UAE Central Bank. These regulatory approvals position the company toward potential market entry.
Revolut intends to deliver multi-currency accounts, payment cards, domestic transactions, and cross-border transfers within a unified application. Its market presence could intensify competition across payments and international money movement. However, these licenses do not necessarily indicate authorization for virtual asset trading activities within the UAE.
CoinMENA advances into this competitive environment equipped with strengthened bank-supported infrastructure for fiat operations. The partnership demonstrates how digital asset platforms require robust compliance frameworks, settlement systems, and client fund governance to achieve sustainable growth. Ultimately, UAE digital finance increasingly depends on regulated infrastructure rather than speculative market momentum.

France-listed Bitcoin treasury company Capital B’s shareholders approved authorizations allowing the company to raise up to 105 billion euros ($120.4 billion) to fund future Bitcoin purchases.
Over 95% of shareholders approved the establishment of up to 5 billion euros in capital increases, equivalent to as many as 125 billion new shares at the current nominal value, as well as the issuance of up to 100 billion euros in credit instruments, Capital B announced on Wednesday.
The company said the issuance of the new capital instruments will “accelerate its Bitcoin accumulation strategy, focused on increasing the number of Bitcoin per fully diluted share over time.”
During its general meeting on Wednesday, Capital B reported 300.65 million in total shares with voting rights. If fully exercised, issuing 125 billion in new shares would result in existing shareholders being diluted to about 0.24% of the company’s ownership.
Shareholders also approved changing the company’s name from The Blockchain Group to Capital B, aligning its corporate name with the commercial brand adopted in 2025.
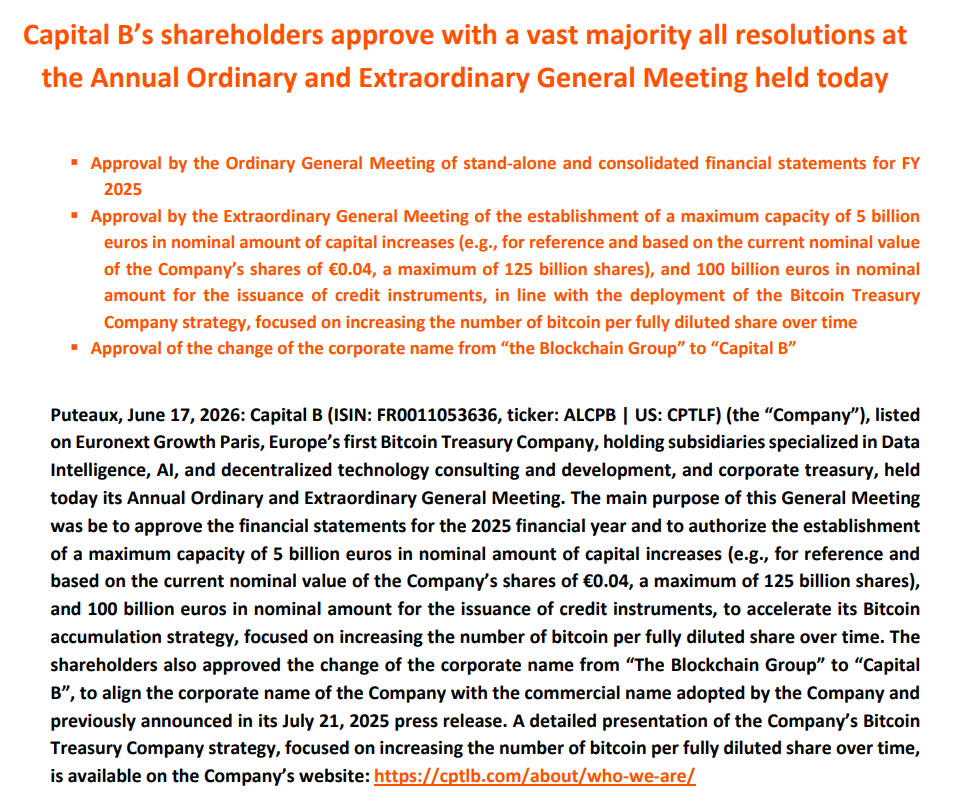
Source: Capital B
Capital B shares were little changed following the announcement, according to Yahoo Finance data.
Crypto treasury companies take different approaches
Capital B is Europe’s second-largest Bitcoin treasury company, holding 3,139 BTC, currently valued at $200 million. It ranks behind Germany-based Bitcoin Group SE, which holds 3,604 Bitcoin, currently worth $230 million, Bitcoin Treasuries data shows.
To date, Capital B said it raised about $325 million in capital, following its $17.8 million raise from strategic investors, including Blockstream CEO Adam Back and Paris-based asset manager TOBAM.
Related: Mystery Bitcoin burn destroys 107 BTC worth about $8.5M
The fundraising initiative contrasts with moves by some treasury companies to reduce or actively manage their Bitcoin exposure.
On May 28, France-based semiconductor company Sequans Communications said it had concluded its previously announced crypto treasury strategy. The company held 658 Bitcoin and said it would “monetize remaining holdings over time,” which led to a share price increase of about 14.5%.
Magazine: Bitcoin, the ‘canary in the coal mine,’ XRP transaction demand falls 91.5%: Market Moves
Crypto World
Ethereum News: ETH Developers Hit Near Record Highs Even as ETH Dumped Below $1,750, Is the Network Stronger Than the Price Suggests?

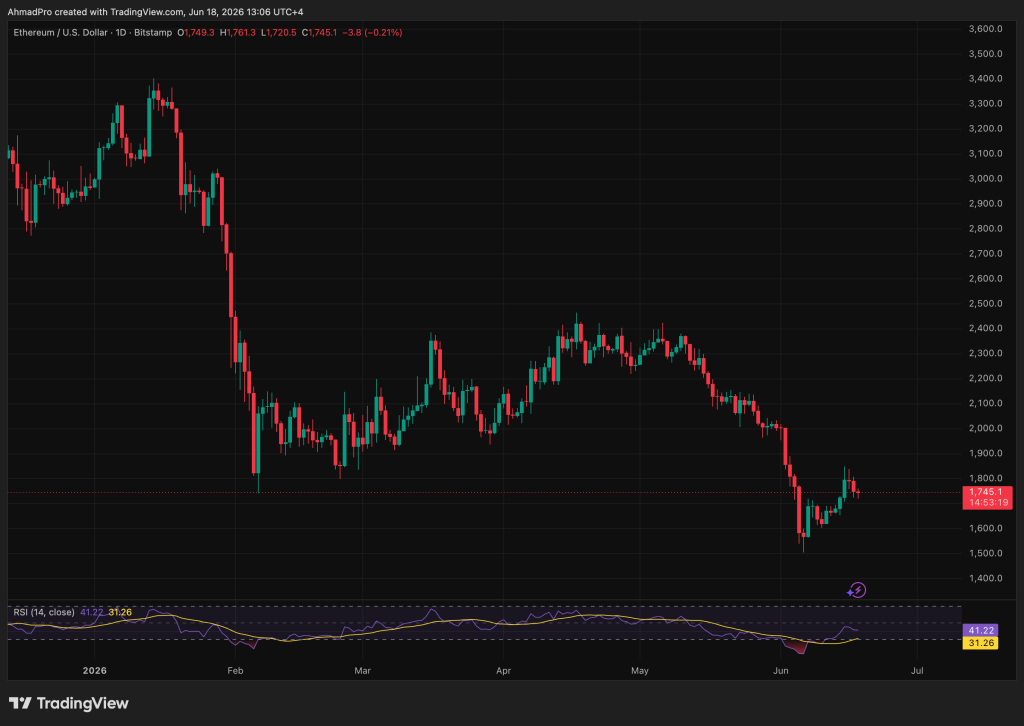
Ethereum News: ETH price is sitting near $1,750, down roughly 1.4% in the last 24 hours, and the bears are clearly running the short-term narrative.
But strip out the price action, and something more durable is happening underneath. Developer growth tells a story that the chart currently refuses to.
New developers building on Ethereum have climbed from approximately 30,000 in 2016 to nearly 140,000 in 2025, and crucially, that growth did not pause during the brutal drawdowns.
When ETH dropped 82% in 2018, roughly 77,000 new developers joined the network anyway. When ETH shed 68% in 2022, new developer additions hit approximately 139,000, one of the strongest cohort years on record.
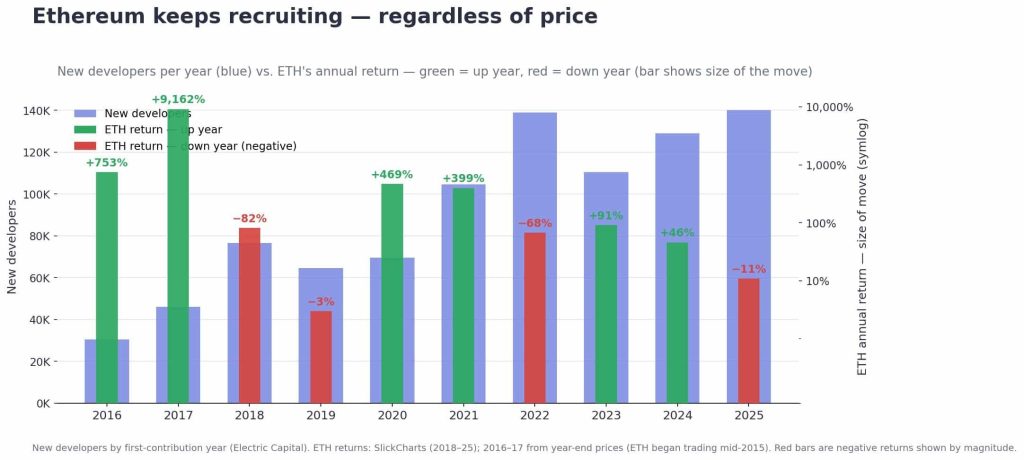
Even now, with ETH down around 11% year-to-date, developer intake remains close to that same 140K ceiling. Block production has also stabilized near the 7,000-blocks-per-day range since approximately 2023, regardless of where spot price traded.
The gap between price performance and network health is widening. That divergence is worth taking seriously before the next macro catalyst forces a re-rating. Upcoming protocol decisions and FOMC positioning will likely be the near-term triggers that determine which way that gap closes.
Ethereum News: Can ETH Price Reclaim $2,000 or Is a Drop to $1,500 the More Likely Path?
The technical setup is uncomfortable. ETH broke below a key demand zone, and Yahoo Finance’s technical analysis marks $1,700 as the line in the sand, with the path to $1,400 largely unobstructed if that level fails.
Overhead resistance compounds the problem. The 50-day EMA sits near $2,194 and the 200-day EMA near $2,510, and both have capped every recent bounce attempt.
If $1,700 holds as weekly support, macro sentiment stabilizes after FOMC, and ETH reclaims $2,000 within two to three weeks on renewed risk appetite.
However, if $1,700 fails on a daily close, derivatives pressure accelerates the slide toward $1,400-$1,500. Liquidation cascades, not fundamentals, have been the primary driver of recent drawdowns, the flush could move fast rather than gradual.
Standard Chartered and other institutional desks still hold constructive multi-year ETH price targets, which keeps the capitulation thesis incomplete until on-chain accumulation data turns materially bearish.
LiquidChain Could Replace Ethereum For Smart Traders In The Future and Here is Why
When Ethereum bleeds, it tends to flush speculative capital out of the broader ecosystem, and that capital often rotates into early-stage infrastructure plays with asymmetric upside profiles that large-cap ETH can no longer offer at current market cap.
The question is where that rotation lands. Whale accumulation patterns during ETH weakness suggest sophisticated money is positioning in infrastructure, not exiting crypto entirely.
LiquidChain (LIQUID) is an L3 infrastructure project positioning itself as a cross-chain liquidity layer that fuses Bitcoin, Ethereum, and Solana liquidity into a single execution environment.
The core proposition, deploy once, access all three ecosystems, directly addresses the fragmentation problem that costs Ethereum developers time and TVL every cycle.
Key architecture features include a Unified Liquidity Layer, Single-Step Execution, Verifiable Settlement, and a Deploy-Once Architecture designed to reduce cross-chain overhead.
The presale is currently priced at $0.01471 per $LIQUID with $852,080.07 raised to date. As with any early-stage presale, liquidity and execution risk are real — this is not a liquid position and vesting schedules matter.
That said, for traders who want infrastructure exposure without riding ETH’s current technical uncertainty, Visit LiquidChain’s full presale terms here.
The post Ethereum News: ETH Developers Hit Near Record Highs Even as ETH Dumped Below $1,750, Is the Network Stronger Than the Price Suggests? appeared first on Cryptonews.


Key takeaways
- While momentum indicators suggest downside pressure is easing, ETH remains trapped below multiple key moving averages.
- Until buyers reclaim resistance levels above $1,800, the broader technical outlook remains cautious, with support around $1,741 likely to play a crucial role in determining the next major move.
ETH Open Interest falls to a multi-week low
Ethereum (ETH) derivatives markets remain subdued following weeks of price weakness, reflecting a cautious stance among leveraged traders.
After ETH fell below the $1,800 level, futures open interest dropped sharply, reaching 13.64 million ETH on Sunday, its lowest level since early May.
Open interest saw a modest recovery on Monday after Ethereum rebounded above $1,700, but overall participation remains significantly lower than recent highs.
Open interest represents the total value of outstanding futures contracts. Since May 28, Ethereum futures markets have witnessed a decline of roughly 2 million ETH in open interest, highlighting a strong reduction in leveraged exposure and growing risk-off sentiment.
Funding rate data paints a similar picture of caution. Over the past two weeks, Ethereum funding rates have fluctuated between positive and negative territory, signaling a lack of clear conviction from either bulls or bears.
Funding rates are periodic payments exchanged between long and short traders in perpetual futures markets. Positive rates indicate bullish positioning, while negative rates suggest stronger bearish sentiment.
The market’s tone shifted notably after the June 5 correction, which pushed funding rates into negative territory following nearly a month of positive readings.
Although ETH has recovered modestly since then, bullish traders have struggled to regain control.
Spot-market indicators offer little evidence of aggressive accumulation. Ethereum exchange reserves have declined modestly over the past two days, reversing part of the increase recorded last week.
While falling exchange balances can sometimes indicate accumulation, the move remains too small to signal strong demand.
Ethereum price analysis: ETH trapped below key resistance
Ethereum continues to trade within a bearish short-term structure despite recent stabilization.
On the 4-hour chart, ETH remains below its 20-day EMA near $1,794, the 50-day EMA around $1,955, and the 100-day EMA near $2,108
The clustering of these moving averages above current price levels indicates that upside attempts continue to face significant resistance.
Although the broader trend remains bearish, some technical indicators suggest downside momentum may be easing.
The Relative Strength Index (RSI) has climbed toward the mid-50s, indicating selling pressure is weakening but not yet signaling a bullish reversal.
For Ethereum to build a stronger recovery, bulls must reclaim several important resistance zones.
Immediate resistance at $1,794 could pave the way for an extended rally towards the $1,806 and $1,909 psychological levels.
A sustained move above these levels would significantly improve Ethereum’s outlook.

On the downside, Ethereum faces several important support areas. If the bearish trend persists, immediate support is seen at the $1,524 level, with another demand zone at $1,405.
If selling pressure intensifies and these levels fail to hold, ETH could decline toward the next significant support area near $1,156.

UK drivers warned over facing fines for forgetting key dates
Trump Says ‘You’re Welcome’ as Oil Is Flowing and Prices Are Dumping

Jamie Lynn Spears Recalls Daughter Maddie’s Near Death Fight


-

 Business4 days ago
No Jackpot Winner as $257 Million Prize Rolls Over to $269 Million Monday Draw
-

 Fashion6 days ago
Weekend Open Thread: Tuckernuck – Corporette.com
-

 Crypto World7 days ago
Oppenheimer backs SpaceX as $70 billion retail frenzy builds
-

 Crypto World7 days ago
Markets Rally as SpaceX IPO Looms Amid Iran Tensions and Inflation Surge
-
Crypto World4 days ago
Zimbabwe Requires Crypto Businesses to Register Annually Under New FIU Regulations
-

 Crypto World5 days ago
Bitget enters Argentina’s regulated crypto market through PSAV registration
-

 Tech6 days ago
NanoClaw integrates JFrog registries to secure AI agent downloads
-

 Tech6 days ago
This Week In Security: Microsoft On Microsoft, Register Your Domains, Linux On ARM, And FreeBSD Joins The File Cache Club
-

 NewsBeat7 days ago
El Nino has formed in the Pacific and could set records, forecasters say
-
 Tech7 days ago
Dutton Ranch star claims they ‘didn’t see any disruption’ on set following Chad Feehan’s exit from Yellowstone spinoff fueled by Taylor Sheridan clash rumors
-
 Entertainment7 days ago
Donnie Wahlberg & More Heat Up Las Vegas at Circa’s Barry’s Downtown Prime
-
 Tech7 days ago
Opendoor Ends India Operations, Fueling a Bigger Conversation About AI and Outsourcing
-

 Politics7 days ago
Belfast burns, while Met chief points finger at Iran and Russia
-

 NewsBeat6 days ago
FBI searches office of Ohio voter registration group
-

 Business7 days ago
AT&T: Verizon's 27% Outperformance Sets Up A Solid Entry Point
-
 Tech7 days ago
Anthropic is spending $150M to embed 1,000 AI fellows inside nonprofits. No degree required.
-

 Politics7 days ago
Modi thanks Trump for wishes as US attacks Indian seafarers
-
 Entertainment7 days ago
‘The Pitt’s Fan-Favorite Doctor Confirms Noah Wyle Gave His Blessing to Return [Exclusive]
-
 Crypto World6 days ago
Ripple and Bitso Bring MXNB Stablecoin to XRP Ledger
-

 Tech7 days ago
Klipsch Heritage First Listen at High End Vienna 2026: Rebellion, OJAS and Klipschorn Bring the Horns
You must be logged in to post a comment Login