
Crypto World
Solana price forms symmetrical triangle amid MACD cross

Solana price is at $83.37 on April 14, down 3.63% on the session, as a symmetrical triangle formed on the daily chart over the past two months continues to compress price action toward its apex. A daily MACD bullish crossover has now printed inside the pattern, adding a momentum signal to a setup that traders and analysts are watching closely for directional resolution.
Summary
- Solana price is trading at $83.37 on April 14, down 3.63% on the session, as a symmetrical triangle forms on the daily chart with converging trendlines connecting the February highs near $110 and the February lows near $67.
- The daily MACD (12,26,9) has printed a bullish crossover with the histogram positive at 0.45, confirming improving momentum inside the triangle while both lines remain below zero.
- A triangle breakout above the SMA 50 at $85.61 opens a path toward $98.42; a daily close below $80 invalidates the bull case and exposes the lower trendline near $76.
Solana (SOL) price is trading at $83.37 on April 14 with 24-hour volume of $6.28 billion, as a symmetrical triangle tightens on the daily chart. The pattern has been compressing price since mid-February, with the upper descending trendline connecting the February highs and the lower ascending trendline running from the cycle lows. The MA ribbon sits entirely above price: SMA 20 at $82.74, SMA 50 at $85.61, SMA 100 at $98.42, and SMA 200 at $129.44, all acting as sequential overhead resistance. The MACD crossover inside the triangle narrows the window before a directional resolution is forced by the apex.
The symmetrical triangle on the daily chart is defined by two converging trendlines that reflect a standoff between sellers applying progressively lower resistance and buyers establishing a higher floor from the February lows. The pattern has been building since mid-February, with price oscillating inside the boundaries through the Iran-driven volatility in March and into April. Price is now within striking distance of the apex, where a breakout or breakdown is typically accelerated by the energy stored in the compression.
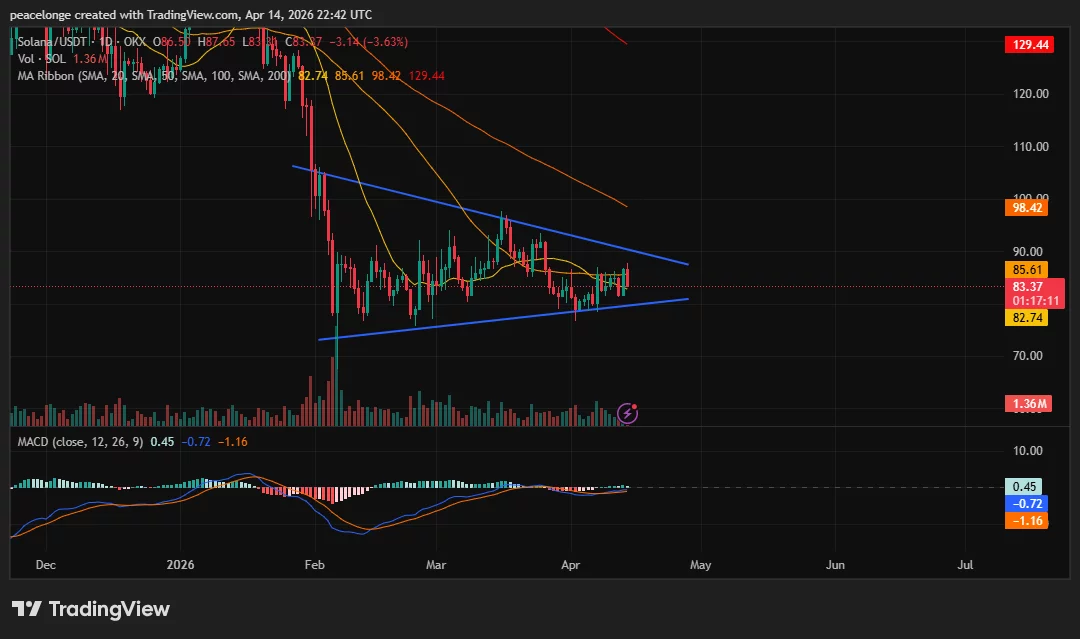
The MACD (12,26,9) has printed a bullish crossover inside the triangle, with the MACD line at -0.72 crossing above the signal at -1.16 and the histogram expanding to a positive 0.45. Both lines remain below zero, which limits the strength of the signal, but the expanding positive histogram confirms that sellers are losing control of momentum. Symmetrical triangles resolved with a MACD crossover in the direction of the breakout have historically carried higher follow-through rates than pattern breakouts occurring on flat momentum.
A CoinMarketCap markets update on April 14 noted that analysts see $108 as the next major target for SOL if momentum holds above $87, with bulls defending the $80 structural floor. The same update flagged Solana’s total economic activity reaching $1.1 trillion in Q1 2026, a 6,558% increase from the prior quarter, as evidence that the network fundamentals are decoupled from the current price structure.
Key Levels: Support, Resistance, and Price Targets
The SMA 20 at $82.74 is the immediate support and the level price must hold on a daily close basis to avoid slipping into the lower trendline near $80. A daily close below the lower trendline near $76 would break the ascending floor of the symmetrical triangle and shift the bias decisively bearish.
On the upside, the SMA 50 at $85.61 is the immediate resistance and the level a confirmed triangle breakout must clear on a daily close basis to attract follow-through buying. A close above $85.61 opens $98.42 as the next resistance, where the SMA 100 sits. The extended bull case, consistent with the symmetrical triangle measured target using the pattern’s widest point, points toward $108 to $110.
Invalidation: a daily close below $80.
On-Chain and Market Data Context
Solana open interest stands at $5.01 billion per Coinglass, with futures volume reaching $10.98 billion in the past 24 hours. The elevated futures volume relative to spot activity of $630 million confirms that derivatives participants are the dominant force at the current price level, and the symmetrical triangle breakout direction is likely to be amplified by a cascade of positions on the wrong side of the move. Approximately $8.1 million in Solana futures positions were liquidated in the same 24-hour window.
Bloomberg Intelligence analyst James Seyffart noted in March that roughly 30 institutional investors had accumulated approximately $540 million in Solana ETF exposure, led by Electric Capital and Goldman Sachs, providing a structural demand floor at current levels even as price action remains technically compressed.
If Solana holds $82.74 on a daily close basis and the MACD histogram continues to expand, a test of the SMA 50 at $85.61 becomes the nearterm base case. A confirmed daily close above it would trigger the symmetrical triangle breakout and open $98.42 as the primary target, with $108 as the extended objective.

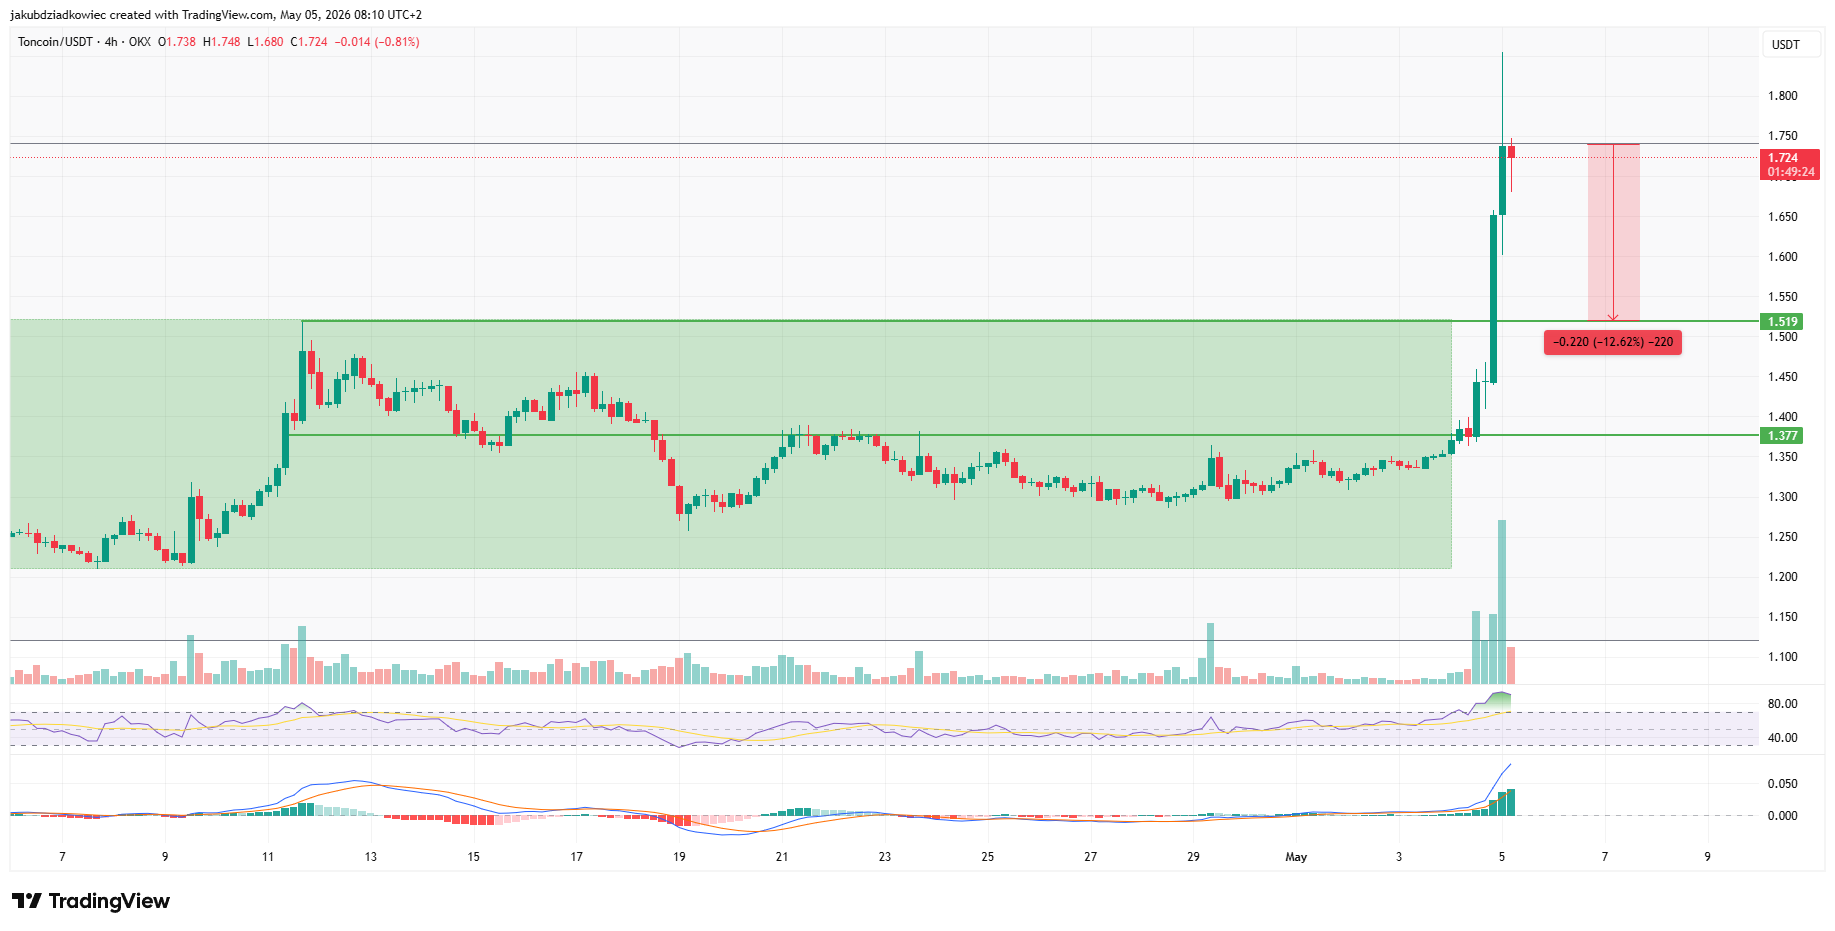
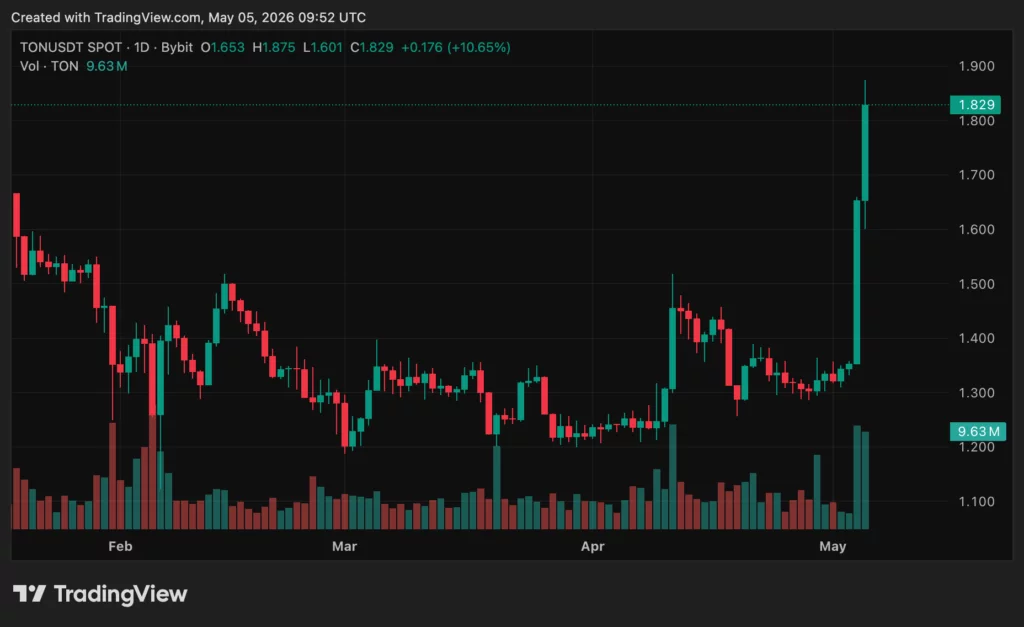
Toncoin (TON) price has broken out of a four-month accumulation zone, climbing above $1.74 on May 5. The move follows Telegram’s confirmation that it will replace the TON Foundation as the network’s largest validator.
The breakout tags the 0.236 Fibonacci retracement of the August 2025 to February 2026 decline. Daily volume printed its largest expansion in seven months.
Daily Chart Confirms Breakout From Long-Standing Range
The daily chart shows Toncoin inside a tight accumulation zone between $1.20 and $1.55 since the start of the year. That four-month consolidation followed a steep January selloff. Whales steadily added positions despite weak market sentiment.
The May 5 candle closed above the zone’s upper boundary and pushed the price to $1.74. That level corresponds to the 0.236 Fibonacci retracement of the August 2025 to February 2026 decline. The retracement spans from a $3.75 swing high down to the $1.26 February low.
Volume tells the story behind the move. Daily volume had been trending lower since October 2025. The breakout candle printed the largest green bar in roughly seven months. Such expansion typically validates a structural shift rather than a short squeeze.

The relative strength index on the daily timeframe pushed deep into overbought territory. It broke above 70 for the first time since February. Sustained RSI readings above 70 are common during early-stage breakouts and rarely resolve as immediate reversals.
Volatility is also expanding sharply. The Bollinger Band Width Percentile is printing extreme red readings. That signals compression has ended, and a directional move is underway.
Toncoin’s price action aligns with broader strength across the crypto market. Bitcoin posted a 3% session gain. TON’s 27% intraday move shows the altcoin outperforming peers.
Toncoin Price Prediction Points to $1.52 Retest Before $2.74 Target
The four-hour chart confirms the daily breakout with even sharper momentum signals. RSI on this timeframe sits near 90.
Such extreme readings historically resolve with a brief cooldown rather than an immediate reversal. The MACD histogram is printing taller green bars on each candle, indicating that momentum is still accelerating.
A pullback would not invalidate the bullish setup. The first support sits at $1.52, the upper boundary of the accumulation zone. Deeper support waits at $1.38, the mid-range from which the rally launched.
A successful retest of $1.52 would offer a higher-conviction entry than chasing the current move.
If buyers defend the breakout, the next upside target sits just below the 0.382 Fibonacci retracement at $2.12. The second target lies at the 0.618 Fibonacci retracement of $2.74, roughly 60% above the current price.

The fundamental backdrop supports continuation. Pavel Durov confirmed Telegram staked 2.2 million TON to become the network’s largest validator on April 30. A May 1 protocol upgrade slashed transaction fees roughly sixfold to about $0.0005.
Durov’s MTONGA roadmap aims to position TON as a near-feeless settlement layer for the messenger’s user base. That exclusivity gives traders a structural reason to view dips as buying opportunities rather than topping signals.
A close below $1.38 would invalidate the breakout thesis. Holding above that level keeps the path toward $2.74 open.
The post Toncoin Explodes 27% After Telegram Bets 2.2 Million TON on Itself appeared first on BeInCrypto.
Crypto World
Crypto platform Bullish to buy transfer agent Equiniti for $4.25 billion, building tokenized securities infrastructure
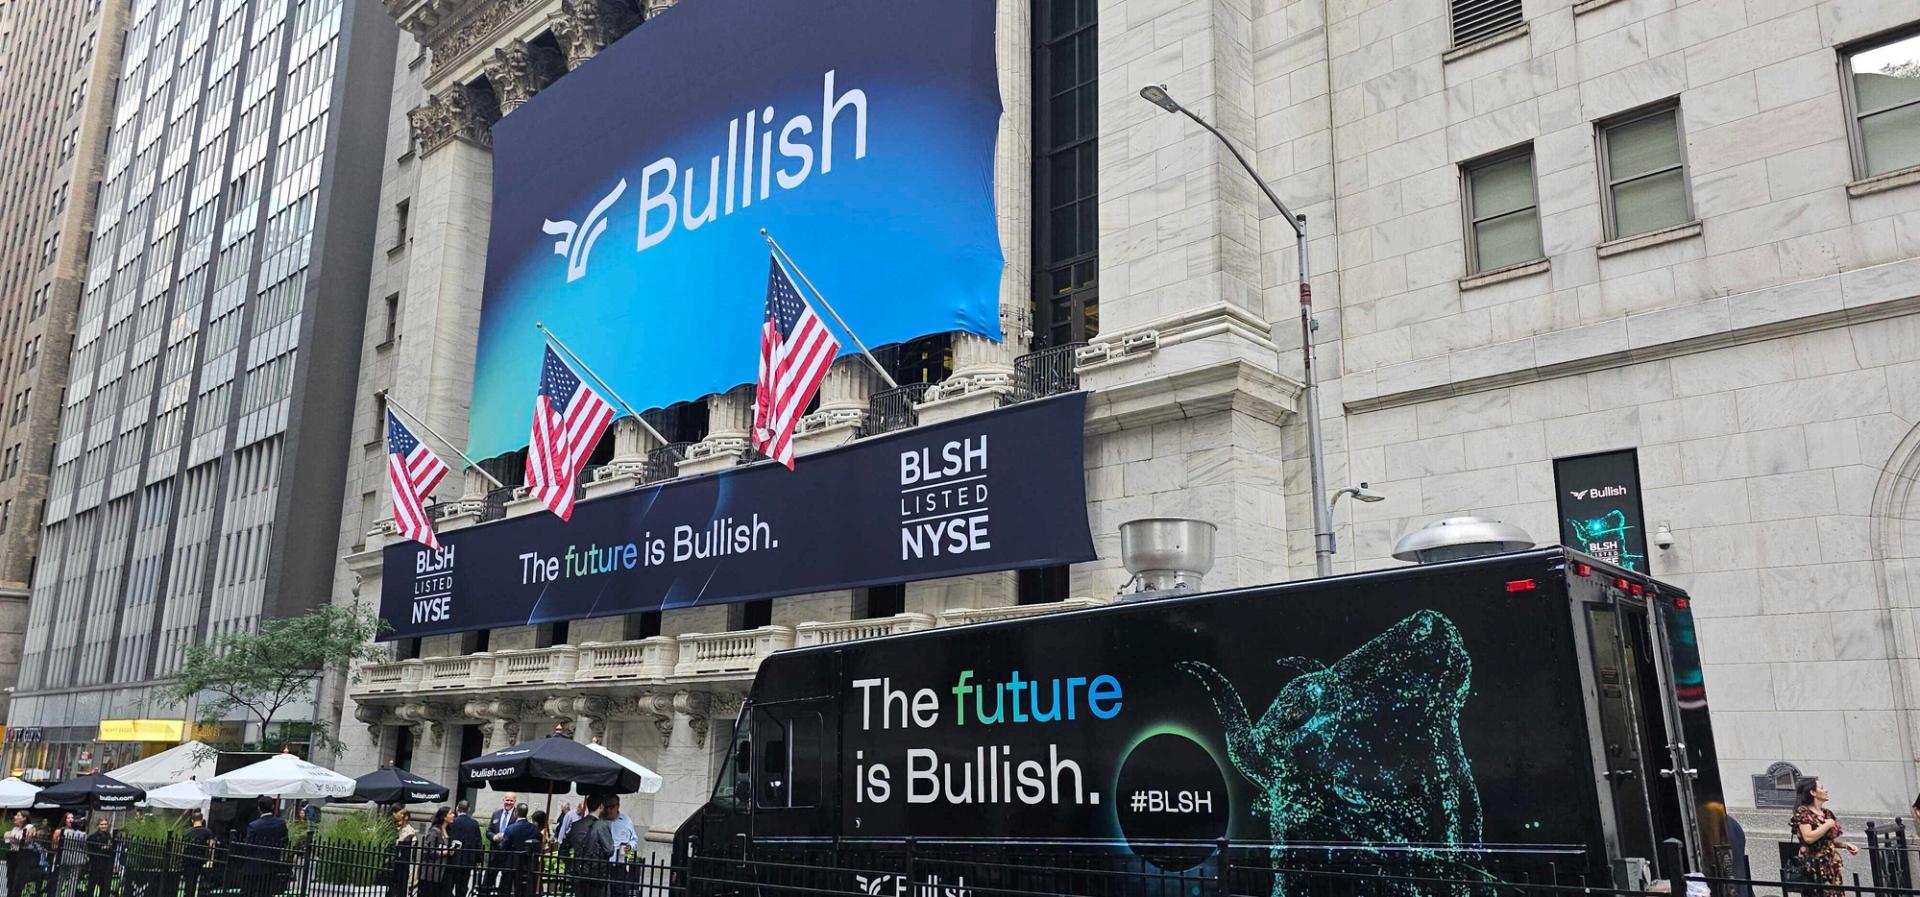

Bullish (BLSH) has agreed to acquire transfer agent and shareholder services firm Equiniti in a $4.25 billion deal that would fold a core piece of traditional market infrastructure into its digital asset platform, expanding its push into tokenized securities.
The transaction gives Bullish, CoinDesk’s parent company, a regulated transfer agent, a required function for public companies, alongside its existing tokenization, trading and market infrastructure capabilities.
Equiniti maintains records for more than 2,500 companies and 20 million shareholders and processes roughly $500 billion in annual payments, effectively acting as a system of record for equity ownership.
Combined, the companies aim to offer an end-to-end platform covering token design, issuance, compliance, registry and secondary trading, addressing what Bullish sees as a key gap in blockchain-based capital markets: the lack of a transfer agent built for tokenized assets.
“Tokenization is a once-in-a-generation shift in how capital markets operate, the defining infrastructure trend of the next 25 years,” said Tom Farley, CEO of Bullish, in the release.
“Broad adoption at institutional scale requires three things: end-to-end tokenization services, a single, unified ledger, and issuer relationships at scale. This combination delivers all three, and I believe it uniquely positions us to lead the transition to tokenized securities,” he added.
The deal comes as traditional financial services providers continue to push into tokenizing securities. Most recently, BlackRock-backed Securitize and Computershare said they plan to bring parts of the $70 trillion U.S. stock market onchain via tokenized equities, a move that pushes traditional infrastructure closer to blockchain rails.
M&A wave
Bullish’s acquisition of Equiniti also lands amid a broader wave of consolidation sweeping crypto, as firms race to build full-stack financial infrastructure.
After a lull in 2022–2023, mergers and acquisitions rebounded sharply in 2025, with more than 260 deals totaling about $8.6 billion, according to Pitchbook data. The amount is roughly four times the prior year, driven by clearer regulation and renewed institutional interest.
Companies are increasingly using acquisitions to fill capability gaps in areas like custody, payments, tokenization and derivatives, while larger players absorb smaller firms to scale distribution and compliance. High-profile transactions—from Kraken’s move into regulated derivatives to MoonPay’s push into payments infrastructure, underscore a shift away from speculative bets toward vertical integration and durable revenue models, a trend expected to continue into 2026.
The deal positions Bullish, which went public last year, to connect traditional equity infrastructure with blockchain rails, enabling features like real-time cap table visibility, automated corporate actions and faster settlement, while supporting liquidity in tokenized shares, particularly for non-U.S. investors.
At $4.25 billion, the Equiniti acquisition would rank among the largest crypto-linked deals ever, surpassing Coinbase’s $2.9 billion purchase of Deribit and Kraken’s $1.5 billion NinjaTrader deal. The size underscores how crypto M&A has moved beyond exchanges buying exchanges and into a land grab for regulated financial infrastructure.
Bullish’s last acquisition prior to the Equiniti deal was its 2023 purchase of CoinDesk from Digital Currency Group, marking its entry into media, data and index services alongside its trading business. In 2024, it also acquired data provider CCData, a U.K.-regulated benchmark administrator and one of the leading providers of digital asset data and index solutions.
The Equiniti acquisition is expected to close in early 2027, pending regulatory approvals.
Goldman Sachs served as the financial advisor to Bullish, while Evercore and FT Partners advised Siris Capital, a founding investor in Equiniti since 2021.
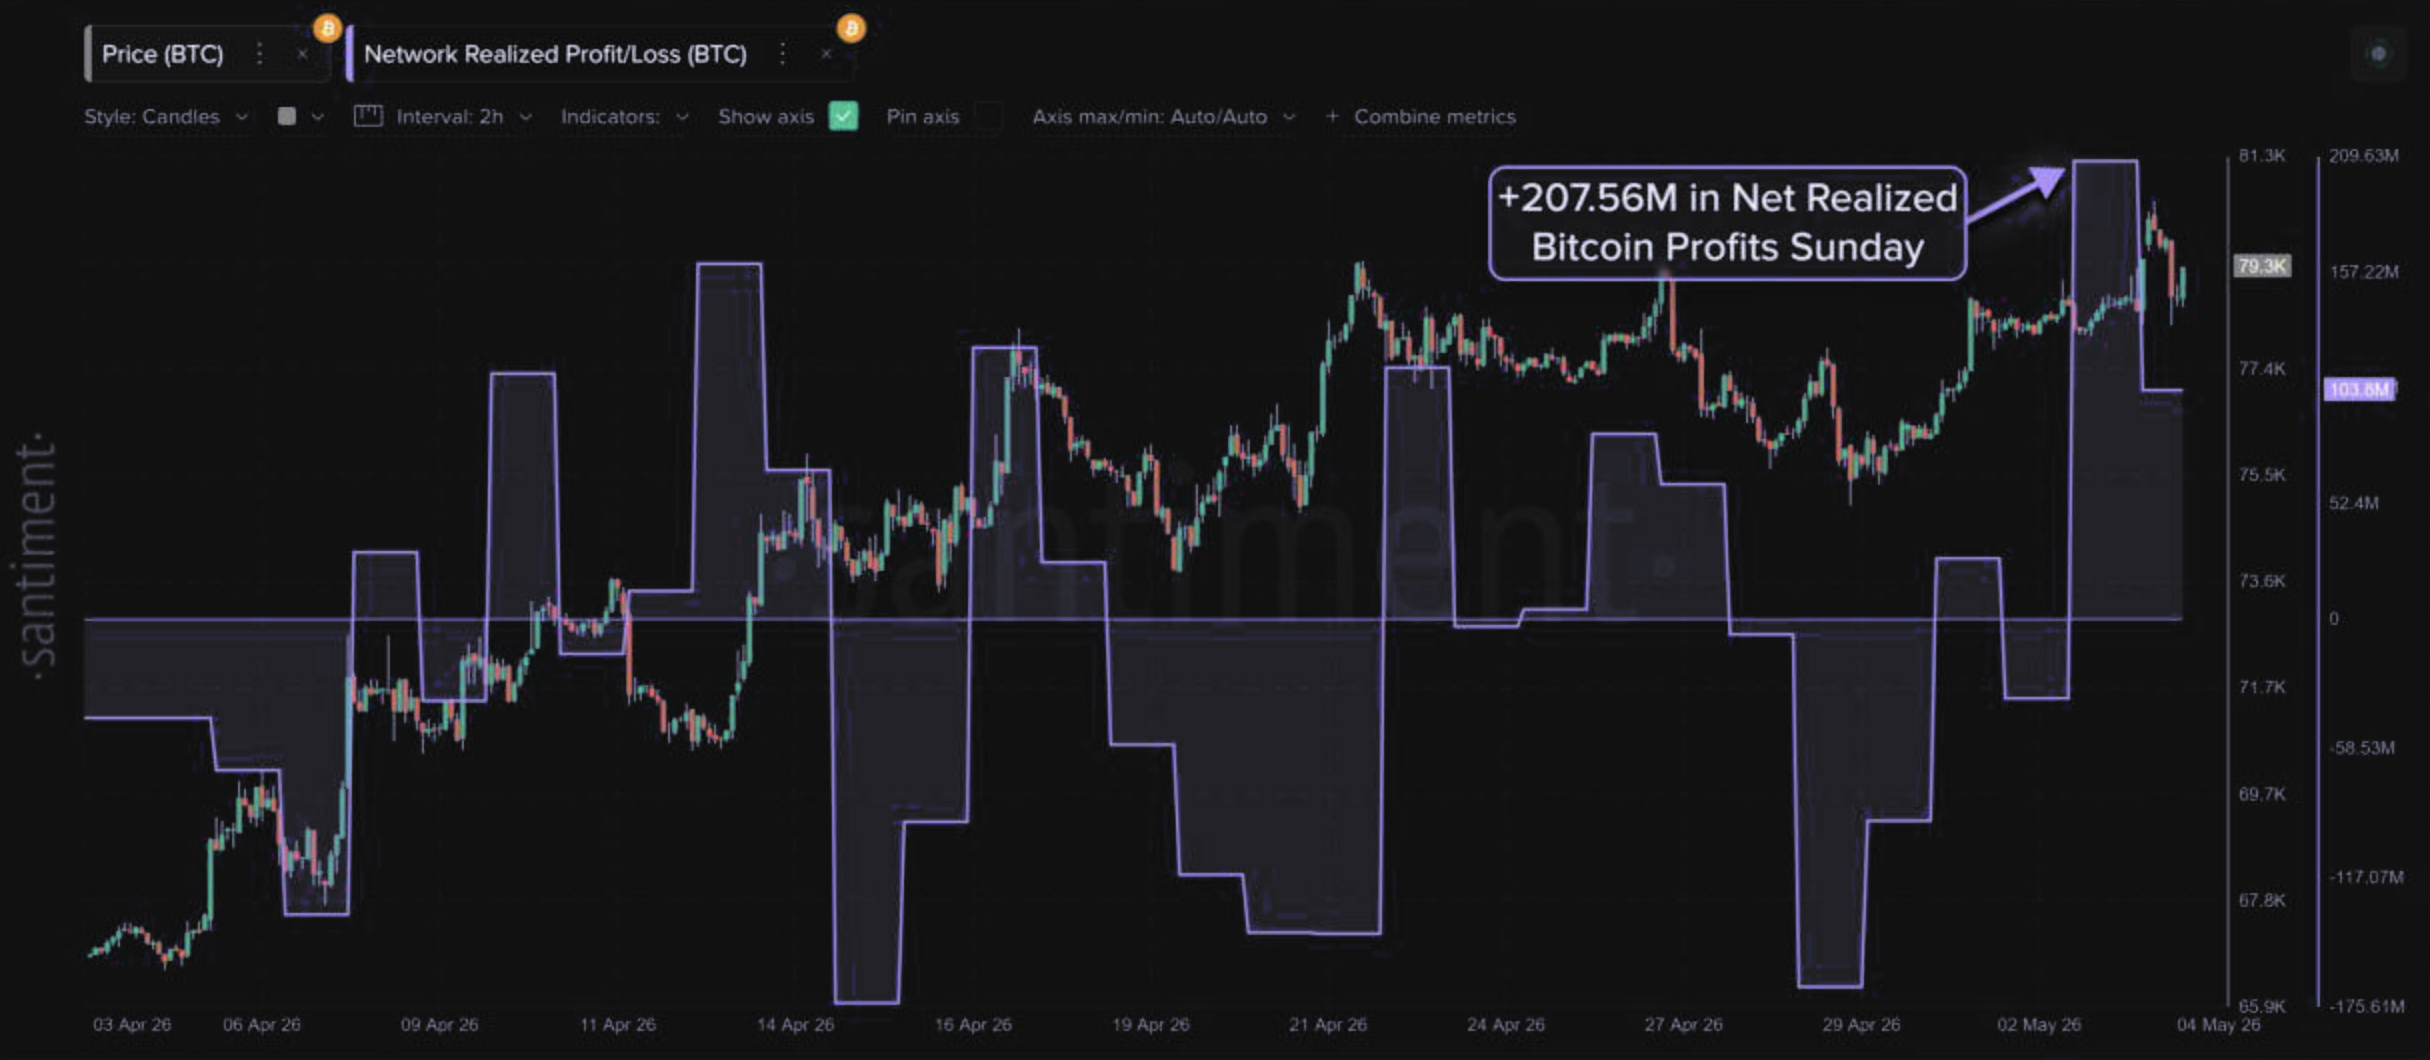
Bitcoin briefly surpassed $81,000 today, with net realized profits hitting $207.56 million, the highest single-month reading in this cycle.
Who is selling? ETF inflows and spot demand absorbed the early pressure, but if long-term holders above the 155-day band were the ones booking gains at $80K, the market signal changes.
Realized profit measures the aggregate gain locked in when coins move on-chain above their original acquisition price. According to Santiment, the $207.56 million reading on Sunday marks the highest amount for any single month in the current cycle. It was not an all-time high by any means, but a cycle-high reading at a psychologically loaded price level.

Coins purchased near $70,000 crossed into profit territory once Bitcoin cleared $80,000, and a portion of those holders sold. Santiment noted that “high profit-taking in a rising market may indicate that buyers have taken advantage of the supply,” while also flagging that Bitcoin “demonstrated active demand during the move as it surpassed $80K while holders locked in gains.”
The Spent Output Profit Ratio (SOPR) is trending toward levels historically associated with local tops in prior cycles. When SOPR runs hot at a major round number after a multi-month recovery rally, the historical pattern splits: in 2021, similar readings at resistance preceded a 20–30% retracement before continuation; in late 2023, they were absorbed, and the market pushed higher within weeks.
Discover: Best Crypto to Buy Right Now
Can Bitcoin Hold $80K and Turn It Into Support?
Analyst Michaël van de Poppe noted that Bitcoin’s lower-timeframe structure remains intact as long as price holds above the $73,000–$75,000 range, but the rejection near $80,000 is not a clean technical signal. The $81,000 level is where cycle-based models flag elevated risk.
Alphractal CEO Joao Wedson has publicly warned that losing Bitcoin can open the door to $65,500.
A weekly close above $81,000 that then holds as support on the first retest would shift the setup materially. The upside target in that scenario is the $86,000–$89,000 liquidity cluster, where short-term holder supply becomes the next friction point.
Failure below $80,700 flips the structure bearish and puts the $75,000 and $73,000 demand zones back in play. This is a functional setup, but confirmation comes from holding above $81K, not just breaking it.

BTC ETF Inflows to Absorb the Long-Term Holder Distribution
MicroStrategy’s continued accumulation posture and BlackRock and Fidelity ETF net positive inflows provide a structural bid that did not exist in prior cycles. Spot CVD surged 199.1% in the week preceding the $81K touch, showing high-conviction spot buying.
But Bitcoin ETF inflows have shown signs of stalling at zero net flows since the October peak, and the crypto market distribution dynamic becomes dangerous if that trend does not reverse. If $207 million in realized profit represents the start of sustained long-term holder selling into ETF demand, the inflows need to accelerate materially to prevent price compression.
Watch the 30-day Bitcoin ETF inflow average over the next two weeks. A return to net positive weekly flows above $500 million would confirm that institutional absorption is outpacing long-term holder distribution.
Discover: The best crypto to diversify your portfolio with
The post Bitcoin Hits $81K as Realized Profits Peak: Is a Sell-the-News Event Imminent? appeared first on Cryptonews.

Ethereum price is showing early signs of a confirmed breakout after pushing above a short-term consolidation pattern that had capped gains over the past week.
Summary
- Ethereum price breaks out of a bull flag pattern near $2,370, signaling renewed upward momentum after recent consolidation.
- ETH price holds above key 61.8% Fibonacci support at $2,381; resistance seen at $2,400–$2,460 with higher targets at $2,577 and $2,772.
- Indicators turn bullish as MACD nears crossover and RSI stays above 50; upside projection extends toward $2,800–$3,000.
According to data from crypto.news, Ethereum (ETH) climbed around 1% over the past day, trading near $2,370 at press time. The token recently rebounded from lows near $2,300 and has started to build momentum after reclaiming the mid-range zone.
On the daily chart, Ethereum appears to have broken out of a bull flag pattern, typically considered a continuation setup that forms after a strong upward move followed by a period of consolidation. The breakout above the upper trendline suggests that buyers are regaining control after several sessions of sideways movement.
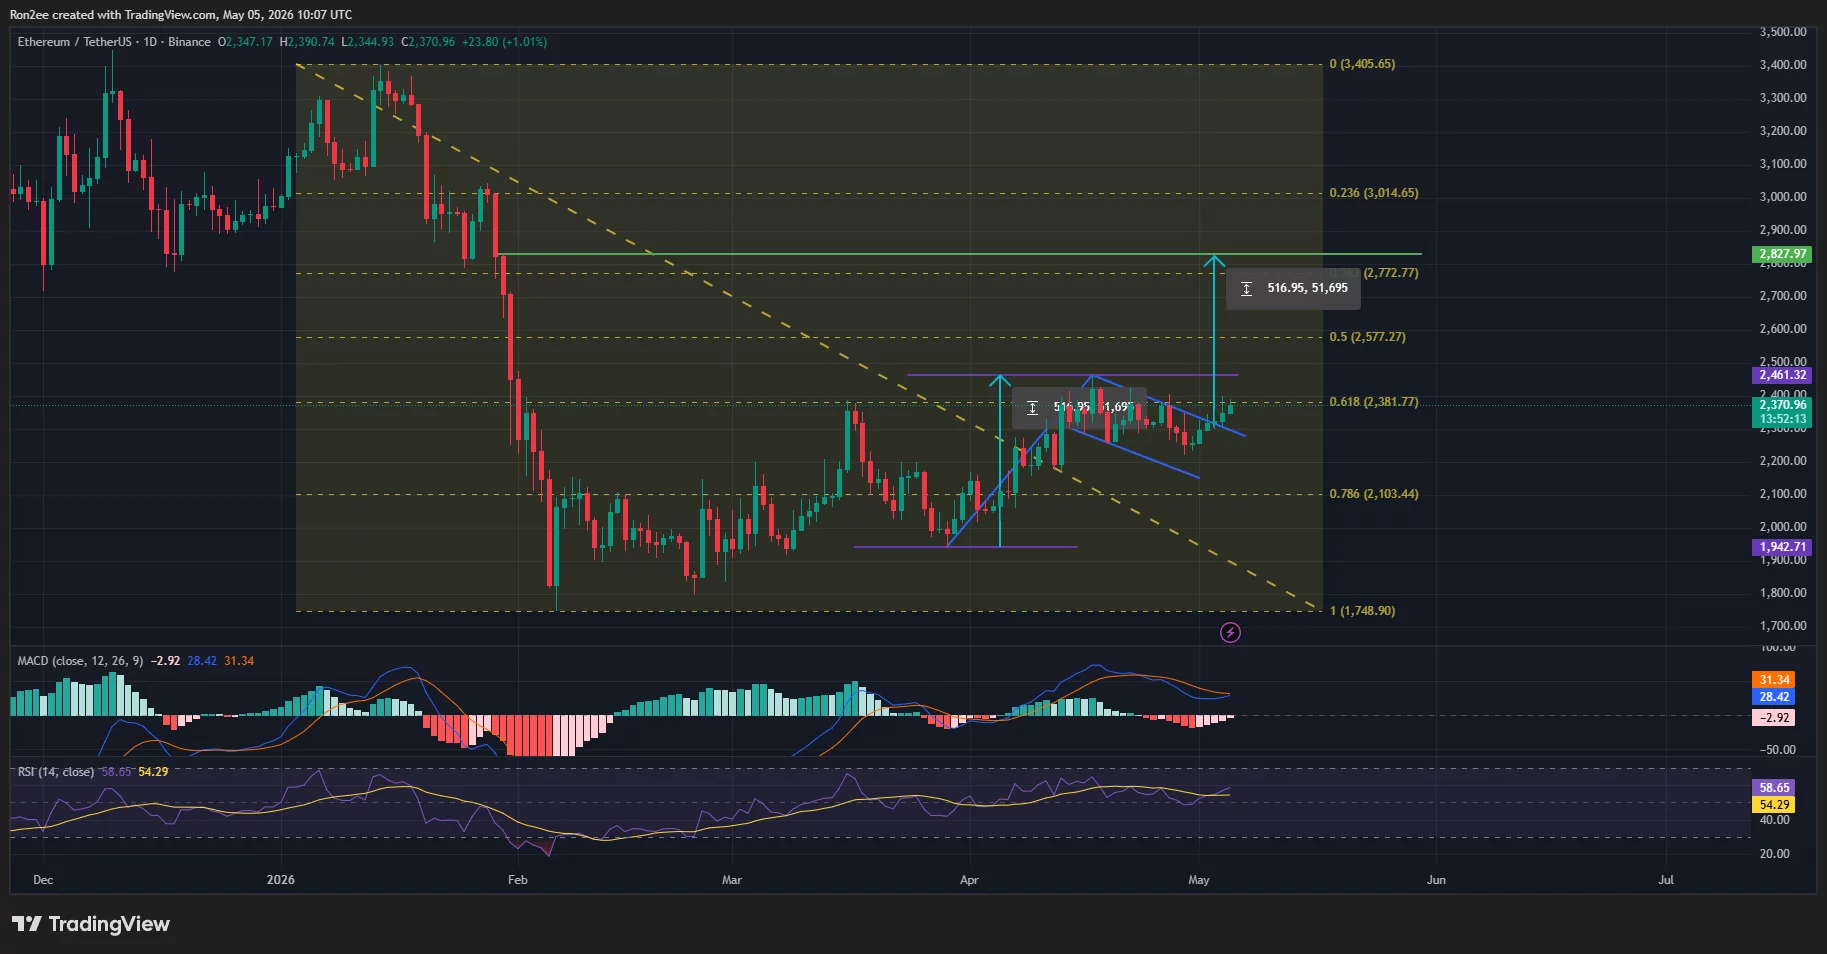
The move comes as ETH holds firmly above the 61.8% Fibonacci retracement level near $2,381, which has acted as a key support zone in recent sessions. Sustained strength above this level could reinforce the bullish structure and open the door for further upside.
If momentum continues, the next immediate resistance lies around the $2,400 to $2,460 region, which has repeatedly rejected price advances over the past few weeks. A clean break above this range could accelerate the move toward the 50% retracement level near $2,577, followed by the 38.2% level around $2,772.
Beyond that, the broader measured move from the flag structure points to a potential upside target near the $2,800 to $3,000 zone, aligning with a key psychological level that traders are closely watching.
Momentum indicators are also beginning to tilt in favor of the bulls. The MACD is approaching a bullish crossover on the daily timeframe, suggesting a possible shift toward upward momentum. Meanwhile, the RSI is trending higher and holding above the neutral 50 level, indicating strengthening buying pressure without yet entering overbought territory.
The broader structure also shows Ethereum trading within a larger descending channel, with the current breakout attempt pushing toward the upper boundary of that range. A decisive move above this long-term resistance could further validate the bullish outlook and signal a trend reversal.
While the setup points to growing upside potential, failure to hold above the $2,300 support zone could invalidate the breakout and bring ETH back into its previous consolidation range.
Disclosure: This article does not represent investment advice. The content and materials featured on this page are for educational purposes only.

Coinbase jumped 12% hours after Senator Cynthia Lummis announced a finalized bipartisan agreement on the Clarity Act stablecoin yield.
Senator Cynthia Lummis announced the bipartisan deal, resolving the most contentious provision in the Lummis-Gillibrand legislative framework: whether licensed entities can lawfully offer stablecoin yield to customers without triggering securities classification.
The deal establishes a compliant pathway for federal or state-chartered institutions to pass yield through to holders of fully reserved payment stablecoins, provided they meet strict transparency and reserve disclosure requirements.
Algorithmic stablecoins face tighter restrictions under the agreement. Fully reserved payment stablecoins, the category that includes Circle’s USDC, are the direct beneficiaries. It directly resolves the regulatory ambiguity that killed Coinbase Lend in 2021, when the SEC threatened to sue before the product launched.

The deal slots into a legislative timeline that has been building since early 2025, when Lummis and Senator Gillibrand introduced the Clarity for Payment Stablecoins Act, and accelerated in October when the House Financial Services Committee advanced a companion bill.
Circle CEO Jeremy Allaire stated last year that the deal “unlocks trillions in on-chain capital efficiency.” That framing captures the institutional read: stablecoin yield clarity is a revenue mechanism, and exchanges positioned to deliver compliant yield products at scale are the direct beneficiaries.
Discover: The best crypto to diversify your portfolio with
Crypto Winter Ending With Coinbase-backed Clarity Act Signed?
Coinbase’s interest income, driven substantially by its USDC partnership with Circle, is already a core component of its balance sheet. Legal clarity on stablecoin yield effectively green-lights the expansion of that revenue line from a grey-area product into a regulated financial service. That shift has direct implications for how institutional investors model Coinbase’s forward earnings.
The company’s institutional prime brokerage already serves hedge funds and family offices across 200+ crypto assets. Adding a compliant yield product to that infrastructure that does not carry SEC enforcement risk is an upgrade to the existing custody and lending offering.
As major crypto exchanges accelerate their push into institutional financial services, Coinbase’s regulatory positioning in the U.S. becomes a competitive moat for crypto.

The risk is legislative friction. The bipartisan agreement still requires committee markup, floor scheduling, and House-Senate reconciliation. But, President Trump already said that he will sign the Clarity Act as soon as it reaches his desk.
What to Watch?
Watch the Senate Banking Committee markup, expected by this month. A clean markup that preserves the yield-bearing pathway for fully reserved stablecoins is the single most important near-term variable for sustaining crypto legitimacy. Any amendment that reopens the algorithmic stablecoin boundary or federal oversight question is a direct headwind.
Discover: The best pre-launch token sales
The post Coinbase Surges 12% as Lummis Locks In Bipartisan Clarity Act Stablecoin Yield Deal appeared first on Cryptonews.

Haun Ventures has raised $1 billion to back crypto startups across early and late stages, marking a strategic expansion into artificial intelligence for the first time. The fund centers on three pillars—crypto financial infrastructure, tokenization, and AI agents—an approach founder Katie Haun calls part of the “new economy.”
In a blog post published on Monday, Haun, a former U.S. government prosecutor turned crypto executive, said this is the most dynamic period in technology and finance she has witnessed. “The foundations of capital, commerce and trust are undergoing meaningful structural changes,” she wrote, adding that founders who can see across all of it—and build accordingly—will define the entrepreneurs of this era.
Key takeaways
- Haun Ventures raises $1 billion to support crypto startups and expands into artificial intelligence for the first time, focusing on crypto infrastructure, tokenization, and AI agents.
- The firm frames these three areas as components of the “new economy,” signaling a broader cross‑disciplinary strategy.
- AI agents are already moving toward autonomous economic activity; analysts project a massive growth trajectory for related payments in the coming years.
- The funding environment for AI remains exceptionally strong, with venture capital for AI surpassing other sectors in early 2026 and signaling momentum for cross‑sector investments.
Haun’s cross-border bet on AI-enabled crypto infrastructure
Haun emphasized that AI agents—software that autonomously performs tasks—will increasingly conduct economic activity on users’ behalf. She argued that new products and services must be designed for a world where computers are the customers. As she put it, “Every supporting layer will need to be rearchitected for this world: fraud prevention, credit, insurance, identity, privacy, provenance, reputation, and verification all require native versions designed for how agents transact, and cryptographic tools will be important here.”
Haun also highlighted tokenization as a technology capable of rendering traditional assets—such as gold or oil—borderless, always on, and programmable. She described the shift in “the core plumbing of global finance” as moving toward an always-on digital world, with crypto-native layers playing a central role in enabling these capabilities.
Bloomberg reported Haun saying the fund would focus on the intersection of AI agents and crypto infrastructure, aiming to invest in “AI that is in our lane.”
Tokenization and AI agents at the core of the “new economy”
Identity, privacy, provenance and verification are among the domains Haun argues will need native, cryptographic solutions tailored for agent-driven transactions. The fund’s emphasis on AI agents follows a broader industry trend: software that autonomously acts in economic contexts, potentially redefining how value is created and exchanged.
Haun’s framing positions tokenization not merely as a way to tokenize securities or commodities, but as a foundational technology that could enable programmable, borderless access to a wide range of assets. The combination of AI agents with tokenized infrastructure may drive a new class of products and services designed for automated, machine-enabled commerce.
Market backdrop: AI funding surge shapes crypto investor strategy
The investment move arrives amid a striking shift in venture capital toward AI. Crunchbase data show AI companies attracted a record $242 billion in venture funding in the first quarter of 2026, accounting for roughly 80% of total global venture funding in the period, which totaled about $300 billion.
Analysts have projected dramatic growth for AI-enabled commerce. The Boston Consulting Group has suggested that payments managed by AI agents could reach around $2.4 trillion per year by 2029, illustrating the scale at which autonomous software could participate in economic activity. Haun has repeatedly stressed the importance of backing “AI that is in our lane”—AI aligned with crypto and financial-infrastructure expertise—as a driver of portfolio value.
Haun’s expansion into AI signals a broader trend among cryptocurrency-focused funds seeking to diversify into adjacent technologies that promise to reshape how finance and commerce operate. The coming quarters will reveal how quickly AI agents can integrate with tokenized rails and what regulators will permit as the technology matures.
Going forward, observers will watch regulatory clarity, security protocols, and cross‑chain interoperability as key factors shaping adoption. The convergence of AI agents with tokenized crypto infrastructure could redefine how value is created and moved across digital ecosystems, but real-world deployment will hinge on robust risk management and practical use cases.
Telegram founder Pavel Durov said on May 4, 2026, that Telegram will replace the TON Foundation as the main force behind The Open Network.
Summary
- Durov said Telegram will replace TON Foundation as TON’s main force and largest network validator.
- TON rose about 28% in 24 hours, trading near $1.82 with $632.75 million daily volume.
- Telegram plans new TON developer tools, a website upgrade and performance improvements by late May.
He also said Telegram will become TON’s largest validator. Durov linked the move to lower network fees and a stronger technical roadmap. He wrote:
“Fees in TON have dropped 6× — to nearly zero.” He added that Telegram would shift TON’s focus to “tech superiority.”
Durov said TON should receive a new website, new developer tools and performance upgrades within “2-3 weeks.” That places the expected changes in late May 2026, based on the May 4 announcement.
The details remain limited. Telegram has not yet explained how its validator role will work. It has also not disclosed its planned validator stake or how the TON Foundation’s role will change after the shift.
Toncoin rallies after the announcement
Toncoin (TON) moved higher after Durov’s comments. TON climbed from about $1.35 to nearly $1.80 after the announcement, placing it among the top 25 crypto assets during the rally.

Crypto.news data showed TON trading near $1.82 at press time, with a 28.10% gain over 24 hours. The token also posted about $632.75 million in daily trading volume and a market cap near $4.8 billion.
Telegram links deepen around TON
The latest move follows Telegram’s wider push into TON-based products. As highlighted in our February 20, 2026 article, TON has used Telegram’s wallet, digital gifts and social NFT tools to support consumer use across the messaging app.
That report also said TON’s approach focuses on Telegram’s reach instead of only technical features. It noted that TON gives developers access to Telegram’s large user base through wallet features, payments, gifts and asset transfers.
As featured in our April coverage, Wallet in Telegram also added perpetual contract trading across metals, stocks, oil and crypto. The product used Lighter’s infrastructure and offered more than 50 markets inside Telegram.

- Kresus and Canton aim to accelerate institutional blockchain deployment.
- Focus shifts from pilot projects to full-scale production systems.
- Hanwha partnership targets tokenized private market assets.
Kresus and the Canton Network are joining forces to push institutional blockchain use beyond the pilot stage and into production, in a collaboration aimed at making deployment easier for enterprises and financial firms.
Announced Monday in San Francisco, the effort centers on a familiar challenge in digital assets: many institutions have explored blockchain through proofs of concept, but far fewer have moved live systems into full operation.
Kresus says the new collaboration will help organizations design, build and deploy blockchain applications “from first integration to full-scale launch,” combining its implementation capabilities with Canton’s institutional-grade infrastructure.
The companies said they are already working on several projects, with additional developments expected in the coming months.
Focus shifts from experimentation to execution
The collaboration is built around a practical problem that has slowed institutional blockchain adoption: implementation.
According to the companies, the aim is to reduce friction for enterprises and organizations that want to move from strategy to deployment.
That means helping clients navigate the technical and operational demands of production-grade blockchain systems rather than stopping at trials.
Kresus said the arrangement is designed to support institutions across industries, not just financial firms, as they look to deploy live blockchain solutions.
Canton’s infrastructure is positioned as the foundation for that effort, while Kresus brings delivery capabilities intended to bridge the gap between planning and production.
Hanwha partnership highlights real-world asset push
Kresus said it is already working with leading global financial institutions to bring next-generation blockchain applications into production on Canton.
One of those efforts is its partnership with Hanwha Investment & Securities, which is aimed at supporting the development of a tokenized digital asset platform focused on private market assets.
The platform is expected to enable the issuance, management and distribution of tokenized financial instruments aligned with real-world asset, or RWA, use cases.
That places the project squarely in one of the most closely watched areas in digital finance, where institutions are testing how traditional assets can be represented and managed on blockchain infrastructure.
Kresus also said it is bringing its core product stack to the Canton ecosystem. That includes enterprise-grade wallet infrastructure, tokenization systems and its secure middleware layer, KITE.
The company said these tools are designed to integrate into existing financial environments and support production deployments across payments, tokenized assets and digital asset management.
Institutional infrastructure remains the central pitch
The strategic message from both companies is clear: institutions need systems that are secure, reliable and scalable before blockchain can reach broader adoption.
“Financial institutions are moving beyond trials and toward actual blockchain applications,” Trevor Traina, founder and CEO of Kresus said.
The CEO added:
Success in regulated markets requires more than technology; it requires the ability to design, build, and deliver systems that meet real-world requirements. Kresus works directly with clients to bring these applications into production on Canton.
“Institutions need secure, reliable, and scalable systems to advance digital asset adoption,” Yuval Rooz, CEO of Digital Asset and co-founder of Canton said.
Through this collaboration, we are combining Canton’s institutional-grade blockchain with Kresus’ ability to implement production-ready applications that meet the needs of financial institutions.

According to Santiment, in early May large holders acquired more than 140,000 ETH within 96 hours. This demand is forming against a backdrop of growing corporate interest in Ethereum as a reserve asset: Bitmine Immersion Technologies holds over 5 million ETH. At the same time, an opposing trend is emerging: total assets under management in ETH-focused ETPs and ETFs amount to around $16 billion; however, at the beginning of 2026 the ETF segment experienced a period of subdued activity, with interest only starting to recover by April (source: CoinLaw).
Technical Picture
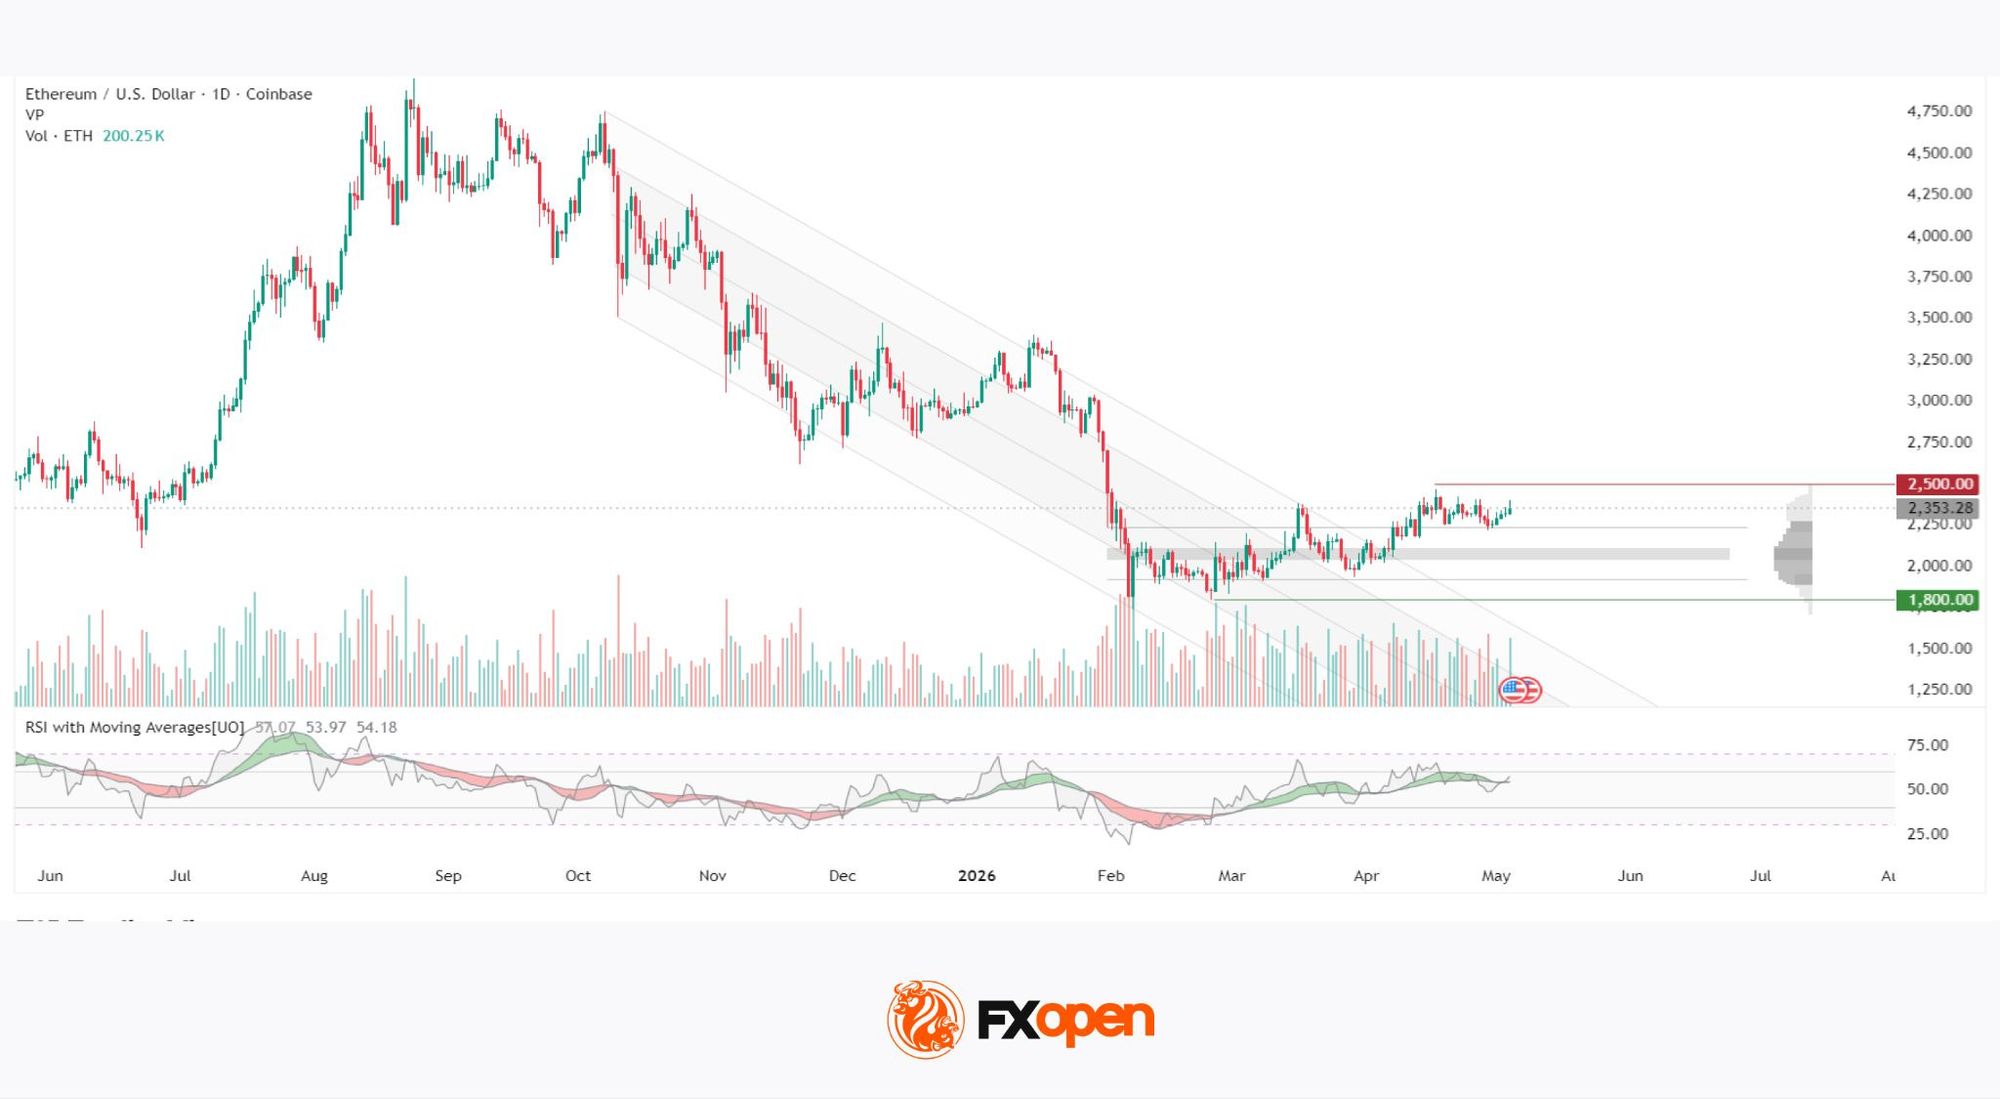
On the daily chart, an extended downward structure is evident: since early October 2025, the price has been declining within a descending channel, reaching a culmination in early February 2026 near the $1,750 level. Vertical volume during this period showed peak values, signalling the exhaustion of selling pressure. This was followed by a rebound: the price broke above the upper boundary of the channel and, during subsequent trading, formed a horizontal volume zone in the $1,920–$2,240 range, where the bulk of transactions over the period was concentrated. The point of control (POC) of this volume zone lies around $2,050–$2,100.
The price is currently trading above this zone, indicating a shift in favour of buyers. Support at $1,800 coincides with the February low from which the reversal began. Above current levels lies a resistance area near $2,500 — a zone the price approached in April but failed to consolidate above the round level. The RSI + MAs indicator shows readings of 57, 54 and 54: the oscillator is positioned above neutral, while the moving averages remain broadly neutral.
Key Takeaways
The technical profile reflects a transition from a prolonged downtrend to a consolidation phase above the volume zone. Further movement will depend on whether corporate demand for ETH can provide a sufficient basis to sustain a move towards the resistance area.
FXOpen offers the world’s most popular cryptocurrency CFDs*, including Bitcoin and Ethereum. Floating spreads, 1:2 leverage — at your service (additional fees may apply). Open your trading account now or learn more about crypto CFD trading with FXOpen.
*Important: At FXOpen UK, Cryptocurrency trading via CFDs is only available to our Professional clients. They are not available for trading by Retail clients. To find out more information about how this may affect you, please get in touch with our team.
This article represents the opinion of the Companies operating under the FXOpen brand only. It is not to be construed as an offer, solicitation, or recommendation with respect to products and services provided by the Companies operating under the FXOpen brand, nor is it to be considered financial advice.

Key Takeaways
- Apple is in preliminary discussions with Intel and Samsung regarding US-based manufacturing of core device processors
- No manufacturing contracts have been finalized; negotiations remain in exploratory phases
- CEO Tim Cook highlighted semiconductor supply limitations during the recent Q2 earnings presentation
- Partnering with Intel may enhance Apple’s standing with the Trump administration, which supports Intel’s domestic operations
- Apple presently sources semiconductors from TSMC in Taiwan, expecting 100 million units from TSMC’s Arizona facility by 2026
According to a Bloomberg report released Tuesday, Apple is investigating potential partnerships with Intel and Samsung to produce critical device processors domestically. These discussions remain exploratory, with no formal purchase agreements established.
Shares of Apple showed minimal movement during premarket hours Tuesday. Intel’s stock surged up to 4% following the report, while Samsung’s Seoul-traded shares climbed more than 5% before the close of Korean markets.
For over ten years, Apple has depended exclusively on TSMC for semiconductor fabrication. TSMC’s Taiwanese manufacturing plants produce cutting-edge 3-nanometer processors that drive current-generation iPhones and Mac computers.
The challenge? Capacity constraints are intensifying. AI data center requirements have consumed available production capacity, while demand for AI-enabled Mac systems exceeded Apple’s projections.
During last week’s Q2 FY26 earnings discussion, CEO Tim Cook acknowledged that semiconductor shortages were limiting revenue growth. “Our supply chain flexibility is more restricted than typical circumstances,” Cook stated.
Cook identified advanced processor capacity — rather than memory components — as the primary limitation. Mac mini and Mac Studio products have experienced the most significant impact. “Achieving supply-demand equilibrium will require multiple months,” he indicated.
Apple representatives have toured a Samsung manufacturing site currently under construction in Texas designed for advanced semiconductor production. Regarding Intel, preliminary discussions about utilizing its foundry capabilities have occurred.
The Strategic Value of Intel and Samsung
Securing Apple as a foundry client would represent a significant achievement for Intel. CEO Lip-Bu Tan is working to revitalize Intel’s manufacturing operations following prolonged challenges. Apple’s business could serve as validation to attract additional customers.
Samsung currently ranks as a distant competitor to TSMC in foundry services, but Apple’s endorsement would carry substantial industry influence. Samsung currently produces various iPhone components, including power management systems.
Political considerations also factor into these discussions. The Trump administration has positioned Intel as America’s domestic semiconductor manufacturing leader, and certain Apple leadership members believe collaboration could strengthen relations with Washington.
Nevertheless, Apple maintains legitimate concerns. Neither Intel nor Samsung currently matches TSMC’s manufacturing consistency or production volume. Apple may ultimately maintain its TSMC relationship without pursuing alternative suppliers.
Apple’s Component Sourcing Approach
Apple typically maintains relationships with at least two suppliers for critical components, providing negotiating power and protection against supply interruptions.
Taiwan presents particular geopolitical concerns. Cook has consistently identified Taiwan’s concentrated chip production as a strategic liability, considering China’s territorial assertions regarding the island.
TSMC is currently expanding operations in Phoenix, Arizona. Apple projects receiving 100 million processors from that location in 2026 — though this represents just a portion of its complete annual device requirements.
The iPhone 17 Pro series has also encountered supply chain difficulties. Apple has deployed operations personnel to prevent constraints from affecting AirPods and Apple Watch production lines.
Wall Street analysts rate TSMC a Strong Buy, Apple and Samsung a Moderate Buy, and Intel a Hold as they evaluate its recovery efforts.


Toncoin Explodes 27% After Telegram Bets 2.2 Million TON on Itself

Official Man Utd and City kits reduced to £10 in flash 70% off sale ending midnight

Microsoft’s new research finds an AI ‘paradox’ holding companies back
Manchester United reach agreement with Casemiro over contract clause amid transfer speculation

US brings back mandatory military draft registration

Steven Gerrard disagrees with Gary Neville over ‘shock’ Chelsea and Arsenal claim | Football


-

 Business7 days ago
Most Commercial Energy Audits Miss the Real Losses
-

 Fashion6 days ago
Kylie Jenner’s KHY Enters a New Era with ‘Born in LA’
-

 NewsBeat2 days ago
Channel 5 – All Creatures Great and Small series 7 new post
-
 Tech4 days ago
Trump’s 25% EU auto tariff breaches Turnberry Agreement that also covers semiconductors and digital trade
-
 Sports4 days ago
Paul Scholes issues Marcus Rashford reality check as agreement emerges over Man United star
-

 Crypto World7 days ago
CFTC’s AI will review U.S. crypto registration applications, chairman tells CoinDesk
-

 Business6 days ago
Barclay Brothers Avoid Bankruptcy: HSBC Drops High Court Petitions After IVA Deal
-
 Business6 days ago
Tesla Officially Registers Elon Musk’s Stock: What Investors Need to Know
-

 Tech7 days ago
Get Ready for More Brain-Scanning Consumer Gadgets
-

 Tech6 days ago
Texas Instruments made a new flagship graphing calculator: the TI-84 Evo
-

 Business4 days ago
Two Powerball Tickets Split $143 Million Jackpot in Indiana and Kansas
-
 Crypto World4 days ago
CoreWeave (CRWV) Stock Climbs 8% Despite $45M Insider Share Dump
-
Business2 days ago
Winning Numbers Drawn as Jackpot Resets to $20 Million
-
 Crypto World6 days ago
Securitize and Computershare Enable Tokenized Equity Issuance for Over 25,000 U.S.-Listed Stocks
-

 Crypto World5 days ago
Gibraltar Proposes Tokenized Funds Regulation to Bolster Compliance
-

 Fashion2 days ago
Mary J. Blige Vegas Residency Looks: Crystal-Embellished Fjolla Haxhismajli, Todd Fisher, and More!
-

 Business6 days ago
Alexandria Real Estate Equities, Inc. (ARE) Q1 2026 Earnings Call Transcript
-

 Entertainment5 days ago
Celebrities Who Are Attending the 2026 Met Gala Event
-

 Tech5 days ago
Official SAP npm packages compromised to steal credentials
-

 Sports6 days ago
Antrim GAA: Hurlers cancel training as row with board deepens
You must be logged in to post a comment Login