
Crypto World
Solana (SOL) Price Surges 7% as Traders Eye Critical $100 Breakout Level

TLDR
- Solana experienced a 7%+ rally within 24 hours, touching $97.67 while the overall crypto market gained approximately 3.6%.
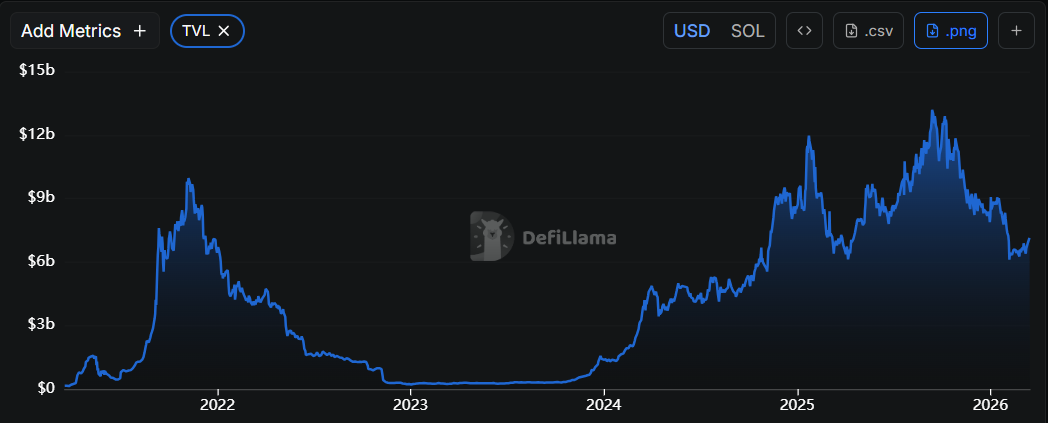
- The network’s total value locked increased by 25% throughout the past 30 days, demonstrating renewed investor confidence.
- SOL maintains trading above the $92 mark and its 100-hour simple moving average, with bullish support establishing at $94.
- Critical resistance points are positioned at $98 and $100, while downside support exists at $92 and $88.
- The token has appreciated over 40% since hitting its February bottom, as the RSI indicator advances toward 60 from previously oversold territory.
Solana has delivered an impressive 24-hour performance, rallying more than 7% to peak at $97.67 before experiencing a modest retracement to settle around the $95 zone. This upward movement coincides with a broader cryptocurrency market recovery that saw gains of approximately 3.6% during the identical timeframe.
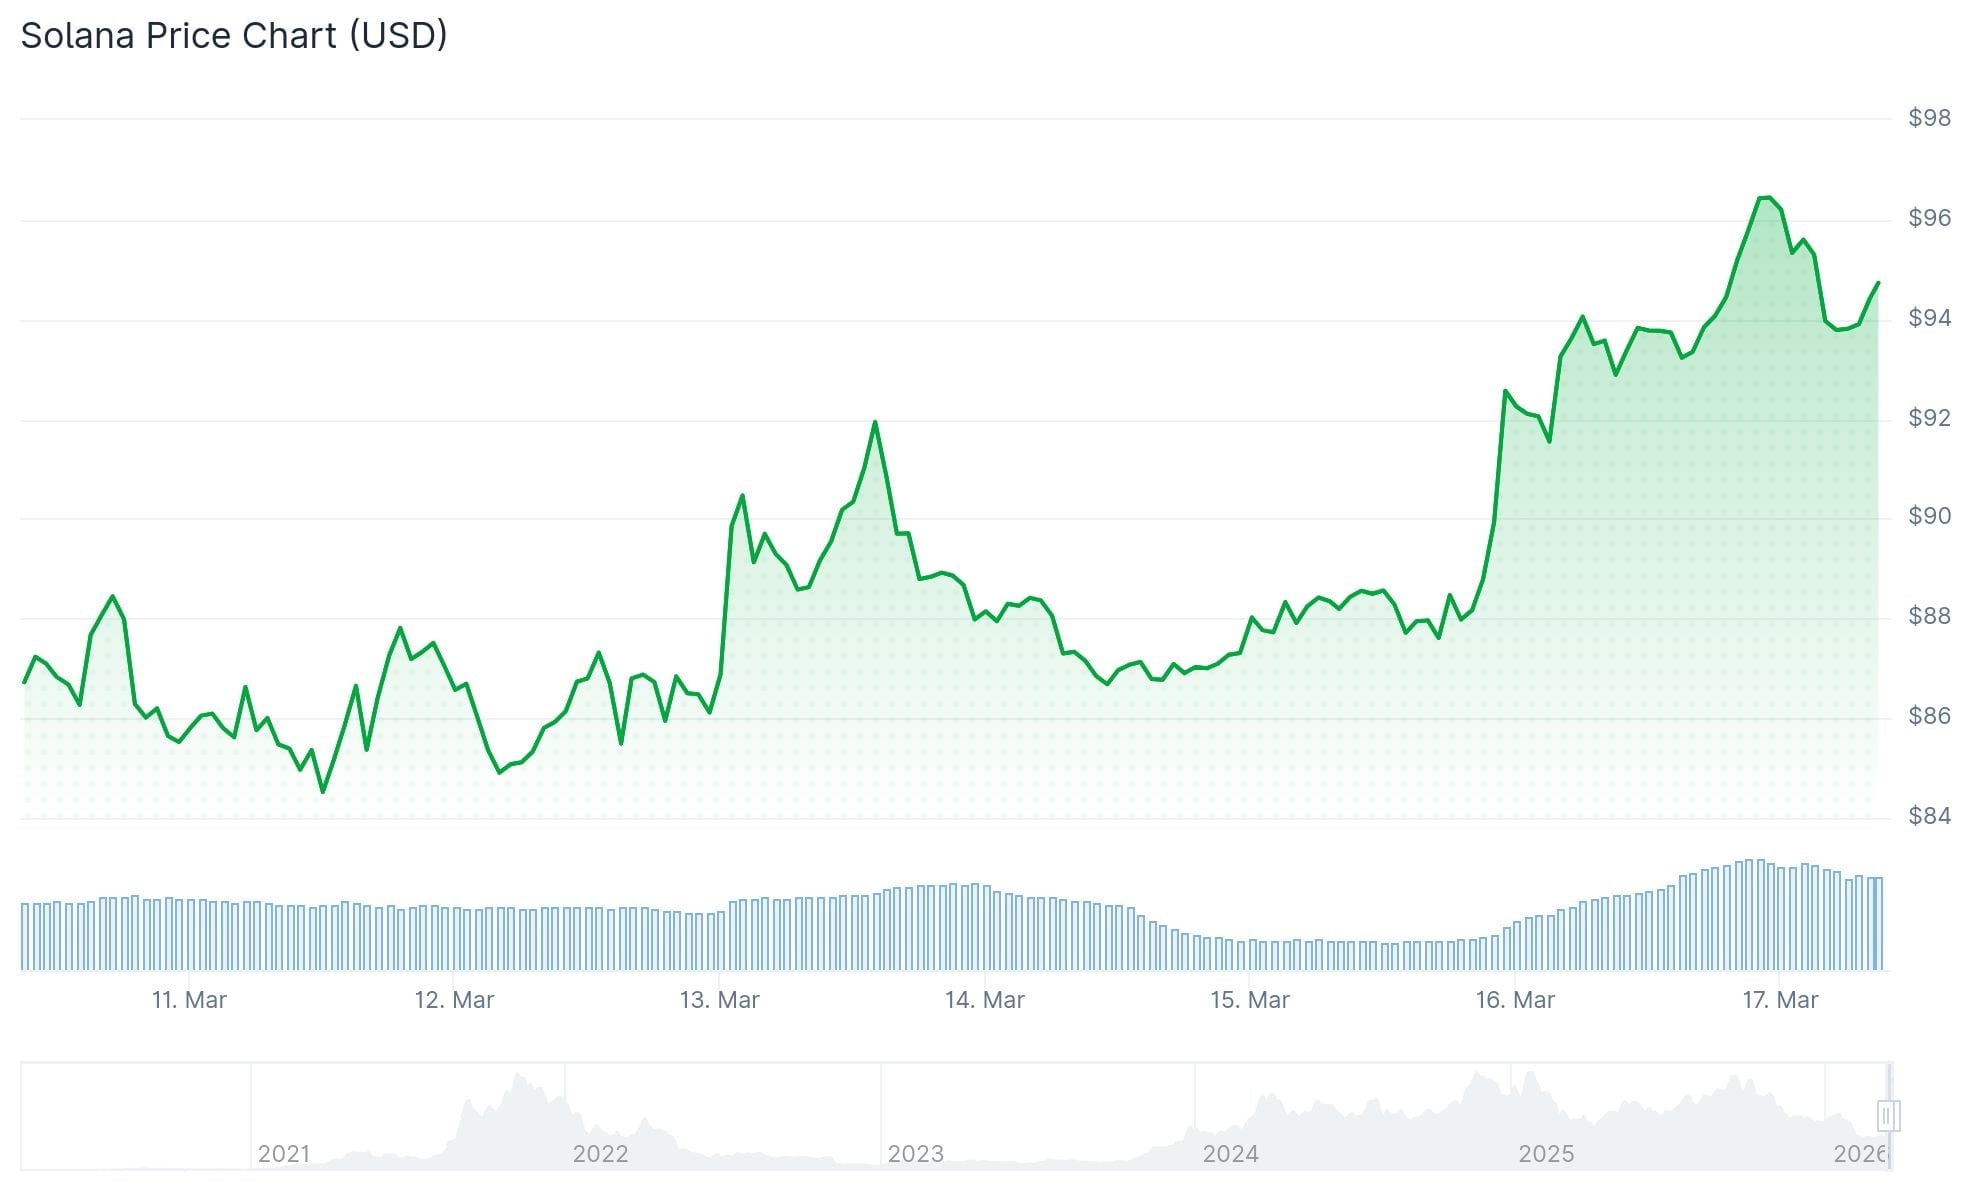
Currently, SOL maintains its position above the $92 threshold and trades above its 100-hour simple moving average. Technical analysis reveals a bullish trend line forming with critical support established at $94 on the hourly timeframe, according to data sourced from Kraken.
Critical Resistance Zones Emerge
The cryptocurrency now encounters resistance around the $95 level, with the subsequent barrier positioned at $98. The psychologically significant $100 threshold represents the primary challenge ahead. Successfully breaking and closing above $100 could pave the way toward $105, with potential extension to $112.
Conversely, should SOL fail to maintain support above $92, the next cushion sits at $88. Breaking beneath $88 would likely bring the $82 level into play.
While the recent upswing correlates with broader market stabilization, Solana has notably outpaced the majority of alternative top-10 cryptocurrencies during this same period.
On-Chain Metrics Validate Price Action
The total value locked within Solana’s ecosystem expanded by 25% over the preceding 30-day period. This metric, which quantifies the amount of capital deployed within a blockchain’s infrastructure, indicates accelerating platform utilization when showing this magnitude of growth.
Continuous developer engagement and consistent decentralized application deployments across the network have persisted. These fundamental on-chain indicators have contributed to supporting the current bullish price trajectory.
Solana has appreciated more than 40% from its February trough. The Relative Strength Index has recovered toward the 60 threshold after rebounding from oversold conditions experienced earlier this year.
Price action has been oscillating within a range bounded by $80 support and $95 resistance throughout recent weeks, creating a consolidation formation that market participants frequently monitor for potential breakout opportunities.
The 200-day moving average continues to reside above present price levels, suggesting the long-term directional bias hasn’t completely reversed yet.
SOL is currently valued at approximately $94.62, commanding a market capitalization near $54 billion, with a 52-week trading range spanning from $70.61 to $252.78.


Summary
- Binance is seeing fresh turnover in its compliance ranks as key financial‑crime and sanctions staff depart.
- Chief Compliance Officer Noah Perlman is in talks over a possible exit, raising questions about Binance’s post‑settlement clean‑up.
- The moves follow Binance’s $4.3b US plea deal and ongoing scrutiny of the exchange’s anti‑money laundering controls.
Binance’s effort to rebuild its compliance operation after a $4.3 billion US guilty plea is under renewed pressure as several staff overseeing financial‑crime monitoring and sanctions checks leave and Chief Compliance Officer Noah Perlman weighs his own departure, according to Bloomberg. Bloomberg reported that personnel changes have hit units responsible for financial‑crime surveillance and sanctions compliance, while Perlman is discussing “future departure matters” with management and may leave as soon as this year or next.
Perlman, who joined Binance as global chief compliance officer in January 2023, was hired to overhaul sanctions enforcement and anti‑money‑laundering (AML) systems after the exchange admitted to US law‑enforcement failures and agreed to one of the largest corporate penalties in US history. As part of that plea deal, Binance and founder Changpeng Zhao acknowledged violations of the Bank Secrecy Act and sanctions rules, with US Attorney General Merrick Garland stressing that the $4.3 billion package, including $2.5 billion in forfeiture and a $1.8 billion criminal fine, “sends an unmistakable message” to the crypto industry. In a previous crypto.news story, US regulators were shown to have collected over $32 billion from crypto companies, with Binance’s $4.3 billion settlement one of the largest single components. In that story, regulators highlighted that Binance’s case stemmed from rule‑breaking on AML and sanctions obligations rather than traditional fraud.
In response to Bloomberg’s report, Binance said it “currently has no departure timeline and has not determined a successor,” adding that Perlman “remains focused on his current work” overseeing the group’s global compliance program. The company has repeatedly pointed to growing headcount and investment in compliance since 2023, saying it expanded compliance‑related staff by more than 30% and cut its direct exposure to illicit activity by 96% between January 2023 and June 2025. “A 96% reduction in illicit exposure is a testament to our infrastructure and the 1,500+ professionals working behind the scenes to protect our 300M users,” Perlman said in March, arguing Binance has built a system that “doesn’t just react to threats, it anticipates them.”
Those claims have been challenged by a recent Financial Times investigation, which found that Binance continued to allow suspicious accounts tied to terror financing and other red flags to operate even after the 2023 plea agreement. The FT reported that hundreds of millions of dollars in suspect flows moved through the platform despite the promised monitoring upgrades, raising fresh questions over whether Binance’s revamped compliance apparatus is working as advertised.
The latest turnover comes as Binance seeks to ease US oversight of its internal controls. The Wall Street Journal has reported that executives have lobbied Washington officials to remove an independent US monitor installed to oversee the exchange’s AML compliance following the plea deal. At the same time, crypto.news has documented how Binance’s global market share and governance have been reshaped by regulatory pressure, from Zhao’s resignation and guilty plea to ongoing scrutiny of its US affiliate’s asset‑custody practices. In one crypto.news story on Zhao’s plea, Treasury Secretary Janet Yellen accused the exchange of allowing funds to flow to terrorists and cybercriminals while it “turned a blind eye” to basic AML obligations.
Binance’s internal metrics tell a more upbeat story. Company communications and recent media interviews have highlighted that sanctions‑related exposure fell from 0.284% in January 2024 to just 0.009% in July 2025, a 96.8% decline, alongside the processing of over 71,000 law‑enforcement requests and the facilitation of about $131 million in confiscations linked to illicit activity. Whether those improvements can be maintained amid continued staff churn — and the potential exit of the executive hired to lead the clean‑up — will determine how regulators and markets price Binance’s compliance risk going forward.


An appeals court ruled Monday that New Jersey could not temporarily ban prediction market provider Kalshi, giving the platform a much-needed win against an onslaught of state enforcement actions.
A Third Circuit Court of Appeals panel ruled in a 2-1 vote that the state could not bring an enforcement action against Kalshi because the company’s products are subject to the federal Commodity Exchange Act, rather than New Jersey state gambling laws.
“Kalshi began offering sports-related event contracts on its DCM exchange,” the majority ruling said. “Kalshi self-certified compliance with the applicable laws and regulations, so those event contracts were presumptively approved under federal law … To date, the CFTC has not determined that Kalshi’s sports-related event contracts are contrary to the public interest.”
The CFTC has not commenced any enforcement actions against “sports-related event contracts,” the ruling, signed by Chief Judge Michael Chagares and Circuit Judge David Porter said.
“New Jersey argues that Kalshi’s event contracts are not ‘swaps’ covered by the Act because the outcome of a sports game is not ‘joined or connected’ with a financial, economic, or commercial instrument or measure,’” the ruling went on to add. “But its proposed ‘joined or connected’ requirement raises the bar beyond what the [Commodity Exchange] Act requires.”
Circuit Judge Jane Roth, who penned a dissent, said the New Jersey state rules did not “undermine the congressional objectives” under the Commodity Exchange Act, and the actual products available on Kalshi’s platform “are sports gambling,” pointing to contracts betting on the winner of a National Football League game, the point spread in that game and combined number of points scored as examples.
States throughout the U.S. have started filing lawsuits or issuing cease-and-desist orders to prediction market providers, including Kalshi and Polymarket, alleging that their sports-related contracts violate state gambling laws. The CFTC has contended that prediction markets, or event contracts, are swaps governed by the Commodity Exchange Act, which preempts these state rules.
Different courts have issued divergent rulings. Some state courts have filed initial temporary restraining orders or preliminary injunctions in the states’ favor, while federal district courts have been more mixed.
Appeals courts have similarly been mixed. While the Third Circuit’s ruling on Monday suggests that prediction market providers will prevail on their argument that the Commodity Exchange Act preempts these state rules, the Ninth Circuit declined to block another state enforcement action from Nevada last month, clearing the way for that state to secure a temporary restraining order and preliminary injunction against Kalshi. There will be another Ninth Circuit hearing later this month with a number of companies.
CFTC Chairman Michael Selig, speaking Monday at an event hosted by Vanderbilt University and the Blockchain Association, said it was important that the federal regulator defend its “exclusive jurisdiction over these markets.” The CFTC filed an amicus curiae brief to the Ninth Circuit ahead of the hearing taking place next week.
“Our definition of commodity and statute is very broad. It includes events on sports, it includes events on politics, it includes corn and grains and all sorts of things,” he said. “It doesn’t really distinguish between if you’re offering an event contract on grains, [that] you’re regulating that differently than an event contract on sports.”


OpenAI Chief Executive Sam Altman said U.S. policymakers must act now to prepare for advanced artificial intelligence, warning that the technology is moving from theory into daily economic use.
In an interview with Axios, Altman said AI systems already handle coding and research tasks that once required teams of programmers. Newer models will go further, he said, helping scientists make major discoveries and allowing individuals to do the work of entire groups.
That shift is already visible in cybersecurity, where some industry leaders say artificial intelligence is tilting the balance toward attackers.
Charles Guillemet, chief technology officer at hardware wallet maker Ledger, for example, told CoinDesk that AI tools are lowering the cost and skill needed to find and exploit software flaws. Tasks that once took months, such as reverse-engineering code or linking multiple vulnerabilities, can now be completed in seconds with the right prompts.
The crypto industry saw more than $1.4 billion in assets stolen or lost in attacks last year. That figure could keep growing, Guillemet suggested. Moreover, developers are increasingly relying on AI-generated code, which may potentially introduce new flaws at scale.
The response, he said, will require stronger defenses such as mathematically verified code, hardware devices that keep private keys offline and a broader recognition that systems can fail.
AI in cyber, biosecurity
While Altman noted that AI could speed up drug discovery or materials science, he also flagged that it could also enable more powerful cyberattacks and lower the barrier to harmful biological research. Such threats may emerge within a year, which makes coordination across government, tech firms and security groups urgent.
“We’re not that far away from a world where there are incredibly capable open-source models that are very good at biology,” he said. “The need for society to be resilient to terrorist groups using these models to try to create novel pathogens is no longer a theoretical thing.”
Another example he suggested was a “world-shaking cyberattack” that could occur as early as this year. Avoiding that, he said, would require a “tremendous amount of work.”
He framed OpenAI’s policy ideas as a starting point, aiming to push debate on how to manage systems that learn fast and act across many fields. Using AI to help defend against these potential attacks, he said, is important.
On the potential nationalization of OpenAI, Altman said the case against it relies on the need for the U.S. to achieve “superintelligence” before its rivals do.
“The biggest case against nationalization would be that we need the U.S. to succeed at building superintelligence in a way that is aligned with the democratic values of the United States before somebody else does,” he said. “That probably wouldn’t work as a government project, I think that’s a sad thing.”
Still, Altman said he believes companies involved in AI must work closely with the U.S. government.
Given his role at OpenAI, Altman also has a financial stake in how the sector evolves. That position may shape how he frames both the urgency of regulation and the role of private companies like OpenAI in managing emerging risks, which could influence the firm’s competitive standing.
AI as a utility
Energy is one area where he sees quick progress because greater processing power capacity could keep costs down as AI demand grows.
Altman also pointed to early signs of labor shifts. A programmer in 2026, he said, already works differently to one a year earlier.
AI will become a sort of utility, like electricity, embedded across devices while the cost of basic intelligence falls and top systems remain expensive.
“You will have this personal super assistant running in the cloud,” Altman said. “If you use it a lot or use it at high levels of intelligence you’ll have a higher bill one month and if you use it less, you’ll have a lower bill.”
It’s “incredibly important that people building AI are high integrity, trustworthy people.”


Crypto lobbyists, banks, and the White House are circling a fragile compromise on stablecoin yields that could finally unstick the Clarity Act and set the rules for “digital dollar” rewards in the U.S.
Summary
- Crypto and banking lobbyists have reopened talks on stablecoin yields under the Clarity Act, with insiders signaling a possible breakthrough this month.
- A forthcoming White House report is expected to lean pro-crypto on stablecoin yields, even as banks warn of deposit flight and push to curb passive rewards.
- If the yield dispute clears, lawmakers are set to pivot the Clarity Act fight toward DeFi, tokenization, and token classification later this year.
The long‑running clash between U.S. crypto firms and banks over how stablecoin yields should be regulated appears to be entering its endgame, as both sides quietly review a fresh compromise under the Digital Asset Market Clarity Act in Washington this month. According to policy newsletter Crypto In America, “the core disagreement between the U.S. cryptocurrency and banking industries regarding the stablecoin yield mechanism may be close to resolution,” with several informed sources saying negotiators have launched a new round of talks around updated text. Odds trackers quoted by Coingape now put the bill’s chances of passing this year at roughly 64%, up sharply since February.
Earlier drafts pushed by senators Thom Tillis and Angela Alsobrooks had drawn fire from large industry players, with Coinbase and Stripe among those warning that an outright ban on passive stablecoin yields would gut key revenue lines and crimp innovation. Coinbase chief legal officer Paul Grewal recently told FinTech Weekly that a deal on yields is “very close,” even as the March 23 draft still “bans passive yield on stablecoin balances directly or indirectly and permits only narrowly defined activity‑based rewards.” Coinbase CEO Brian Armstrong has accused big banks of “undermining” President Trump’s crypto agenda by backing language that would ban the 4–5% stablecoin yields underpinning an estimated $1.35 billion in annual revenue for the exchange. In a previous crypto.news story, Armstrong argued that allowing such payouts simply passes through Treasury returns already required under the 2025 GENIUS Act, which mandates that payment stablecoins be fully backed by cash or short‑term U.S. government debt.
A still‑unpublished White House research report on stablecoin yields is widely expected to conclude that banks should “not view stablecoin yield offerings as a competitive threat,” according to comments by White House crypto adviser Patrick Witt. Witt told Yahoo Finance that reward programs on fully backed stablecoins “do not undermine the banking industry’s business model,” framing the fight as a chance for both sectors to coexist rather than a zero‑sum battle. Yet banking groups remain aggressive: community banks have warned Congress that yield‑style stablecoins could siphon “billions from insured deposits,” while some Wall Street institutions argue that interest‑bearing stablecoins function as “shadow deposits” that could drain as much as $500 billion from the system by 2028.
If the yield question is finally neutralized in committee later this month, lawmakers and lobbyists expect the Clarity Act debate to pivot to unresolved issues around DeFi rules, tokenization regimes, and which tokens fall under securities law versus commodities law, as detailed in prior crypto.news coverage of the bill. With stablecoins like USD Coin, which maintains a $70‑plus billion market capitalization and trades near $1 on crypto.news price trackers, now central to both payments and on‑chain yield strategies, the outcome of the Clarity Act’s sprint through the Senate Banking Committee will help decide how far U.S. investors can go in chasing returns on “digital dollars” without leaving the banking system behind.
Key points:
-
Bitcoin rose above the $70,000 level on Monday, but analysts remain skeptical, expecting a drop below the $60,000 support.
-
Several major altcoins have bounced off their supports, indicating demand at lower levels.
Buyers pushed Bitcoin (BTC) above the $70,000 level, but failed to sustain the breakout. That suggests the bears have not given up and are trying to retain control. Select analysts believe that BTC is likely to dip below its $60,000 low before bottoming out.
Another negative view came from Glassnode, which said in its recent report that its Long-Term Holder Realized Loss metric, which tracks losses locked in by investors who held coins for more than six months before selling, suggests the selling pressure may not have exhausted. The 30-day simple moving average of the indicator at $200 million per day needs to drop to levels below $25 million for the base formation to begin.

Among all the bearishness, there is a silver lining for the bulls. According to crypto sentiment platform Santiment, social media platforms recorded five bearish BTC comments for every four BTC bullish comments, the most since Feb. 28.
That is a good sign as markets typically move in the opposite direction of the crowd’s expectation, suggesting “things can turn positive sooner rather than later,” Santiment added.
Could buyers extend the recovery in BTC and the major altcoins? Let’s analyze the charts.
S&P 500 Index price prediction
The S&P 500 Index (SPX) has pulled back to the 20-day exponential moving average (6,601), indicating solid buying at lower levels.

Sellers will attempt to halt the recovery at the 20-day EMA, but if the bulls prevail, the index may rise to the 50-day simple moving average (6,777). Sellers are expected to pose a strong challenge at the 50-day SMA.
On the downside, the bears will have to yank the price below the 6,316 level to signal the resumption of the corrective phase. The next support to watch out for on the downside is the 6,147 level.
US Dollar Index price prediction
The US Dollar Index (DXY) is stuck between the 20-day EMA ($99.59) and the 100.54 overhead resistance.

Sellers are attempting to pull the price below the 20-day EMA. If they can pull it off, the index may decline to the 50-day SMA (98.44). That suggests the index may trade inside the large range between 95.55 and 100.54 for a while longer.
Buyers will have to maintain the price above the 20-day EMA to retain control. If they do that, the possibility of a break above the 100.54 level increases. The index may then start a new up move to the 102 level and subsequently to the 103.54 level.
Bitcoin price prediction
BTC closed above the moving averages on Sunday, indicating that the bulls are attempting a comeback.

The flattish moving averages and the relative strength index (RSI) near the midpoint do not give a clear advantage either to the bulls or the bears. If the price sustains above the moving averages, the bulls will attempt to drive the BTC/USDT pair above the $72,000 resistance. If they succeed, the BTC price may reach the $74,508 to $76,000 resistance zone.
Sellers are likely to have other plans. They will strive to pull the pair below the support line, invalidating the bullish setup. That opens the doors for a decline to the $62,500 to $60,000 support zone.
Ether price prediction
Ether (ETH) closed above the moving averages on Sunday, clearing the path for a rally to the $2,200 resistance.

Sellers will attempt to halt the recovery at the $2,200 level, but if the buyers pierce the resistance, the ETH/USDT pair may march to the $2,400 resistance. The bulls will have to propel the ETH price above the $2,400 level to start a sustained recovery to $2,800 and then to $3,050.
Alternatively, if the ETH price turns down sharply from the $2,200 level and breaks below the moving averages, it suggests that the pair may consolidate for some time. The support of the range is at the $1,916 level.
BNB price prediction
BNB’s (BNB) bounce off the $570 level has reached the moving averages, where the bears are expected to step in.

If the price turns down sharply from the moving averages, the BNB/USDT pair risks breaking below the $570 level. If that happens, the BNB price may resume the downtrend and plummet to the $500 level.
Instead, if buyers drive the price above the moving averages, it suggests that the pair may extend its stay inside the $570 to $687 range for a few more days. Buyers will be back in the driver’s seat on a close above the $687 level.
XRP price prediction
XRP (XRP) turned up from the crucial $1.27 support on Sunday, indicating that the bulls are aggressively defending the level.

The bulls will have to secure a close above the 50-day SMA ($1.39) to improve the prospects of a rally to the $1.61 level and later to the downtrend line of the descending channel pattern.
On the contrary, if the XRP price turns down sharply from the moving averages and breaks below $1.27, it suggests that the bears remain in control. The XRP/USDT pair may plunge to the $1.11 level and eventually to the support line near the $1 level.
Solana price prediction
Solana (SOL) has been oscillating inside the $76 to $98 range for several days, indicating a tough battle between the bulls and the bears.

If buyers push the price above the moving averages, the SOL/USDT pair may ascend to the $98 resistance. Sellers are expected to fiercely defend the $98 level in an attempt to keep the SOL price inside the range.
The next trending move is expected to begin on a close above $98 or below $76. If buyers thrust the price above the $98 resistance, the pair may surge to the $117 level. Conversely, a close below the $76 support might sink the pair to the $67 level.
Related: First real bull signal since 2025? Five things to know in Bitcoin this week
Dogecoin price prediction
Dogecoin (DOGE) remains stuck inside a tight range between the 50-day SMA ($0.09) and the $0.09 level, signaling a balance between supply and demand.

Buyers will gain the upper hand on a close above the moving averages. The DOGE/USDT pair may rally to the $0.11 level and subsequently to the $0.12 resistance. If the price turns down from the overhead resistance, the pair may swing between $0.12 and $0.09 for a while.
If the DOGE price turns down from the moving averages and breaks below the $0.09 level, it signals that the bears have seized control. The pair may slump to the $0.08 level and thereafter to the $0.06 level.
Hyperliquid price prediction
Buyers are attempting to maintain the Hyperliquid (HYPE) price above the 20-day EMA ($37.03) but are facing strong resistance from the bears.

If the HYPE price closes above the 20-day EMA, it suggests that the lower levels continue to attract buyers. The HYPE/USDT pair may then rally to $41.59 and, after that, to the $44 level.
This positive view will be negated in the near term if the price turns down and breaks below the 50-day SMA ($34.48). The pair may then witness a deeper correction to the $30 level.
Cardano price prediction
Cardano (ADA) closed above the $0.25 level on Sunday, signaling that the bears are losing their grip.

There is resistance at the 50-day SMA ($0.26), but if the bulls overcome it, the ADA/USDT pair may reach the downtrend line of the descending channel pattern. Sellers are expected to defend the downtrend line, as a close above it signals a potential short-term trend change.
The $0.22 level is the crucial level to watch out for on the downside. If the support breaks down, the ADA price may start the next leg of the downtrend to the support line near the $0.16 level.
This article does not contain investment advice or recommendations. Every investment and trading move involves risk, and readers should conduct their own research when making a decision. While we strive to provide accurate and timely information, Cointelegraph does not guarantee the accuracy, completeness, or reliability of any information in this article. This article may contain forward-looking statements that are subject to risks and uncertainties. Cointelegraph will not be liable for any loss or damage arising from your reliance on this information.
MicroStrategy acquired 4,871 Bitcoin (BTC) for approximately $329.9 million at an average price of $67,718, buying aggressively below its own cost basis while nearly every other corporate buyer has gone silent.
The purchase lifts Strategy’s total holdings to 766,970 BTC. The firm has now spent roughly $58.02 billion to accumulate Bitcoin, at an average of $75,644 per coin.
MicroStrategy Is Buying When Nobody Else Will
The headline number is modest by Strategy’s own standards. Earlier in 2026, the company made its largest single purchase of the year, 22,337 BTC for $1.57 billion.
Yet the context around the latest purchase tells a different story.
Over the past 30 days, Strategy purchased roughly 45,000 BTC. Every other publicly traded treasury company combined added just 1,000 BTC in the same period.
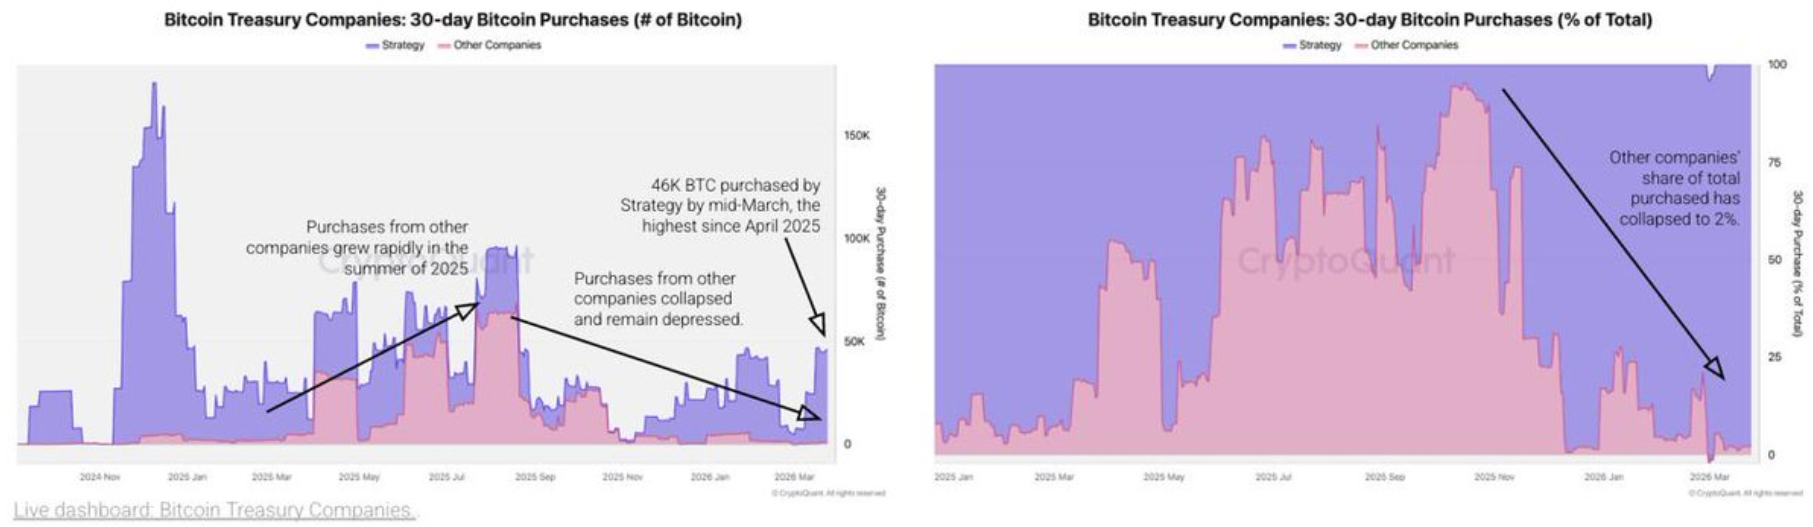
Non-Strategy corporate purchases have dropped 99% from their August 2025 peak, when the wider cohort bought 69,000 BTC in a single month.
MicroStrategy now holds approximately 76% of all Bitcoin on publicly traded corporate balance sheets. The company added around 90,000 BTC year-to-date, while all other treasury firms combined contributed a net 4,000 BTC.
That concentration makes each new Strategy filing less about volume and more about conviction.
The firm is stacking at prices well below its blended average, effectively pulling down its cost basis while competitors sit on the sidelines.
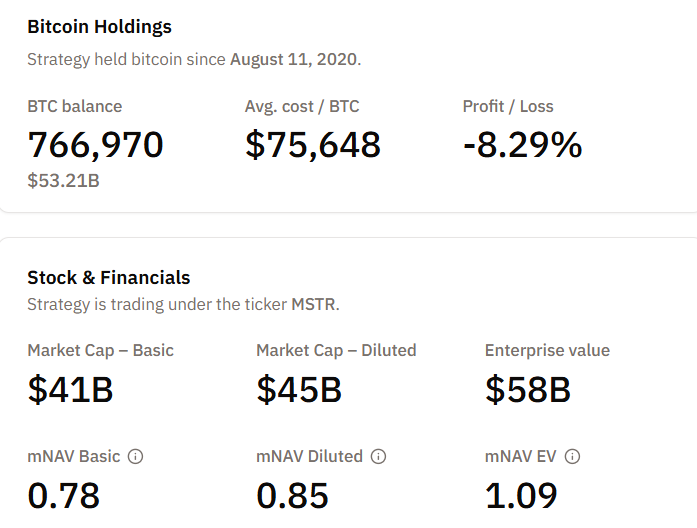
The $67,718 average purchase price matters more than the quantity. It sits almost $8,000 below Strategy’s all-in average of $75,648, meaning every coin added at this level improves the firm’s overall position.
What Makes This the Loudest Signal
MicroStrategy’s market-cap-to-net-asset-value ratio sits around 0.85, meaning its equity trades below the value of its Bitcoin holdings.
That dynamic raises questions about whether continued share issuance dilutes existing shareholders. However, Saylor and his team are betting that consistent below-average buying will vindicate the approach over time.
Meanwhile, the gap between Strategy and BlackRock’s iShares Bitcoin Trust (IBIT) has narrowed to roughly 15,000 BTC.
IBIT held approximately 782,475 BTC as of this writing, up only about 8,484 BTC year-to-date, compared to Strategy’s 90,000 BTC surge.
Strive Follows the MicroStrategy Playbook
Strategy is not entirely alone. Strive Inc. (Nasdaq: ASST), the Bitcoin treasury firm founded by Vivek Ramaswamy, separately announced the purchase of 113 BTC for $7.75 million at an average cost of roughly $68,577 per coin. That brings Strive’s total holdings to 13,741 BTC as of April 2.
The scale differs dramatically, but the signal rhymes. Strive also bought below its historical average and continues to add while most corporate buyers have paused.
In March, the firm purchased $50 million of Strategy’s STRC preferred stock, an investment that ties its returns partly to Strategy’s own Bitcoin accumulation strategy.
“We believe Digital Credit could be a multi-trillion-dollar opportunity, and every single update today aims to improve the credit quality and lower the expected volatility profile of our Digital Credit product, SATA,” read an excerpt in the announcement, citing Cole.
Strive accumulated most of its Bitcoin through private placement proceeds and its acquisition of Semler Scientific, which contributed 5,048 BTC.
The firm reported a 22.2% “Bitcoin Yield” in Q4 2025, a proprietary metric tracking the percentage change in Bitcoin per share.
The post MicroStrategy Buys the Dip Again: Why 4,871 BTC Purchase Speaks Loudest Yet appeared first on BeInCrypto.


Korean super app Toss is weighing a custom Layer 1 or Layer 2 blockchain and native token to power its “Money 3.0” stablecoin push as Seoul finalizes a strict digital asset law.
Summary
- South Korean fintech super app Toss is exploring a proprietary blockchain network and native cryptocurrency as part of its “Money 3.0” strategy.
- The firm has not yet chosen between a Layer 1 mainnet or a Layer 2 scaling design, with the decision closely tied to Seoul’s forthcoming Basic Law on Digital Assets.
- The move would deepen Toss’s push into stablecoins and tokenized finance, as the company posts record revenue of about $1.8 billion and prepares for possible overseas expansion.
South Korean payment and banking giant Toss is considering building its own blockchain network and issuing a native cryptocurrency, a move that would extend the super app’s stablecoin and Web3 ambitions into a full-stack digital asset platform, according to reporting from The Block. People familiar with internal discussions told Crypto In America that Toss is weighing whether to launch on a standalone Layer 1 mainnet or pursue a Layer 2 scaling approach, with no final decision yet taken. Insiders added that the architectural choice is being shaped by the progress of South Korea’s Basic Law on Digital Assets, a landmark bill expected to codify rules for token issuance, stablecoins, and crypto ETFs.
Toss, operated by Viva Republica, has rapidly grown from a mobile transfers app into a dominant financial super app with more than 30 million registered users and around 24 million monthly active users as of 2024, offering some 290 services from payments to trading and lending. The Korea Herald reports that Toss generated revenue of roughly $1.8 billion in 2025, up 38% year-on-year, while operating profit surged 270.3% to about $251 million and net profit jumped 846.7% to roughly $151 million. At the 2026 Seoul Blockchain Meetup, Toss corporate development director Seo Chang‑whoon said the company is “moving toward a new ‘Money 3.0’ era centered on blockchain and stablecoins,” outlining a vision in which programmable money makes finance “universal, programmable, verifiable, composable and seamless.”
The Basic Law on Digital Assets—sometimes described by Korean lawmakers as a “foundational” crypto statute—is expected to set strict requirements for stablecoin issuers, including 100% reserve backing in low‑risk assets and potential limits favoring bank‑led consortia. Lawmaker Min Byeong‑deok has called the bill “a significant turning point for the future of digital finance in the Republic of Korea,” arguing that it will finally provide a clear legal base for local firms to issue won‑denominated tokens rather than routing activity overseas. Industry observers say the second half of 2025 through the first half of 2026 could be an “explosive growth window” for Korean stablecoins as payments firms like Toss and rivals such as Kakao Pay and Naver Pay roll out won‑backed tokens and experiment with cross‑border use cases.
For Toss, a proprietary blockchain and native token could serve as the backbone for that strategy, underpinning everything from loyalty and remittances to on‑chain credit products that link its SohoScore small‑business credit model with smart contracts. “By 2026, we aim to complete a borderless financial super app by redesigning money itself—removing boundaries across borders, products, time and entities,” Seo said, framing the firm’s blockchain push as essential infrastructure for the next phase of its growth. Whether Toss ultimately opts for a Layer 1 network or a Layer 2 aligned with existing ecosystems will likely hinge on how far the Basic Law goes in steering stablecoin issuance toward bank‑controlled consortia and what room it leaves for independent fintech‑led chains.


The ETH treasury company posted its largest weekly purchase since December, and will begin trading on the main NYSE board on Thursday.
Tom Lee’s Bitcoin (BTC) mining company turned Ethereum (ETH) digital assset treasury (DAT), BitMine Immersion Technologies, has been approved to uplist from NYSE American to the New York Stock Exchange (NYSE). The company announced the news in a press release today, April 6, alongside its latest ETH purchase and staking data.
The largest Ethereum treasury firm’s move to NYSE is an indicator of growth and maturity for the firm, as the main NYSE board has stricter requirements, including for number of shareholders and float. Generally, the move marks an ascent from small-cap to large-cap status. Trading under the same ticker, BMNR, will move to the NYSE at the open on Thursday, April 9, the release notes.
BMNR shares on NYSE American are up over 6% today on the news, per data from Yahoo Finance, trading near $21.
The uplisting news came alongside BitMine’s weekly treasury update, which showed the company acquired 71,252 ETH in the past week — its largest single-week purchase since the week of December 22, 2025.
Total ETH holdings now stand at 4,803,334 tokens, valued at an average purchase price of $2,123 per ETH. The firm’s combined crypto, cash, and moonshot holdings total $11.4 billion, the release notes.
As of April 6, the company has staked 3,334,637 ETH, worth approximately $7.1 billion, making it the second-largest Etheruem staking entity after Lido, per Dune.
BitMine now owns 3.98% of the total ETH supply, placing it 79% of the way toward its self-described “Alchemy of 5%” target, according to today’s release.
As The Defiant previously reported, the largest DATs, namely BitMine and Michael Saylor’s Strategy, have continued to increase their crypto purchases as markets more broadly stagnate.
Also today, Strategy disclosed its latest weekly Bitcoin purchase, reporting that it has a 4,871 BTC purchased for approximately $329.9 million at an average price of $67,718 per coin. Strategy now holds 766,970 BTC in total, making it the largest DAT by holdings, followed by BitMine.
Spot ETH is up nearly 6% as well today as the broader crypto markets rally. ETH is trading near $2,155 and is currently the best performing asset among the top-ten large-caps on the daily and weekly timeframes.
This article was written with the assistance of AI workflows. All our stories are curated, edited and fact-checked by a human.
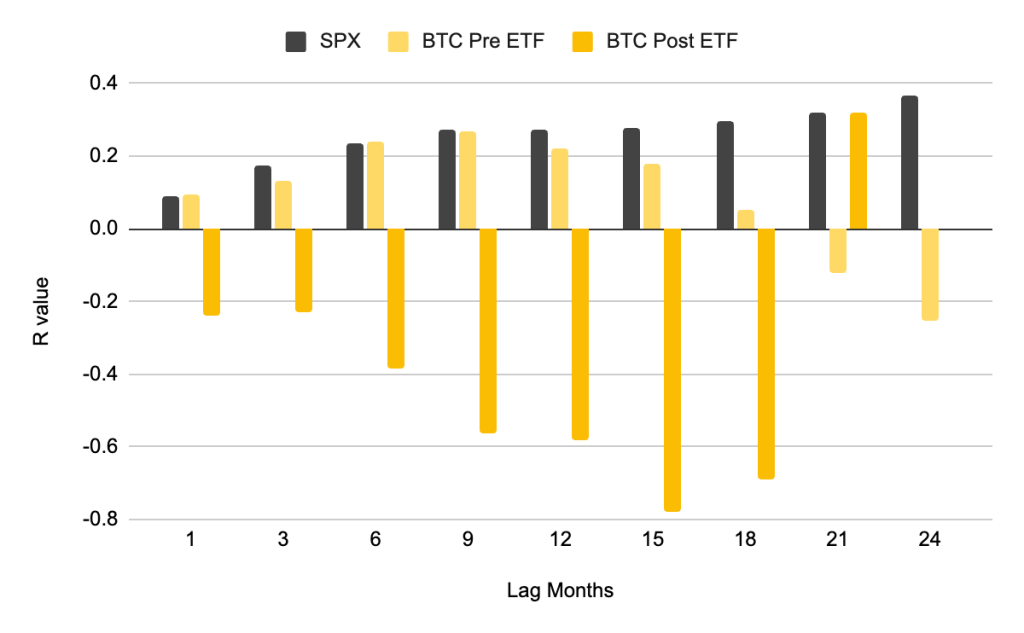
Bitcoin price correlation with Binance Research‘s Global Easing Breadth Index, a composite tracking monetary policy direction across 41 central banks, has flipped from +0.21 before spot ETF approval to −0.778 in 2026.
That isn’t a weakening of the old relationship; it’s a complete structural inversion, nearly three times stronger in the opposite direction.
The new Binance Research case study argues that Bitcoin has evolved from a macro lagging receiver to a leading pricer, front-running Fed interest rate decisions rather than reacting to them, and increasingly indifferent to ETF flow headlines that once moved the market within hours.
If that thesis holds, the entire macro playbook that active traders have used for the past decade breaks down.
CPI prints, FOMC language, and rate trajectory models were once the primary variables in any serious BTC position. In 2026, Binance’s data suggests those triggers have been demoted, and knowing what replaced them is now the edge.
- Correlation inversion: Bitcoin’s correlation with Binance’s Global Easing Breadth Index shifted from +0.21 before ETF approval to −0.778 in 2026-a complete structural reversal, not a gradual drift.
- Institutional positioning lead: ETF-driven institutional investors now build BTC positions 6–12 months ahead of Fed policy changes, making Bitcoin a forward-looking price discovery mechanism rather than a reactive risk asset.
- ETF market scale: Cumulative Bitcoin ETF inflows reached $56 billion by Q1 2026, with assets under management at $87.5 billion-approximately 6% of Bitcoin’s total market cap.
- Flow reversal signal: After $6.4 billion in outflows from November 2025 through February 2026, Bitcoin ETFs absorbed $1.3–$2.5 billion in March 2026 inflows, suggesting institutions are treating dips as accumulation opportunities.
- Supply shock trajectory: Bitwise projects ETFs will purchase more than 100% of all new Bitcoin issuance in 2026, a demand-supply dynamic with no historical precedent in BTC’s market structure.
- On-chain confirmation: Exchange reserve depletion and elevated LTH supply corroborate the Binance macro data-internal accumulation metrics, not Fed language, are now the load-bearing price drivers.
Discover: The Best Crypto Presales Live Right Now
What the Binance Data Actually Shows – and Why the Old Correlation Is Now Running in Reverse
The −0.778 correlation reading between Bitcoin price and the Global Easing Breadth Index is the headline number, but the mechanism behind it is what matters.
Before the January 2024 launch of spot Bitcoin ETFs in the United States, retail traders dominated BTC price discovery, reacting immediately to macro signals, selling on rate-hike language, and buying when easing breadth widened.
That reflex produced a mild positive correlation: more global central bank easing led to greater risk appetite, and BTC benefited.

Institutional investors entering through ETF vehicles operate on a fundamentally different timeline. Binance Research documents that these players now build positions 6–12 months ahead of expected policy changes, effectively pricing in Fed decisions before official announcements arrive.
The result: when the Fed finally eases, BTC has already moved, and the correlation appears negative to any observer measuring it in real time.
On-chain data reinforces the structural argument. Long-term holder (LTH) supply has remained at historically elevated levels through Q1 2026 despite price volatility, consistent with accumulation rather than distribution.
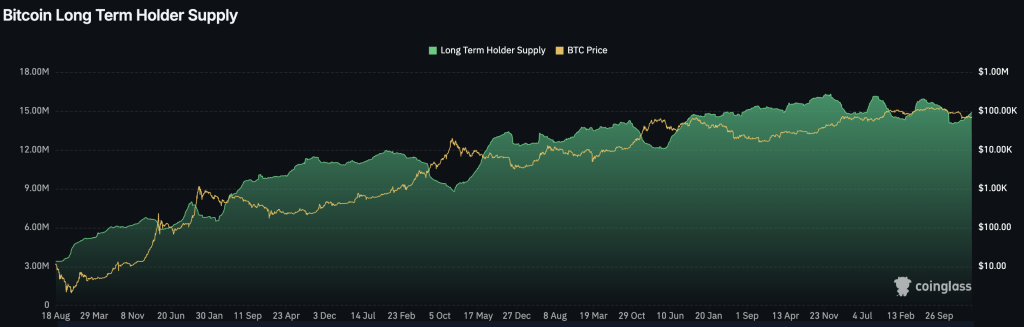
Exchange reserve depletion continues-Bitcoin held on centralized exchanges has trended lower across the cycle, a signal that coins are moving into cold storage rather than toward sell-side liquidity.
The MVRV ratio, which compares market cap to realized cap, has held below 2.0 throughout early 2026, indicating the market remains well below the euphoria zone that has historically preceded major tops.
Together, these on-chain metrics describe a market structure where supply is contracting and patient capital is dominant-conditions that make BTC less reactive to short-term macro noise, not more.
The data makes the decoupling thesis concrete: Bitcoin isn’t ignoring the Fed because traders have become irrational. It’s ignoring the Fed because the marginal buyer has changed, and the new marginal buyer already knows what the Fed is going to do.
What the Decoupling Means for How You Position in Q2 2026
The practical consequence of the Binance thesis is a signal hierarchy reorder. Traders who treat CPI prints and FOMC meetings as tier-one BTC catalysts are using outdated inputs.
The new signal stack, as the data implies, runs: ETF weekly flow data first, LTH supply and exchange reserve metrics second, legislative and regulatory developments third, and Fed language a distant fourth.
The bull case requires three conditions to remain intact: ETF inflows sustain above $1 billion per month through Q2, exchange reserves continue declining (currently trending toward multi-year lows), and LTH supply holds above 14.5 million BTC without a significant distribution event.
If those three hold simultaneously, the supply-demand math supports a price structure where $90,000 functions as support rather than resistance, and the Bitwise supply-shock thesis moves from projection to observable market dynamic.
The bear case activates if institutional conviction breaks. A return to sustained ETF outflows, specifically two consecutive months above $2 billion net negative, would signal that the marginal buyer has stepped back, removing the demand anchor that has held the decoupling structure in place.
In that scenario, macro sensitivity could partially reassert, and the $70,000–$72,000 on-chain support band identified in current technical analysis becomes the first meaningful test level.
Binance Research put it plainly: a peak in global easing may already be old news for BTC. Watch monthly ETF flow totals and LTH supply in Q2; those two numbers will confirm or invalidate the decoupling thesis faster than any Fed statement will.
Explore: The best pre-launch token sales with asymmetric upside potential
The post Binance Case Study: Bitcoin Price Is Decoupling From the Fed and ETFs in 2026 appeared first on Cryptonews.

MicroStrategy’s Strategy, the world’s largest publicly listed holder of Bitcoin, resumed new purchases last week after reporting no buys in the final week of March. The company disclosed it acquired 4,871 BTC for $329.9 million, at an average price of $67,718 per coin, according to an 8-K filing with the U.S. Securities and Exchange Commission.
With these additions, Strategy’s Bitcoin stash climbs to 766,970 BTC, acquired for roughly $58 billion. The acquisitions come as Bitcoin traded below Strategy’s cost basis at times, including a dip in early February that marked the first time since late 2023 BTC traded under the fund’s average purchase price.
Key takeaways
- Strategy bought 4,871 BTC for $329.9 million in the latest week, at an average of $67,718 per BTC, bringing total holdings to 766,970 BTC (cost about $58 billion).
- The company’s first-quarter 2026 results show a $14.46 billion unrealized loss on digital assets, offset by a $2.42 billion deferred tax benefit.
- A deferred tax asset related to unrealized losses totaled $1.73 billion as of March 31, offset by a $1.73 billion valuation allowance, with an expectation of an additional $0.5 billion valuation allowance.
- Strategy purchased roughly 54,000 BTC since February 2, with March deliveries among its largest weekly buys, contributing to 89,316 BTC bought in Q1 2026 for about $6.3 billion.
- The company is expanding its at-the-market program with new $21 billion offerings for Stretch (STRC) and Common A (MSTR) stock, while terminating and replacing the prior STRK offering with a new $2.1 billion STRK program; recent share sales generated hundreds of millions of dollars in proceeds.
Strategy’s ongoing Bitcoin accumulation amid tax and valuation dynamics
The latest 8-K filing confirms that Strategy’s accumulation activity continued into the first week of April, underscoring the management’s commitment to Bitcoin as a long-term treasury reserve. The 4,871 BTC purchased last week equate to an average entry price below Strategy’s historical cost basis, reinforcing a pattern of stepping into dips rather than reducing exposure. Since February 2, the company has added approximately 54,000 BTC, signaling persistent confidence in Bitcoin as a store of value and a core part of its balance sheet strategy.
cumulatively, Strategy has spent about $6.3 billion on 89,316 BTC in the first quarter of 2026. This level of buying activity sits against a backdrop of continued price volatility in the broader crypto market, where Bitcoin has experienced retracements and recoveries within a wide trading range.
First-quarter results: unrealized losses and tax accounting under scrutiny
Strategy reported a sharp contrast in its Q1 2026 results: an unrealized loss on its digital assets of $14.46 billion, paired with a $2.42 billion deferred tax benefit. The company explained that the fair value of its Bitcoin holdings remains below its cost basis, triggering the reported deferred tax asset tied to unrealized losses.
As of March 31, the deferred tax asset related to these unrealized losses stood at $1.73 billion, offset by an equivalent $1.73 billion valuation allowance. Management indicated it expects to establish an additional $0.5 billion valuation allowance against these deferred tax assets as fair value movements continue to unfold.
The accounting picture underscores how Strategy’s mark-to-market Bitcoin position interacts with its tax posture, a dynamic closely watched by investors given the volatility of Bitcoin pricing and the company’s ongoing accumulation strategy.
ATM program expansion and latest share-offering moves
Beyond its Bitcoin purchases, Strategy disclosed plans to refresh its at-the-market (ATM) financing program, signaling a broader equity capital strategy alongside its crypto holdings. The company outlined a new $21 billion offering of Stretch (STRC) stock and a new $21 billion offering of Common A (MSTR) stock. It also terminated its previous Strike (STRK) program and launched a new $2.1 billion STRK offering. The aggregate figures reflect the total remaining capacity under both existing programs plus the newly added issuances. In practice, issuances and sales may proceed once existing capacity is exhausted or as market conditions permit.
Recent stock activity illustrates the program’s tempo: from March 30–31, Strategy sold roughly 2.28 million STRC shares and 582,550 MSTR shares, generating about $299.3 million in net proceeds. In the first five days of April (April 1–5), it sold an additional 1,000,000 STRC shares and 593,294 MSTR shares, raising approximately $174.6 million.
These capital movements accompany the ongoing Bitcoin strategy, signaling a dual approach to liquidity management: leveraging equity markets while continuing to deploy capital into BTC.
According to the 8-K filing with the U.S. Securities and Exchange Commission, Strategy’s actions reflect a disciplined, long-horizon approach to its Bitcoin holdings, balanced against tax considerations and capital-raising needs. The filing provides a detailed window into how the company navigates the interplay between crypto markets, accounting rules, and shareholder value creation.
As investors parse Strategy’s latest moves, several questions loom: will Bitcoin’s price trajectory influence the pace of further BTC purchases or redemptions? How will additional valuation allowances affect Strategy’s reported tax position in upcoming quarters? And how will the ATM program evolve in light of market conditions and the company’s broader capital strategy?
Readers should monitor Strategy’s next quarterly update for any shifts in its purchase cadence, cost-basis dynamics, and the balance between crypto exposure and equity-financing activity as the firm maintains its distinctive, long-term treasury strategy.

Binance’s chief compliance officer weighs exit as crime monitors depart

Mukhtalif delivers winning Australian debut in 2026 Caulfield handicap

Sony WH-1000XM5 Wireless Noise-Canceling Headphones Quiet the World for $250


-

 NewsBeat4 days ago
Steven Gerrard disagrees with Gary Neville over ‘shock’ Chelsea and Arsenal claim | Football
-

 Business4 days ago
No Jackpot Winner and $194 Million Prize Rolls Over
-

 Fashion3 days ago
Weekend Open Thread: Spanx – Corporette.com
-

 Crypto World5 days ago
Gold Price Prediction: Worst Month in 17 Years fo Save Haven Rock
-

 Business16 hours ago
Three Gulf funds agree to back Paramount’s $81 billion takeover of Warner, WSJ reports
-
Crypto World6 days ago
Dems press CFTC, ethics board on prediction-market insider trades
-

 Sports2 days ago
India men’s 4x400m and mixed 4x100m relay teams register big progress | Other Sports News
-

 Business5 days ago
Login and Checkout Issues Spark Merchant Frustration
-

 Tech6 days ago
EE TV is using AI to help you find something to watch
-

 Sports6 days ago
Tallest college basketball player ever, standing at 7-foot-9, entering transfer portal
-

 Politics7 days ago
Should Trump Be Scared Strait?
-
Tech6 days ago
Daily Deal: StackSkills Premium Annual Pass
-

 Tech7 days ago
Flipsnack and the shift toward motion-first business content with living visuals
-

 Sports7 days ago
Women’s hockey camp eyes fitness boost, tactics ahead of WC 2026 campaign | Other Sports News
-

 Crypto World7 days ago
U.S. rule change may open trillions in 401(k) funds to crypto
-

 Tech6 days ago
How to back up your iPhone & iPad to your Mac before something goes wrong
-

 NewsBeat7 days ago
Newscast – Scott Mills Sacked By BBC
-

 Tech7 days ago
How We Test Cordless Vacuums
-

 Politics7 days ago
Usha Vance: Disney Hats Over MAGA Caps?
-
Crypto World7 days ago
Valinor raises $25m to put private credit on-chain
You must be logged in to post a comment Login