
Crypto World
Solana (SOL) Price Targets $100 Mark as Consolidation Narrows
Quick Overview
- SOL maintains stability around $87–$88, positioned above its 50-day EMA with critical resistance forming at $90–$94
- Crypto analyst Ali Martinez identified a compressed Bollinger Band pattern spanning $77 to $94 on the 3-day timeframe
- SOL-focused ETFs attracted $9.44 million in weekly net inflows, contributing to a five-day streak totaling roughly $1.45 billion
- Goldman Sachs revealed exposure of approximately $108 million in SOL holdings
- Breaking decisively above $94 could trigger a rally toward $100; falling beneath $77 may signal extended downside
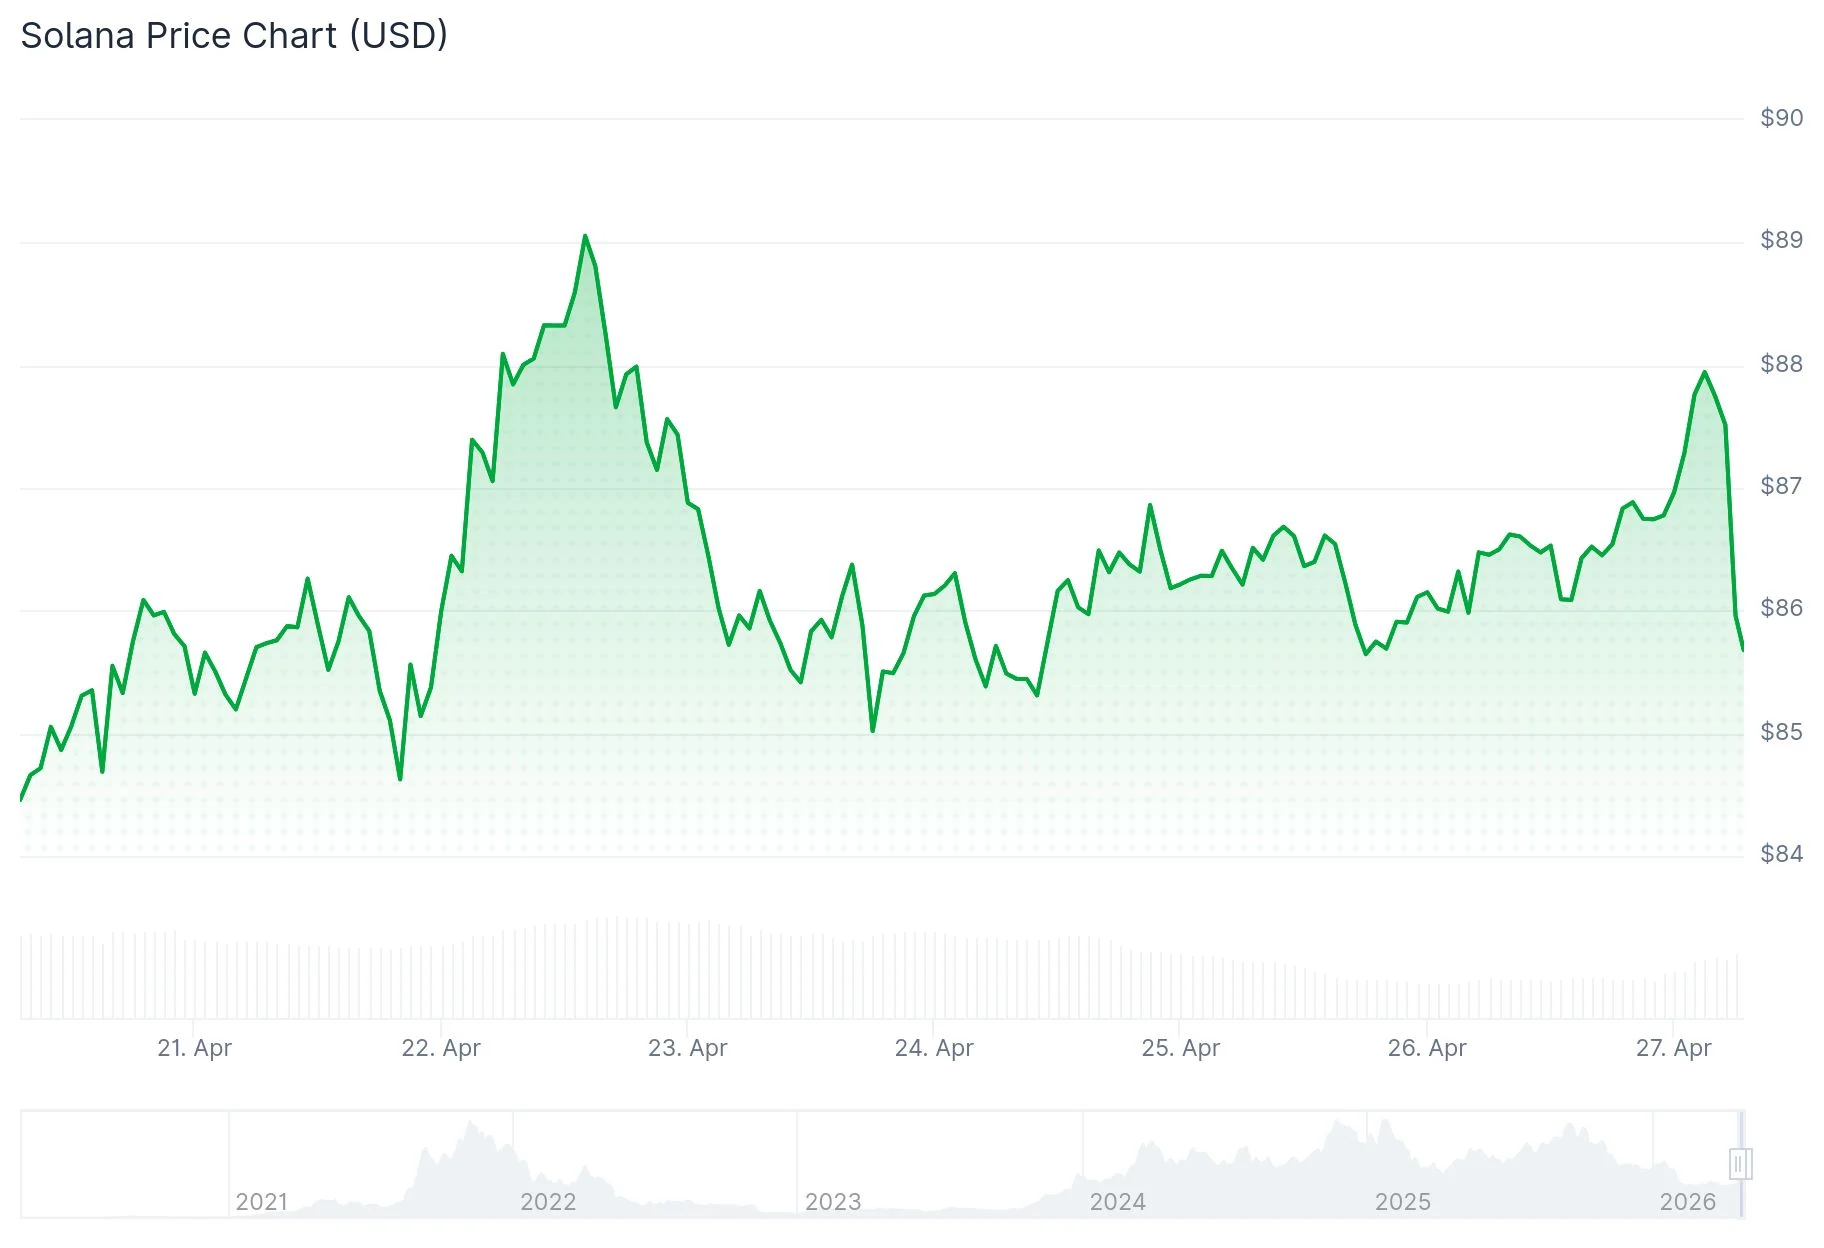
Solana (SOL) is currently exchanging hands around the $87–$88 range on Monday, maintaining ground above its 50-day Exponential Moving Average (EMA) positioned at $87.04. Following a rebound from recent lows near $84.55, the asset is now challenging a significant resistance area.

The digital asset has pushed past the 50% Fibonacci retracement mark derived from its latest decline between $89.34 and $84.55. Technical charts reveal a developing bullish trend line providing support around $86.50 on the hourly timeframe.
Near-term resistance appears at $88.20, corresponding with the 76.4% Fibonacci threshold. Beyond this, major obstacles emerge at $90, with additional resistance waiting at $92.
Crypto market analyst Ali Martinez pointed out that SOL is currently confined within a compressed Bollinger Band corridor on the 3-day chart, spanning from $77 to $94. He characterized this region as a “no-trade zone,” cautioning that attempting to trade within this confined range often results in whipsaw losses. Martinez emphasized that traders should wait for a definitive 3-day candle closure beyond these bands before considering any directional move as legitimate.
Trading volume has declined by over 23% throughout this consolidation period. While reduced volume during lateral price movement is typical, any breakout attempt above $94 will require significantly stronger trading activity to validate a push toward the $100 milestone.
Technical Indicators Show Emerging Bullish Bias
The Relative Strength Index (RSI) currently stands at 55, climbing above the neutral 50 mark on the daily timeframe. Both the MACD and its corresponding signal line have crossed into positive territory, indicating that buying pressure is presently dominant.
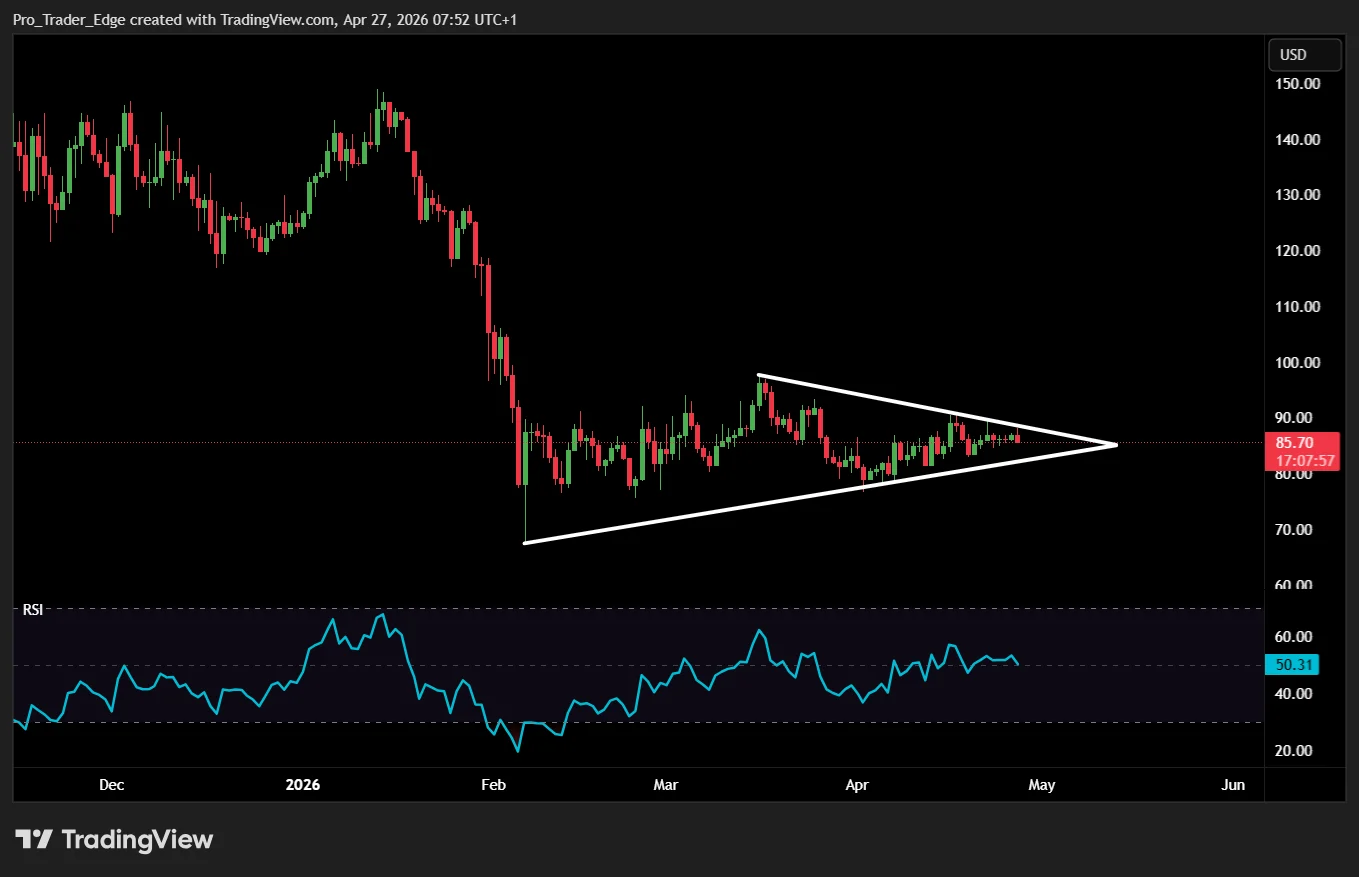
SOL is testing the upper boundary of a symmetrical triangle formation near $89.00 on the daily chart. A convincing breakthrough above this threshold would open the door to the psychologically important $100 level, followed by the 200-day EMA stationed at $113.
Regarding downside scenarios, the 50-day EMA at $87.04 represents the initial support layer. A daily closure underneath the ascending trendline around $85.99 would compromise the current bullish framework.
Institutional Capital and ETF Activity
Solana-focused exchange-traded funds captured $9.44 million in net weekly inflows, down from $35.17 million during the previous week. Despite the weekly decline, five straight days of positive net inflows have accumulated to approximately $1.45 billion.
Goldman Sachs made headlines by revealing a stake valued at nearly $108 million in Solana, representing another significant institutional validation that market participants are monitoring closely.
SOL futures Open Interest climbed more than 2% within 24 hours to reach $5.23 billion. Meanwhile, the funding rate jumped to 0.0095%, demonstrating that traders are willing to pay elevated premiums to maintain long exposure.
Should SOL prove unable to penetrate the $90–$94 resistance band, immediate support levels lie at $86.50, followed by $85. A decisive close beneath $78 could accelerate selling pressure toward the $72 zone.


Crypto World
Micron (MU) and Seagate (STX) Stocks Rally as AI Infrastructure Fuels Memory Chip Shortage

Key Highlights
- Micron (MU) shares have surged over 70% in the current year while maintaining a modest 8.4x forward P/E ratio
- The company’s entire 2026 high-bandwidth memory inventory has been secured through long-term customer agreements
- HBM4 manufacturing commenced in April 2026, delivering 2.8TB/s bandwidth and 20% enhanced energy efficiency versus HBM3E
- The memory chipmaker is advocating for stricter U.S. restrictions on semiconductor equipment exports to China
- Hard drive leader Seagate (STX) reports complete 2026 allocation for its data center nearline storage products
Micron Technology (MU) has experienced remarkable momentum throughout the past twelve months, delivering year-to-date gains exceeding 70%. Even after this substantial rally, shares continue trading at an attractive 8.4x forward earnings multiple that market analysts view as compelling.
The primary catalyst behind this performance has been the company’s high-bandwidth memory portfolio. HBM technology utilizes vertical chip stacking architecture instead of traditional horizontal layouts, enabling dramatically superior data transfer rates compared to conventional DRAM solutions. Micron’s HBM3E variant achieves 1.2TB/s data movement while consuming 30% less energy than competing offerings.
Nvidia selected Micron as a key HBM provider for its Blackwell graphics processing unit series. This partnership has generated demand levels that far exceed current production capabilities. Micron’s complete 2026 HBM manufacturing capacity has been committed through extended customer contracts.
Volume manufacturing of Micron’s advanced HBM4 technology started in April 2026. The new generation delivers bandwidth exceeding 2.8TB/s while boosting energy efficiency by over 20% compared to HBM3E. Market pricing for this cutting-edge product has climbed more than 50%.
Policy Advocacy Creates Competitive Implications
Micron has been engaging with U.S. policymakers to strengthen export restrictions on sophisticated semiconductor manufacturing equipment destined for China. Company leadership frames these efforts around national security concerns. The initiative also carries strategic business implications.
Limiting equipment exports to Chinese semiconductor manufacturers would constrain capacity expansion for competitors including Samsung, SK Hynix, and Chinese domestic DRAM producers. This scenario would reinforce Micron’s established position in artificial intelligence memory markets. Conversely, enhanced restrictions might reduce Micron’s market access within China and potentially trigger retaliatory measures.
Market observers have identified elevated non-cash earnings components and recent insider stock sales as factors deserving continued scrutiny alongside regulatory developments.
Seagate Benefits from Parallel Trends
Seagate Technology (STX) is capitalizing on the identical AI infrastructure expansion cycle. As the global leader in hard disk drive manufacturing, Seagate addresses distinct storage requirements. Approximately 90% of AI-created data ultimately resides on HDD systems, which deliver per-terabyte costs up to six times lower than solid-state alternatives.
Seagate’s heat-assisted magnetic recording (HAMR) technology powers its Mozaic product line, achieving storage density exceeding 4TB per platter — an industry-leading specification. This capability enables data center operators to more than double storage capacity within existing physical infrastructure.
Seagate’s nearline drive portfolio, consisting of high-density units deployed in data centers, has reached full allocation through 2026.
Both organizations count hyperscale cloud providers — including Microsoft, Google, and Amazon — among their principal customers. Capital spending commitments from these technology giants represent a critical variable for future performance. Any deceleration in hyperscaler infrastructure investment could rapidly alter demand dynamics for Micron and Seagate.
Micron launched volume HBM4 production in April 2026, with pricing elevated over 50% compared to previous technology generations.
Crypto World
Ethereum Price Just Hit a Level It First Touched 5 Years Ago: Is This the Bottom or the Beginning of More Pain?

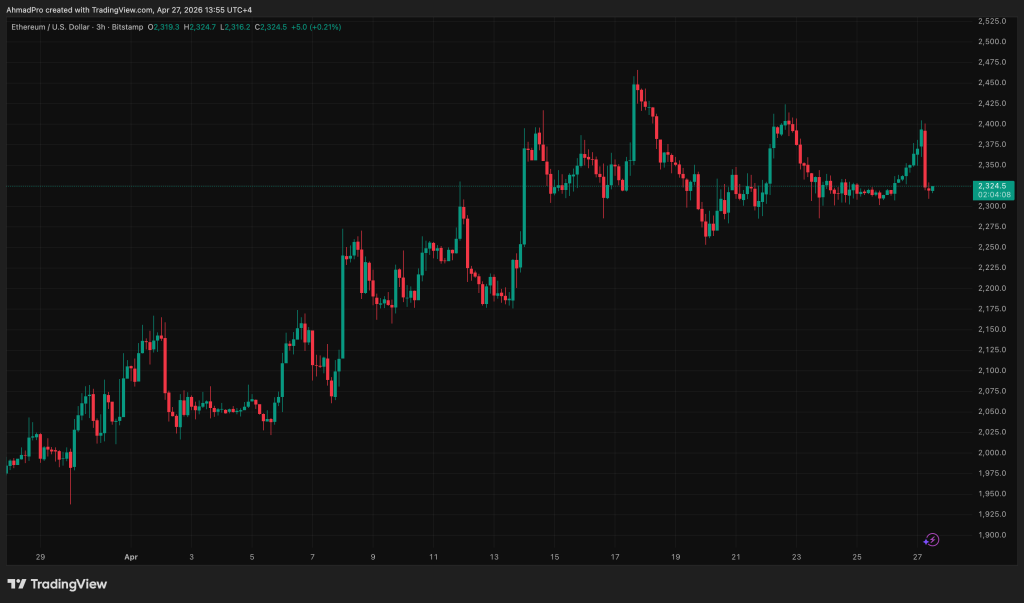
Five years. Zero net return. Ethereum price trades at $2,328 today, the same level it first touched on April 27, 2021, a data point that lands harder than most weekly candles.
ETH posted a modest −0.50% in the last 24 hours, drifting near the midpoint of a channel that has contained price since early February. The question traders aren’t asking loudly enough: is this compression a coil, or a ceiling?
ETH has shed roughly 60% from its 2025 peak of nearly $4,950, with the early-2026 selloff accelerated by recession fears and the Iran war.

With technical signals split and macro conditions still fragile, the immediate price structure deserves a close read before drawing conclusions.
Can Ethereum Price Reclaim $3,000 Before the Next Support Test?
ETH is still stuck in a tight range, moving between roughly $2,300 and $2,405, and it has been doing that for months, which means this is compression, not direction.
Price is sitting close to the top of that range now, so the next move likely comes from here.
There is a bullish setup building with an inverted head-and-shoulders, and if ETH can break above $2,405 with volume, that is where momentum kicks in and opens a move toward $3,000.
But the downside pressure is still there. Longer-term indicators are not fully flipped, and the broader trend has not confirmed a reversal yet.
Most likely for now, it just keeps ranging while the market waits for a catalyst.
The risk is $1,755, because if that breaks, the structure weakens significantly and opens the door toward $1,500.
So this is a classic breakout setup, sitting right under resistance, waiting for confirmation, not there yet, but close.
Here is Why LiquidChain Could Outperform Ethereum in The Coming Bull Cycle
ETH sitting flat for months under resistance is the reality of large-cap assets, they need macro tailwinds to move, and without that, even bullish setups take time to play out. The upside is still there, but it is slower and more dependent on bigger forces.
That is why some traders start looking at earlier-stage infrastructure, where the asymmetry is still present.
LiquidChain is aiming at that gap, focusing on cross-chain liquidity by connecting Bitcoin, Ethereum, and Solana into one environment. The goal is to remove fragmentation so assets can move and interact across ecosystems without the usual friction.
The presale is still early, around $0.01453 with just over $700K raised, which means it is not widely priced yet and still in its accumulation phase. The architecture is built around unified liquidity and easier deployment, which targets a real problem in DeFi.
But it is still early-stage. Execution, adoption, and post-launch liquidity are all unknowns, which is the trade-off with this kind of setup.
So the contrast is clear, ETH offers stability with slower upside, while something like LiquidChain offers earlier positioning with higher potential, but also higher risk.
The post Ethereum Price Just Hit a Level It First Touched 5 Years Ago: Is This the Bottom or the Beginning of More Pain? appeared first on Cryptonews.

Disclosure: This article does not represent investment advice. The content and materials featured on this page are for educational purposes only.
Bitcoin Cash holds steady as BlockchainFX gains investor attention heading into the final week of April 2026.
Summary
- BlockchainFX gains momentum as $0.035 presale price and CEX60 bonus drive strong investor attention in April 2026.
- BFX offers 60% extra tokens before June 1, with staking rewards and a $15M softcap nearing completion.
- As Bitcoin Cash holds steady, BlockchainFX stands out with multi-asset trading, bonuses, and fast-closing presale demand.
Ten thousand dollars is sitting in a wallet right now, and the clock is ticking on where it should go. Bitcoin Cash is doing what BCH usually does, holding its ground without breaking a sweat or breaking records, while a fresh name keeps popping up in every Telegram group and trader chat. That name is BlockchainFX, and the chatter around it has reached a volume that honestly feels hard to ignore as April 2026 winds down toward its final week.

So why is BlockchainFX (BFX) being called the next big crypto by analysts and early buyers alike? The answer sits somewhere between its trading super app design, its Anjouan Offshore Finance Authority license, and a presale that has already pulled in over $14.38M from more than 23,900 participants. Add a juicy bonus code into the mix, and the urgency starts making perfect sense.
Why BFX has traders rushing the final whistle
The presale is currently priced at $0.035 per token, and the launch price is locked at $0.05. That alone hands early buyers a tidy gain before BFX even hits its first exchange. But here’s where things get spicy: the bonus code CEX60 drops 60% extra BFX tokens straight into buyers’ allocations, valid only until June 1st at 6 PM Dubai time. It’s the first exchange listing reveal code, which explains the generosity behind it.
What makes BFX stand out isn’t just the discount. The platform brings stocks, forex, ETFs, commodities, and crypto under one roof, something Binance and Coinbase have flirted with but never properly delivered. On top of that, holders earn daily passive rewards in BFX and USDT through staking, with payouts climbing as high as $25,000 USDT for top stakers. Trading and earning at the same time? That’s the kind of math investors actually enjoy.
The CEX60 math nobody wants to miss
Run the numbers on a $2,000 buy. At $0.035, that grabs roughly 57,142 BFX tokens. Apply the CEX60 bonus, and the total balloons to about 91,427 tokens. At launch price of $0.05, that stack is worth around $4,571 instantly. Now imagine the analyst-backed $1 post-launch target playing out – that same $2,000 turns into roughly $91,427. Wild? Maybe. But with a $15M softcap closing in fast, the window is shrinking by the day.
Quick mention worth tucking in: anyone buying $100+ of BFX gets entered into the $500,000 Gleam giveaway once the presale fully sells out.
Bitcoin Cash outlook: Reliable, but quiet
Bitcoin Cash continues holding its position as one of the most established peer-to-peer payment-focused cryptocurrencies, with recent action reflecting steady but cautious momentum. BCH has caught some upside alongside Bitcoin in recent weeks, but it remains tied to a cycle dictated by liquidity flow, adoption metrics, and overall sentiment rather than any standalone catalyst. For long-term BCH holders, that familiar pattern brings comfort, though not exactly fireworks.
Price predictions for BCH currently lean cautious, with bullish takes pointing toward renewed retail interest and adoption gains, while bearish voices highlight competition from newer chains. The bigger issue for fresh capital? Bitcoin Cash rewards patience, not urgency, and a $10,000 allocation there mostly waits for market cycles to swing. Compared to a presale closing in on its softcap, the opportunity cost stings a little more than usual right now.

Final word: Where that $10,000 should actually land
Based on the latest research, the best crypto presale right now is BlockchainFX, full stop. Bitcoin Cash will keep doing its thing, slow and steady, but BFX is offering ground-floor entry into a regulated trading super app with real users, real volume, and a presale wrapping up faster than most people realize. The next big crypto title isn’t handed out lightly, yet BFX has earned every bit of the attention.
The CEX60 bonus code, the $0.035 entry price, and the looming $15M softcap together create the kind of setup early crypto investors dream about. Once that target hits, the presale ends and BlockchainFX launches, period. Anyone still on the fence might want to lock in their bag before the next big crypto leaves the station without them.
For more information, visit the official website, X, and Telegram.
Disclosure: This content is provided by a third party. Neither crypto.news nor the author of this article endorses any product mentioned on this page. Users should conduct their own research before taking any action related to the company.
Crypto World
BTC price hits wall at $80,000, one analyst says the pullback is temporary: Crypto Daily
Bitcoin is doing that familiar dance just below a big round number, $80,000, stalled by sellers even as fresh stablecoin liquidity, ETF demand and a risk-on equity market suggest the breakout may be delayed rather than denied.
The leading cryptocurrency briefly climbed above $79,000 during Asian trading hours before slipping back to trade below $78,000 recently. Over the past 24 hours, bitcoin has lost about 0.4%. Ether (ETH) has fallen 0.6%, XRP (XRP) is down 0.8% and Solana’s SOL has dropped more than 1%. Broader market benchmarks, including the CoinDesk Memecoin Index and Smart Contract Platform Select Capped Index, were also under pressure, falling more than 1% each.
According to Alex Kuptsikevich, chief market analyst at FxPro, the $80,000 level is acting as a near-term ceiling due to concentrated sell orders.
“Bitcoin has approached the $80K mark for the second time in the last few days, but has since experienced significant downward momentum. As it approaches this round figure, a build-up of sell orders is preventing the coin from moving further upwards,” he said in an email.
Still, Kuptsikevich argued the pullback appears temporary and consistent with a broader uptrend that began in late March.
This is an excerpt from CoinDesk newsletter ‘Daybook.’ Sign up here, if you haven’t already.
On-chain and ETF data offer support for that view. Crypto exchange Binance has recorded a net inflow of roughly $3.4 billion in stablecoins so far this month, following $3 billion in March, according to CryptoQuant data. That suggests fresh capital inflows, waiting for a entry point.
“This indicates an influx of new capital waiting to participate in the recovery,” pseudonymous CryptoQuant analyst Darkfost wrote on X.
Institutional demand remains strong. U.S.-listed spot bitcoin ETFs have pulled in $2.44 billion in investor money this month, the most since October, when bitcoin hit record highs above $126,000.
But not everything is hunky-dory. Security risks in decentralized finance (DeFi) continue to weigh on sentiment. On Sunday, the SUI-based lending platform Scallop was exploited, resulting in the loss of roughly 150,000 SUI, or about $142,000. While small, it adds to a growing list of attacks this month, including the massive Drift and KelpDAO exploits.
Together, DeFi protocols have lost an estimated $623 million to hacks in April alone, according to Memento Research. Since inception, total losses from DeFi-related exploits have climbed to roughly $7.72 billion, according to data source DeFiLlama. This underscores a persistent structural risk for the sector.
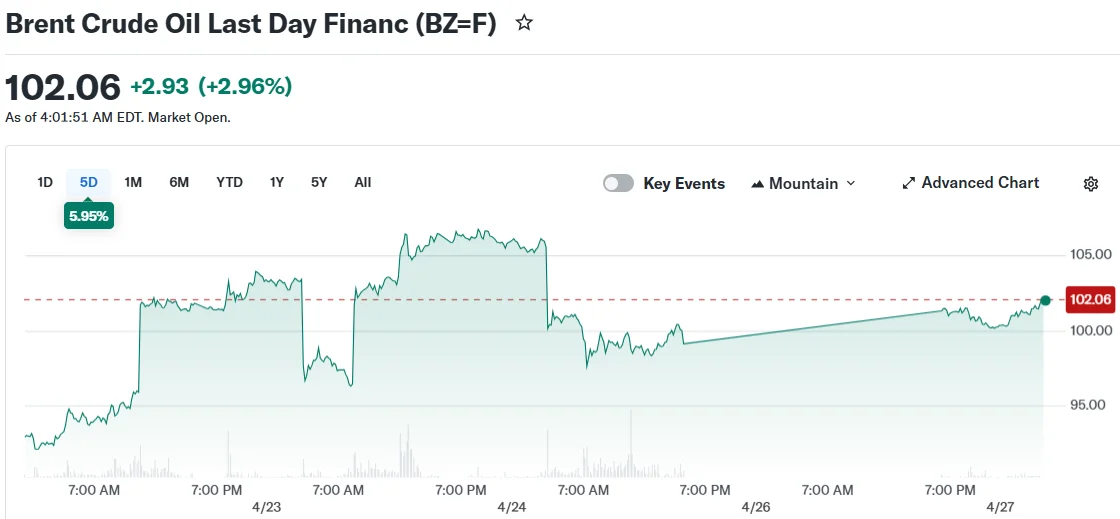
In traditional markets, WTI crude oil prices continue to hover above $90 per barrel, with Brent above $100 as supply remains constrained. The latest pricing is significantly higher than $70 or below before the Iran war began in late February, and threatens to destabilize global economy with high inflation. Stay alert!
Read more: For analysis of today’s activity in altcoins and derivatives, see Crypto Markets Today . For a comprehensive list of events this week, see CoinDesk’s “Crypto Week Ahead.”
What’s trending
Today’s signal

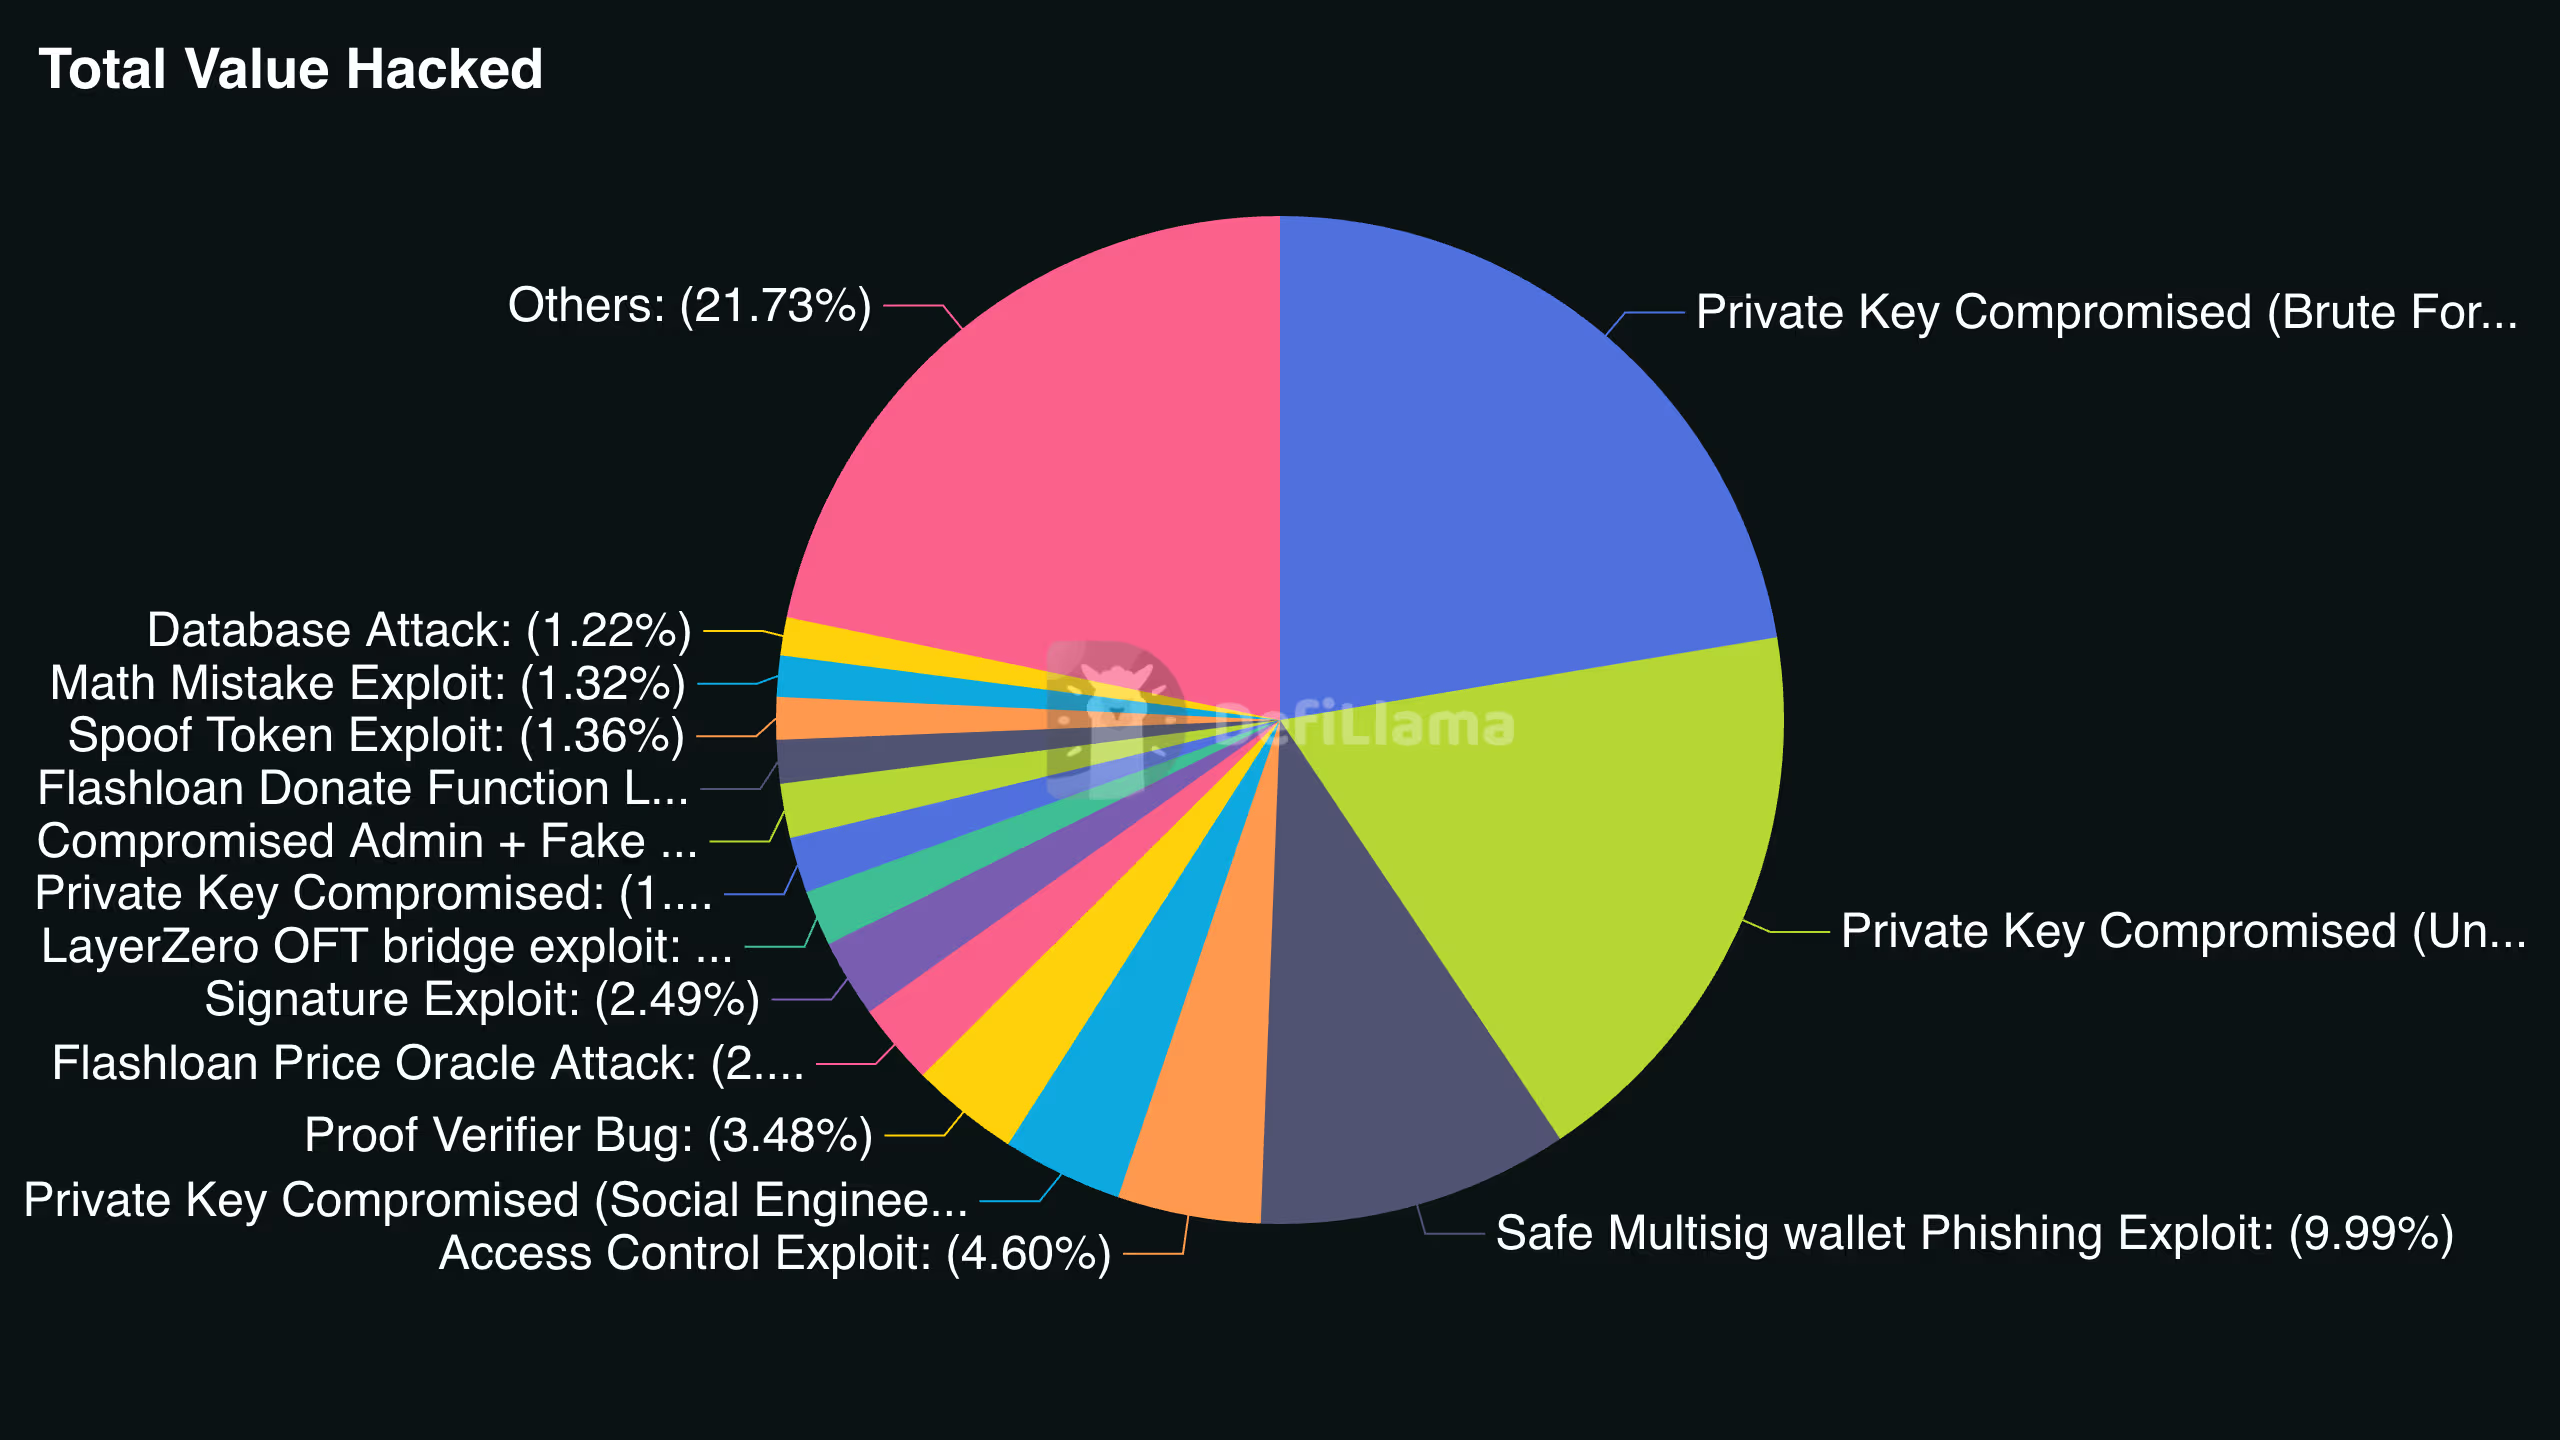
The pie chart shows the breakdown of total losses suffered in crypto hacks by different methods of attack, including private key compromises, phishing exploits, access control issues and other smart-contract vulnerabilities.
Since inception, the biggest vulnerability has been private key compromises, accounting for 40% of the total.
Think of a private key as the master password to your crypto wallet. It’s a long, random string that proves you control your wallet and own crypto funds in it, allowing you to transact onchain. The issue, however, is that there is no reset password option if you lose the key.
So, once the hacker has it, you have lost your wallet and funds. This is known as the private key compromise and the fact that it’s the biggest security risk indicates that audits need to focus beyond just smart contracts.


Google DeepMind has entered into a partnership with South Korea to provide the technical backbone for the country’s K-Moonshot initiative, an ambitious national programme designed to solve the most complex scientific challenges of the century using AI.
Summary
- Google DeepMind partners with South Korea on K-Moonshot, exchanging AI models and data to tackle scientific challenges across life sciences, climate, and meteorology.
- Google to build its first global AI campus in Seoul, with plans for researcher training, industry collaboration, and potential deployment of U.S.-based engineers.
According to recent reports, the collaboration will span several high-stakes fields such as life sciences, meteorology, and climate research. To accelerate progress, both sides have committed to a deep exchange of AI models, specialized tools, and vast scientific datasets.
The agreement was inked in Seoul on Monday by DeepMind Chief Executive Demis Hassabis and Deputy Prime Minister and Science Minister Bae Kyung-Hoon. As a core part of this deal, Google will establish a dedicated AI-focused campus in Seoul.
This facility marks the first of its kind for the company globally and is expected to serve as a melting pot for local engineers, startups, and academic institutions while hosting elite training programmes for Korean researchers.
Officials from the South Korean government said they have already requested that Google dispatch at least ten senior engineers from its U.S. headquarters to provide on-the-ground support for the initiative.
While Demis Hassabis indicated the company is carefully considering this request, he also highlighted plans to strengthen existing ties with local industrial giants, including Samsung, SK Hynix, and Hyundai’s Boston Dynamics.
The partnership will also prioritize the ethical side of innovation by including joint work on AI safety. This cooperation will extend directly to Korea’s AI Safety Institute to ensure that these new technologies are developed with rigorous oversight.
For the uninitiated, K-Moonshot is South Korea’s premier science and technology roadmap built around twelve transformative goals. These targets include revolutionary breakthroughs in AI-led drug discovery, the quest for sustainable fusion energy, and the creation of next-generation humanoid robotics.
Deal follows Alphabet’s expanded AI investment push
The collaboration comes shortly after Alphabet Inc. outlined a major funding commitment to AI firm Anthropic, signalling continued momentum in the sector.
Alphabet said it would invest $10 billion upfront, with plans to commit up to $30 billion more over time. The total package could reach $40 billion if the company meets performance and usage milestones.
Anthropic added that the initial investment values the firm at $350 billion, matching its February round and placing it among the most highly valued startups globally.
Crypto World
Bitcoin swings below $78,000 after failed breakout as altcoins slide: Crypto Markets Today

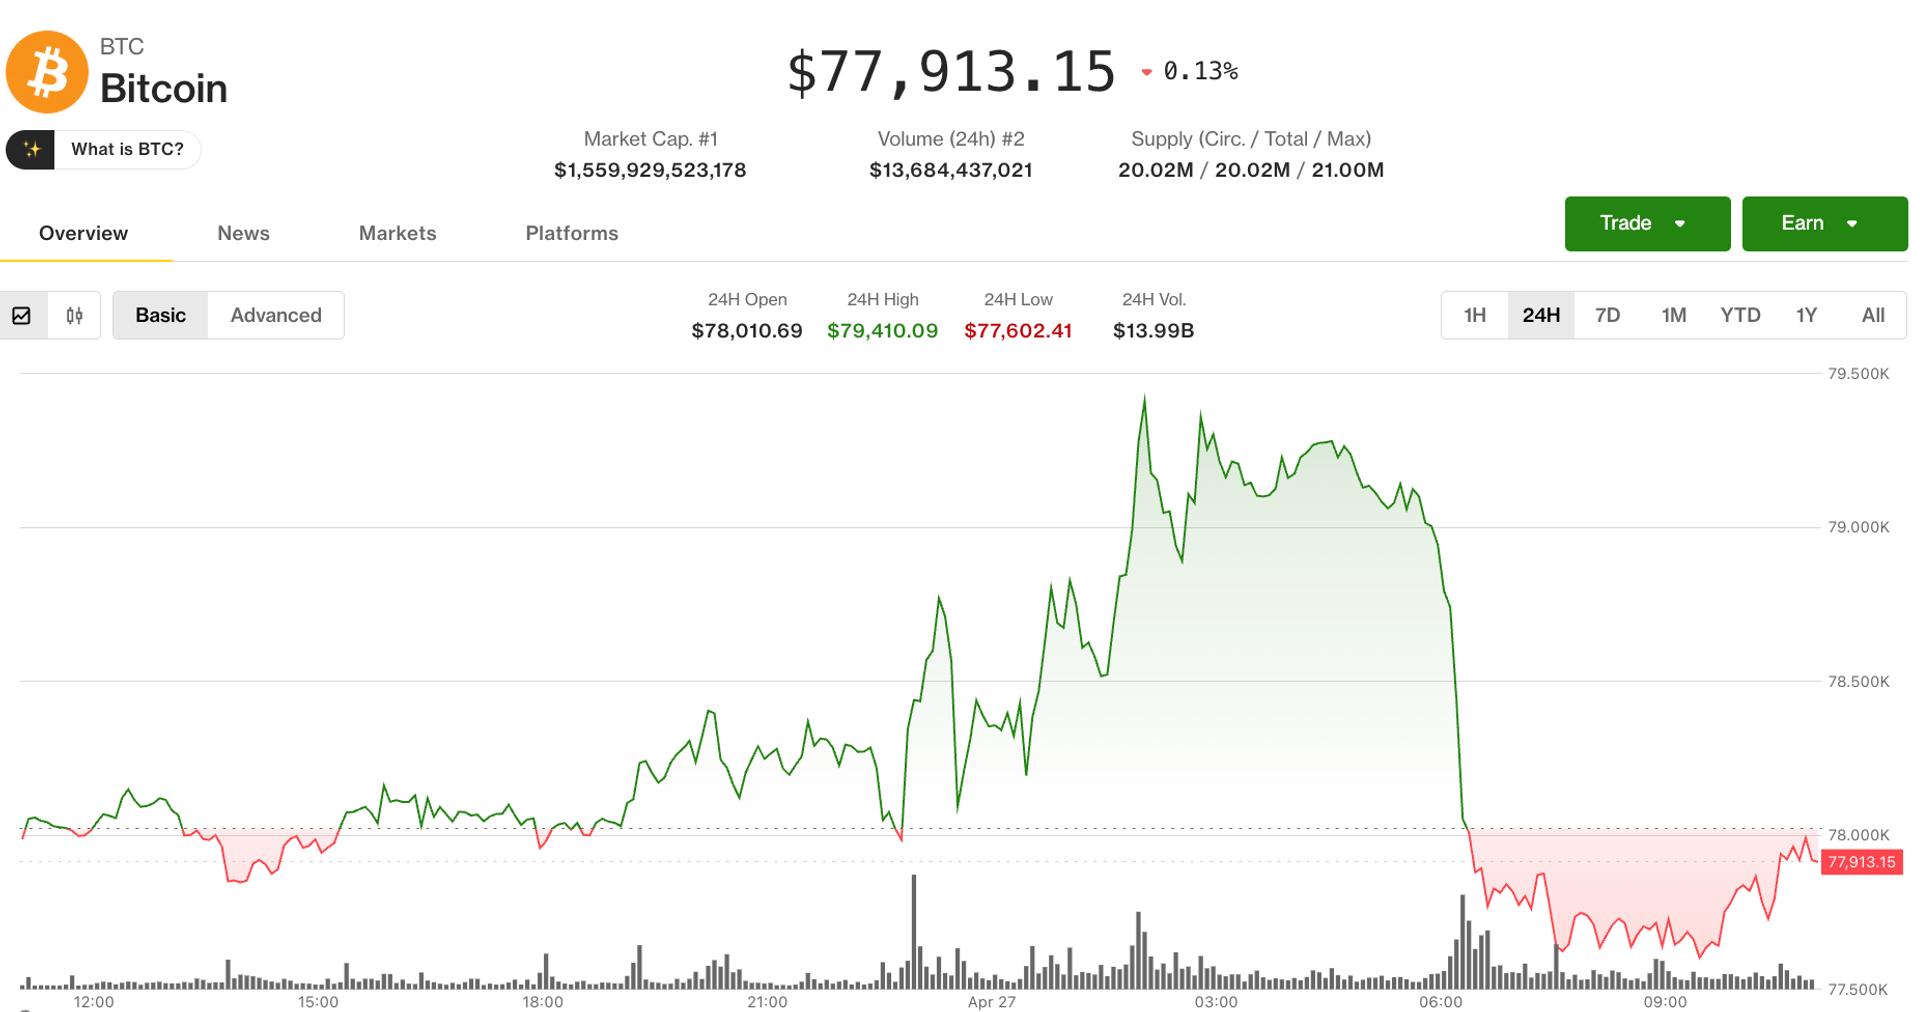
Volatility returned to crypto markets Monday as bitcoin spiked up to $79,480 before quickly reversing to $77,800.
The move began around 23:00 UTC with the opening of U.S. equity and CME bitcoin futures, a period that often sees heightened volatility.
By 05:30 UTC, the price began falling after it failed to break above the $80,000 level, dropping 2% in an hour.
The decline occurred as oil reached its highest level since the ceasefire between the U.S. and Iran began. Brent crude trades at $107 per barrel after U.S. President Donald Trump canceled plans to send U.S. officials for talks in Pakistan on Saturday.
Ether (ETH) recently traded around $2,320 after losing 2.2% since midnight UTC, underperforming bitcoin, which is down by 1.1%, but not falling as precipitously as several altcoins.
Derivatives positioning
- Nearly $300 million in crypto futures bets have been liquidated in the past 24hours. Most of these have been bearish short plays, which likely faced the brunt of the cryptocurrency’s brief rally to nearly $79,500.
- Open interest (OI) in XRP futures rose by nearly 2.5% in 24 hours. That’s the biggest increase among major tokens, including bitcoin, ether and solana (SOL). The OI touched a one-week high of 1.82 billion XRP alongside negative perpetual futures funding rates and OI-adjusted cumulative volume delta. This combination paints a bearish picture, consistent with the bitcoin and ether markets.
- Analysts, however, said that persistent negative funding rates in BTC are mainly due to institutions hedging their bullish exposure in related markets and do not represent an outright bearish bet on the market.
- HBAR, CC, XLM and HYPE are other standout OI gainers of the past 24 hours.
- SUI records the most negative CVD, suggesting sustained aggressive selling through market orders. A Sui-based DeFi protocol named Scallop was hacked early today, and the perpetrators walked away with approximately 150,000 SUI tokens valued just over $140,000.
- Bitcoin and ether’s 30-day implied volatility indexes extended declines, painting a picture of market calm that supports continued price rallies in the two assets. This is consistent with the recent drop in Wall Street’s VIX index, a gauge for the S&P 500 index, and record highs in other key measures, including the Nasdaq.
- On Deribit, bitcoin and ether options continue to show a bias for puts across all time frames. Ether options expiring in December and next March are notably less bearish than their bitcoin counterparts.
- Bitcoin’s $80,000 strike call option is the most popular on Deribit, boasting a notional open interest of over $1.5 billion. The dealer gamma here is positive, which implies that dealers (market makers) could sell on a potential breakout above this level and similarly buy the dip, arresting the price volatility.
- Speaking of flows, Laser Digital said investors are favoring risk reversals over outright puts. This means traders prefer options strategies that profit from price swings and differences in how options are priced at different strike levels.
Token talk
- While the broader market was volatile on Monday, the altcoin sector was hit hardest during the 05:30 UTC selloff.
- Liquid restaking token Lido (LDO) led losses, giving back all of Sunday’s gains to fall around 17%.
- The bitcoin-heavy CoinDesk 20 (CD20) Index is down 1.5% since midnight UTC, while the DeFi Select Index (DFX) has lost 2.3%, with only the Smart Contract Platform Select Index (SCPX) performing worse, down 2.5%.
- A handful of tokens managed to avoid the selloff, notably PENGU, JUP and CHZ, which rose 9.1%, 4% and 3.1%, respectively.
- CoinMarketCap’s “Altcoin Season” indicator sits at a neutral 39/100, unchanged from last week and well below last month’s high of 51/100.


The European Union (EU) released its “biggest package” of sanctions in two years against Russia, describing the measures as far-reaching and restrictive. They specifically target crypto with a total ban on providers and platforms established in that country.
“Russia is becoming increasingly reliant on cryptocurrencies for international transactions,” the EU said in an April 23 statement. “The EU is introducing a total sectoral ban on providers and platforms established in Russia that allow the transfer and exchange of crypto assets.”
The bloc also banned Russia’s central bank digital currency (CBDC), the ruble-pegged RUBx stablecoin and all EU support for the development of the digital ruble.
The sanctions include measures against 20 Russian banks and four third-country financial institutions and entities connecting to the Russian System for Transfer of Financial Messages (SPFS), the Russian banking messaging network, according to a Chainalysis report.
The blockchain intelligence firm said the EU also imposed sanctions on TengriCoin, a Kyrgyz crypto exchange operating as Meer.kg, where significant amounts of the government-backed stablecoin A7A5 are traded.
That measure follows years of escalating enforcement targeting the wider Garantex–Grinex–A7A5 ecosystem that has been extensively tracked, Chainalysis noted.
As documented, A7A5 has been prolific, processing $119.7 billion to date and functioning as a purpose-built settlement rail designed to bridge sanctioned Russian businesses into the global financial system, the firm said. In the 2026 Crypto Crime Report, that figure exceeded $93.3 billion in less than a year.
“The new measures now create an ecosystem-wide crypto restriction on Russia and Belarus,” the blockchain intelligence firm said.
The firm said that people from the EU are now no longer allowed to transact with cryptocurrency service providers (CASPs) and decentralized finance (DeFi) platforms from Russia and Belarus. They are also barred from providing Markets in Crypto-Assets Regulation (MiCA) crypto services to Belarusian individuals and entities.
The EU also stated that “netting transactions with Russian agents are now forbidden, to prevent the circumvention of EU sanctions.”
Countries referenced in the sanctions package in connection with financial services, trade flows, or intermediary activity include Kyrgyzstan, China, the United Arab Emirates, Uzbekistan, Kazakhstan and Belarus.


Digital asset investment products recorded $1.2 billion in inflows last week, marking the fourth straight week of positive flows.
Summary
- Digital asset funds saw $1.2 billion in weekly inflows, marking a fourth straight positive week.
- Bitcoin led with $933 million in inflows as spot ETFs posted their strongest week in months.
- Ethereum attracted $192 million, while blockchain equity ETFs recorded strong demand over three weeks.
The latest CoinShares report said eight assets attracted inflows, up from six in the prior week.
The move came as Bitcoin traded above $76,000 for the first time since the February correction. Total assets under management rose to $155 billion, the highest level since February 1.
Bitcoin ETFs drive institutional demand
Bitcoin (BTC) led the market with $933 million in weekly inflows. The figure brought year-to-date Bitcoin fund inflows to $4 billion, showing renewed demand from institutional investors.
Spot Bitcoin ETFs also posted their strongest weekly inflows in several months. Nearly $1 billion entered the products over the past week, with April 17 recording more than $663 million in net inflows.
Moreover, Ethereum investment products added $192 million in inflows. This marked the third consecutive week in which Ethereum inflows stayed above $190 million.
XRP also returned to inflows after one week of outflows. The move showed broader investor participation as more assets joined Bitcoin and Ethereum in attracting capital.
Blockchain equities hit record demand
Blockchain equity ETFs recorded $617 million in inflows over three weeks. CoinShares said the segment reached record weekly inflows as investors sought wider exposure to blockchain technology and related companies.
The United States led regional inflows with $1.1 billion. Germany followed with $61.7 million, while Switzerland recorded $35.2 million after reversing the prior week’s outflows.
Canada also saw $15 million in inflows, pointing to a wider regional bid than recent weeks. The report noted that investors are watching the April 28–29 FOMC decision, which may keep some caution in the market.
The latest flows show that institutional demand for crypto funds has improved as Bitcoin recovers from earlier weakness. However, total assets under management remain below the October 2025 peak of $263 billion.
Short Bitcoin products drew $16.5 million in inflows. CoinShares said this was broadly in line with the prior month’s average, suggesting steady but not extreme hedging demand.
The market now faces a key macro week. The Fed decision, inflation expectations, and geopolitical risks may shape whether inflows continue or slow after four weeks of gains.


The artificial intelligence (AI) boom is often framed as a story of capital, code, and compute. Alphabet, Amazon, Meta, and Microsoft forecast capital expenditures of about $650 billion in 2026. At the same time, AI-linked stocks are trading near all-time highs.
Beneath the software layer, however, sits a physical supply chain that depends on transformers, switchgear, batteries, grid capacity, and a less-discussed input: Helium.
AI’s $650 Billion Buildout Has a Helium Problem
For context, Helium is a critical input for semiconductor manufacturing, supporting cooling, leak detection, and high-precision processes. Yet the supply is quite concentrated.
According to the US Geological Survey, Mineral Commodity Summaries 2026, global production in 2025 reached approximately 190 million cubic meters. The United States, Qatar, and Russia together account for roughly 84% of global helium output.
Qatar’s output reached 63 million cubic meters that year, accounting for roughly a third of the global helium supply. Almost all of it comes out of Ras Laffan Industrial City, the world’s largest LNG complex.
That balance broke on March 18, when Iran struck Ras Laffan during the broader US-Iran war. QatarEnergy declared force majeure on some of its long-term liquefied natural gas (LNG) contracts. In a press release, it also warned repairs could take up to 5 years.
“QatarEnergy expects the damage to its Ras Laffan Industrial City caused by missile strikes, which occurred on Wednesday 18 March 2026, and in the early hours of Thursday 19 March 2026, to cost about $20 billion a year in lost revenue and to take up to five years to repair, impacting supply to markets in Europe and Asia,” the state-owned petroleum company wrote.
Follow us on X to get the latest news as it happens
Russia closed the second door in April. It imposed export controls on Helium through the end of 2027. Officials cited domestic supply needs, particularly for fibre-optic components used in military drones.
Electrical equipment bottlenecks are compounding the problem. Roughly half of the US data centers slated to come online this year are now facing delays or outright cancellations, with transformers, switchgear, and batteries in short supply.
The same components are needed to expand the grid itself, which is also absorbing rising demand from electric vehicles and heat pumps. Domestic manufacturing capacity has not kept pace, leaving data center developers increasingly dependent on imports.
Thus, the AI boom is running into a physical chokepoint that capital alone cannot fix. Wall Street has priced in the execution, yet the inputs behind that execution are tightening one by one.
Subscribe to our YouTube channel to watch leaders and journalists provide expert insights
The post How the Iran War Exposed the Physical Backbone of the AI Boom appeared first on BeInCrypto.

TLDR
- Citigroup increased its near-term Brent crude forecast to $120 per barrel from a previous $95 estimate
- Goldman Sachs elevated its fourth-quarter Brent projection to $90 per barrel, representing a nearly $30 increase from pre-crisis levels
- Persian Gulf crude shipments through the Strait of Hormuz have dropped to virtually zero
- Cumulative supply losses have reached approximately 500 million barrels since hostilities commenced
- Brent crude prices have surged nearly 50% since conflict erupted in late February
Major financial institutions Citigroup and Goldman Sachs have significantly elevated their crude oil price projections as the blockade of the Strait of Hormuz persists with no immediate resolution in sight. On Monday, Brent crude was hovering around $108.50 per barrel, climbing roughly 3% during the session and marking its sixth consecutive day of gains.
Citigroup’s revised outlook places Brent at $120 per barrel within the next zero to three-month timeframe. The financial institution has also adjusted its quarterly average projections to $110, $95, and $80 for Q2, Q3, and Q4 of 2026 respectively. These updated numbers represent substantial increases from the bank’s previous quarterly estimates of $95, $80, and $75.
The bank assigns a 50% probability to its primary forecast scenario. This baseline assumption anticipates the Strait will begin reopening by the conclusion of May, representing a one-month delay compared to Citi’s earlier expectations.
Citi’s research team noted that Tehran’s regime possesses both economic and geopolitical motivations to maintain the effective closure of the Strait for the foreseeable future. The analysts contend this strategy would constrict worldwide oil availability, accelerate the depletion of stored reserves, and elevate market prices.
According to Citi’s calculations, approximately 500 million barrels in aggregate supply have vanished from markets since the conflict’s onset. Should the waterway remain blocked throughout May, the institution forecasts aggregate losses could climb to 1.3 billion barrels.
Goldman Sachs Raises Forecasts
Goldman Sachs similarly revised its oil price predictions upward on April 27. The investment bank currently anticipates Brent will average $90 per barrel during the fourth quarter of 2026, representing an increase from its earlier $80 forecast. Goldman indicates this projection now stands nearly $30 above pre-crisis levels, before what market watchers have termed the “Hormuz shock.”
Goldman’s analysis suggests that 14.5 million barrels daily of Persian Gulf crude output disruptions are causing worldwide stockpiles to decline at an unprecedented rate of 11 to 12 million barrels per day throughout April. The firm anticipates a supply shortfall of 9.6 million barrels daily for the current quarter. Goldman’s updated forecasts position Brent at $100 for the present quarter and $93 during Q3.
Morgan Stanley Holds Steady
Morgan Stanley has maintained its existing price forecasts without modification. The institution anticipates Brent will average $110 during the current quarter, $100 throughout Q3, and $90 in Q4. Morgan Stanley’s calculations indicate Gulf region oil shipments have plummeted by 14.2 million barrels daily as a consequence of the closure.
The financial institution noted that worldwide petroleum reserves have declined by an estimated 4.8 million barrels per day, with diminished consumption partially explaining the discrepancy.
Citi’s optimistic scenario, assigned a 30% probability, envisions Brent reaching $150 per barrel should disruptions persist through June’s conclusion. An extreme scenario involving damage to critical infrastructure could propel prices to a sustained range of $160–$180 per barrel.
Under Citi’s primary forecast scenario, global crude inventories are projected to fall to their lowest levels in more than ten years by the end of July.

ASML plans to build at least 60 EUV machines this year as AI chip demand surges

Biggest Money Mistake | ThiruKochi Financial Services | Milestone Makers | #shorts

2028 Open: Royal Lytham & St Annes to host tournament ahead of Turnberry and Muirfield
Manchester United reach agreement with Casemiro over contract clause amid transfer speculation

US brings back mandatory military draft registration

Steven Gerrard disagrees with Gary Neville over ‘shock’ Chelsea and Arsenal claim | Football


-

 Politics7 days ago
Gary Stevenson delivers timely reminder to register to vote as deadline TODAY
-

 Fashion3 days ago
Weekend Open Thread – Corporette.com
-
 Crypto World2 days ago
Hyperliquid $HYPE Rally Builds Momentum as AI Sector Enters Prove-It Phase
-
Crypto World7 days ago
Bank of Hawai’i (BOH) Q1 2026: Net Income Drops to $57.4M as Net Interest Margin Expands
-

 Politics5 days ago
Making troops accountable for war crimes threatens US alliance, ex-SAS colonel warns
-

 Politics5 days ago
Disabled people challenge government SEND proposals over segregation concerns
-

 Business5 days ago
Rolls-Royce Voted UK’s Most Iconic Trade Mark as IPO Register Hits 150
-

 Business3 days ago
Patterson-UTI Energy, Inc. (PTEN) Q1 2026 Earnings Call Transcript
-

 Politics5 days ago
Zack Polanski responds to home secretary’s taser threat
-
 Crypto World6 days ago
Five Value Stocks with Recovery Potential in 2026: PayPal (PYPL), Nike (NKE), and More
-

 Politics5 days ago
Starmer handler McSweeney to be dragged from shadows by Foreign Affairs Committee
-
 Sports23 hours ago
IPL 2026: Ruturaj Gaikwad registers slowest fifty of the season, enters all-time unwanted list | Cricket News
-
Politics5 days ago
Wings Over Scotland | How To Get Away With Crimes
-

 Crypto World6 days ago
New York sues Coinbase, Gemini over prediction market offerings
-

 Politics5 days ago
‘Iran is still a nuclear threat’
-
Entertainment6 days ago
Sydney Sweeney cameo cut from “The Devil Wears Prada 2”, source explains why (exclusive)
-

 Crypto World6 days ago
Crypto’s great hope in Senate’s Clarity Act still has a path to survive tight calendar
-
 Business5 days ago
HCL Tech share price tank over 9% after weak Q4. JPMorgan, HSBC & 3 others cut target price
-
 Sports4 days ago
Tim Bradley names the current best in the world: “Better than Inoue and Usyk”
-

 NewsBeat1 day ago
LK Bennett closes all stores after entering administration
You must be logged in to post a comment Login