

Crypto World
Solana (SOL) vs XRP: A Deep Dive Into Long-Term Investment Potential
Quick Overview
- XRP serves primarily as a payments and cross-border transaction solution, creating a specialized but limited application
- Solana functions as a versatile blockchain platform supporting DeFi, NFTs, gaming, stablecoins, and Web3 applications, providing diverse expansion opportunities
- Ripple’s substantial XRP reserves continue raising questions among investors monitoring long-term token distribution
- Solana demonstrates superior developer engagement, typically indicating healthier long-term ecosystem vitality
- Both assets involve risk factors, though Solana’s diversified ecosystem provides additional avenues for sustainable growth
When evaluating long-term cryptocurrency investments, XRP and Solana consistently emerge as two of the most discussed assets. Each boasts substantial communities, practical applications, and significant growth potential. However, their fundamental architectures serve distinctly different objectives, making this distinction critical for investors planning three to five-year positions.

Ripple developed XRP specifically for facilitating rapid, cost-effective international money transfers. Conversely, Solana emerged as a comprehensive blockchain infrastructure supporting applications, decentralized finance, trading platforms, and digital asset creation. This fundamental distinction influences every aspect of their respective long-term performance trajectories.
XRP’s primary advantage lies in its focused mission. Ripple has dedicated years cultivating partnerships with banking institutions and payment service providers. This strategic positioning gives XRP legitimate utility within the cross-border finance sector.
Should blockchain-based settlement systems gain widespread adoption among financial institutions, XRP stands positioned to capture significant value. This represents a credible scenario driving many investors’ continued confidence in the asset.
The limitation, however, centers on XRP’s dependence on this singular growth corridor. Should institutional adoption proceed slower than anticipated, investor returns may fall short of expectations.
Solana’s Multi-Faceted Ecosystem Strategy
Unlike XRP’s specialized focus, Solana isn’t confined to a single application. The platform accommodates decentralized financial protocols, stablecoin infrastructure, NFT marketplaces, blockchain gaming, consumer-facing applications, and tokenized traditional assets.
This diversification creates multiple parallel growth trajectories. When activity decreases in one vertical, momentum in alternative sectors can sustain network demand and token value.
Developer engagement represents another domain where Solana demonstrates competitive superiority. Blockchains maintaining robust builder communities typically sustain relevance longer, as developers generate the applications attracting end users.
Elevated developer activity frequently serves as a predictive indicator of sustained platform viability. Measured against this criterion, Solana currently maintains a noticeable advantage over XRP.
Supply Economics and Investment Considerations
XRP employs a transparent supply mechanism. The token doesn’t utilize mining-based inflation, and minuscule amounts of XRP are destroyed with every transaction.
Nevertheless, Ripple’s substantial XRP treasury represents a persistent consideration for certain investors. This lingering supply overhang can constrain confidence regarding long-term price appreciation potential.
Solana incorporates inflationary mechanics into its economic design. However, this inflation receives partial counterbalancing through staking incentives and expanding on-chain economic activity.
As network utilization accelerates, organic demand for Solana can increase through transaction fees and ecosystem expansion. This dynamic provides more fundamental support for the token’s valuation over extended timeframes.
XRP’s primary uncertainties revolve around corporate adoption rates and regulatory framework development. Solana’s challenges relate more to technical execution and network stability, areas that have historically presented concerns.
Solana has recently maintained ecosystem momentum through additional stablecoin partnerships and consumer-oriented product launches, sustaining developer interest as 2025 approaches.
Investment Perspective
For investors prioritizing long-term positioning, Solana presents the more compelling platform investment thesis. While XRP maintains legitimate value within payments and settlement infrastructure, Solana’s expansive ecosystem architecture provides substantially more pathways for sustainable growth.


Crypto World
Senator Lummis Warned That Stalling the CLARITY Act Now Means No Crypto Regulation Until 2030

Senator Cynthia Lummis has issued a direct warning: stall the CLARITY Act now, and the U.S. effectively forfeits comprehensive crypto regulation until 2030.
The logic is mechanical: if the bill fails to clear the Senate in the current legislative session, the 2026 election calendar compresses available floor time to near zero, and the next realistic window for a full market-structure framework doesn’t open until the following Congress at the earliest.
For institutional capital, that timeline is not a political abstraction. It is an operational constraint that compliance teams at major asset managers and trading desks are already pricing into deployment decisions, and increasingly resolving in favor of jurisdictions that already have answers.
The U.S. has governed digital assets primarily through regulatory enforcement, using SEC litigation, CFTC actions, and agency guidance rather than statutes to define what is and is not permissible in crypto markets.
The SEC’s enforcement docket has functioned as de facto rulemaking since at least 2017, from the DAO Report through ICO crackdowns to the Ripple and Coinbase litigation.
Enforcement-based precedent creates asymmetric uncertainty: firms know what has been penalized after the fact, but cannot get prospective clarity on what is permitted.
That asymmetry is tolerable for crypto-native firms operating at the margin; it is categorically unacceptable for compliance departments at BlackRock, Fidelity, or JPMorgan.
A four-to-five year extension of that regime, the operational meaning of a 2030 deadline, does not merely delay U.S. institutional adoption.
It hard-codes rival jurisdictions as the default venue for compliant tokenization, stablecoin issuance, and institutional DeFi infrastructure during the period when those markets are being built.

Discover: The Best Crypto to Diversify Your Portfolio
Institutional Capital Needs Legal Certainty Before It Moves
The transmission mechanism from regulatory freeze to capital migration is straightforward. Without a statutory framework resolving the SEC/CFTC jurisdictional split, compliance teams at institutional desks cannot approve crypto trading operations under existing bank-grade internal policy.
Without approved trading desks, custody arrangements cannot be structured to meet fiduciary standards. Without compliant custody, institutional liquidity، the kind that moves markets and anchors spread compression, does not flow into U.S. spot venues.
That liquidity goes somewhere. The EU’s MiCA (Markets in Crypto-Assets) regulation was adopted in 2023 and entered full force in 2024, with application to crypto-asset service providers and stablecoin issuers completed by 2025.
MiCA provides a passporting framework across all 27 EU member states، a single licensing path that gives institutional desks the prospective certainty that U.S. statute currently cannot.
Singapore’s MAS regime, operating under the 2019 Payment Services Act, has already attracted tokenization pilots with JPMorgan, DBS, and Temasek through Project Guardian, pulling institutional liquidity into Asia.
Dubai’s VARA regime has drawn Binance, OKX, and Bybit as those exchanges scaled back or restructured U.S. operations under enforcement pressure.
Polymarket and similar prediction platforms have assigned mid-50s to high-50s percentage odds that a federal market-structure bill like the CLARITY Act becomes law by end of 2026، a coin-flip probability that macro funds are actively hedging via CME bitcoin and ether futures and offshore perpetuals, shifting liquidity from U.S. spot venues to derivatives venues in Europe and Asia.
The CLARITY Act’s impact on liquidity markets is already being priced before the bill has passed.
What Stalling the CLARITY Act Actually Means Structurally
The CLARITY Act’s core architecture addresses the precise ambiguity that has made U.S. crypto compliance untenable for institutional actors.
The bill establishes a jurisdictional split between the SEC and CFTC based on whether a digital asset functions as a security or a commodity, creates a decentralization certification pathway that allows assets to graduate from securities treatment as their networks mature, and includes consumer protection provisions governing asset segregation in the event of exchange insolvency.
The bill cleared committee with a 15-9 vote، close enough to signal real opposition, but sufficient to advance.
Lummis’s warning is that the committee’s result is irrelevant if floor time disappears. Without those statutory provisions, the operative question of whether a given token is a security remains resolved only through litigation outcome، meaning each institutional actor must either absorb legal risk or abstain. Most abstain.
Jamie Dimon has argued publicly for bank-like capital and AML standards for stablecoin issuers, warning that lighter treatment creates regulatory arbitrage with the banking system.
That concern is legitimate regardless of one’s view on the CLARITY Act، but it underscores that even TradFi actors who want tighter rules need a statutory vehicle to work from.
The Financial Stability Board finalized global crypto policy recommendations in 2023; the EU and Asian regulators are implementing them. U.S. Congress has not yet provided the equivalent foundation.
Discover: The Best Token Presales
The post Senator Lummis Warned That Stalling the CLARITY Act Now Means No Crypto Regulation Until 2030 appeared first on Cryptonews.

Disclosure: This article does not represent investment advice. The content and materials featured on this page are for educational purposes only.
OCTOPUS (UK) gains attention with a smart contract-based crypto reward unlocking mechanism for blockchain users.
Summary
- OCTOPUS (UK) uses smart contracts to automate crypto reward distribution through a transparent, fully on-chain system.
- The platform supports governance, liquidity mining, NFTs, and multi-stage task rewards designed to increase user engagement.
- Features such as time-lock mechanisms, real-time reward tracking, and automated verification aim to improve transparency and trust.
With the rapid development of blockchain technology, the cryptocurrency and decentralized finance (DeFi) sectors continue to innovate. As a core technology within these fields, smart contracts have brought users unprecedented convenience and security.
Recently, the UK-based innovative blockchain project OCTOPUS (UK) has officially set a new industry trend with its unique “smart contract-based crypto reward unlocking” mechanism, becoming the focus of market attention.

I. Smart contracts activate a new ecosystem, making reward mechanisms more transparent
OCTOPUS(UK) utilizes smart contract technology to standardize and automate the distribution of cryptocurrency rewards, achieving a fully on-chain, transparent, and tamper-proof operational process.
When participating in platform activities, users can automatically unlock corresponding rewards via smart contracts by completing specific tasks or holding designated tokens. This not only simplifies the traditionally cumbersome claim process but also eliminates risks associated with manual operations.
According to OCTOPUS (UK)’s official statement, the system employs multi-factor verification and time-lock mechanisms to ensure fair and reasonable reward distribution. Additionally, real-time on-chain data transparency allows users to monitor the status and history of their rewards at any time.
This innovative model effectively enhances user experience and builds trust in the platform.
II. Multi-scenario applications to boost user engagement
Beyond basic token reward unlocking, OCTOPUS’ smart contract system supports a wide range of application scenarios.
For example, users can participate in platform governance voting, liquidity mining, and NFT collecting. All related rewards are calculated and released in real time via smart contracts, significantly improving operational efficiency and convenience.
Particularly noteworthy is OCTOPUS’ “Task Chain Rewards” feature, which allows users to progressively unlock higher-value crypto assets by completing a series of interconnected, multi-stage tasks.
This initiative not only incentivizes long-term user participation in building the platform’s ecosystem but also fosters the community’s healthy development.
III. Security and compliance: ensuring steady asset growth
In the crypto space, the security of user assets remains a critical concern. OCTOPUS adheres to strict security standards, with smart contract code undergoing multiple rounds of professional third-party audits to ensure it is free of vulnerabilities and potential risks.
At the same time, the platform actively complies with UK and international regulatory requirements, promoting compliant operations and striving to create a secure and trustworthy crypto asset management environment for users worldwide.
IV. High praise from industry experts and outlook on future potential
Anna Smith, a senior analyst in the blockchain industry, stated: “OCTOPUS’ innovation in the smart contract reward unlocking mechanism has not only boosted user engagement but also significantly advanced the adoption of crypto assets.
With more ecosystem partnerships and feature upgrades, I believe this project will continue to lead the way in the industry.”
Looking ahead, OCTOPUS plans to further deepen collaborations with mainstream DeFi platforms and NFT projects, expand the scope of reward unlocking scenarios, and continuously optimize smart contract performance, with a commitment to building an open, interconnected, and secure decentralized ecosystem.

About OCTOPUS (UK)
OCTOPUS is an innovative company focused on blockchain technology research and applications, dedicated to creating secure, transparent, and efficient digital asset management solutions through smart contract technology.
Headquartered in London, UK, the company boasts a team of seasoned blockchain developers and financial experts committed to promoting the healthy development of the blockchain industry.
Cloud mining: A new, simplified path to digital assets
Traditional mining has deterred many potential investors due to its high equipment costs, technical barriers, and expensive operational expenses.
Cloud mining has completely transformed this landscape: users no longer need to purchase bulky mining rigs or bear the burden of high electricity bills and maintenance costs. Instead, they can participate in mining mainstream cryptocurrencies simply by renting cloud computing power online.
Octopus Mining aggregates top-tier computing power from premium mining farms across the globe, delivering stable and efficient mining resources to users.
Unique advantages: The new favorite among global investors
- Extremely low barrier to entry: Whether someone is a cryptocurrency novice or a seasoned investor, they can register quickly and get started easily — no technical background required.
- Customizable hashrate options for flexible risk-reward management: Multi-tiered packages cater to varying investment scales and return expectations, allowing users to adjust their strategies in real time.
- Globally Distributed Mining Facilities: Mitigate risk and secure returns. Mining centers across multiple countries form a distributed computing power network, effectively avoiding single points of failure and ensuring continuous, stable mining operations.
- High Efficiency and Transparent Returns: The platform eliminates intermediaries, with 90% of mining profits directly returned to users. Combined with real-time daily earnings monitoring, the process is clear and transparent.
User testimonial:
Emma, a London-based investor who joined Octopus Mining in 2026, shared: “I didn’t know much about mining before, but the platform’s simple interface and 24/7 customer support ensured I received timely assistance whenever I encountered issues.
My returns have grown steadily to date, giving me greater confidence in cryptocurrency investments.” This exemplifies the tangible value and peace of mind Octopus Mining delivers to its users.
Security guarantees and compliant operations for peace of mind
Octopus Mining strictly adheres to UK and relevant regulatory requirements, committed to creating a legal, transparent, and sustainable cloud mining environment.
The platform employs a multi-layered information security architecture and utilizes the latest encryption technology to safeguard user privacy and fund security. Distributed storage and multi-factor authentication provide dual protection, while a 24/7 monitoring system promptly addresses potential threats, building a robust defense for investors.

Conclusion
As a leading innovator in the UK blockchain sector, OCTOPUS is gaining recognition from an increasing number of users and industry professionals through its revolutionary model of unlocking crypto rewards via smart contracts.
Its cutting-edge technological capabilities and comprehensive ecosystem will inject new momentum into the global crypto market, propelling the digital asset economy to new heights.
At this critical stage of the cryptocurrency market’s recovery, Octopus Mining has pioneered a safe and convenient new path in cloud mining for global investors through its professional technical expertise and user-centric service philosophy.
Whether someone is a conservative, risk-averse investor or an active cryptocurrency enthusiast, Octopus Mining offers tailored solutions to help them grow their assets while minimizing risk and enhancing their experience.
Visit the official website.
Sign up in one click with an email or phone number (takes less than a minute),
and receive a $17 bonus to start a free contract plan!
Easily begin the smart cloud mining journey, and join Octopus Mining in welcoming the new era of digital currency!
Disclosure: This content is provided by a third party. Neither crypto.news nor the author of this article endorses any product mentioned on this page. Users should conduct their own research before taking any action related to the company.

Matthias Balk | Picture Alliance | Getty Images
Five years ago, venture capitalists were pouring money into American startups selling everything from lingerie subscriptions to scheduling software, anointing them with billion-dollar valuations before most even turned a profit.
It was a frothy era for startups, fueled by a combination of cheap money and pandemic-boosted demand. But even after the Federal Reserve took some froth off by starting to raise interest rates in 2022, many founders believed that they could grow into their inflated valuations, investors told CNBC.
Then, an app called ChatGPT arrived.
“The ChatGPT moment was when people said, ‘Holy smokes, the next generation of entrepreneurs, their coding language is spoken English,’” said Samir Kaul, a partner at the venture firm Khosla Ventures, an early backer of OpenAI.
“Now you’re seeing 50 engineers do what it would’ve taken 500 engineers to do five years ago,” Kaul said. “We had to completely reshuffle how we valued these companies.”
While the shares of public software companies like Salesforce, ServiceNow and Workday got hammered this year because of the threat from artificial intelligence, a quieter reckoning has been unfolding in the private markets.
The AI boom that funneled more than $250 billion into OpenAI and Anthropic ahead of their expected mega-IPOs this year has left hundreds of startups built before ChatGPT’s arrival in 2022 stranded — effectively cut off from venture funding because of their inflated valuations and outdated technology, yet not profitable enough for the public markets.
There are 857 U.S. startups valued at $1 billion or more, the threshold for being deemed a “unicorn” company, according to PitchBook data. But nearly half of that group hasn’t raised fresh funding in the last three years, making those valuations stale, according to the private markets data firm.
Startups that last raised in 2021 are now worth 68% less on average, while those that last raised in 2022 saw a 52% decline, according to Pitchbook’s own valuation estimates.
As a result, more than 220 companies that had reached billion-dollar valuations in the venture boom are now fallen unicorns, according to PitchBook, which provided a list of the companies exclusively to CNBC. The estimates are based on factors including headcount growth and comparisons to public companies.
“A lot of those companies are pre-AI, not just in their cost structure, but also in their products,” Mercury CEO Immad Akhund told CNBC. His company, which raised $200 million in funding last month, provides banking services to a third of early-stage U.S. venture-backed firms.
“They’re definitely in a difficult spot,” he said. “All the attention’s on AI, so if you’re not an AI-first company, you need really strong numbers to raise.”
Glossier, Brooklinen, AG1
The list of fallen unicorns includes well known brands like Glossier, The Farmer’s Dog, Rothy’s, Brooklinen and Savage X Fenty, the lingerie company founded by musician Rihanna. The companies were part of a wave of direct-to-consumer firms built on the hope that digital retailers could earn software-like margins.
Also included are mainstays of podcast advertisements including the powder supplement maker AG1 and the roboadvisor pioneer Betterment, as well as the online ticket marketplace SeatGeek.
These companies came of age in an environment that rewarded growth at nose-bleed valuations based on two broad assumptions: interest rates would remain low and a startup could always be acquired for its engineering talent.
But the arrival of generative AI has redrawn the venture landscape, redirecting capital toward AI-native firms while making it impossible for many older startups to justify their previous valuations.
Hit hardest are enterprise software companies like scheduling startup Calendly, which represent the single largest category among the fallen unicorns. There are 75 software-as-a-service, or SaaS, firms appearing on PitchBook’s list, which is double the number of fintech companies, the next-biggest group.
That reflects both the enormous valuations that software startups commanded during the 2021 venture boom and the degree to which generative AI has destabilized assumptions underpinning the sector.
David Zhu, an ex-DoorDash head of engineering, said that after the “ChatGPT moment” he looked across the software landscape — from startups to medium-sized firms funded with private credit to the largest public SaaS companies — and saw a seismic shift on the horizon.
“The thesis I had was that all workflow-driven enterprise SaaS companies will be either disrupted or dead in the next decade,” Zhu told CNBC.
The Saas model, where companies embed themselves in employee workflows and often charge by the user, is especially threatened by the rise of autonomous agents. After leaving DoorDash, where he led more than 200 engineers, Zhu founded Reevo, an AI platform that automates corporate sales and marketing teams.
Companies built before generative AI are weighed down by bloated staffing models and software designed for a pre-AI world, according to Zhu, making it hard for them to transform themselves.
“Unless they make a stark, 180-degree pivot to rebuild the exact same thing from scratch, they’re going to slowly fail,” Zhu said. “What that means is that investors would rather just bet on new entrepreneurs at lower valuations rather than double down on older startups.”
‘Dominoes to fall’
Most of the 20 fallen unicorns highlighted by CNBC either didn’t respond to multiple requests for comment or declined to comment.
A spokesperson for the drone maker Skydio — estimated by PitchBook to have dropped in value from $2.5 billion to $509 million — said in a statement: “This third-party speculation is false and not based on Skydio’s operations or the exponential growth we are seeing in revenue and customers.”
An AG1 spokesperson didn’t provide a statement for this article, but after CNBC’s inquiry, Reuters reported that the supplement maker was looking to sell part or all of the company at a $2 billion valuation. That figure would include AG1’s debt, the report said.
If a company hasn’t raised funding since 2021 or 2022, its unlikely they’ll ever do so again, say investors and founders. Without access to venture funding or a plausible IPO ramp, the most likely exit for many fallen unicorns is an acquisition at a fraction of their old valuation, they say.
“When we see companies not raising, it’s a red flag,” said PitchBook analyst Andrew Akers, adding that it usually means their growth is tepid or even negative.
While some startups might’ve avoided fundraising because they are generating robust profits, that is the exception to the rule, he said.
“Underneath the surface, I think there are a lot of dominoes to fall,” Akers said.
Collapsing floor
There have been glimmers of a reset among some startups this year.
In February, Stash, the investment and savings app, was acquired by Singapore-based everything app Grab at an enterprise value of $425 million, below the roughly $660 million that investors put into the company during its lifetime.
That same month, another fintech, Step, was acquired by the YouTube star MrBeast for an undisclosed amount, leading investors to speculate that the purchase price was far below the roughly $500 million the startup raised before the deal.
“Many of these businesses just aren’t worth that much anymore, which is why you’re seeing them get acquired at steep discounts,” said Ryan Falvey of Restive Ventures, which invests in fintech firms.
Valuations have compressed by about six-fold from the 2021 peak of 50 times future revenues, meaning that a company with the same revenue is worth about 85% less in today’s market than five years ago, Falvey told CNBC.
Before the reset, a startup could often be sold to a larger technology company looking to acquire the smaller firm’s engineers for roughly $2 million per coder, according to Khosla Ventures’ Kaul. A firm with 100 engineers would be worth at least $200 million to $300 million, he said.
But that assumption, which provided a floor under startup valuations during the boom, evaporated after AI coding tools allowed far smaller teams to build products — leaving exit opportunities few and far between.
‘OpenAI, Anthropic or Google’
The result is that post-GPT startups are running laps around their older competitors, according to Falvey. He called investments made over the past three years “undoubtedly the best” his firm has made.
“We noticed by 2023 that the companies we invested in post-ChatGPT were already making more money than most of the companies we invested in before ChatGPT,” Falvey said.
Generative AI may ultimately reduce the amount of capital required to build successful software companies, challenging one of the core assumptions that fueled the venture boom of the past decade.
The shakeout is probably just beginning, as the impact of AI reverberates across the business funding ecosystem, from venture to private credit to public giants.
Older software firms, Kaul said, still rely on business models built around charging customers based on the number of employees using their products, an approach he believes AI will undermine as companies automate more white-collar work.
Software providers will need to shift toward outcome-based pricing models and AI-native infrastructure to survive, he said.
“The question I ask every time one of them presents is, why can’t OpenAI, Anthropic or Google do this?” Kaul said. “For most of them, the answer is, ‘They can.’”


Cardano’s flagship Summit will not take place in 2026 after the Cardano Foundation’s treasury proposal narrowly failed to secure the supermajority needed for approval, marking one of the clearest tests yet of the blockchain’s new governance system.
Governance requires not only participation, but also a commitment to accept collective decisions. The Cardano community has spoken and we respect the outcome.
Following the outcome of the Treasury proposal votes, the Cardano Foundation’s proposed Cardano Summit 2026, will not…
— Cardano Foundation (@Cardano_CF) May 30, 2026
The Foundation said that it would cancel the Singapore event and begin winding down preparations, despite the proposal receiving majority support from delegated representatives, or DReps.
Unlike many crypto ecosystems where foundations retain broad discretion over conference budgets and ecosystem spending, Cardano now requires community approval for major treasury withdrawals thanks to the Voltaire governance process.
Delegated representatives were introduced as part of Cardano’s Voltaire governance overhaul, a 2024 upgrade that gave ADA holders the ability to elect representatives to vote on treasury spending and protocol decisions.
The Foundation’s Summit proposal became one of the largest and most visible tests yet of that system, asking DReps to decide whether millions of ADA should be spent on the ecosystem’s flagship annual gathering.
The vote followed a broader governance debate that began with a combined proposal from the Cardano Foundation and EMURGO seeking more than 14 million ADA to fund both the Summit and a major presence at TOKEN2049 Singapore. After DReps criticized the size of the request, organizers split the initiative into separate proposals and reduced the scope of the conference sponsorship.
The revised Summit proposal ultimately fell short of the two-thirds threshold required for treasury withdrawals, while EMURGO’s standalone TOKEN2049 proposal won approval. That proposal requests 3.3 million ADA, or about $793,000 based on the exchange rate used in the filing, to fund a Cardano-branded pavilion, builder showcase stage and ecosystem programming at the Singapore conference.
The Foundation said it would respect the outcome and begin winding down Summit preparations, calling the vote an example of the “thoughtful engagement that effective governance requires.”
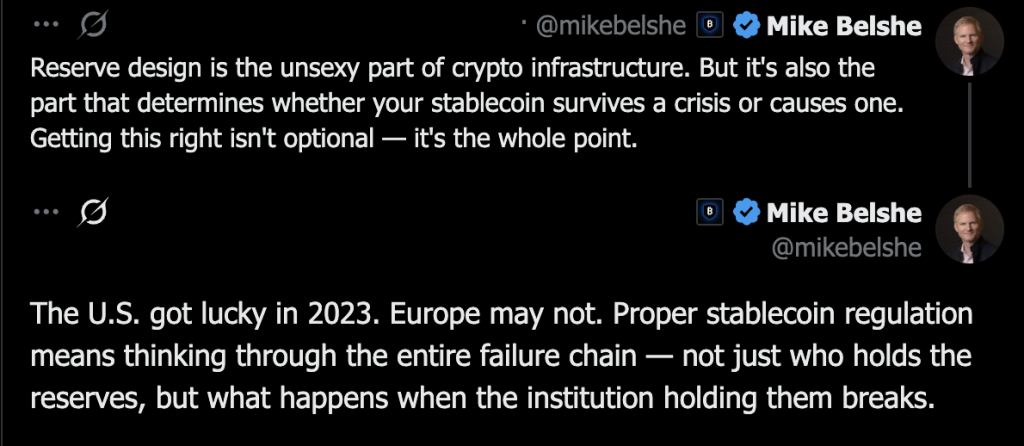
BitGo CEO Mike Belshe is warning that the Europe Union’s MiCA framework could trigger a “massive stablecoin crisis” if major crypto USD-backed issuers fail to meet the bloc’s compliance requirements before the July 1, 2026 enforcement deadline.
The warning lands at a moment when exchanges operating in the EU are already evaluating which tokens survive the regulatory cut.
Belshe’s concern centers on what happens when non-compliant stablecoins, primarily Tether’s USDT, face mass delisting across EU platforms simultaneously.
The result, he argues, would not be an orderly market transition. It would be a liquidity crisis.
Discover: The Best Crypto to Diversify Your Portfolio
Europe MiCA’s Crypto Stablecoin Rules: What the Regulation Actually Requires
The Markets in Crypto-Assets regulation entered into force on June 29, 2023, with its stablecoin provisions, Titles III and IV, applying from June 30, 2024. Full enforcement, including hard delisting pressure on non-compliant tokens, ramps through July 2026.
Any stablecoin referencing a single official currency, like the US dollar, is classified as an e-money token under MiCA, and that classification brings banking-grade obligations.
EMT issuers must be licensed as EU credit institutions or e-money institutions, hold backing assets in segregated, highly liquid instruments, and guarantee par-value redemption at any time.
For Tether, which has long operated outside EU regulatory perimeters, that is not a disclosure update. It is a structural rebuild.
Tether CEO Paolo Ardoino has previously flagged that the requirement to park a significant share of reserves in EU-regulated banks creates its own systemic risk, precisely the kind of bank-run exposure MiCA claims to prevent.
The regulation also empowers the EBA to impose transaction caps on tokens deemed “significant,” with thresholds previously floated around €200 million in daily EU transaction value.
For USDT, which dominates 90%+ of global stablecoin trading volume, that cap would be hit quickly, and the economic logic of EU operations collapses with it.
The stablecoin regulation dynamic playing out in Europe contrasts sharply with the more permissive posture taking shape in the US, where US stablecoin policy discussions have trended toward lighter-touch frameworks.
Who Loses, Who Benefits, and What a Crisis Actually Looks Like
Belshe’s core argument is not that MiCA’s goals are wrong. It is that the transition timeline creates a cliff edge.
If USDT loses EU exchange listings before deep compliant alternatives exist, traders will find themselves in illiquid pairs with no equivalent dollar-liquidity pool to absorb volume. Slippage widens. Price dislocations open between EU and global markets. Arbitrage becomes structurally impaired.
Circle, issuer of USDC, has positioned itself as the primary beneficiary of this shift. Circle holds EU e-money institution licensing and has structured both USDC and its euro-denominated EURC to meet MiCA’s reserve and custody requirements.
That compliance head start is real. But Belshe’s warning, and it is worth taking seriously, is that USDC and EURC do not yet carry the market depth to replace USDT liquidity overnight without causing exactly the turmoil MiCA is designed to prevent.
The EU crypto market is not small. A forced migration of billions in stablecoin volume into thinner compliant pools is not a smooth transition. It is the definition of a liquidity crisis, compressed into a regulatory deadline.
Discover: The Best Token Presales
Stakes: What Happens If Tether Doesn’t Comply by July 2026
If Tether fails to secure MiCA-compliant licensing before the July 2026 deadline, EU-regulated exchanges face a binary choice: delist USDT or risk regulatory sanction.
Several major platforms, including Coinbase’s EU operation, have already moved to restrict USDT access for European users ahead of the deadline. That is not a future risk. It is already happening.

If exchanges delist USDT across EU jurisdictions simultaneously, the liquidity shock concentrates into a narrow window. Traders holding USDT-denominated positions in EU accounts would need to migrate into compliant assets, USDC, EURC, or fiat, under time pressure and into shallower order books.
The mechanism Belshe is warning about is precisely this: not a gradual repricing, but a forced liquidation event driven by regulatory calendar, not market fundamentals.
The critical variable is not whether MiCA enforcement happens. It will. The variable is whether Tether moves toward compliance, and whether regulators grant any transitional relief for existing large stablecoins during the adjustment period, neither of which is currently guaranteed.
The post BitGo CEO Warns of ‘Massive Stablecoin Crisis’ as Europe MiCA Crypto Deadline Looms appeared first on Cryptonews.


The GENIUS Act, signed into law on July 18, 2025, established the first comprehensive federal framework for stablecoins in the United States.
Summary
- USDC’s reserve structure already matched the GENIUS Act’s core requirements before the law passed.
- Circle’s banking, custody, and reserve-management links helped push USDC toward Wall Street infrastructure.
- Broker-dealer capital treatment and FIS integration made USDC more useful for regulated financial firms.
- Circle’s CRCL listing validated the stablecoin business model, but reserve-income dependence remains a risk.
Circle’s USDC was already operationally aligned with what the law required: 98.9 percent of reserves in short-dated US Treasuries and cash equivalents, custodied at BNY Mellon, with BlackRock managing the reserve fund, full monthly attestations, and a regulated US issuer structure. Three subsequent developments accelerated USDC’s institutional positioning.
The SEC quietly amended its broker-dealer guidance to apply only a 2 percent haircut for USDC holdings used as regulatory capital, putting the stablecoin on the same footing as money market funds. Circle’s July 2025 partnership with FIS integrated USDC into the Money Movement Hub serving banks across 46 US states and Europe, connecting it directly to ACH and FedNow rails.
Circle’s June 2025 IPO on the NYSE under ticker CRCL surged to a peak market cap above $77 billion, briefly exceeding the value of USDC in circulation and signaling public-market conviction that the stablecoin business model is durable. Combined, these developments did something subtle but structurally important.
USDC stopped being a crypto-native stablecoin used by institutions and started becoming an institutional financial instrument that happens to be a stablecoin. This is what changed, why it matters more than most coverage acknowledges, and what it means for the broader stablecoin competitive landscape going forward.
What the GENIUS Act actually requires
The mechanics of the GENIUS Act matter because they determine which stablecoins are structurally positioned to capture institutional adoption and which are not. Most coverage treats the law as generic regulatory clarity. The specific provisions are more consequential than that.
The GENIUS Act (Guiding and Establishing National Innovation for US Stablecoins) was signed into law on July 18, 2025, after months of bipartisan negotiation in Congress. The law establishes the category of “Permitted Payment Stablecoin Issuer” (PPSI), defines the requirements for entities seeking that status, and creates a federal regulatory framework that preempts the patchwork of state-level approaches that had previously governed stablecoins.
The core requirements are structural. A PPSI must back its stablecoin 1:1 with high-quality liquid assets, primarily short-term US Treasuries (T-bills), cash, and Treasury repurchase agreements. The reserve composition is specified, and the law requires monthly attestations of reserve composition from independent accounting firms.
The issuer must comply with strict anti-money laundering and sanctions screening requirements equivalent to those applied to federal financial institutions. Larger issuers (those with stablecoin issuance above a specified threshold) fall under direct federal supervision by the OCC. Smaller issuers can elect state supervision through approved state programs.
The most significant structural provision is the seniority of stablecoin holders’ claims if an issuer fails. Under the GENIUS Act, stablecoin holders have senior rights to the reserve assets backing their tokens. This means in the event of issuer bankruptcy or insolvency, stablecoin holders get paid back from reserves before other creditors. This provision is what turns stablecoins from “tokens with reserves” into “regulated financial instruments with bankruptcy-remote backing.” It is the legal architecture making institutional adoption viable at scale.
The law’s effective date is January 18, 2027, or 120 days after regulators issue final regulations, whichever comes later. This means the formal compliance period extends through 2026 and into 2027, but the practical effect on institutional behavior began immediately upon enactment in July 2025. Banks, broker-dealers, and other regulated entities began incorporating USDC into their operational planning as soon as the law passed, even though formal compliance is still being phased in.
The federal preemption matters because it eliminates the regulatory uncertainty that had previously constrained institutional adoption. Before the GENIUS Act, an institution wanting to use a stablecoin had to navigate state-by-state regulations, varying compliance requirements, and unclear federal positioning. After the GENIUS Act, the federal framework provides a single set of rules applying nationally, with clear pathways for both federal and state supervision.
What this means in practice is institutions can now treat compliant stablecoins as standard financial instruments rather than as exotic crypto assets requiring special handling. The legal foundation for treasury management, settlement operations, payment processing, and other institutional use cases is established. The question is no longer whether stablecoins can be used institutionally. The question is which specific stablecoins are positioned to capture the adoption.
Why USDC was structurally aligned before the law passed
The reason USDC captured the institutional positioning the GENIUS Act enabled is Circle had built the company specifically around the regulatory architecture the law eventually mandated. This was not coincidental. It was strategic positioning over a multi-year period.
Circle’s reserve composition has been Treasury-dominated since the company’s early years. As of mid-2025, approximately 98.9 percent of USDC reserves were held in short-dated US Treasuries and cash equivalents. The Circle Reserve Fund is custodied at The Bank of New York Mellon (BNY Mellon), one of the largest custody banks in the world. The fund is managed by BlackRock, the world’s largest asset manager. The reserve composition is published in detailed monthly attestations.
This structure is operationally identical to what the GENIUS Act requires for PPSI status. The 1:1 backing in T-bills and cash equivalents, the institutional custody, the monthly attestations, the regulated US issuer. Circle had built all of it before the law established the formal requirements. When the GENIUS Act passed in July 2025, USDC was already compliant in substance, requiring only the formal application process to achieve PPSI designation.
The contrast with the broader stablecoin landscape is sharp. Tether’s USDT runs through Tether Operations, which is not a US-licensed entity and was not structured to comply with the GENIUS Act framework. Tether eventually launched USAT in January 2026 as a separate US-compliant stablecoin issued by Anchorage Digital Bank, but the global USDT product stays structurally outside the GENIUS framework. Smaller stablecoin issuers face the choice of restructuring to meet PPSI requirements or accepting institutional adoption pathways will not be available to them.
USDC’s pre-existing institutional relationships also matter. The BlackRock partnership for reserve management provides institutional-grade credibility that is difficult for newer entrants to replicate. BNY Mellon custody is the same custody framework used by major asset managers, mutual funds, and institutional pools. Circle’s audit relationships with major accounting firms (rather than just attestation relationships) provide additional institutional confidence. The combined effect is institutional treasurers, compliance officers, and risk managers can review USDC’s operational structure and find it familiar rather than alien.
The Coinbase relationship is the third pillar. Coinbase is the largest distributor of USDC, and the two companies have a revenue-sharing arrangement on the interest income USDC reserves generate. This creates aligned incentives for both companies to scale USDC adoption. Coinbase’s institutional client base (Coinbase Prime serves major institutional investors) becomes a natural distribution channel for USDC into traditional finance.
What Circle built over multiple years was not just a stablecoin. It was the institutional infrastructure stack around the stablecoin: regulated issuer, institutional custody, top-tier asset manager, major exchange distributor, comprehensive compliance program. The GENIUS Act validated this architecture as the regulatory standard. Other stablecoins now have to retrofit themselves to match what USDC was already doing.
The SEC broker-dealer rule that quietly changed everything
One of the most consequential developments for USDC’s institutional positioning happened with relatively little fanfare in early 2026: the SEC adjusted its guidance for broker-dealers using stablecoins as regulatory capital. The change is technical but the impact is structural.
Broker-dealers under SEC oversight are required to maintain specific levels of regulatory capital to ensure they can meet client obligations. The capital requirements include detailed rules about which assets qualify and how much of each asset’s value can be counted toward the capital requirement. Historically, stablecoins have been treated unfavorably under these rules, often with a 100 percent haircut (meaning the stablecoin holdings did not count toward capital at all) or with substantial discounts.
The early 2026 SEC guidance change instructs broker-dealers to apply only a 2 percent haircut when using qualified stablecoins (essentially GENIUS-compliant stablecoins like USDC) as regulatory capital. This means a firm holding $100 million in USDC can now count $98 million toward its capital requirements. The previous treatment would have counted zero. The change puts USDC on the same regulatory footing as money market funds, which have historically been the standard near-cash regulatory capital instrument.
The practical implications are enormous. Broker-dealers can now hold USDC as part of their regulatory capital cushion, which means they can use USDC for client settlements, intraday liquidity management, and other operational purposes without the capital penalty that previously made it economically unattractive. The combined regulatory capital held by US broker-dealers exceeds $500 billion. Even a small percentage shift toward USDC would represent meaningful additional demand for the stablecoin.
The strategic implications go beyond immediate adoption. Once broker-dealers integrate USDC into their capital management workflows, the operational lock-in becomes substantial. Switching costs for established financial infrastructure are high. The institutions adopting USDC first establish operational patterns competitors then have to displace, which creates structural advantage for the early movers.
The contrast with Tether is again instructive. Tether’s USDT was not eligible for the favorable broker-dealer treatment because Tether Operations is not a GENIUS-compliant issuer. USAT, the Anchorage Digital-issued GENIUS-compliant alternative from Tether, is theoretically eligible, but its small scale (approximately $20 million market cap in early 2026 versus USDC’s $73-77 billion) means it cannot meaningfully compete for broker-dealer integration in the near term.
The SEC rule change is also a signal about the broader regulatory direction. The agency under Chair Paul Atkins has consistently moved to make regulated crypto activities easier rather than harder, in contrast to the prior administration’s enforcement-first approach. The broker-dealer haircut change is one of multiple regulatory adjustments collectively favoring institutional crypto adoption through compliant frameworks. USDC’s positioning as the most clearly compliant major stablecoin makes it the primary beneficiary of these adjustments.
The FIS partnership and the banking integration
The Circle-FIS partnership announced on July 10, 2025 (eight days before the GENIUS Act was signed) deserves dedicated attention because it represents the operational mechanism through which USDC enters mainstream US banking infrastructure.
FIS (formerly Fidelity National Information Services) is one of the largest financial technology companies in the world, providing core banking technology, payment processing, and operational infrastructure to thousands of banks and financial institutions globally. FIS’s “Money Movement Hub” is the platform that connects bank operational systems to established payment networks like ACH (Automated Clearing House) and FedNow (the Federal Reserve’s instant payment system).
The Circle-FIS integration lets US banks offer their customers domestic and cross-border payments using USDC through the same operational interfaces they already use for traditional payments. From the bank’s perspective, USDC payments look operationally similar to ACH or FedNow payments. From the customer’s perspective, sending USDC through a participating bank’s interface is similar to sending any other payment. The complexity of blockchain settlement is abstracted away by the FIS infrastructure layer.
This is structurally important because it removes the operational barriers that have historically kept US banks from offering stablecoin services. A bank that wanted to offer USDC payments previously had to either build its own blockchain infrastructure, integrate with multiple wallet providers, or partner with a crypto-native company running outside the bank’s normal compliance and operational framework. The FIS integration provides USDC services through the same operational infrastructure the bank already uses, with the same compliance frameworks and risk management procedures.
The scale is meaningful. FIS serves banks across 46 US states and has substantial European presence. The platform processes payment volumes measured in trillions of dollars annually. Even partial USDC integration across the FIS bank network would represent enormous transaction volume flowing through the stablecoin.
The competitive implications are also substantial. If FIS becomes the dominant infrastructure for bank-issued stablecoin services and USDC is the default stablecoin within that infrastructure, the bank-channel adoption of USDC becomes self-reinforcing. Banks using FIS for traditional payments adopt USDC services through the same infrastructure. The integration cost for switching to alternative stablecoins becomes substantial. The structural lock-in builds over time.
The combined effect of the FIS partnership and the SEC broker-dealer rule is USDC is being integrated into the operational infrastructure of US banking and securities markets simultaneously. Banks use it through FIS for payments. Broker-dealers use it as regulatory capital and for client settlements. Asset managers use the Circle Payments Network for institutional flows. Each integration reinforces the others, creating compound institutional adoption that is difficult for competitors to disrupt.
The IPO verdict and public-market validation
Circle’s June 2025 IPO on the NYSE under ticker CRCL is the public-market expression of the institutional positioning USDC has built. The price action since the IPO tells a story about both the opportunity and the challenges of the stablecoin business model.
Circle priced the IPO at $31 per share, implying a valuation of approximately $6.8-6.9 billion at debut. The stock surged dramatically in the months following, peaking at $298.99 in early 2026. At the peak, Circle’s market capitalization exceeded $77 billion, which briefly exceeded the value of USDC in circulation (approximately $73-74 billion at the time). This was unusual: a company valued at more than the assets it manages on behalf of its product holders.
The market interpretation of the peak valuation was Circle’s business represents more than just a stablecoin issuer. The company is becoming the infrastructure provider for the broader internet financial system, with Arc blockchain development, the Circle Payments Network, USYC tokenized money market fund, EURC euro stablecoin, and various other adjacent products. The peak valuation priced in the full strategic vision rather than just the current stablecoin revenue.
The pullback from the peak (CRCL was trading around $61.92 in February 2026, down approximately 80 percent from the high) reflects the structural challenges of the stablecoin business model under sustained scrutiny. Circle’s revenue is heavily dependent on interest income from Treasury reserves. H1 2026 revenue was approximately $1.25 billion, with 95.5 percent from interest income. This concentration creates two specific vulnerabilities: interest rate risk (if Treasury yields fall, revenue compresses) and competitive risk (if USDC market share grows more slowly than expected, the revenue base does not expand).
Q1 2026 results showed the dynamic in action. Net income declined 15 percent to $55 million despite USDC reaching $77 billion in circulation. The decline reflected rising costs as Circle invested in Arc blockchain development, Circle Payments Network expansion, and other strategic infrastructure. The market’s interpretation was the investment phase is real but the path to scaled profitability requires sustained execution that has not yet been shown.
For analysts and investors, the CRCL story is the public-market test of whether stablecoin issuers can build durable, scaled businesses or whether they are structurally constrained by the interest-rate dynamics of their reserve income. The early read is mixed. The business model works at scale (Circle is meaningfully profitable). The growth trajectory is real (USDC supply keeps expanding). But the valuation pricing in the full strategic vision (the $77 billion peak) requires execution that has not yet been shown, while the more conservative valuation pricing in just the current stablecoin business (the $29 billion current range) implies more modest growth assumptions.
The structural takeaway from CRCL is the public-market verdict on regulated stablecoin businesses is they are real and meaningfully valuable, but the upside scenarios require execution on adjacent products (Arc, CPN, USYC) and continued favorable regulatory environment. The institutional positioning USDC has captured is necessary but not sufficient for the most bullish CRCL scenarios.
The competitive picture and what could change
The combined effect of GENIUS Act alignment, SEC broker-dealer rules, FIS partnership, and IPO validation is USDC has established structural advantages in US institutional adoption that competitors are now scrambling to address. The competitive picture deserves honest engagement.
Tether’s USDT remains the dominant stablecoin globally by market capitalization (approximately $186 billion versus USDC’s $73-77 billion), but the institutional adoption picture has been shifting. USDT’s offshore structure and lack of US regulatory compliance excludes it from the GENIUS Act framework. Tether’s January 2026 launch of USAT through Anchorage Digital was the strategic response, but USAT’s small scale (approximately $20 million market cap in early February 2026) means it cannot meaningfully compete with USDC for institutional adoption in the near term. The MiCA delistings in Europe further constrained USDT’s regulated market access.
Newer compliant stablecoin entrants face similar challenges to USAT. Ripple’s RLUSD launched in late 2024 and has been building distribution through Ripple’s existing institutional relationships, but its market cap is still measured in the low single-digit billions. PayPal’s PYUSD has institutional reach through PayPal’s payment network but limited adoption beyond PayPal’s ecosystem. Bank-issued stablecoins are emerging but generally have institutional-specific use cases rather than competing for broad market share.
The structural advantage USDC has is what economists call “first-mover advantage in a network industry.” Once major institutional infrastructure (FIS, broker-dealer capital management, asset manager treasury operations) integrates USDC, the switching costs for alternatives become substantial. The competitive moat builds over time rather than eroding. Even if alternatives offer better economics or features, the operational disruption of switching makes the alternatives less attractive in practice.
What could change the picture is regulatory shifts, technical failures, or major competitive disruption. The current SEC under Chair Atkins is unlikely to reverse the broker-dealer haircut rule or other USDC-favorable changes, but future administrations could. A significant USDC operational failure (depeg event, reserve transparency issue, custody failure) could damage institutional confidence in ways competitors could exploit. A major competitive disruption (a stablecoin from a tier-one financial institution like JPMorgan, Goldman Sachs, or BlackRock entering at meaningful scale) could fragment the market.
None of these scenarios are imminent, but they are the conditions under which USDC’s institutional positioning could erode. The honest read is USDC’s current advantage is real and substantial, but it is not absolute or permanent. The competitive landscape will keep evolving, and Circle needs to keep executing on the broader infrastructure vision (Arc, CPN, USYC) to maintain the positioning the GENIUS Act enabled.
For institutional users specifically, the practical implication is USDC has become the default stablecoin for new US institutional integrations, but the market is not monolithic. Specific use cases (cross-border remittance, crypto trading, emerging market dollar access) may still favor USDT or other alternatives. The institutional default is USDC, but the broader stablecoin market keeps having multiple legitimate options for different use cases.
What this means for the broader market
The structural shift of USDC into Wall Street infrastructure has implications beyond Circle and USDC specifically, and the broader market effects deserve honest engagement.
For the stablecoin sector generally, the implication is the GENIUS Act creates a clear distinction between compliant and non-compliant issuers, and the compliant issuers are positioned to capture the institutional adoption that the broader stablecoin growth depends on. The total stablecoin market is projected to grow substantially over the next several years (some projections reach $1+ trillion by 2030), but the growth will disproportionately flow to issuers who can integrate into traditional financial infrastructure. USDC is positioned to capture more than its current market share would suggest.
For traditional finance institutions, the implication is the operational pathway to using stablecoins is now clear and accessible. Banks can integrate USDC through FIS. Broker-dealers can hold USDC as regulatory capital. Asset managers can use the Circle Payments Network for institutional flows. The infrastructure barriers that previously constrained institutional stablecoin adoption have been substantially reduced. The pace of institutional adoption over the next 24 months will be determined by institutional risk appetite and competitive pressure rather than by infrastructure availability.
For the US dollar’s global position, the institutional USDC adoption matters because it creates new mechanisms for dollar usage in regulated international finance. Cross-border payments through bank channels using USDC settlement extend dollar reach into transaction flows that previously used either traditional correspondent banking (slow, expensive) or unregulated stablecoin transfers (compliance-questionable). The aggregate effect is reinforcing dollar dominance through new regulated channels.
For the US Treasury market specifically, USDC’s growth creates additional demand for the T-bills backing the stablecoin reserves. This is similar to the dynamic discussed in the context of Tether’s Treasury holdings, but the USDC channel is more institutionally integrated and more directly visible to traditional financial market participants. If USDC scales to $200+ billion in circulation over the next few years, the additional Treasury demand from USDC alone could be $150+ billion, with similar dynamics to the Tether Treasury holdings analysis.
For competing financial infrastructure (SWIFT, traditional correspondent banking, payment networks), the USDC adoption represents both threat and opportunity. The threat is stablecoin rails can offer faster, cheaper alternatives for specific use cases. The opportunity is integrating with stablecoin infrastructure (like SWIFT has done with Chainlink) extends the existing infrastructure’s relevance rather than replacing it. The likely outcome is hybrid models where stablecoins and traditional infrastructure coexist and integrate rather than competing directly.
The bottom line
The GENIUS Act did not create USDC’s institutional positioning. Circle had built that positioning over multiple years through deliberate strategic choices: Treasury-dominated reserves, BNY Mellon custody, BlackRock asset management, comprehensive attestations, regulated US issuer structure. What the GENIUS Act did was validate this architecture as the regulatory standard and unlock the institutional adoption pathways that the pre-existing infrastructure had been built to enable.
The three subsequent developments (SEC broker-dealer rule, FIS partnership, IPO) compounded the structural advantage. The broker-dealer haircut change made USDC usable as regulatory capital for securities firms. The FIS partnership integrated USDC into the operational infrastructure of US banking. The IPO created public-market validation and provided Circle with capital to execute on the broader infrastructure vision. Together, these developments transformed USDC from “the regulated stablecoin alternative” into “the institutional default for new US stablecoin integrations.”
The competitive picture is favorable for USDC but not without risks. Tether’s USDT remains dominant globally and keeps growing in absolute terms despite losing market share percentage. USAT, RLUSD, PYUSD, and other compliant alternatives are positioned to compete in specific segments. Bank-issued stablecoins may emerge from major institutions in ways that fragment the market. The institutional advantage USDC has built is real and substantial but not absolute or permanent.
For Circle as a company, the structural positioning creates both opportunity and risk. The opportunity is becoming the infrastructure provider for the internet financial system, with USDC as the foundation and Arc, CPN, USYC, and other products building the broader stack. The risk is the business model’s heavy dependence on interest income from Treasury reserves creates vulnerability to rate environment changes and competitive pressure on the reserve-yield revenue stream. The CRCL stock trajectory (peak above $77 billion market cap, pullback to roughly $29 billion) reflects the market’s ongoing assessment of these dynamics.
For institutional users specifically, the practical implication is USDC has become the default stablecoin for new US institutional integrations. The combination of GENIUS Act compliance, broker-dealer capital eligibility, banking infrastructure integration through FIS, institutional custody at BNY Mellon, and BlackRock-managed reserves provides the operational and regulatory foundation institutional risk and compliance teams require. Choosing USDC for new institutional use cases is the path of least resistance in 2026, and the operational lock-in builds over time.
For the broader US dollar story, USDC’s institutional adoption creates new mechanisms for dollar usage in regulated international finance and creates additional structural demand for US Treasury bills. The aggregate effect is reinforcing US dollar dominance through new regulated channels, complementing the dynamic visible through Tether’s Treasury holdings but running through different distribution channels and reaching different user segments.
For the broader crypto sector, the USDC story is one of the clearest examples of how regulated crypto infrastructure can integrate into traditional finance at institutional scale. The integration is not happening through dramatic announcements or speculative narratives. It is happening through the boring infrastructure of SEC rule changes, banking system partnerships, custodial relationships, and reserve management arrangements. The compounding effect over the next several years will likely make USDC structurally important to US financial infrastructure in ways current market cap figures do not fully capture.
The GENIUS Act did not invent any of this. It codified what Circle had already built and unlocked institutional adoption pathways the pre-existing infrastructure was designed to enable. The result is USDC has become Wall Street’s stablecoin not through marketing or promotion but through the slow, deliberate work of building institutional infrastructure that regulated financial institutions actually need.
The implications go beyond Circle. They reach into how the US financial system integrates stablecoins, how the US dollar keeps its global position through new mechanisms, and how the broader crypto-traditional finance integration actually happens at scale. Those are conversations the broader financial world is now having seriously rather than dismissively.
USDC’s position as the institutional default is the structural fact making most of these conversations possible. The next phase will be determined by whether Circle can execute on the broader infrastructure vision (Arc, CPN, USYC) and whether competitive pressure or regulatory shifts disrupt the current trajectory. The answer arrives over the coming years through specific operational milestones rather than through any single defining event.
Wall Street’s stablecoin is USDC. The structural reasons why are now in place. The implications keep unfolding.
This article is for informational purposes and does not constitute financial or investment advice. Stablecoin regulations, institutional adoption patterns, and competitive dynamics evolve quickly; the figures and milestones described reflect reporting available as of late May 2026. Always do your own research.

Ethereum price has fallen below the key $2,000 support level as institutional outflows, geopolitical tensions, and a bearish technical breakdown weigh on market sentiment.
Summary
- Ethereum price has fallen below the key $2,000 support level as spot ETF outflows, weak U.S. demand, and risk-off sentiment weigh on the market.
- A breakdown below a descending parallel channel has exposed downside targets near $1,900 and $1,825, with major support clustered around February lows.
- CoinGlass data shows large liquidation clusters between $2,100 and $2,150, while analysts warn a loss of the $1,900-$1,950 zone could trigger a deeper decline.
According to data from crypto.news, Ethereum (ETH) price traded near $1,990 at press time after slipping under the psychological $2,000 threshold for the first time in months. The move came amid persistent selling pressure across U.S. markets, with traders growing increasingly defensive as risk appetite deteriorated across both crypto and traditional assets.
A sharp decline in American spot demand appears to be one of the immediate drivers behind the breakdown. Market participants have pointed to a deeply negative Coinbase premium, a metric that compares ETH prices on Coinbase with offshore exchanges.
The premium’s move into negative territory suggests U.S.-based selling has outpaced global buying interest, removing an important source of support around the $2,000 area.
At the same time, capital continues to flow out of Ethereum investment products. SoSoValue data shows spot Ethereum exchange-traded funds recorded $241 million in net outflows over the past week, extending monthly withdrawals to roughly $540 million.
Outside crypto markets, rising geopolitical uncertainty has added another layer of pressure. Traders have remained focused on developments surrounding the United States and Iran, while elevated crude oil prices have renewed concerns about inflation.
Higher energy costs threaten to complicate the Federal Reserve’s policy outlook and reduce expectations for near-term interest rate cuts, a backdrop that has historically weighed on risk assets.
Digital asset funds have already begun feeling the effects. Recent industry data showed roughly $2.8 billion leaving crypto investment products over the past week, underscoring the cautious stance many investors have adopted amid macroeconomic uncertainty.
Ethereum confirms major technical breakdown below multi-month support
Ethereum’s latest decline has also completed a significant technical breakdown on higher timeframes.
The daily chart shows Ethereum breaking below the lower boundary of a descending parallel channel that has contained price action since January. Sellers forced ETH beneath both the channel support and the 0.786 Fibonacci retracement level near $2,100 before pushing the token below the psychological $2,000 mark.
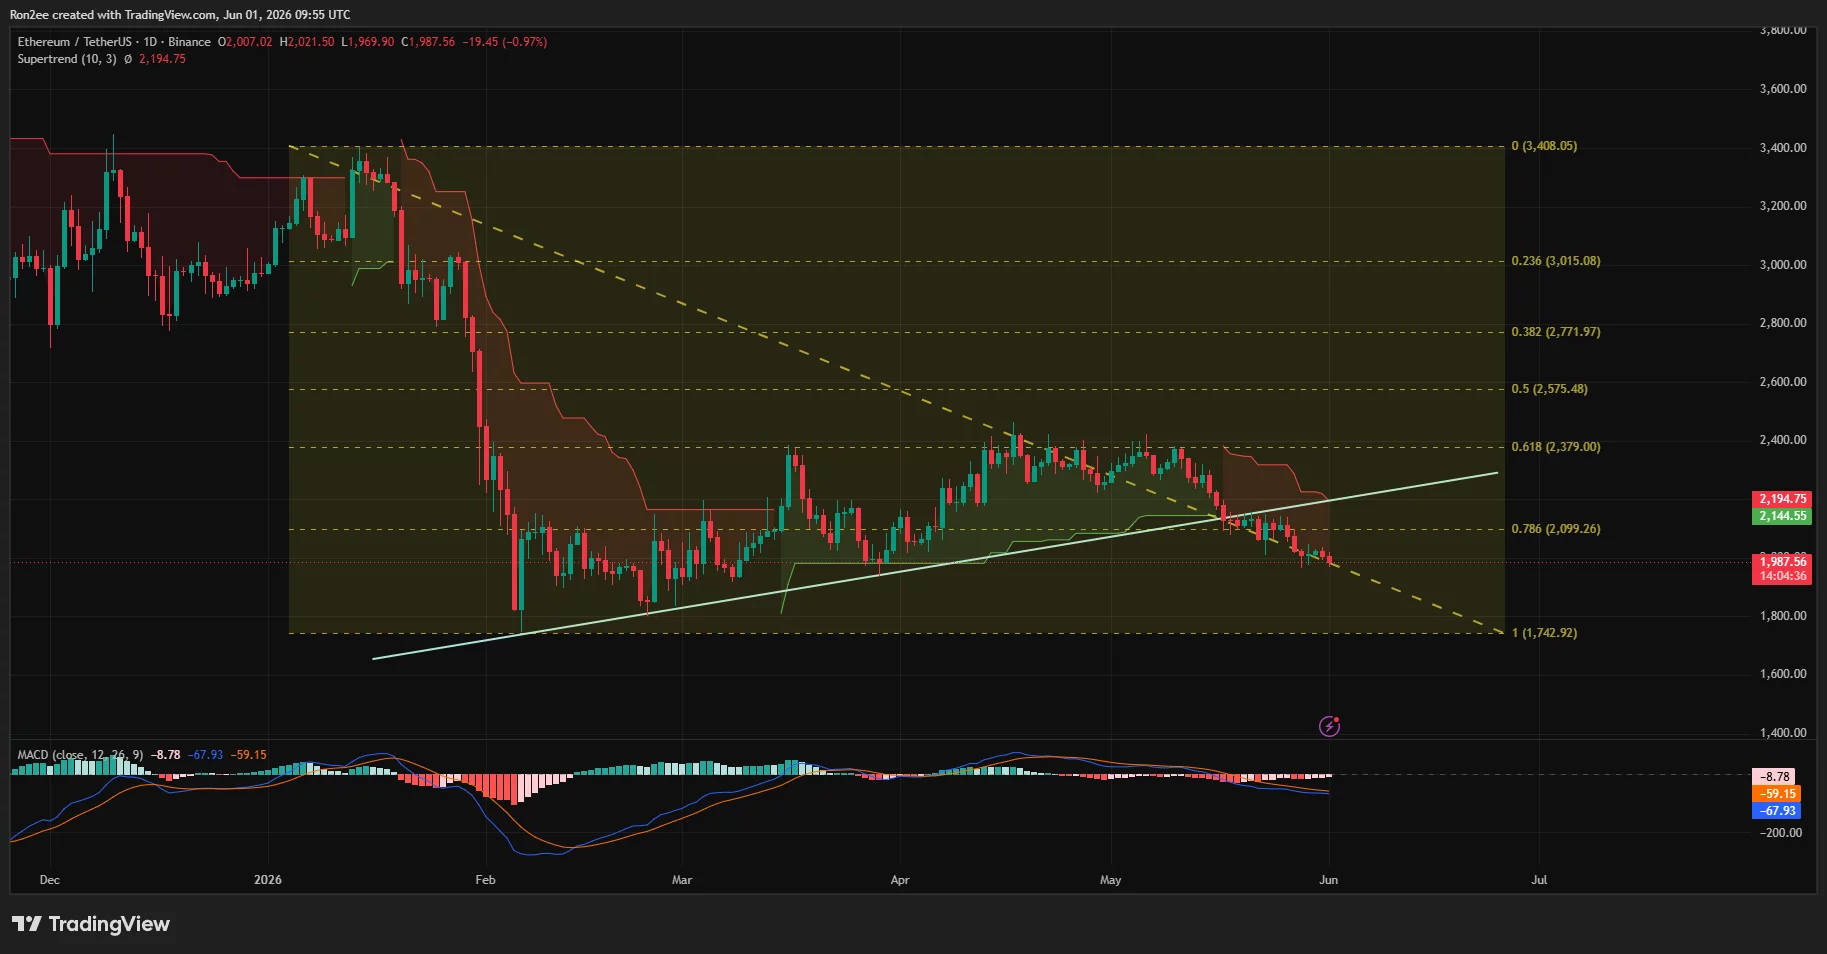
The breakdown leaves the February low near $1,825 as the next major downside target, while former channel support around $2,100 now acts as immediate resistance.
Several trend indicators continue favoring sellers. Ethereum trades below its Supertrend resistance near $2,195 and remains under the 20-day, 50-day, and 200-day moving averages. Those levels now form successive layers of overhead resistance between roughly $2,100 and $2,400.
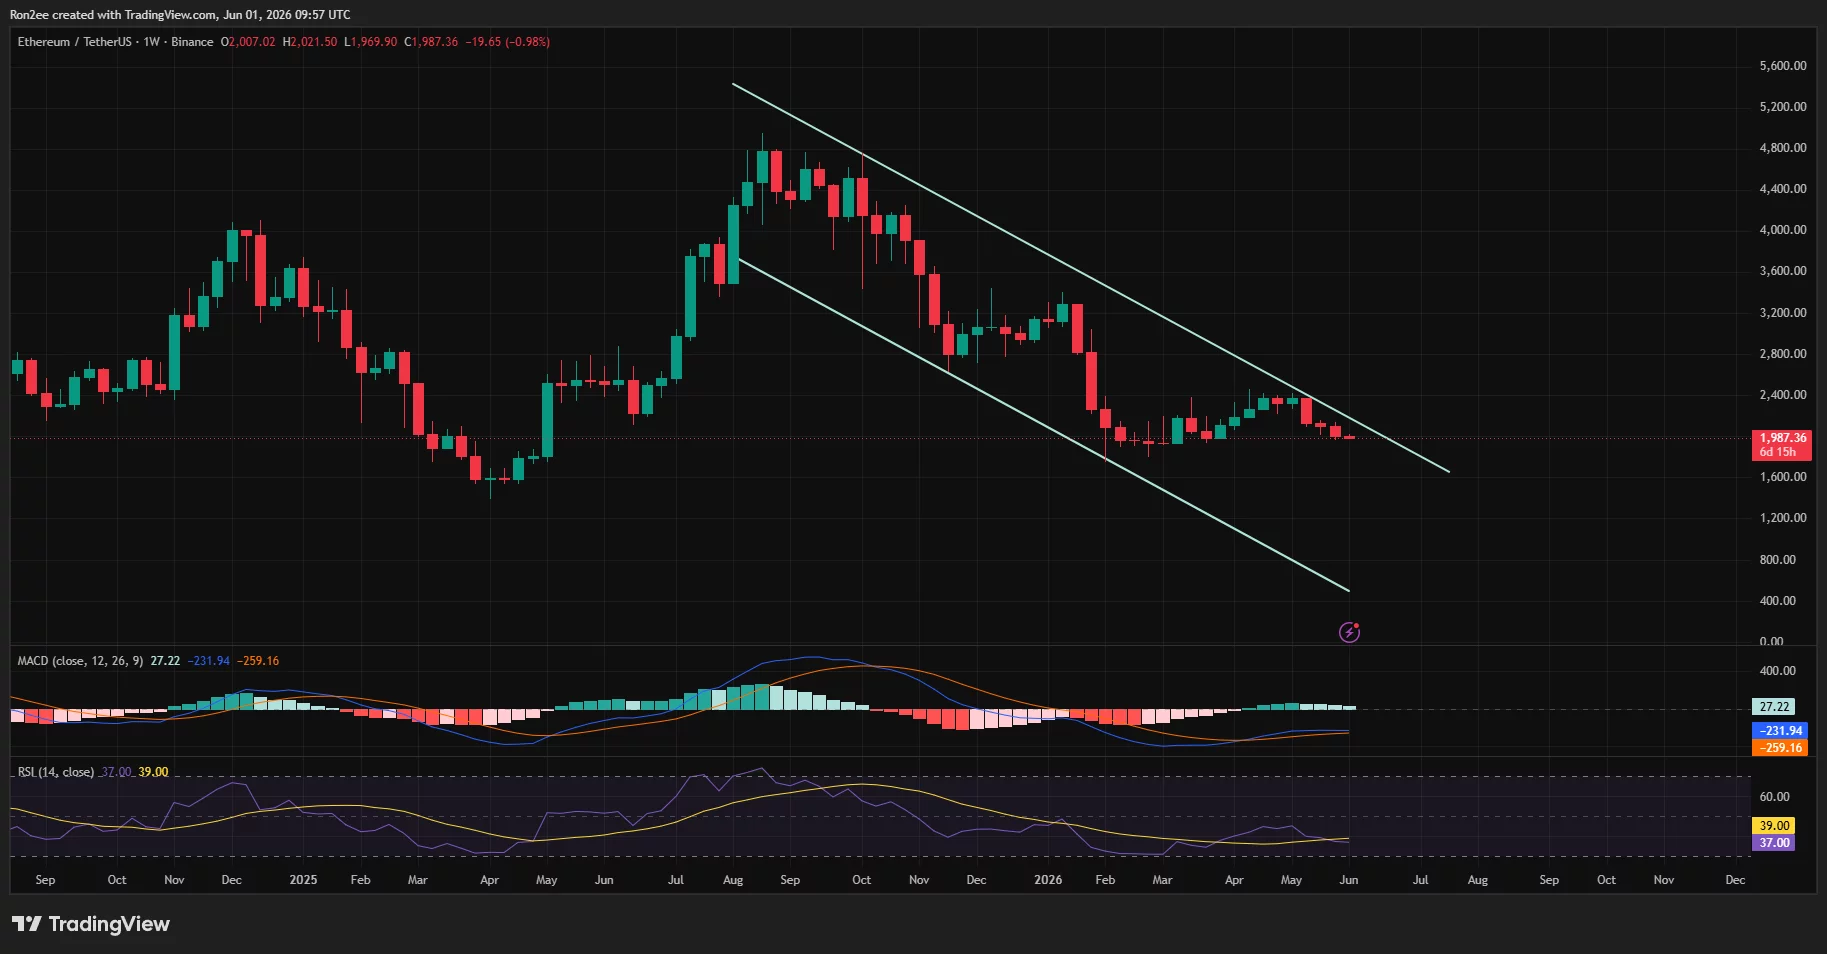
Momentum indicators have yet to show signs of a meaningful reversal. The weekly Relative Strength Index sits near 37, keeping ETH in weak territory despite avoiding oversold conditions. Meanwhile, the weekly MACD remains below its signal line after failing to produce a bullish crossover during May’s recovery attempt.
A longer-term chart structure also presents a bearish picture. Ethereum continues trading inside a descending channel that has contained price action since the second half of 2025. The upper boundary of that channel currently sits near $2,300, while the lower boundary intersects near the $1,750-$1,800 region.
Commenting on the setup, crypto analyst Ali Martinez argued that Ethereum is approaching an important support zone.
“Ethereum is approaching the bottom of its channel near $1,825. That area could offer a favorable risk-reward entry targeting $2,073 and $2,360, as long as price remains above $1,750 on a daily closing basis.”
Fellow analyst Ted Pillows identified $1,900-$1,950 as the next major support region following the loss of $2,000. According to Pillows, a failure to hold that zone could open the door to fresh cycle lows.
Derivatives positioning suggests traders are preparing for heightened volatility around those levels.
CoinGlass liquidation heatmaps show one of the largest nearby liquidity clusters concentrated between $2,100 and $2,150. A large amount of leveraged short positions appears stacked in that range, creating a potential magnet if Ethereum manages to reclaim lost support. Below current prices, notable liquidation pockets sit around $1,950 and extend toward the $1,900 area.
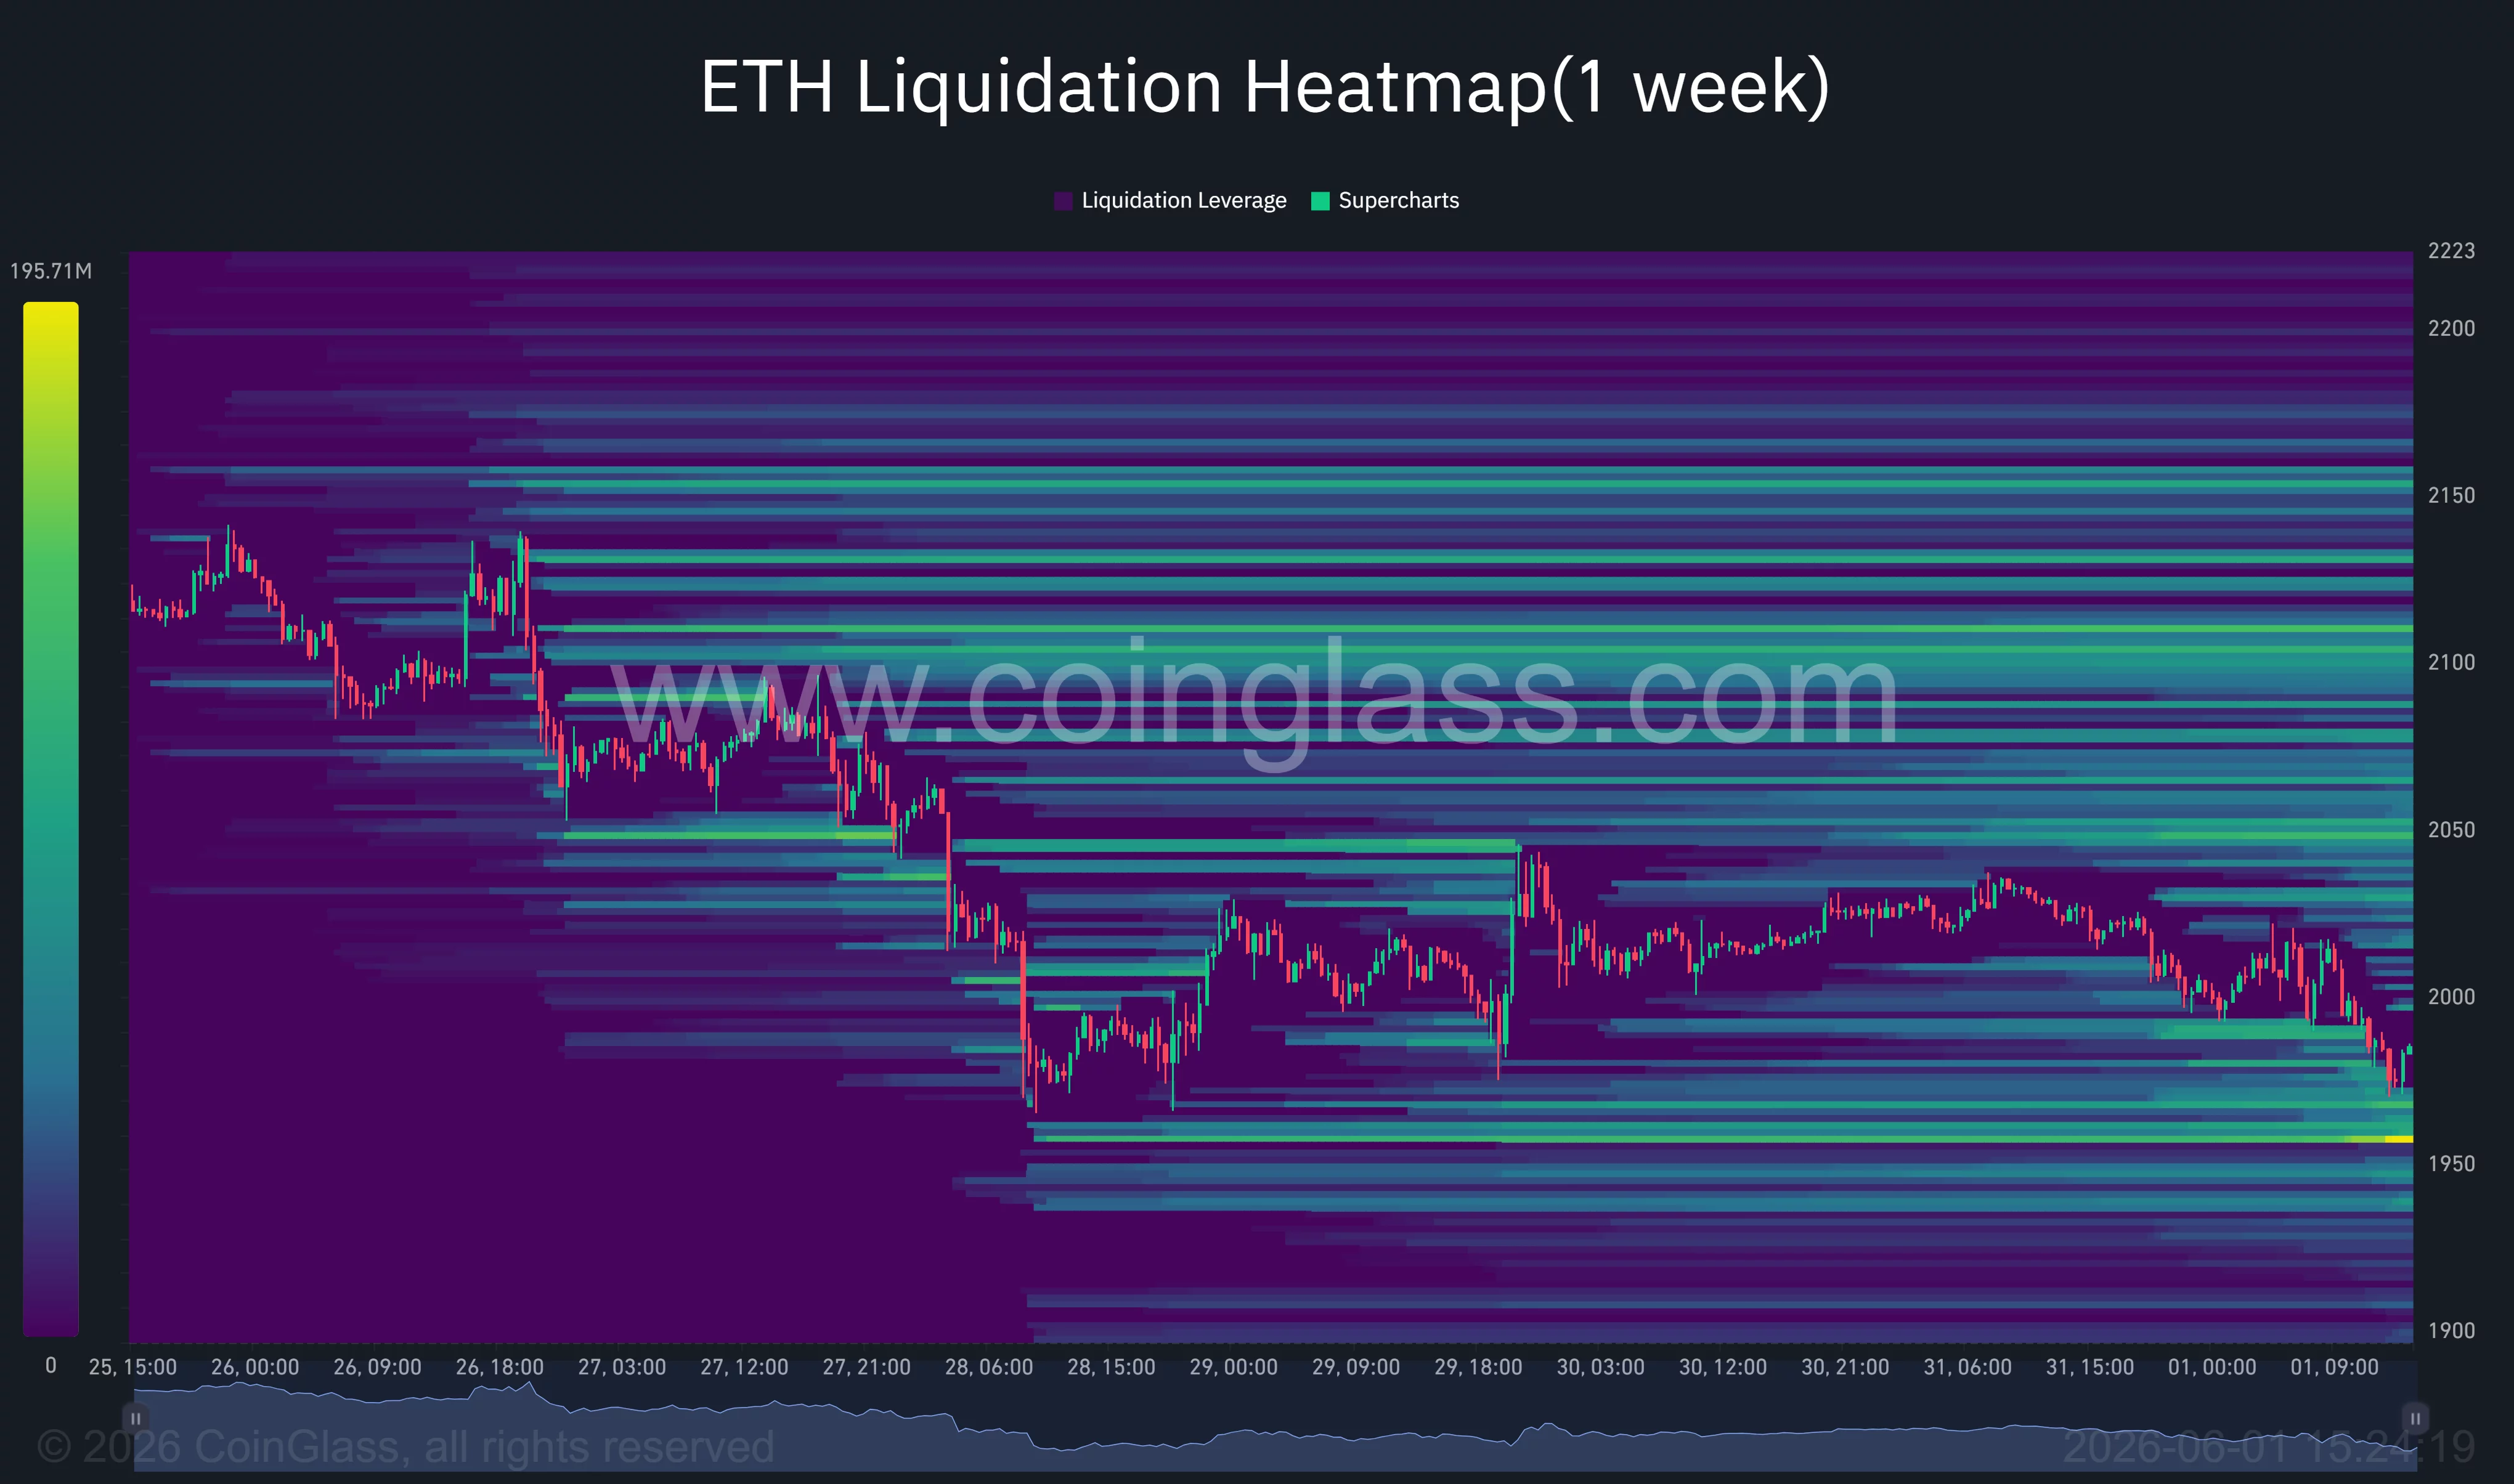
The concentration of leverage beneath spot price raises the risk of another liquidation cascade if support levels fail. Such events often accelerate downward moves as forced long liquidations add additional market sell orders.
ETF outflows and macro risks keep pressure on Ethereum
Institutional participation has weakened noticeably during the latest correction.
Spot Ethereum ETFs have now lost more than half a billion dollars over the past month, a stark contrast to the strong inflows seen earlier this year. Persistent redemptions have coincided with declining relative performance against Bitcoin, as investors continue to favor the largest cryptocurrency during periods of market uncertainty.
Capital rotation toward artificial intelligence-linked technology stocks has also attracted attention among market participants. Several analysts have noted that investors seeking growth exposure have increasingly shifted toward mega-cap technology companies rather than digital assets, reducing speculative demand across crypto markets.
Meanwhile, stronger-than-expected inflation readings driven by higher energy costs could force policymakers to maintain restrictive monetary conditions for longer. Such an outcome would likely keep pressure on liquidity-sensitive assets, including Ethereum.
A sustained recovery above $2,100 would weaken the immediate bearish case and place the $2,150 liquidation cluster back into focus. Breaking through that region could trigger short covering and expose resistance levels near $2,360 and $2,400.
For now, however, sellers retain control of the trend. Unless buyers quickly reclaim the $2,000-$2,100 region, technical targets around $1,900, $1,825, and potentially the lower channel boundary near $1,800 are likely to remain in focus.
Disclosure: This article does not represent investment advice. The content and materials featured on this page are for educational purposes only.

Disclosure: The author of this story owns shares in Strategy (MSTR).
Strategy, the world’s largest publicly traded corporate holder of bitcoin , has maintained the 11.5% dividend rate on its perpetual preferred stock, Stretch (STRC), marking the fourth consecutive month without an increase.
STRC has undergone seven dividend increases since its introduction in July 2025 with a 9% dividend rate. Strategy was able to hold the current rate this month after the stock’s volume-weighted average price (VWAP) reached $99.62, keeping shares close enough to their $100 par value, a key objective of the product’s design.
Strategy markets STRC as a short-duration, high-yield savings alternative. The perpetual preferred stock pays monthly cash distributions, with the dividend rate reset each month to encourage trading near par value and minimize price volatility.
Although STRC has not traded at its $100 par value since May 14, STRC recently rebounded after falling as low as $97.11 on Thursday, recovering to around $99.10. The next ex-dividend date, the cutoff at which investors must own shares to receive the upcoming dividend payment, is June 15. Similar to trading patterns observed in May, STRC could briefly return to par in the days leading up to the ex-dividend date.
Maintaining a stable price near $100 is important for Strategy because it allows the company to efficiently issue additional shares through its at-the-market (ATM) program. Proceeds can be used to purchase more bitcoin or address corporate liabilities, including debt obligations such as its recently paid down some of its 2029 convertible notes.
Meanwhile, Executive Chairman Michael Saylor continued his customary Sunday social media posts, writing “Working Better.” The message comes amid growing investor focus on whether Strategy may eventually sell bitcoin to meet debt or dividend obligations, or whether it will continue using capital raised through its securities offerings to expand its bitcoin holdings.


Binance opened access to more than 8,000 US stocks and exchange-traded funds for its non-US customers on Monday. The world’s largest crypto exchange framed the launch as a step toward becoming a multi-asset financial super app.
The move places Binance alongside rivals racing to merge crypto rails with traditional equity markets. Customers can buy fractional shares starting at $5, with zero commission, using stablecoins or the exchange’s own token.
Crypto Exchanges Chase Wall Street
The launch reflects a wider convergence between crypto platforms and traditional finance. Exchanges that once focused on tokens now want a slice of the equities business.
Co-CEO Richard Teng told Fortune that US stocks make up well over half of global equities. Yet many overseas buyers face high costs and friction when they try to access them.
Binance is not alone in this shift. Earlier, OKX moved to enter traditional finance through tokenized stocks, while Coinbase added stock trading in its everything exchange bid.
Wall Street is meeting crypto halfway. Asset manager BlackRock has issued Treasury bills as blockchain wrappers, blurring the line between the two markets.
How Binance’s Stock Trading Works
Share purchases on Binance will be arranged by a broker-dealer called Nest Trading. A New York firm, Alpaca, will handle custody, dividend payments, and corporate actions.
Customers can pay using the stablecoins USDC or USDT. They can also use a handful of other tokens, including Binance’s own BNB.
The push is not the exchange’s first step beyond crypto. Binance already offers derivatives tied to gold, petrochemicals, and pre-IPO share trading.
However, its record here is mixed. Binance halted stock tokens in 2021 after regulators questioned whether the products were unregistered securities.
Binance also outlined a plan for bStocks, which will let users tokenize the equities they buy. Customers can convert shares into digital tokens on BNB Chain in the coming weeks.
The design stands out because users can start the tokenization themselves. Rivals such as Kraken and Robinhood have launched similar products, with Kraken tokenizing US tech stocks for overseas markets.
Supporters point to speed. Blockchain-based trades can settle almost instantly, against the days or more that Wall Street intermediaries need.
In a statement, Binance described the aim of the new product.
“bStocks offering will provide a native bridge from traditional stock ownership to programmable, always-on tokenized assets at a global scale … This unlocks mobility and utility for real-world equities within and beyond the Binance ecosystem, enabling continuous on-chain access and potential DeFi applications, from lending to liquidity provision,” Binance stated.
Not everyone is sold. Some critics warn that tokenized stocks could add risk to the US equity market, even as the New York Stock Exchange and Nasdaq have announced tokenization plans.
Whether self-service tokenization draws real equity volume on-chain may become clearer in the weeks ahead as bStocks goes live.
The post You Can Now Trade 8,000 US Stocks on Binance Using Your Stablecoins appeared first on BeInCrypto.


Binance will allow non-U.S. users to trade more than 7,000 U.S. stocks and ETFs as the exchange pushes deeper into traditional markets.
Summary
- Binance will let non-U.S. users trade over 7,000 U.S. stocks and ETFs commission-free.
- Users can buy fractional shares from $5 using USDT, USDC, BNB and selected cryptocurrencies.
- Binance plans bStocks on BNB Chain as tokenized equities race gains more exchange backing.
Binance opens U.S. stock access
The new service will offer zero-commission trading and fractional share purchases starting at $5, according to Fortune. The feature will target users outside the United States.
Customers will be able to buy equities using USDT, USDC, BNB and selected cryptocurrencies. Nest Trading will provide brokerage services, while Alpaca will handle custody, dividends and corporate actions.
The rollout gives Binance users access to major U.S. equities without leaving the exchange’s platform. It also adds another asset class to a business that already offers spot crypto, derivatives and other market products.
Binance co-CEO Richard Teng told Fortune that U.S. stocks represent well over half of the global equities market. He said many overseas users still face high costs and friction when trying to buy them.
bStocks tokenized equities are planned
Binance also plans to launch tokenized stocks called bStocks in the coming weeks. The product will allow eligible users to convert supported equities into on-chain assets on BNB Chain.
The planned service would create synthetic versions of selected stocks in token form. Binance says this could allow continuous on-chain access and possible use in decentralized finance applications.
“Native bridge from traditional stock ownership to programmable, always-on tokenized assets at a global scale,” Binance said in a statement to Fortune.
The company said bStocks may support use cases such as lending and liquidity provision. The product has not launched yet, and Binance has not listed all supported equities.
Tokenized stock race widens
The move comes as more exchanges test tokenized exposure to public markets. As previously reported by crypto.news, Bitget launched Reality with more than 100 tokenized assets, including U.S. stocks and ETFs backed 1:1 through regulated brokers.
That report said Reality supports stablecoin dividend payouts, DeFi-compatible tokenized assets, and 24/5 minting and redemption. The platform also includes selected private-market and pre-IPO-linked products.
Coinbase has been building toward an “everything exchange” model, as previously reported. That strategy includes crypto, derivatives, options, tokenized stocks, equities, token sales and prediction markets.
These moves show that crypto exchanges are no longer limiting growth to digital assets. They are adding traditional market products while keeping stablecoins and blockchain settlement at the center.
Wall Street also moves on-chain
Traditional exchanges are also testing tokenized securities. Recent reporting showed that NYSE filed a rule change to allow eligible tokenized securities to trade beside regular shares on the same order book.
Under that proposal, tokenized assets would keep the same ticker, CUSIP, rights and privileges as the original securities. Clearing and settlement would remain within existing market rails during the pilot.
Binance’s plan is different because it targets non-U.S. users through a crypto exchange interface. It also links stock access with future on-chain conversion through bStocks.
The launch places Binance more directly in the race between crypto exchanges, brokers and Wall Street firms. The main test will be whether users adopt stocks and tokenized equities inside a platform best known for crypto trading.

EasyJet says possible takeover bid 'opportunistic'
Senator Lummis Warned That Stalling the CLARITY Act Now Means No Crypto Regulation Until 2030

Why Planes Have Ashtrays Even Though Smoking’s Banned

Steven Gerrard disagrees with Gary Neville over ‘shock’ Chelsea and Arsenal claim | Football

US brings back mandatory military draft registration

Register Renaming | Hackaday

The New 13F Filings Were Wild…

6 Financial Goals You Must Achieve Before Age 40 | Life-Changing Money Tips #motivation #elonmusk

JM Financial Expects 15-20% Loan Book Growth After Reset: CFO On IPO Pipeline, Housing Finance &More
-

 NewsBeat5 days ago
Israel says it has killed new Hamas military leader in Gaza City airstrikes
-

 Tech5 days ago
NASA taps Blue Origin to deliver lunar rovers for Moon Base initiative
-

 Politics7 days ago
Bridgerton Season 5: Cast, Release Date And Everything We Know So Far
-

 Sports6 days ago
2026 NBA Finals schedule, odds: Knicks await Thunder or Spurs after winning East
-

 News Videos5 days ago
XRP *JUST* SUCCEEDED!!!! CLARITY ACT EXPOSED!!! (SHE EXPOSED IT)
-

 News Videos3 days ago
This is BROKEN! INSANE 5x MONEY CAR WASH WEEK! The NEW GTA Online UPDATE Today! (GTA5 New Update)
-
 Crypto World6 days ago
Micron Crosses $1 Trillion Market Cap as AI Demand Reshapes Memory Sector
-
 NewsBeat7 days ago
Hottest May day ever as London hits 34.8C in 2C leap from previous records
-

 Business5 days ago
Selena Gomez Reportedly Upset Over Benny Blanco’s Comments on Her ‘Terrible’ Diet
-
 Tech6 days ago
China assigns ID codes to 28,000+ humanoid robots
-

 Business7 days ago
Nikkei 225 Surges Past 65,000 for First Time as Iran Peace Hopes Fuel Record Rally
-

 Tech7 days ago
Microsoft’s quiet Claude Code retreat and the real cost of enterprise AI
-

 Tech3 days ago
Waymo dominates autonomous vehicle registrations as Tesla trails behind
-
 Entertainment6 days ago
‘Breaking Bad’ Star’s Easy-to-Binge 6-Part Crime Series Spin-Off Is Finally Heading to Free Streaming
-

 NewsBeat7 days ago
Crowds find riverside shade in York as temperatures soar
-
Tech5 days ago
The Samsung pay deal is the moment Korean unions changed register
-

 Entertainment6 days ago
Days of our Lives 2-Week Spoilers May 25-June 5: Gwen Rages, Abe Confesses & 2 Tragic Anniversaries!
-
 Tech2 days ago
SpaceX just won a second Golden Dome contract. This one is $4.16 billion.
-

 Tech7 days ago
Westone Audio and Etymotic Acquired by Fidelity Collective in Major IEM Market Move
-
 Entertainment6 days ago
Taylor Swift Fans Label Travis Kelce’s Beer-Chugging A ‘Red Flag
You must be logged in to post a comment Login