Spot Bitcoin ETFs recorded $526.64 million in net outflows last week, extending their losing streak to eight consecutive weeks.
Spot Ethereum ETFs also posted net outflows of $13.67 million, marking an eighth straight week of withdrawals.
In contrast, SOL, XRP, and HYPE ETFs attracted fresh capital, with XRP ETFs leading weekly inflows.
Analysts say ETF flows remain a key indicator of institutional sentiment as investors monitor Bitcoin’s next market direction.
U.S. spot Bitcoin exchange-traded funds (ETFs) continued to face heavy selling pressure last week, recording $526.64 million in net outflows between June 29 and July 2. The latest withdrawals mark the eighth consecutive week of net outflows, the longest weekly redemption streak since spot Bitcoin ETFs began trading in the United States.
The trend reflects continued caution among institutional investors as Bitcoin struggles to regain momentum. According to SoSoValue data, total net assets across U.S. spot Bitcoin ETFs have fallen to approximately $74.37 billion, while Bitcoin traded near $61,500 during the reporting period, as shown in the accompanying chart. The sustained redemptions come after June became the worst month on record for spot Bitcoin ETFs, with roughly $4.5 billion leaving the products.
Spot Bitcoin ETFs See $527M Net Outflows Last Week, Extending Outflow Streak to 8 Weeks
From June 29 to July 2 (ET), spot Bitcoin ETFs saw $527 million in net outflows, marking the eighth consecutive week of outflows. Spot Ethereum ETFs recorded $13.67 million in net outflows,… pic.twitter.com/mqujUflCEl
Spot Ethereum ETFs also remained under pressure, posting $13.67 million in net outflows over the same period. Like Bitcoin funds, Ethereum ETFs have now logged eight straight weeks of investor withdrawals, highlighting persistent risk-off sentiment across the two largest digital assets.
Advertisement
Altcoin ETFs Buck the Trend as SOL, XRP, and HYPE Attract Fresh Capital
While Bitcoin and Ethereum products continued to lose assets, several newer crypto ETFs managed to attract fresh investment.
Spot Solana (SOL) ETFs recorded $5.75 million in weekly net inflows, while XRP ETFs brought in $17.19 million, making XRP the strongest performer among the major altcoin funds. Hyperliquid (HYPE) ETFs also remained in positive territory with $4.32 million in net inflows, although the figure represented a slowdown compared with previous weeks.
The divergence suggests that some investors are rotating capital into alternative digital assets rather than exiting the crypto ETF market entirely. Although Bitcoin remains the largest institutional investment vehicle in the sector, selective demand for altcoin-based products indicates that investors continue to seek exposure to projects they believe offer stronger upside potential.
Bitcoin ETFs Face Mounting Pressure Despite Brief Daily Recovery
Despite the weak weekly performance, the reporting period ended with a small sign of stabilization. On July 2, U.S. spot Bitcoin ETFs recorded more than $221 million in daily net inflows, breaking a 10-session outflow streak. However, analysts caution that a single positive trading day is unlikely to reverse the broader trend after eight consecutive weeks of withdrawals.
Advertisement
Market observers attribute the prolonged outflows to a combination of macroeconomic uncertainty, higher interest-rate expectations, and reduced appetite for risk assets. Bitcoin has remained under pressure alongside broader financial markets, while institutional investors continue trimming exposure through ETF redemptions.
Going forward, ETF flows are expected to remain a closely watched indicator of institutional sentiment. A sustained return to net inflows could signal renewed confidence in Bitcoin, while continued withdrawals may reinforce expectations of subdued demand until broader market conditions improve.
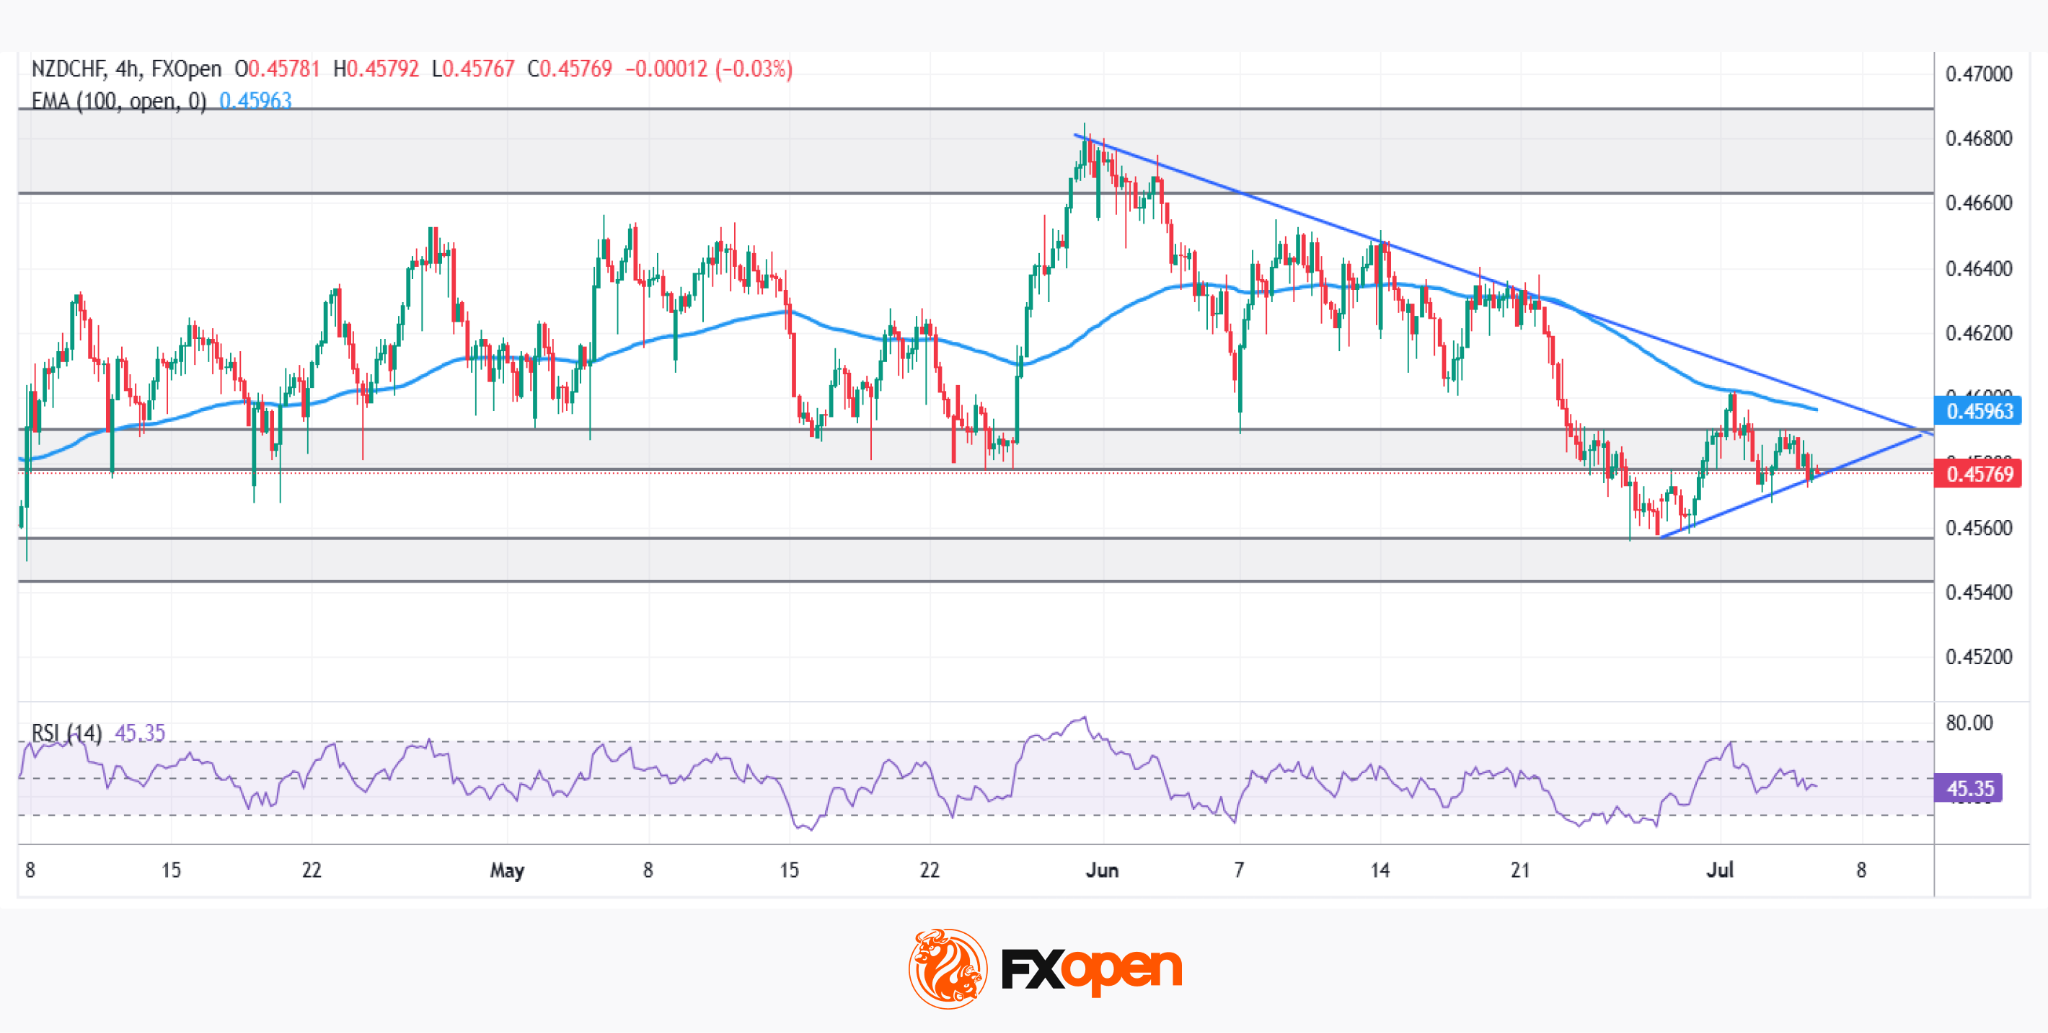
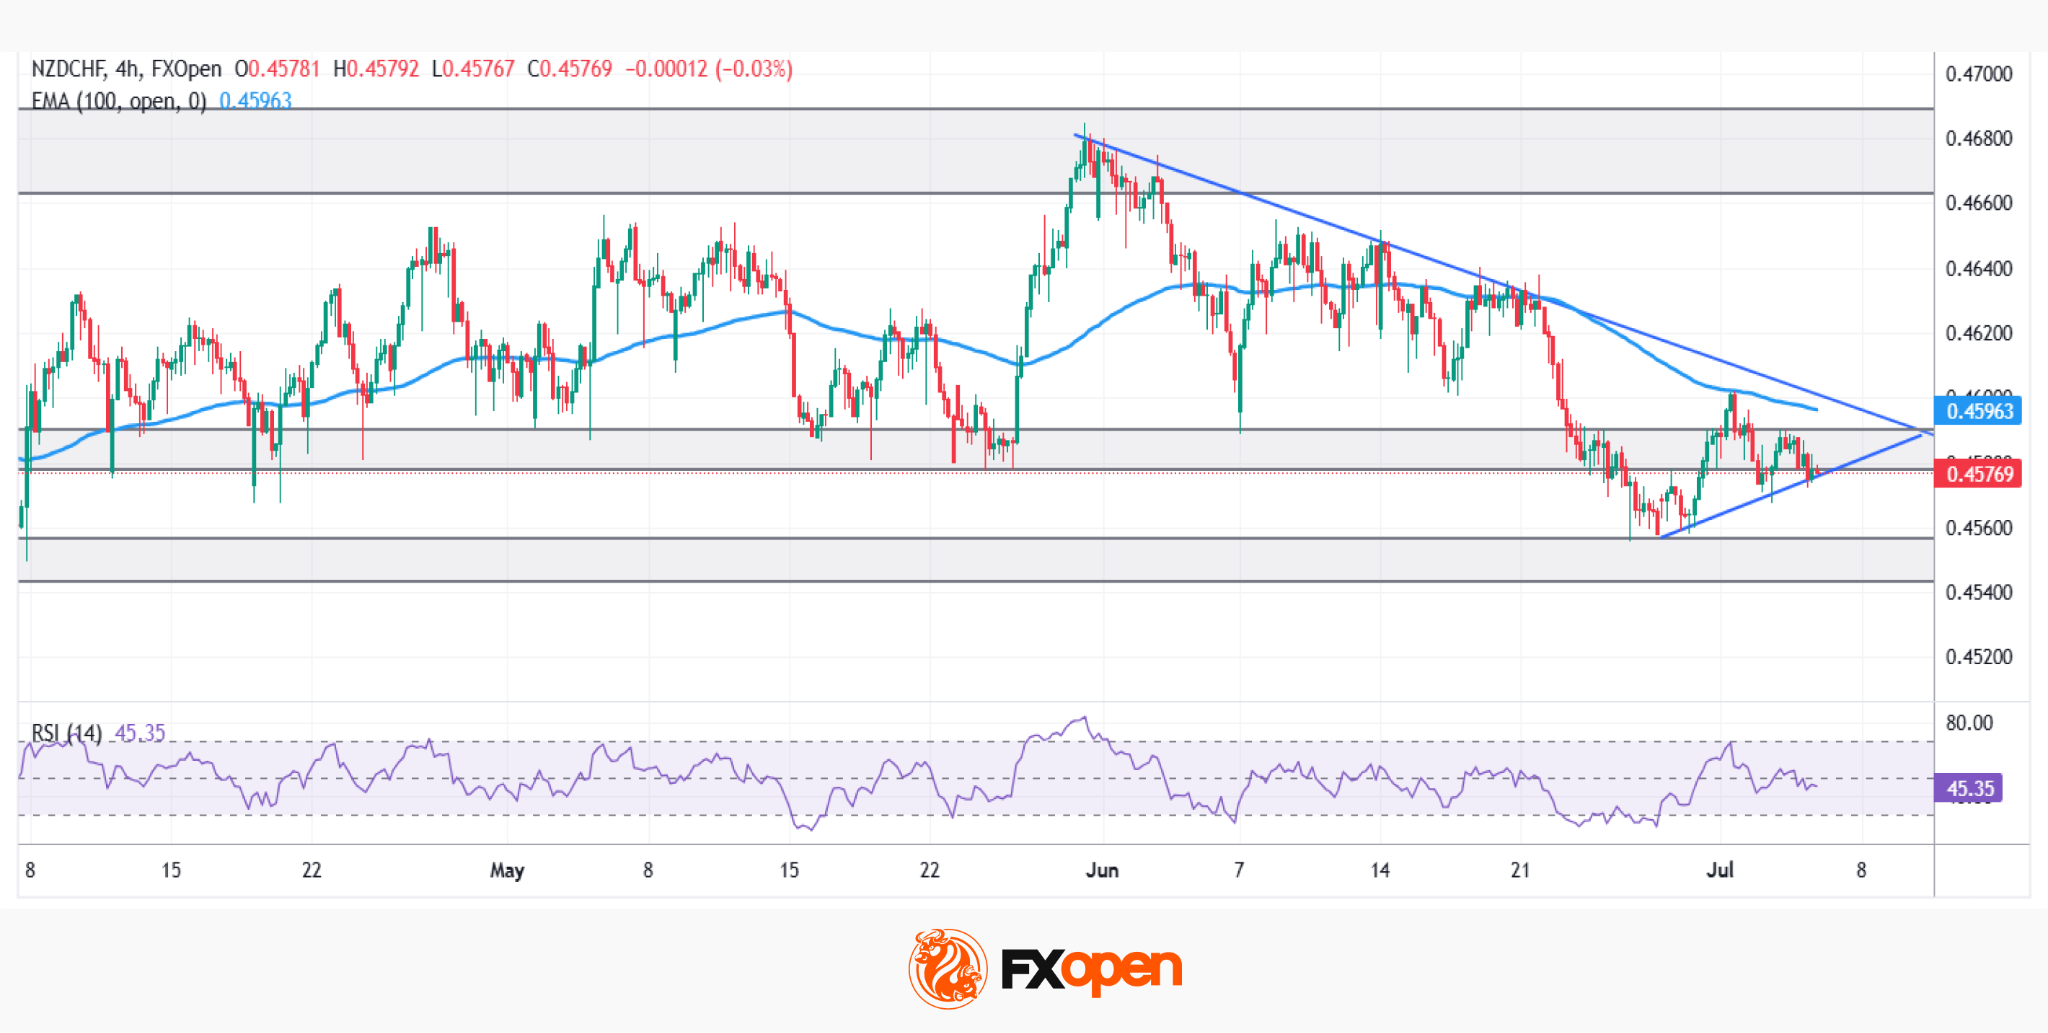
NZD/CHF remains locked in a tight range as traders await the next monetary policy catalyst.
The Reserve Bank of New Zealand heads into Wednesday’s meeting on shaky ground. After May’s 3-3 split was resolved by a casting vote, the committee still lifted its rate path sharply, eyeing a 3.28% terminal rate by 2029. But the oil slide following the US-Iran truce has cut hike odds from over 80% to around 66-70%, splitting major banks between a hold and a further move.
Meanwhile, the Swiss National Bank holds firm at 0% for a fourth straight meeting. Switzerland’s challenge mirrors New Zealand’s in reverse: subdued inflation rather than overheating, leaving little room—or need—for tightening. The franc’s strength stems more from so-called safe-haven flows than rate differentials.
The result: NZDCHF caught between short-term RBNZ uncertainty and near-static Swiss policy, with direction hinging on Wednesday’s decision.
Advertisement
Technical Analysis of NZD/CHF
NZD/CHF remains locked in a broader consolidation on higher timeframes, trapped between resistance at 0.4660-0.4690 and support at 0.4540-0.4560. Price is now compressing into a tighter triangle just below the 100-period EMA, which continues to cap upside as dynamic resistance.
Bullish Scenario
Fundamentally, a hawkish RBNZ surprise on Wednesday—hiking despite the oil-driven pullback in tightening expectations—would give the kiwi a strong tailwind. Technically, buyers first need to break the descending trendline capping price since late May, already rejected on several attempts. Once cleared, the decisive test becomes the 0.4660-0.4690 resistance zone. A genuine breakout would likely require both a strong NZD fundamental catalyst and confirming technical momentum.
Bearish Scenario
Conversely, a dovish hold—as several major banks now expect—could reignite downside pressure. Technically, sellers first need to break the ascending trendline price has leaned on in recent sessions, then push through the more significant 0.4540-0.4560 support. Notably, the 100-period EMA continues to act as reliable dynamic resistance, keeping price capped beneath it and reinforcing the bearish structure until proven otherwise.
Advertisement
Two central banks, two opposite stories: RBNZ still weighing when to tighten, SNB content to sit still. Wednesday’s decision could finally break this narrowing range — will the kiwi’s rate case win out, or does the franc’s quiet resilience hold firm?
Trade over 50 forex markets 24 hours a day with FXOpen. Take advantage of low commissions, deep liquidity, and spreads from 0.0 pips (additional fees may apply). Open your FXOpen account now or learn more about trading forex with FXOpen.
This article represents the opinion of the Companies operating under the FXOpen brand only. It is not to be construed as an offer, solicitation, or recommendation with respect to products and services provided by the Companies operating under the FXOpen brand, nor is it to be considered financial advice.
Bitcoin News: Dave Portnoy, founder of Barstool Sports, disclosed on Fox Business that he is sitting on millions in losses after buying Bitcoin near $100,000, and announced he will hold the position all the way to zero rather than sell again.
The declaration, made on Stuart Varney’s Varney & Co., crystallizes a behavioral pattern that has cost Portnoy heavily across multiple market cycles: buying near local highs, selling before rallies, and re-entering at higher prices.
DAVE PORTNOY: "I'M HOLDING BITCOIN TO ZERO" Barstool Sports founder Dave Portnoy says he is holding his Bitcoin no matter what. “I’ll hold this thing down to zero,” Portnoy told Fox Business. “I know if I sell it, it’s going to go nuclear again. I’d rather go down with the… pic.twitter.com/arGvhitqHT
BTC price peaked above $126,000 in October 2025 before halving to its current level around $62,870, according to CoinDesk data. Portnoy’s latest entry near the $100,000 level puts his unrealized loss at roughly 37% from cost basis, with the peak-to-trough drawdown from his buy point exceeding $60,000 per coin.
Portnoy did not soften the assessment when speaking to Fox Business host Stuart Varney. “Yeah, I got regrets. I bought the thing for $100,000. There’s nothing I’ve been wrong about more than Bitcoin. Every time I sell it, it goes nuclear. Every time I buy it, it tanks,” he said.
The self-diagnosis is unusually blunt for a public figure with a position still on the books.
Advertisement
“I’m holding. I’ll hold this thing down to zero. I know if I sell it, it’s going to go nuclear again. I’d rather go down with the ship this time.”
Photo: Dave Portnoy
The logic is behavioral rather than analytical: Portnoy is not making a valuation case for Bitcoin; he is reacting to a personal track record of selling before every major rally. His commitment to hold to zero is, in effect, a forced discipline imposed by demonstrated inability to time exits correctly.
Portnoy’s history with Bitcoin reads as a case study in retail FOMO compounding. He first entered in late 2020 with approximately $2 million at around $11,000, then sold almost immediately, a position that would have returned roughly 6x had he held through BTC’s early 2021 run to $60,000.
He subsequently rebuilt exposure at higher prices, with his peak Bitcoin position reportedly reaching around $15 million before market declines cut that substantially.
Advertisement
The latest cycle repeated the same dynamic at a higher dollar magnitude. Portnoy has publicly stated he exhausted most of his available cash, averaging down through the drawdown, and his BTC losses now run into the millions on an unrealized basis. His exact BTC holdings remain undisclosed.
Bitcoin (BTC)
24h7d30d1yAll time
The pattern, buy high, capitulate, re-enter higher, is precisely what distinguishes retail investors who underperform a simple buy-and-hold strategy across cycles.
Market timing failure at Portnoy’s scale illustrates the structural disadvantage most active traders face. Research consistently shows that retail investors who attempt to time entries and exits in volatile assets like Bitcoin generate returns well below passive holders over equivalent periods. The risks that accompany prominent Bitcoin holders who buy in size and then face sustained drawdowns are not unique to Portnoy, but his public commentary makes the behavioral traps unusually visible.
Bitcoin touched $63,882 overnight before retreating to around $62,900, per CoinDesk data. The 24-hour high of $63,900 held briefly before sellers pushed it back down.
Thursday’s U.S. jobs report came in weaker than expected, giving liquidity-sensitive assets a lift heading into the weekend.
A weakening jobs market makes a Fed hike less likely and gradually shifts the backdrop that pushed ETF investors out of bitcoin through June. That process takes time, and one print does not flip the setup. The July 14 CPI release is the next data point that could either extend the relief or further cap an early-July rally.
Summer Finance has become the latest decentralized finance protocol to suffer a major security incident. So far, $6 million has been drained in the ongoing exploit, according to blockchain security firm Blockaid.
However, the project has yet to release an official statement.
Flash Loan Attack
Pseudonymous crypto trader Crypto Jargon said the attacker borrowed the funds through a flash loan, manipulated liquidity across Curve’s DAI/USDC pools and Morpho, extracted about $6 million in profit, and repaid the loan within the same transaction. The trader said that flash loan attacks remain difficult to prevent and explained,
“The attacker doesn’t need to own the money they’re manipulating with; they borrow $65M for a few seconds, temporarily distort a price or liquidity ratio, extract the difference, and return the loan before the transaction even finalizes. If any single step reverts, the whole thing undoes itself, so they only ever risk gas fees.”
Phylax Systems founder Odysseas Lamtzidis also shared a technical analysis, suggesting that the exploit was caused by flaws in Summer Finance’s same-transaction vault accounting and liquidity assumptions, rather than compromised keys or abuse of admin privileges. He added that the attacker used an unverified contract to orchestrate the exploit, while the vulnerable protocol components themselves were verified.
Advertisement
2026 DeFi Losses
The incident comes amid a sharp rise in attacks targeting DeFi protocols this year. According to crypto market tracker CryptoRank, the sector has recorded 121 DeFi hacks in 2026, which resulted in almost $942 million in losses.
Most of this year’s attacks happened in the second quarter, when hackers carried out 85 exploits and stole around $775 million. CryptoRank found that DeFi’s total value locked (TVL) has declined every month this year after falling from about $115 billion in January to $70 billion by late June as investor confidence weakened.
While Q2 recorded the highest number of exploits, the firm said most losses stemmed from two major attacks in April. Drift Protocol and KelpDAO together lost about $590 million, which represented more than half of all DeFi losses this year.
TRM Labs and Chainalysis linked both attacks to North Korea-backed hacking groups. Their investigations found that the attackers used social engineering, compromised infrastructure, and manipulated cross-chain verification systems to carry out the large-scale thefts.
The broad US market index, the S&P 500, has entered July against a backdrop of mixed signals from the labour market. The Bureau of Labor Statistics report released on 2 July showed that just 57,000 jobs were added in June, well below market expectations, while the unemployment rate stood at 4.2%. Following the release, markets scaled back expectations of a Federal Reserve rate hike in September, although the possibility of an October increase remains. At the same time, the current 10% global tariff is due to expire at the end of July, and markets are gradually pricing in uncertainty surrounding future trade policy decisions.
Technical Outlook
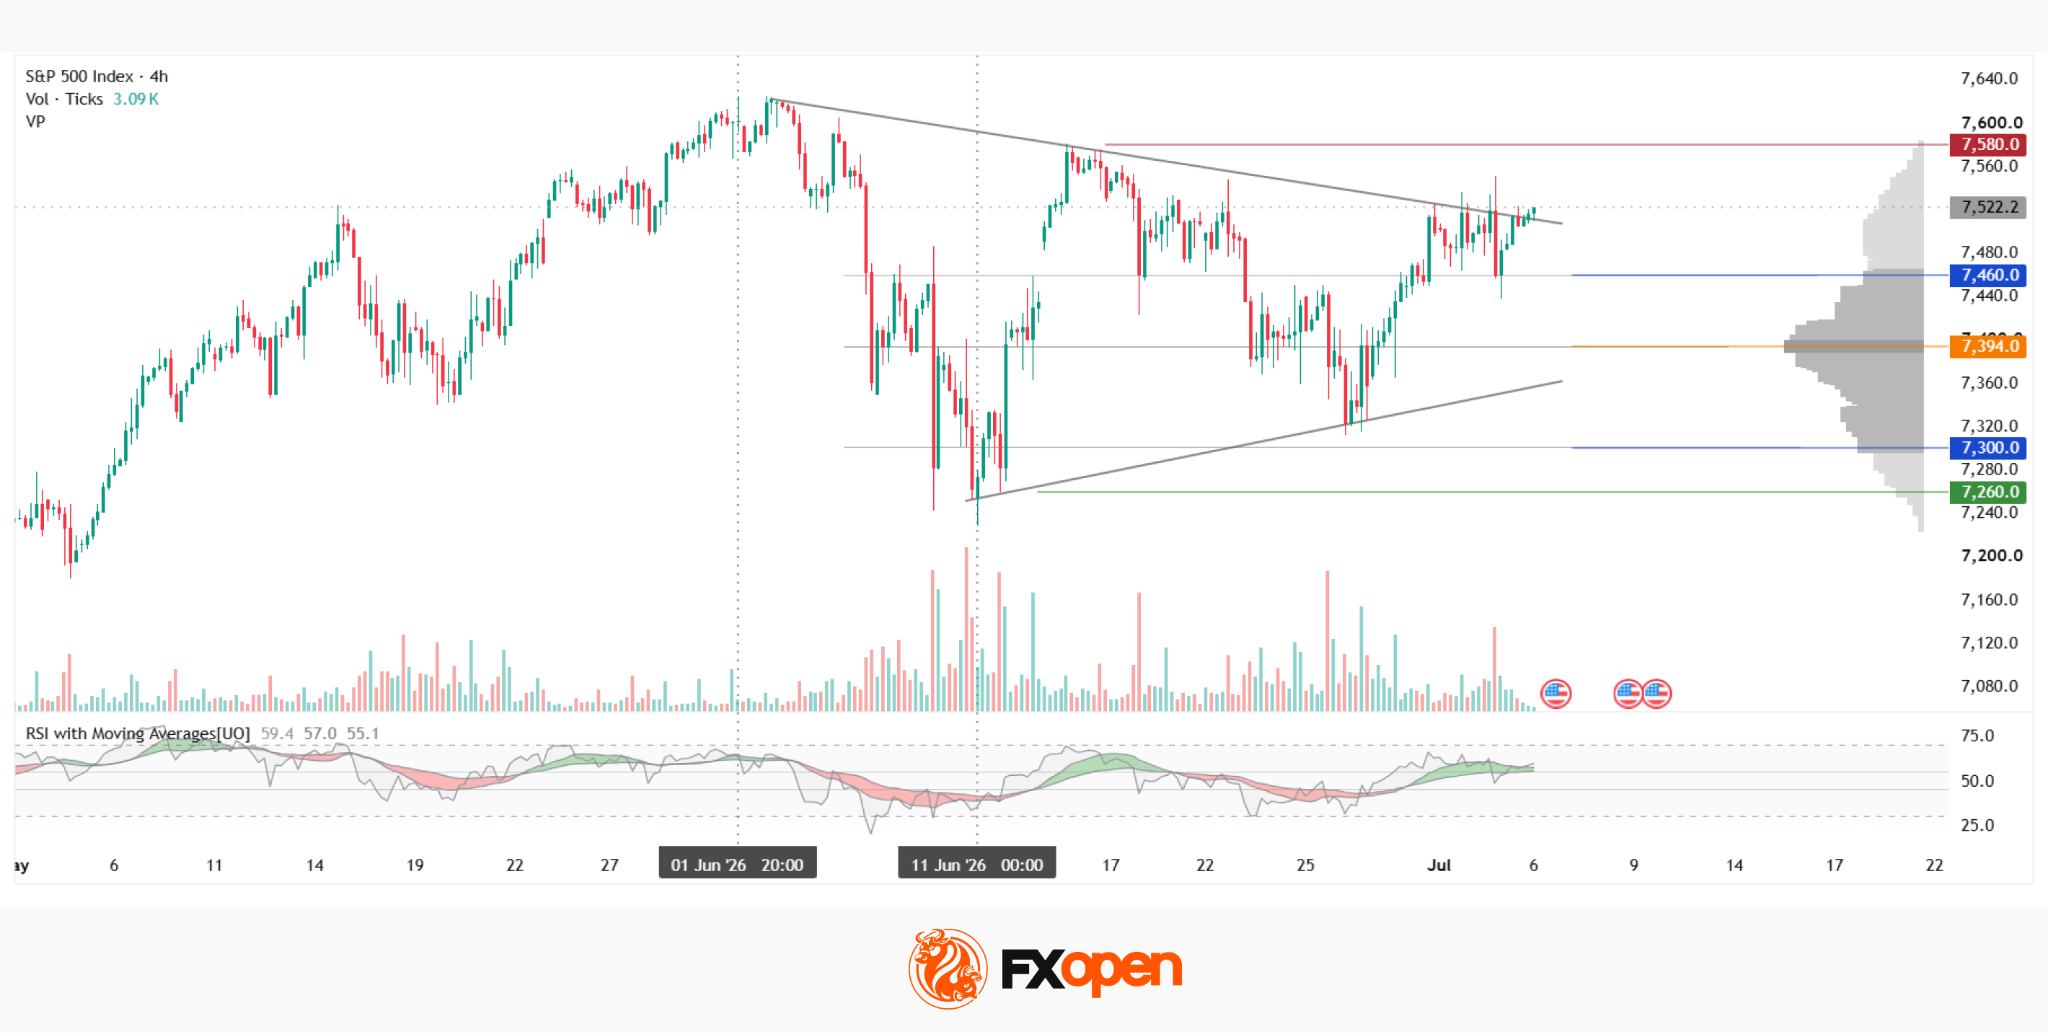
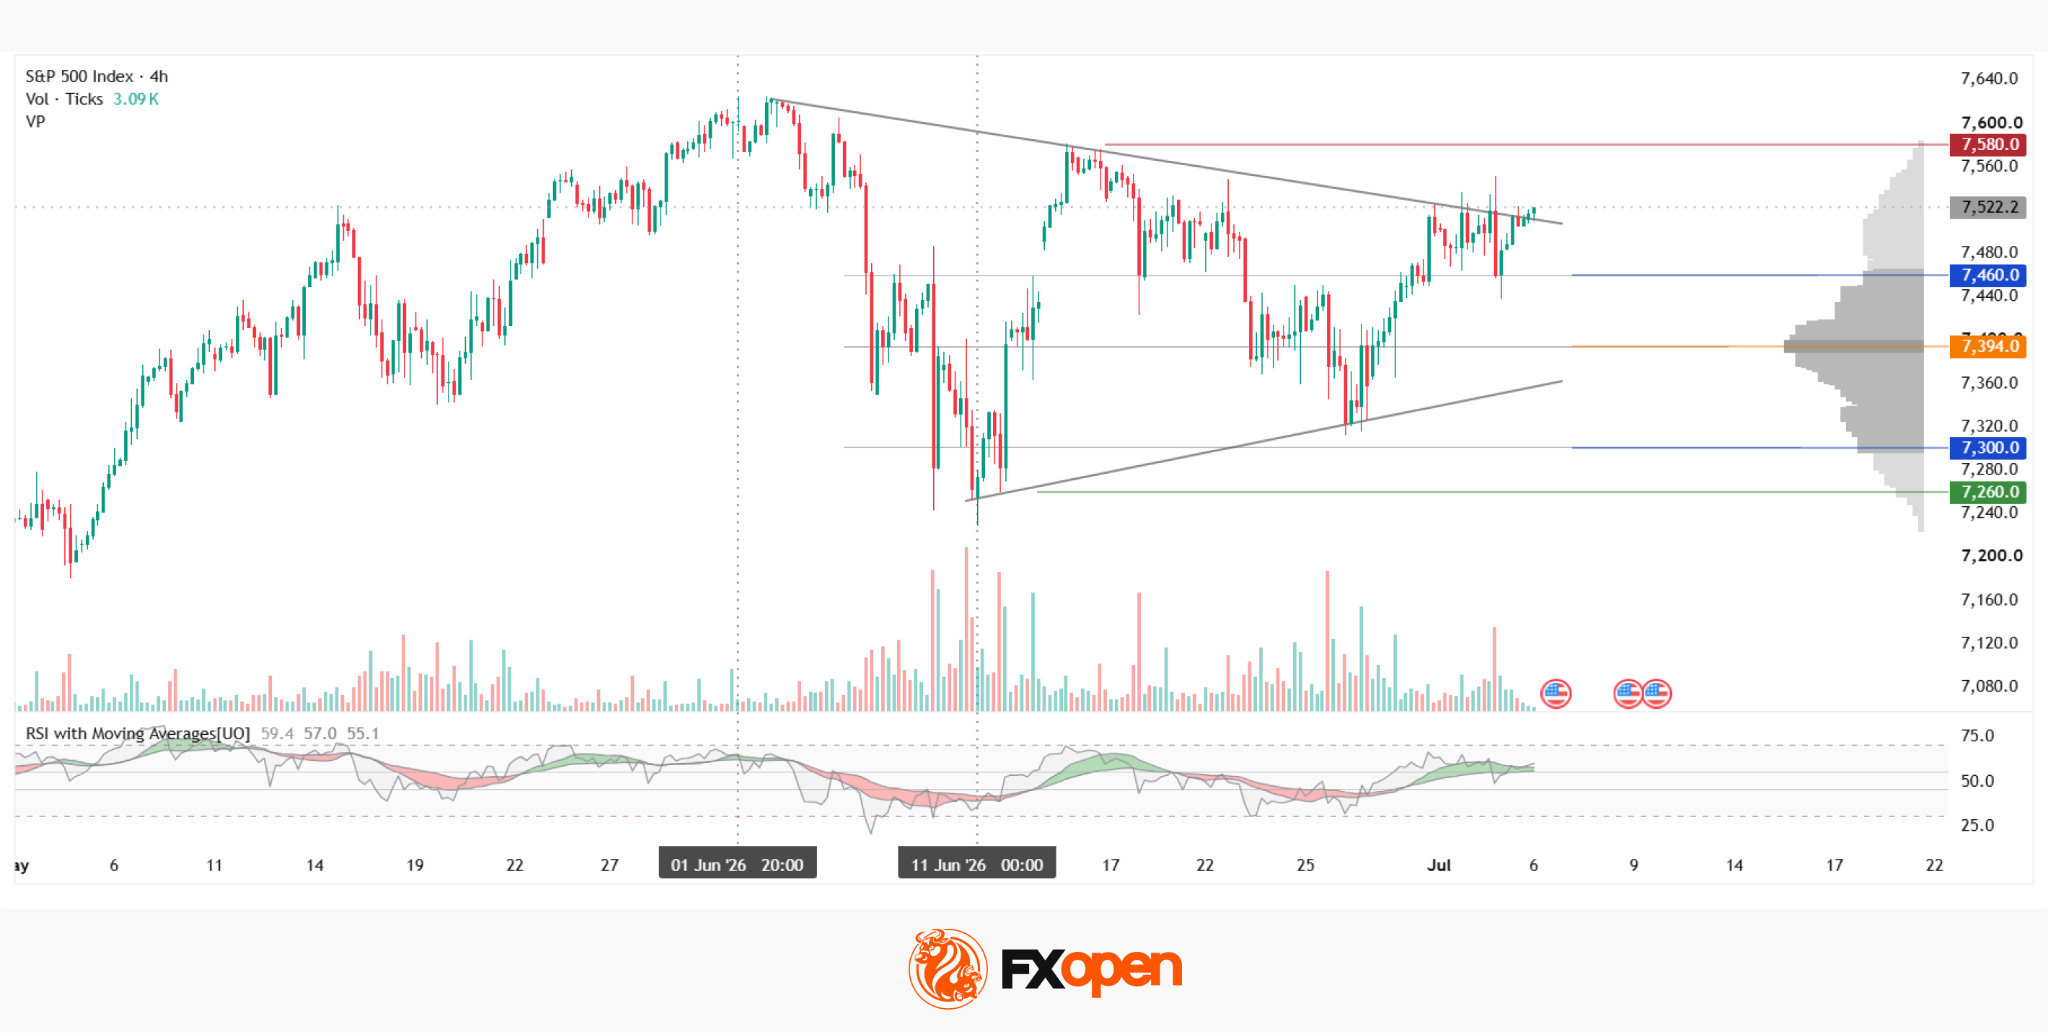
On the four-hour chart, the S&P 500 (SPXm on FXOpen) remains in a consolidation phase following the uptrend that began on 31 March. After peaking near 7,600, the index declined to around 7,250 before forming a symmetrical triangle, with the descending upper trendline and the ascending lower trendline gradually converging. Since the beginning of July, the price has remained above the upper boundary of the current market profile at 7,460, repeatedly testing the triangle’s descending trendline but failing to break above it. Resistance is located around 7,580.
The narrowing range has been accompanied by declining volume, with the latest wave of the triangle noticeably quieter than the previous one, a typical feature of a maturing consolidation pattern. The highest concentration of horizontal volume (POC) is located near 7,394, while the lower boundary of the current profile sits around 7,300. Should the index move lower, these areas could provide support before any attempt to break below the ascending side of the triangle and potentially reach the 7,260 support level. The RSI + MAs indicator currently reads 59, 57 and 55. Although all three values remain above the neutral zone, they do not yet indicate a clear directional bias.
Summary
The POC zone remains the key reference point if the rejection from the triangle boundary develops into a broader decline. Meanwhile, the RSI + MAs indicator continues to hold above neutral without showing a strong trend. Looking ahead, tariff-related uncertainty may become the more significant driver for the index over the coming weeks, as the expiry of the current 10% global tariff at the end of July could trigger a shift in market sentiment.
Trade global index CFDs with zero commission and tight spreads (additional fees may apply). Open your FXOpen account now or learn more about trading index CFDs with FXOpen.
Advertisement
This article represents the opinion of the Companies operating under the FXOpen brand only. It is not to be construed as an offer, solicitation, or recommendation with respect to products and services provided by the Companies operating under the FXOpen brand, nor is it to be considered financial advice.
Blockchain security firm Coinspect says a class of “recovery phrase” wallets may be vulnerable to draining due to the way some wallets generate their seed—specifically, the use of weaker-than-intended randomness during recovery phrase creation. The issue, which Coinspect calls “Ill Bloom,” has been tied to unauthorized fund movements on multiple networks and has already resulted in at least $5 million in drained cryptocurrency, the firm reported.
Coinspect linked the risk to certain software wallets that generate seed phrases using an insecure pseudorandom number generator. The firm says wallets created as far back as 2018 could be affected, and it has released a wallet-checking tool so users can assess whether their addresses appear potentially exposed.
Key takeaways
Coinspect reports the “Ill Bloom” risk is tied to weak randomness used when generating recovery phrases in some software wallets.
The affected wallet address scope spans Bitcoin, Ethereum, Polygon, Rootstock, Tron, and Solana, with unauthorized movement tied to wallets generated as early as 2018.
Coinspect says at least $5 million has been drained from exposed wallets since May 27, with an additional ~$2 million moved on Sunday (as reported by Coinspect).
Coinspect states evidence suggests hardware-wallet-generated seeds are not affected, while the strongest candidates are users of lesser-known mobile software wallets.
Coinspect is not publishing active-exploit details, but has released a tool for users to check whether their address is potentially exposed.
What Coinspect says is going wrong
In a disclosure published Sunday, Coinspect described “Ill Bloom” as an exploit path caused by weak randomness—an insecure pseudorandom number generator—used during recovery phrase generation on certain software wallets. In practical terms, if wallet seed generation doesn’t produce enough entropy as intended, attackers may be able to narrow the space of possible mnemonic phrases and systematically target wallets.
Coinspect said the issue may explain cases where funds were moved without permission. The firm also highlighted that the problem has been observed in wallets generated as early as 2018, and that the issue tends to show up more frequently in less prominent mobile software wallets rather than widely adopted products.
Networks involved and how much was stolen
Coinspect said it identified potentially exposed wallets across several networks: Bitcoin, Ethereum, Polygon, Rootstock, Tron, and Solana. In its reporting, the firm warned that the exploit may not be limited to those chains and addresses it has publicly analyzed.
Advertisement
According to Coinspect, data indicates that an attack starting May 27 compromised 431 wallets out of 2,114 vulnerable wallets. That activity resulted in total drained cryptocurrency of $3.1 million. Coinspect further stated that an additional $2 million was moved on Sunday from exposed wallets. While those numbers reflect the subset of wallets the firm analyzed, Coinspect cautioned that there may have been exploits on other networks and additional addresses—meaning the total number of affected wallets could be higher than its initial scope.
Coinspect also did not provide step-by-step information about the active exploit, stating that it is not publishing those details “at this stage.” Instead, it focused on helping users verify exposure and understand the underlying seed-generation weakness.
Hardware wallets vs. software wallets
One of the more consequential distinctions in Coinspect’s disclosure is who it believes is less likely to be affected. Coinspect said it has evidence suggesting that users who generated their seed with a hardware wallet are not impacted by the “Ill Bloom” risk.
Coinspect also argued that “most current software wallets” are likely not vulnerable. However, the strongest candidates, it said, are users who created seed phrases within less widely used mobile software wallets. That framing matters for day-to-day risk management: it suggests that the threat is not uniform across all software wallets, but rather tied to specific implementation choices around how entropy and pseudorandomness are produced during recovery phrase creation.
Advertisement
SlowMist, another security firm, also publicly acknowledged the alert on X on Monday, saying it was closely monitoring the issue reported by Coinspect.
A recurring vulnerability pattern in wallet security
“Ill Bloom” fits into a broader pattern that has appeared before in crypto wallet security: when the entropy or randomness behind seed generation is flawed, attackers can sometimes reduce the effective search space of possible recovery phrases.
In 2023, Ledger’s security team reported that wallet seeds generated using the Trust Wallet browser extension were vulnerable to brute-force attacks. Ledger said the issue came from limitations in how entropy was generated for new addresses, which reduced the total possible mnemonic combinations to roughly four billion—small enough that an attacker could attempt a search in under a day using only a few GPUs. Ledger also noted Trust Wallet patched the bug before funds were stolen.
The following year, another example highlighted by the wider security community involved Libbitcoin Explorer, where a vulnerability led to approximately $900,000 in crypto being stolen through private-key brute-forcing.
Advertisement
Coinspect’s disclosure underscores that even when theft doesn’t immediately occur, weak randomness in seed generation can create long-tail risk for users who created wallets years earlier, especially if those wallets were generated using the same flawed entropy logic.
What users can do now
Coinspect said it has released a wallet-checking tool so users can determine whether their address may be exposed. The immediate takeaway is that checking exposure may be more urgent than simply assuming a wallet is safe based on general brand reputation, since Coinspect’s analysis points to weaker randomness conditions in specific wallet implementations—particularly certain lesser-known mobile software wallets.
Users who notice unauthorized transactions should treat the situation as potentially related to seed-generation weakness, not just normal compromise or phishing. What remains uncertain is the full scale of exposure across all networks and addresses beyond Coinspect’s initial analysis, but the firm’s public tooling suggests that verification is the next practical step for holders.
Risk & affiliate notice: Crypto assets are volatile and capital is at risk. This article may contain affiliate links. Read full disclosure
But Ethereum now treats replacing every quantum-vulnerable part with a quantum-safe alternative as urgent, Buterin said, including a redesign of the cheap data storage that rollups, the layer-2 networks built on top of Ethereum, depend on.
Privacy has been raised to what Buterin called a ‘first-class goal’ rather than an afterthought. The plan calls for designing core network components so that private, intermediary-free transactions can pass through them by default.
The way the network checks itself is also changing. Instead of every node re-running every transaction, Ethereum plans to rely on recursive STARKs. This cryptographic proof method allows a node to verify a compact proof that the work was done correctly, rather than repeating it. That shift is meant to make the network faster and lighter to run.
As such, the change Buterin flagged as most disruptive is to what Ethereum calls state. State is a blockchain’s current memory, the complete snapshot of everything that exists on a network at a specific point in time.
Advertisement
Think of it as the running record of every account balance and all the data those contracts hold (such as who owns which NFT, how much is in a lending pool, every token ledger), as of the latest block.
This week is characterized by macroeconomic reports, which include the minutes from last month’s Federal Open Market Committee (FOMC) meeting, as well as economic data that may provide insights into the Federal Reserve’s next moves.
Crypto-linked equities are also in the news, with American Bitcoin (ABTC) dodging a Nasdaq delisting after a reverse split.
SpaceX, Elon Musk’s space transportation and AI company, joins the Nasdaq 100, becoming the fourth member of the tech-heavy index to hold bitcoin BTC$62,917.34. Index membership is likely to boost demand for the shares, partly because tracker funds need exposure to the company and partly because the stock is more likely to meet firms’ investment criteria.
Others include Tesla (TSLA), Strategy (MSTR) and Mercado Libre (MELI). The space exploration firm, which holds 18,712 BTC, is expected to have more weight in the index than the latter two.
Advertisement
Beyond that, geopolitical developments and the further collapse of the yen against the dollar are factors to keep an eye on. Bitcoin’s negative correlation to the yen’s exchange rate against the dollar has been unusually high, with BTC tending to rise when the yen weakens.
What to Watch
(All times ET)
Crypto
July 6: American Bitcoin (ABTC) to trade after 1-for-15 reverse stock split reduced total outstanding shares to about 73 million.
July 7: SpaceX (SPCX) to join the Nasdaq 100 index.
July 7: Berachain (BERA) to undergo its PoL Next upgrade.
Macro
July 06, 09:45 a.m.: U.S. S&P Global Services PMI Final for June est. 51.3 (Prev. 50.7)
July 06, 10:00 a.m.: U.S. ISM Services PMI for June (Prev. 54.5)
July 07, 11:00 a.m.: U.S. Consumer Inflation Expectations for June (Prev. 3.5%)
July 08, 02:00 p.m.: U.S. FOMC Minutes
July 08, 09:30 p.m.: China Consumer Price Index YoY for June (Prev. 1.2%)
July 09, 08:30 a.m.: U.S. Initial Jobless Claims for period ending July 04 (Prev. 215K)
July 09, 09:00 a.m.: U.S. Fed Williams Speech in a keynote discussion on “The Future of Market Liquidity and Functioning”
July 10, 08:30 a.m.: Canada Unemployment Rate for June (Prev. 6.6%)
Earnings
Token Events
Governance Votes & Calls
ENS DAO is voting on an executable proposal to renew its Security Council for a two-year term, deploy an updated contract with an extension function, and rotate one multisig signer. Voting ends on July 6.
Frax DAO is voting to allocate 42,000 wFRAX over six months to fund the EchoMarket Creator & Distribution Program. Voting ends on July 6.
Nexus Mutual DAO is voting on a proposal to approve a 12-month budget of 1,108,875 USDC and 6,930 wNXM for its active DAO teams to fund operations, marketing, product development, and risk management through July 2027. Voting ends on July 9.
Arbitrum DAO is voting on a proposal to establish the Fast Feed, a paid, low-latency data stream providing early access to sequenced transaction data on Arbitrum One. Voting ends on July 9.
Unlocks
July 6: Hyperliquid (HYPE) to unlock 0.2% of its circulating supply worth $30.39 million.
July 11: Rain (RAIN) to unlock 7.64% of its circulating supply worth $786.9 million.
July 12: PUMP$0.001611 to unlock 29.12% of its circulating supply worth $130.2 million.
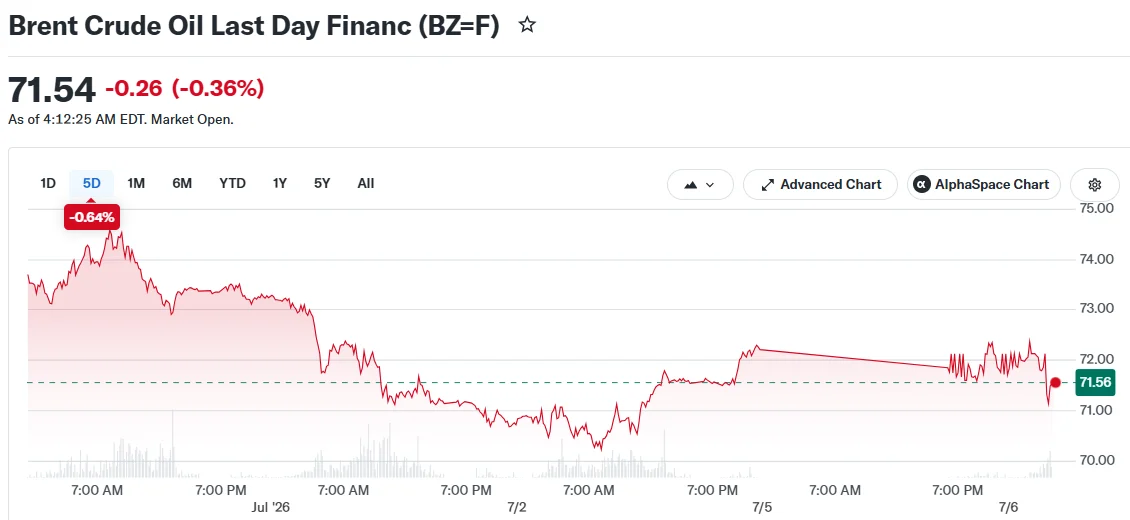
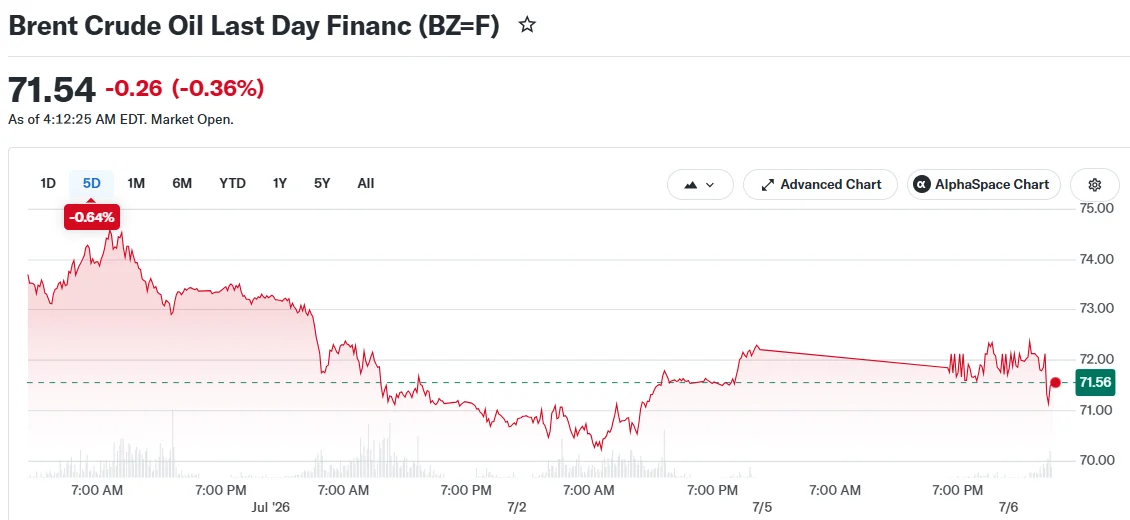
Brent crude decreased more than 1% to reach $71.10 per barrel on Monday
OPEC+ members decided to increase production by 188,000 barrels daily starting in August
Strait of Hormuz shipping traffic is normalizing following the interim US-Iran peace agreement
Analysts project global oil demand will decline by 1.5 million barrels per day in 2026
Citigroup analysts warn Brent could drop to $60 per barrel before year-end
Crude oil markets experienced downward pressure Monday following OPEC+’s decision to expand production and the continued normalization of tanker traffic through a critical Middle Eastern shipping route.
Brent crude declined $1.02, representing a 1.41% drop, settling at $71.10 per barrel. US West Texas Intermediate fell 80 cents to close at $67.89. Both major benchmarks have faced sustained downward momentum over recent weeks.
Brent Crude Oil Last Day Financ (BZ=F)
The OPEC+ coalition, spearheaded by Saudi Arabia and Russia, reached an agreement Sunday to expand collective production quotas by 188,000 barrels daily beginning in August. This move follows comparable production increases already scheduled for June and July.
The alliance has been systematically unwinding the production cuts implemented in earlier years. Seven prominent member countries supported the most recent output expansion.
Hormuz Shipping Slowly Coming Back Online
The Strait of Hormuz experienced a complete halt in tanker operations during the US-Israeli military conflict with Iran. This disruption effectively limited actual production from critical exporters such as Saudi Arabia, Kuwait, and Iraq, rendering significant portions of the OPEC+ production increases theoretical rather than practical.
🚨OPEC+ TO PUMP MORE OIL AS PRICES RETURN TO PRE-WAR LEVELS
OPEC+ will raise output by another 188,000 barrels per day from August, continuing monthly hikes as the Strait of Hormuz gradually reopens, per Reuters.
Petroleum and liquefied natural gas transportation through a US-secured passage in the strategic waterway demonstrated signs of recovery on Sunday. The previous day witnessed several vessels making unexplained course reversals within the corridor before ultimately continuing their intended routes.
Gulf region oil shipments in June surged by more than 3 million barrels compared to May, surpassing 10 million barrels daily. Despite this improvement, current volumes remain 40% beneath pre-conflict levels.
Advertisement
Brent crude experienced a dramatic 30% collapse during the second quarter after Washington and Tehran finalized an interim peace agreement, enabling a phased restoration of Hormuz shipping operations.
Supply Climbing as Demand Falls
ANZ Bank currently forecasts global oil demand will shrink by 1.5 million barrels daily in 2026. Year-over-year decreases could potentially reach 4 million barrels per day during the second quarter according to preliminary figures.
PVM market analysts observed that producers are “selling into a falling market, offering little hope of an imminent price recovery.”
Abu Dhabi National Oil Company has liquidated approximately 16 million barrels of crude through expanded discounts in spot market auctions since June, signaling a substantial increase in available inventory.
Advertisement
Russian western port crude shipments reached unprecedented levels in June and are projected to maintain that pace through July. Ukrainian drone attacks targeting Russian refineries have compelled Moscow to export greater volumes of unprocessed crude rather than refining it domestically.
Market structure indicators are also shifting bearish. Timespreads for both Brent and Dubai have transitioned into contango conditions, where near-term contracts trade at discounts relative to deferred contracts. Numerous physical crude varieties are also selling below benchmark reference prices.
Citigroup has identified the potential for Brent to decline to $60 per barrel by year-end should current supply expansion and demand weakness trends persist.
Summer.fi has reportedly been exploited, with roughly $6 million drained so far. Blockaid flagged the exploit in a post on X on Monday.
The security firm published the attacker’s address, the exploit contract, and the affected Lazy Summer contracts.
DeFi Protocol Summer.fi Reportedly Loses $6 Million in Active Exploit
Blockaid said its detection system surfaced the incident on Monday morning, estimating about $6 million in losses at that stage. The firm highlighted the on-chain addresses associated with the attack.
Security firm PeckShield identified the main affected vault as LazyVault_LowerRisk_USDC (LVUSDC), which Block Analitica risk-manages. The firm said that the vault’s displayed APY briefly spiked to about 2.08 million %.
“The largest current holder is 0x8741e8f…4130, which appears to be associated with Torben Jorgensen (UDHC), and has deposited ~8.6M USDC into this vault,” the post read.
Summer.fi, formerly Oasis.app, is the front-end for the Lazy Summer Protocol, an onchain vault system that automatically routes deposits across DeFi yield sources like Aave and Morpho.
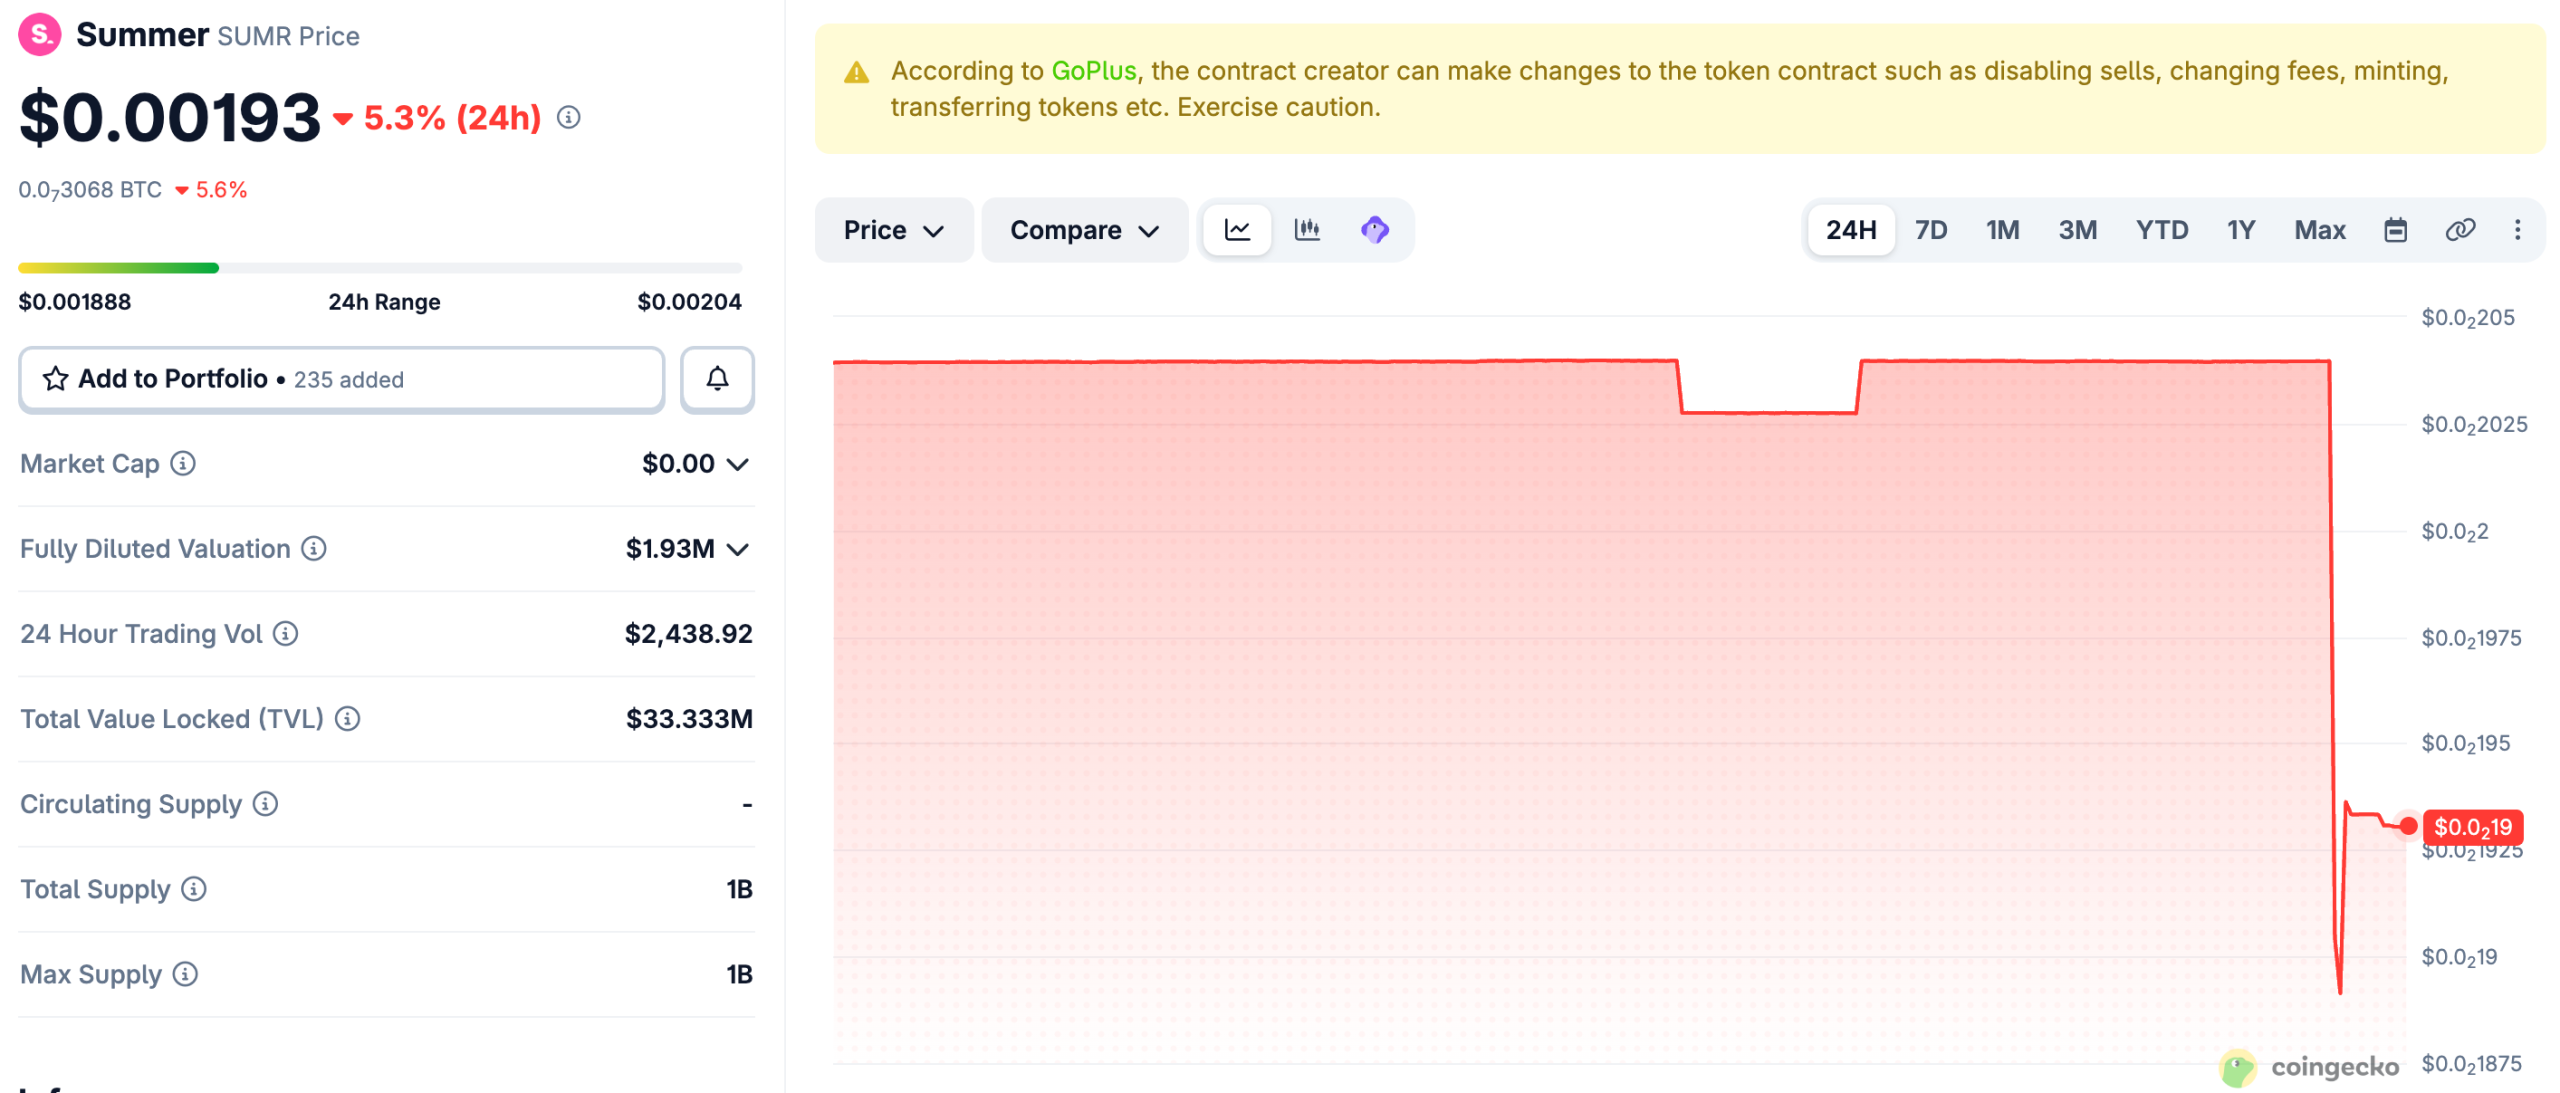
The network’s native token SUMR traded near $0.00193, down 5.3% over 24 hours. The move diverged from the broader market, which rose more than 1% on the day.
SUMR Token Price Performance. Source: CoinGecko







 DAVE PORTNOY: "I'M HOLDING BITCOIN TO ZERO"












 Fashion3 days ago
 Politics3 days ago
 Crypto World6 days ago
 News Videos6 days ago
 Tech6 days ago
 Business6 days ago

 Sports5 days ago

 Crypto World4 days ago
 NewsBeat5 days ago
 Crypto World4 days ago

 Crypto World19 hours ago
 Tech22 hours ago
 Business4 days ago
 Business3 days ago
 Crypto World3 days ago
 Crypto World3 days ago
You must be logged in to post a comment Login