
Crypto World
Tenev Says Robinhood Stock Tokens Should Not Automatically Require Issuer Consent



Robinhood CEO Vlad Tenev argued that its stock tokens should not automatically require the underlying company's consent, while acknowledging that token holders do not receive voting rights in that company. The comments, made in a CNBC “Squawk Box” interview on Wednesday, Sept. 9, clarify the… Read the full story at The Defiant



An attacker exploited a flaw in email platform Brevo’s login system to access 138 client accounts, enabling a phishing email to reach roughly 347,000 Trezor newsletter subscribers and similar fraudulent messages to be distributed through accounts belonging to hardware wallet maker BitBox and crypto portfolio tracking and tax-reporting platform CoinTracking.
In a Thursday postmortem, Brevo said six accounts were used to send phishing emails, contacts were exported from 43 and 93 accounts showed no meaningful activity. The platform did not specify whether the categories overlapped.
The attacker created a Brevo account, enabled single sign-on and invited legitimate Brevo users into the configuration. Brevo said access should have been confined to that organization, but an authorization boundary failed and granted access to every organization the invited users could reach.
The disclosure expands on warnings issued by Trezor and BitBox on Wednesday, identifying their shared provider and explaining why the emails passed normal authentication checks and appeared genuine.
Cointelegraph reached out to Brevo for more information but did not receive a response before publication.
Crypto firms assess potential subscriber exposure
In a blog post, Trezor said the phishing message, titled “Critical Security Alert: STM32 Entropy Vulnerability,” contained a link to an app that requested users’ wallet backups. The company disabled the domain at the DNS level within 20 minutes, but about 2,500 people accessed the link before the takedown.
A Trezor spokesperson told Cointelegraph that “the initial email was sent to 347,000 customers,” all of whom were subsequently contacted about the risk. The company’s Brevo account stored only opt-in newsletter email addresses and no other customer data.
“Until we hear more from Brevo, we are treating all roughly 347,000 newsletter addresses as known to the attacker and possibly reusable for phishing,” the spokesperson said.
Related: Liquid Network resumes block production after $320M exploit
A BitBox spokesperson told Cointelegraph that its unauthorized email was sent through Brevo and appeared to have reached its full newsletter and tutorial list.
BitBox said Brevo held only email addresses and language preferences. It found no evidence of compromised company credentials, downloaded contacts, lost funds or disclosed recovery phrases, but is treating the list as potentially accessed while awaiting Brevo’s logs.
Meanwhile, CoinTracking said its Brevo account distributed an email titled “Data Breach Notice: Please refresh API Keys as soon as possible.” It warned recipients not to follow the email’s links.

US-listed spot Bitcoin exchange-traded funds (ETFs) saw another day of redemptions on Wednesday, with total net outflows of $120.2 million, according to Farside Investors data. This follows Tuesday’s $46.6 million outflow, bringing withdrawals across the first two sessions of the holiday-shortened week to $166.8 million.
The pullback largely came from ARK 21Shares’ Bitcoin ETF (ARKB), which led Wednesday’s withdrawals with $78 million. Grayscale’s Bitcoin Trust ETF (GBTC) followed with $27.2 million in net outflows and BlackRock’s iShares Bitcoin Trust ETF (IBIT) recorded $19.5 million in withdrawals. The only Bitcoin ETF to post inflows on the day was Morgan Stanley’s Bitcoin Trust (MSBT), which added $4.5 million.
Key takeaways
- Bitcoin spot ETFs recorded $120.2 million in net outflows on Wednesday, extending the week’s two-session total withdrawals to $166.8 million.
- ARKB was the dominant source of outflows, pulling $78 million on Wednesday, while GBTC and IBIT together accounted for an additional $46.7 million.
- Ether spot ETFs bounced back with $34.7 million in net inflows on Wednesday after Tuesday’s outflows.
- Solana spot ETFs reversed Tuesday’s outflow, attracting $11.2 million on Wednesday, with inflows concentrated in Bitwise’s BSOL.
Bitcoin ETFs unwind after a strong run
Wednesday’s outflows capped a brief shift in investor positioning after the funds’ recent momentum. Tuesday’s $46.6 million outflow marked the category’s first back-to-back net redemptions since a three-day outflow streak ended on Aug. 14, according to the figures cited.
Looking at the two-day window, GBTC accounted for the largest share of losses, with $92.7 million in net outflows over Tuesday and Wednesday. ARKB and IBIT recorded net redemptions of $69.9 million and $8.8 million, respectively, during the same period.
Despite the pullback, the wider context still matters for assessing whether the outflows are a reversal or a pause. The two-session decline erased roughly 4.4% of the $3.8 billion attracted during what Farside Investors data described as the funds’ strongest three-week stretch of 2026.
Since launch, Bitcoin ETFs have accumulated about $55 billion in cumulative net inflows, while combined net flows for 2026 stand at about $1.07 billion in outflows, based on Farside Investors’ reporting. The contrast highlights why even large day-to-day movements are best interpreted against long-running accumulation and the year-to-date flow profile.
Where Wednesday’s outflows came from
ETF-by-ETF flows show a clear pattern: the majority of Wednesday’s withdrawals were concentrated in a small group of funds. ARKB’s $78 million outflow was more than half of the day’s total, and the remaining majority gap was covered by GBTC and IBIT.
MSBT was the exception, adding $4.5 million to offset only a fraction of the net redemptions across the category. For traders and portfolio managers, that kind of split can signal short-term reallocations within the ETF complex rather than uniformly negative sentiment across all access points.
Wednesday’s data also followed Tuesday’s broader category outflow. Together, Tuesday and Wednesday produced $166.8 million in net withdrawals across the week’s first two sessions—an important checkpoint when evaluating whether the prior inflow streak has fully run out or whether investors are simply pacing their allocations during the holiday-shortened calendar.
Ether ETFs regain inflows; Solana flips to net buying
While Bitcoin ETFs pulled back, US spot Ether ETFs returned to net inflows on Wednesday. Ether ETFs attracted $34.7 million on the day after recording $24.3 million in withdrawals on Tuesday, leaving the group with $10.4 million in net inflows for the week.
BlackRock’s ETHB led inflows with $22.9 million, followed by ETHA with $9.7 million. The 21Shares TETH fund added $2.1 million, and the remaining Ether ETFs recorded no net flows.
Solana ETFs also reversed Tuesday’s outflow dynamic. After Tuesday’s withdrawals of about $700,000, the funds attracted $11.2 million on Wednesday. That brought their combined two-session total to $10.5 million in net inflows, with all Wednesday inflows going to Bitwise’s BSOL.
Not every Solana-related product participated in the broader rebound, however. Hyperliquid ETFs recorded net outflows for a second consecutive session, losing $5.3 million on Wednesday after $13 million in Tuesday outflows. Those redemptions pushed the week’s total outflow for Hyperliquid ETFs to $18.3 million.
Price backdrop: crypto trades modestly lower as ETF flows diverge
The mixed ETF results arrived while spot crypto prices were slightly down versus the earlier timeframe referenced in the report. Bitcoin traded near $78,000 on Thursday, down from roughly $79,700 when the earlier three-week inflow figures were reported. Ether was around $2,470 and Solana hovered near $101, according to CoinGecko.
This combination—ETF outflows for Bitcoin paired with renewed inflows for Ether and Solana—reinforces that investor behavior is not moving in a single direction across the market. For readers monitoring fund flows as a sentiment barometer, the key is to track whether Wednesday’s withdrawals represent a one-off repositioning or the start of a more sustained trend.
As trading continues through the remainder of the week, the next sign to watch is whether Bitcoin ETFs can stabilize after two consecutive outflow days, and whether Ether’s Wednesday inflow follow-through persists into subsequent sessions alongside Solana’s rebound.


Dee Goens has taken over as chief executive of Zora, replacing co-founder Jacob Horne, who is leaving the company after more than six years, Goens said in a post on Wednesday. Goens, also a co-founder, inherits a company that has cut itself to fewer than 10 people and rebuilt its product around… Read the full story at The Defiant

The UK’s House of Lords has backed a push for a clearer government roadmap on digital assets, approving an amendment to require the Treasury to produce and consult on a formal strategy. The measure passed on Wednesday in a 194–138 vote, despite opposition from the Labour government.
The amendment was inserted during the Report Stage of the Financial Services and Markets Bill as it continues through Parliament. If the change survives further scrutiny in the House of Commons, it would set a timeline for policy work that currently relies largely on the government’s existing approach to digital assets.
Key takeaways
- The House of Lords approved an amendment (88) requiring the Treasury to publish and consult on a digital asset strategy within 12 months of the bill becoming law.
- The proposed strategy would cover cryptoassets, stablecoins, and tokenized securities, and is meant to address both innovation and consumer protection.
- The vote highlights ongoing UK political disagreement over whether current policy is sufficient or whether a statutory, cohesive framework is needed.
- The bill still returns to the House of Commons, where MPs can accept, modify, or reject the Lords’ changes.
What the Lords voted for
The amendment in question is Amendment 88, introduced by Conservative peer Baroness Neville-Rolfe. It would oblige the Treasury to prepare a digital asset strategy, publish it, and run a consultation process within 12 months after the Financial Services and Markets Bill becomes law.
According to the amendment’s scope as described in the Parliamentary material, the strategy would extend across multiple parts of the token economy: cryptoassets broadly, stablecoins, and tokenized securities. It is also intended to address practical questions firms face in the real economy—such as access to banking, payment, and settlement services—alongside broader regulatory themes like consumer protection.
That combination matters for market participants because policy clarity can shape everything from product design to compliance planning. A strategy framed not only around token issuance and trading, but also around payment rails and settlement access, points to regulators grappling with how digital assets fit into existing financial infrastructure.
Why the amendment became a flashpoint
The Lords’ vote follows months of discussion in the UK Parliament about how to handle digital assets and whether the government should move beyond its existing framework. In an earlier July debate on the bill, the Treasury’s Minister for Investment, Lord Stockwood, pushed back against calls for a statutory scheme. He said the government believed it already had a digital asset strategy and was executing it.
Labour opposed the amendment, according to the bill debate record and reporting of the vote, arguing it did not sufficiently reflect the pace of development in digital assets and the need for a more unified regulatory structure.
The tension here is essentially about framing and certainty. Supporters of the amendment want a strategy with a defined legal requirement and a clear consultation process. Critics argue the government already has a plan in motion, and that codifying additional requirements could lag behind fast-moving market changes. The result is not just a procedural amendment—it’s a debate about how the UK should balance responsiveness with rule-making clarity.
Industry reaction and the “strategy vs. ecosystem” question
One of the clearer signals from the crypto industry came from the UK Cryptoasset Business Council (UKCBC), which said it worked with lawmakers on the amendment. The group welcomed the Lords’ vote on Thursday, emphasizing a question raised by Lord Chris Holmes: whether the UK is “simply regulating digital assets” or “building a digital assets economy.”
That distinction is more than rhetorical. If policy is perceived as purely compliance-driven, firms may focus on defensive legal positioning. If it is seen as ecosystem-building—covering access to banking and payments, along with consumer protections—participants may be more willing to invest in longer-term product development and institutional partnerships.
The Lords’ amendment explicitly references those operational concerns, which may explain why industry groups viewed the vote as a step toward a broader policy posture rather than a narrow rule update.
Next steps: Commons vote will determine whether it becomes law
The bill has not reached final approval. The Financial Services and Markets Bill must still return to the House of Commons, where MPs may accept the Lords’ changes, amend them further, or reject them altogether.
For investors, traders, and builders, the near-term watch item is whether the Commons chooses to keep the 12-month requirement and the consultation mandate intact. Even if the amendment survives, the content of the eventual strategy—especially how it addresses stablecoins, tokenized securities, and firms’ access to banking and settlement—will likely be the real determinant of how quickly the UK’s regulatory approach becomes operational.
As Parliament moves forward, the key uncertainty remains whether lawmakers align on the level of statutory certainty they want versus the flexibility the government says it already has. The outcome of the Commons vote will reveal how much momentum the Lords’ digital asset strategy push gains—and how soon market participants can expect a more concrete policy roadmap.

XRP’s weekly Super Trend indicator flipped bullish on August 17, after the token rallied about 70% from $0.98 to $1.70.
The catch, according to analyst ChartNerd, is that this exact signal has marked local tops before deep pullbacks in every previous cycle going back to 2019, and XRP is already stalling at the resistance level that decided those earlier setups.
XRP’s Bullish Signal Meets Resistance
ChartNerd’s analysis centers on what happened after XRP hit roughly $0.98 and then recovered. The token moved about 70% toward $1.70, where it ran into the 50-week EMA, currently around $1.52. At the same time, the token has been trading between that resistance and the 20-week EMA near $1.29 to $1.30.
“Whilst beneath the 50 and above the 20, we’re simply compressing,” ChartNerd said, describing the recent price action as a period of chop while traders wait for a clearer direction.
That caution comes from XRP’s earlier cycle history. In 2022, it rallied about 90% from its cycle low before a bullish Super Trend flip appeared around the 50-week EMA. The move was followed by a 45% correction.
In 2019, another bullish flip during the bear market was followed by a 56% correction, and after the 2020 cycle low, XRP also printed a bullish flip before falling 32%.
ChartNerd argues this pattern has appeared often enough to warrant caution. “Bullish super trends usually mark local tops,” the analyst said, while stressing that historical behavior does not guarantee the same outcome this time.
He also placed a greater structural change around $1.90, noting that XRP would need to clear the $1.50 to $1.90 zone before the move toward its previous high looks more convincing.
A short-term push above $1.52 is still possible, the analyst said. But even a close above the 50-week EMA would not automatically remove the historical warning.
Price Has Stayed Choppy This Week
As CryptoPotato reported earlier, XRP dipped toward $1.39 during one leg of Bitcoin’s recent slide before buyers stepped back in to push it to $1.44.
At the time of writing, it had gone back down close to 4% in the last 24 hours and was again trading near $1.38, according to CoinGecko. It is up 1.5% over the past week but down more than 53% from a year ago, and it also remains about 62% below its all-time high of $3.65 from July 2025.
Bitcoin has been chopping between $77,600 and $80,000 over the past few days, and XRP’s swings have largely tracked that back and forth rather than moving on their own.
The Ripple token’s futures volume also picked up in August, with trading across the three biggest exchanges topping $64 billion, the busiest month in half a year.
Spot XRP ETFs kept adding money too, although the pace slowed a lot, with weekly inflows dropping to just under $19 million last week after bringing in more than $110 million the week before. So far this week, SoSoValue data shows net inflows have hit about $13.83 million.
The post XRP Faces Key Test as Historical Pattern Points to Possible Pullback appeared first on CryptoPotato.

A coalition of European market infrastructure and tokenization groups is urging EU lawmakers to rethink a proposed cap on tokenized financial instruments, arguing that the current ceiling is too low for Europe to scale blockchain-based trading and settlement.
In a draft letter dated Sept. 7 and addressed to EU Council members and the European Parliament’s Economic and Monetary Affairs Committee, the signatories ask that a proposed limit of 100 billion euros be either removed or lifted to at least 500 billion euros if lawmakers decide to keep any cap at all.
Key takeaways
- A Sept. 7 industry letter calls the EU’s proposed 100 billion euro cap on tokenized financial instruments “insufficient” for scaling.
- The coalition proposes 500 billion euros as a baseline threshold if a cap remains.
- Signatories argue the EU limit is tied to market value of instruments admitted to DLT infrastructure, which they say makes it small versus global equity markets.
- The letter points to differences with the US approach, where it claims tokenization can proceed without comparable volume caps.
- The push follows earlier EU industry campaigns in February and April aimed at expanding the DLT Pilot Regime’s scope and thresholds.
Why the coalition is targeting the 100 billion euro threshold
The letter—available via industry site ADAN—states that some existing European tokenized-finance initiatives already reach a scale of roughly 350 billion euros and are planning further growth. Against that backdrop, the coalition says the European Commission’s proposed 100 billion euro ceiling would constrain development during a period when tokenized markets are still trying to find liquidity, operational scale, and investor reach.
Rather than focusing on trading activity, the letter highlights that the regime’s thresholds are applied to the market value of financial instruments admitted to DLT infrastructure. The groups argue that, in practice, this design makes the proposed 100 billion euro figure look relatively small when compared with the size of global equity markets.
Among the signatories are Nasdaq, Boerse Stuttgart Group, Securitize, the European Ethereum Institute, and Axiology. The groups frame the request as a practical issue for regulated tokenization, not a theoretical policy debate about whether digital securities should exist.
Reference points: Europe’s DLT Pilot Regime vs. US tokenization capacity
One of the letter’s central comparisons is with the United States. The signatories claim that in the US, “a dominant settlement platform is enabled to tokenise US equities and other assets without volume caps,” adding that such a structure could support tokenization exposure on the order of 150 trillion euros in assets.
While the EU coalition’s statement is written as an argument for policy adjustment, it is also a signal about where scaling pressure is heading. If European rules impose tighter quantitative limits than US arrangements, tokenized issuance, settlement, or liquidity development may be more attractive elsewhere—especially for institutions that want to operate across jurisdictions using consistent infrastructures.
The coalition also notes that the EU Commission’s broader revision effort is part of its Market Integration and Supervision Package. That package includes changes to the Distributed Ledger Technology (DLT) Pilot Regime—an EU framework designed to let regulated firms test blockchain-based trading and settlement under exemptions from certain financial rules.
What the EU regime currently allows—and what’s proposed
The DLT Pilot Regime, according to ESMA, took effect in 2023. It enables financial firms to trial blockchain settlement for assets including stocks and bonds under specific conditions, with regulatory exemptions meant to reduce friction while authorities observe how onchain systems perform.
Under the Commission proposal referenced in the industry letter, the regime’s current 6 billion euro limit could rise to as much as 100 billion euros. The coalition argues that any meaningful scaling step should correspond better to market reality—especially if the limit is assessed based on admitted instrument market value rather than transaction volume.
In its Sept. 7 draft letter, the industry group suggests that lawmakers should adopt 500 billion euros as an interim “baseline” threshold if they retain a cap at all. The request effectively pushes for a step-change in the headroom available for tokenized financial instruments rather than a modest increase.
The pressure campaign: from February warnings to April and now September
This Sept. 7 intervention follows earlier public pushes from the same broad ecosystem of tokenization and market infrastructure firms.
In February, tokenization and market infrastructure companies—including Securitize, 21X, and Boerse Stuttgart—warned that existing asset limits, volume caps, and time-limited licenses were preventing regulated onchain markets from scaling within Europe. That earlier warning also argued that, without policy changes, liquidity could migrate to US markets as regulators there move toward larger-scale tokenization and onchain settlement.
In April, the effort broadened to include 39 financial firms and industry groups. That campaign, which included Nasdaq and Boerse Stuttgart, urged EU policymakers to fast-track changes to the DLT Pilot Regime and raise its overall limit to between 100 billion euros and 150 billion euros. The April letter also asked for broader asset eligibility and for removing time limits on licenses issued under the regime.
By Sept. 7, the coalition’s requested threshold has moved higher—shifting from an upper band of 100–150 billion euros previously to a minimum baseline of 500 billion euros, or no cap at all.
The underlying context for these arguments is that distributed real-world assets (RWA) are growing but remain concentrated in a limited set of categories. A frequently cited industry metric, RWA.xyz, places the total value of distributed RWA at about $39.15 billion (excluding stablecoins), with US Treasury debt described as the largest category at roughly $15.8 billion.
What to watch next
Lawmakers now have competing inputs: the Commission’s proposed 100 billion euro ceiling inside the Market Integration and Supervision Package, and the industry coalition’s demand for either removal of the cap or a substantial increase to at least 500 billion euros. The next key question for market participants is whether EU regulators will treat capacity limits as a temporary pilot constraint—or as a scaling throttle—and how that choice affects where liquidity and tokenized issuance concentrate as the DLT Pilot Regime evolves.
MemeToro is another speculative memecoin and prediction-market project wrapped in an AI narrative. Its trust scores sit between just 25% and 50% across automated website-checking platforms. The smart contracts meant to handle MemeToro’s future funding rounds and token launches haven’t been audited yet. MemeToro’s favorable media coverage has been distributed as paid PR.
That, more or less, is the case a handful of websites are making against MemeToro. At first glance, it can leave the project looking far more questionable than the full picture suggests.
At the same time, MemeToro has also been covered over the past few months by names like CoinGape, Invezz, Business Insider and many more, without the project being treated there as fraud.
Much of that attention has focused on its AI Agent, which is being built to scan trends, filter possible meme ideas, and make the reasoning behind future launches more transparent. Just as importantly, MemeToro’s development is open-source, with the framework already taking shape on GitHub and regular code updates that anyone can follow.
There’s an obvious irony in calling a project like this an outright scam without much stronger evidence. The claims are still worth checking, but against what MemeToro actually does, not just the headline.
What is MemeToro?
MemeToro is a memecoin launch platform being built on BNB Chain, with an AI agent at the center of how new token ideas come together. The agent follows trends across news, social media and culture, looks for meme-worthy concepts and turns the strongest ones into potential token launches.
Instead of stopping at a name or image, it builds a fuller proposal around each idea, including the reasoning behind it and the conditions for a possible release. If nothing looks suitable, it can simply pass and wait for a better opportunity.
MemeToro already has an early MVP of this process, while the full agent shown on the website remains in development. Further iterations of the platform also bring trading, prediction markets, staking and other memecoin-focused features into the same ecosystem.
What is the $MT token?
$MT is MemeToro’s native token and is separate from the individual memecoins that the platform’s agent will eventually propose. It runs on BNB Chain and has a fixed total supply of 1.2 billion tokens.
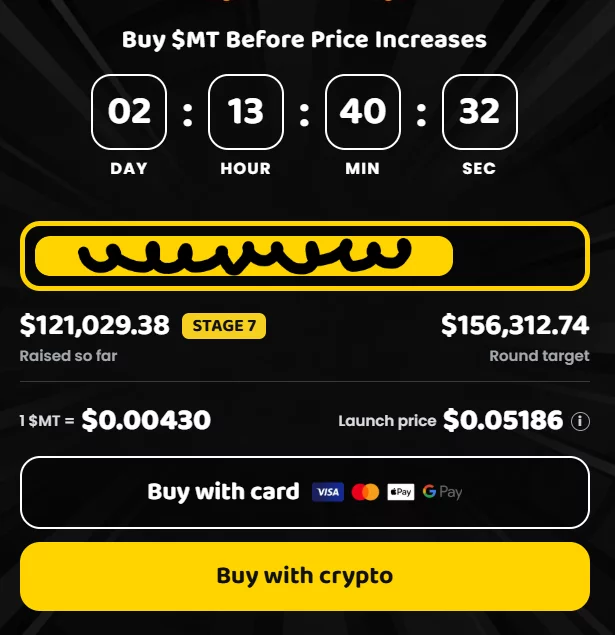
As of September 7, 2026, the $MT presale is in Stage 7, with each token priced at $0.00430. MemeToro shows $121,029 raised toward a $156,312 round target, while the website lists $0.05186 as the planned launch price. The presale supports crypto payments as well as card purchases through Visa, Mastercard, Apple Pay and Google Pay.
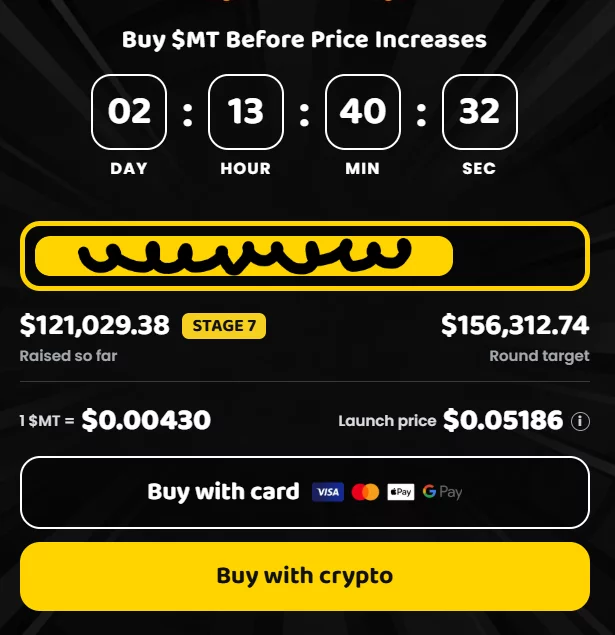
There’s visible buying activity around the presale too, with recent $MT purchases continuing to appear in the site’s feed across both Ethereum and BNB Chain.

$MT can be used in MemeToro’s future fixed-rate funding rounds alongside BNB and supported stablecoins. The token is also tied to staking, rewards, trading and prediction-market activity across the platform.
MemeToro review: What the accusations leave out
Once the basics of MemeToro and $MT are clear, the accusations are easier to assess on their own terms. That means tracing the numbers, trust scores, audit warnings and on-chain activity back to where they actually come from. That’s where some of the strongest-sounding risk signals start to look quite different.
MemeToro has low trust scores
MemeToro has been rated between roughly 25% and 50% by automated website-checking services, which is a compelling number to point to when arguing that the project appears suspicious.
The main negatives cited are MemeToro’s relatively young domain, private WHOIS registration and the fact that there simply isn’t much historical reputation data attached to the website yet. That makes sense for a project that hasn’t been online for years, but none of those checks found the kind of thing that would make the score much more alarming, such as confirmed phishing or malware.
One of the services giving MemeToro a middling score actually lists several positives at the same time:
In other words, the low rating is largely saying “this website is new and doesn’t have much history yet,” rather than identifying something concrete that makes MemeToro unsafe. Domain age by itself isn’t something that tells you whether a crypto project is legit or a scam.
MemeToro uses paid PR to promote itself
MemeToro has been criticized for using paid coverage and comparison articles that mention competing presales such as Pepeto. In crypto, though, that’s hardly an unusual marketing strategy, and the wider PR activity around these projects puts that criticism into a bit more perspective.
One example is easy to trace through releases published on openPR. Around the same time MemeToro was being called out for paid comparisons and SEO-heavy headlines, Apeing was being promoted by Crypto Presale PR through big, promising headlines such as “next 100x crypto,” “next 1000x crypto” and “best crypto presale.” What makes the whole thing feel a little odd is that MemeToro wasn’t even the first project this account had gone after. The same PR agency had already published pieces attacking Bullski, with one outright framing it as a fraudulent clone, and MemeToro was next.
In comparison, MemeToro’s own promotion looks relatively restrained, with most of it centered on the AI launch model, open-source development, staking and other platform features rather than “100x” or “1000x” style claims.
Sure, some of MemeToro’s coverage is paid, and that should be treated as marketing, but the project has also attracted substantial organic coverage, so it would be misleading to reduce its entire media presence to sponsored PR.
MemeToro’s smart contracts haven’t been audited
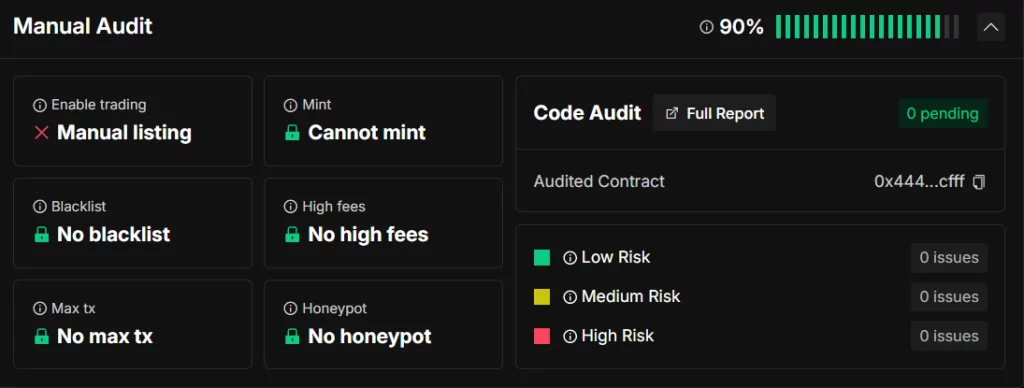
This one sounds pretty damning until the different contracts involved are separated. MemeToro already has a deployed $MT token contract, and the audit results around it are reassuring. Coinsult found no major red flags such as honeypot behavior, blacklisting or high fees,
BlockSAFU gave it its highest trust score of 100,
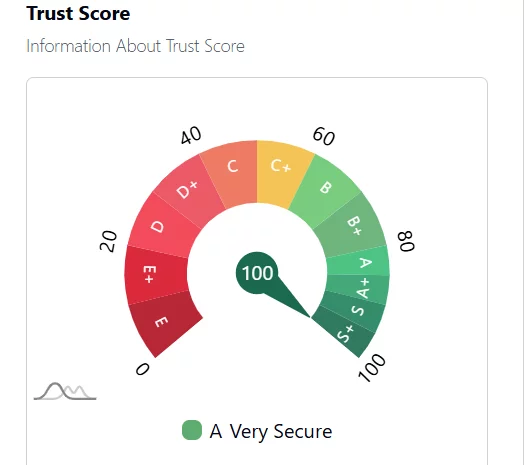
and SolidProof’s audit also came back clean. Taken together, there’s little on the contract side that raises concern.

The contracts that haven’t been audited are the future fair-launch contracts that will eventually handle funding rounds, token launches, claims and refunds for the memecoins proposed by MemeToro’s agent.
MemeToro says this pretty openly in its own GitHub. The contracts are still being worked on, aren’t meant to handle real funds yet, and are supposed to go through independent security reviews before they’re used in production.
So the more accurate version of the criticism isn’t that MemeToro has launched an unaudited financial system. It’s that part of the system hasn’t launched yet precisely because the contracts still need to be completed and audited.
The working MVP can already pick up trend signals, choose a concept and produce a draft proposal, but the funding, execution side and MemeToro AI agent only come later. Once that layer is ready, MemeToro plans to use fixed-rate funding rounds rather than the bonding-curve model common on platforms such as Pump.fun, with the smart contracts enforcing the published terms.
An unaudited contract already holding user funds would be one thing. A contract that is now in development, openly described as such and scheduled for review before production is something quite different.
MemeToro is just another meme coin project with an AI angle
It’s easy to look at MemeToro and assume the AI part is just another layer of branding around a meme coin. But here, the AI is meant to have an actual role in deciding what gets launched. It looks at what people are talking about, weighs different ideas, can reject them completely, and records the reasoning and sources behind whichever concept makes the cut.
The markets MemeToro is trying to connect aren’t particularly niche either. As of early September 2026, memecoins represent a roughly $33 billion market, while AI-agent tokens are worth another $3.2 billion. Prediction markets have grown much bigger still: Kalshi and Polymarket handled more than $45 billion in volume in August alone.
What MemeToro is really trying to do is combine those areas into one launch process: AI for finding and filtering ideas, transparent proposals showing why they were chosen, and eventually fixed-rate funding under published rules rather than a bonding curve. That makes the AI part feel less like a label added to the project and more like the thing tying the whole model together.
MemeToro’s whitepaper and website don’t match
MemeToro’s April whitepaper allocates 50% of the $MT supply to the public sale. The current tokenomics page shows roughly 71%.
That difference is real, but the two sources aren’t equally current. The whitepaper reflects an earlier version of the token allocation, while the website shows the breakdown being used for the presale now. In other words, the tokenomics changed, but the whitepaper wasn’t updated along with them.
That matters because some of the criticism treats the two figures as if MemeToro is presenting conflicting allocations at the same time. For anyone checking the presale today, the live website is the most reliable source. The whitepaper is simply carrying older numbers. That makes it a documentation issue, not something that really adds much weight to the MemeToro scam narrative.
86% of the $MT supply will be accessible to the market at launch
One of the sharper criticisms of MemeToro claims that roughly 71% of the total $MT supply is designated to the public sale. Add the 10% CEX reserve and 5% MemeToro trading allocation, the argument goes, and as much as 86% of all $MT could be sitting in or around the market from launch.
The problem is that this calculation treats allocation and circulating supply as though they were the same thing.
The 71% figure tells us how much of the overall supply has been set aside for the public sale. It doesn’t tell us that all of those tokens have actually been sold, claimed and placed into circulation. In fact, the same analysis that raises the alarm over the 71% allocation later argues that a large portion of those public-sale tokens may remain unsold. If they haven’t been sold, they obviously can’t all be sitting in presale buyers’ wallets ready to hit the market on day one.
The jump from 71% to 86% is even less straightforward. It comes from adding the CEX reserve and MemeToro trading allocations to the public-sale bucket. But, tokens reserved for exchange activity or liquidity aren’t automatically equivalent to freely circulating tokens available for holders to sell. Calling the entire combined amount “market accessible” makes the launch-day float sound much larger than the tokenomics table alone establishes.
There is a real distinction here that gets lost in the headline: 71% is an allocation figure, while circulating supply depends on how many tokens are actually sold and released. Those aren’t interchangeable numbers.
MemeToro claimed $118,562 raised, but only $63,966 appeared in its presale contracts
Another article raising concerns about MemeToro compared its advertised $118,562 raised with the figures from two public presale contracts on BNB Chain and Ethereum. Together, those contracts showed about $63,966, leaving roughly $54,600 that the author couldn’t account for through those two contracts alone.
Still, that comparison only works if those two contracts capture every way people can buy $MT. MemeToro’s presale doesn’t operate exclusively through direct on-chain purchases. The website also accepts card payments, as already mentioned. Purchases going through an external payment processor wouldn’t necessarily be reflected in the two contract counters the investigation checked.
The same criticism stops short of saying the missing amount was fabricated, because it recognizes other payment routes could exist. It actually lists card purchases, another payment processor and additional contracts among the possible explanations for the difference.
MemeToro moved presale funds through bridges, swaps and Binance
MemeToro’s treasury wallet has also come under scrutiny. It sent money through bridge services and swap routers, made transfers to a Binance deposit address, and also transferred funds to wallets the author couldn’t identify. Framed as “unexplained outflows,” that can easily sound like something disappeared. However, the transactions themselves only show money moving.
A bridge is used to transfer assets between chains. A swap router exchanges one asset for another. Sending funds to Binance can mean conversion, custody, payments, liquidity preparation or any number of ordinary operational uses. None of those actions is unusual enough on its own to tell us what the money was ultimately used for.
There’s another detail that makes the accusation much harder to read as a clean trail of presale money. The same wallet also received funds that couldn’t be tied directly to presale purchases, so incoming and outgoing assets were mixed together. Even the article taking aim at MemeToro acknowledges that it would be irresponsible to assume every outgoing transaction was investor money.
To round things out, the treasury was active. But “the wallet moved funds” and “presale money went missing” are two very different statements, and the on-chain activity shown in the article casting doubt on MemeToro only proves the first one.
What we’re left with after reviewing MemeToro
After looking through the presale, token setup, public GitHub work, audits and the main accusations around the project, MemeToro looks legit.
There’s enough here that can actually be checked. The AI idea isn’t just a landing-page promise, the MVP exists, development is public, and the $MT contract has already been through security reviews. A lot of the scarier claims appear much weaker once you get past the headline, especially the ones that treat token allocation as circulating supply, compare only part of the presale payment flow, or frame normal wallet movements as proof that funds disappeared.
MemeToro still has some features left to complete, but that’s not the same thing as there being no real platform behind it. At this point, the MemeToro scam label looks much harder to justify than the view that this is a genuine project in the middle of being built.


US-listed spot Bitcoin exchange-traded funds (ETFs) recorded $120.2 million in net outflows on Wednesday, bringing withdrawals across the first two sessions of the holiday-shortened week to $166.8 million, according to Farside Investors data.
The ARK 21Shares Bitcoin ETF (ARKB) led Wednesday’s withdrawals with $78 million, followed by Grayscale’s Bitcoin Trust ETF (GBTC) with $27.2 million and BlackRock’s iShares Bitcoin Trust ETF (IBIT) with $19.5 million. Morgan Stanley’s Bitcoin Trust (MSBT) was the only fund to record inflows, adding $4.5 million.
Wednesday’s withdrawals followed $46.6 million in net outflows on Tuesday, marking the category’s first back-to-back outflow days since a three-day run ended on Aug. 14. Across the two sessions, GBTC lost $92.7 million, while ARKB and IBIT recorded net redemptions of $69.9 million and $8.8 million, respectively.
The two-day pullback erased about 4.4% of the $3.8 billion attracted during the funds’ strongest three-week stretch of 2026. Bitcoin ETFs have recorded about $55 billion in cumulative net inflows since their launch, while their combined 2026 net flows amount to about $1.07 billion in outflows, according to Farside Investors.
Ether and Solana ETFs return to inflows
Meanwhile, US spot Ether ETFs attracted $34.7 million on Wednesday after recording $24.3 million in withdrawals on Tuesday, leaving the funds with $10.4 million in net inflows for the week.
BlackRock’s ETHB led Wednesday’s Ether ETF inflows with $22.9 million, followed by its ETHA fund with $9.7 million. The 21Shares TETH fund added $2.1 million, while the remaining Ether ETFs reported no net flows.
Related: Bitcoin SOPR metric sees longest profit run of 2026 as new analysis challenges bear market
Spot Solana ETFs also reversed Tuesday’s outflow of about $700,000, attracting $11.2 million on Wednesday and bringing their two-session total to $10.5 million in net inflows. All Wednesday inflows went to Bitwise’s BSOL.
Hyperliquid ETFs recorded net outflows for a second session, losing $5.3 million Wednesday after $13 million in Tuesday outflows, bringing the week’s total outflow to $18.3 million.
The mixed ETF flows came as Bitcoin traded near $78,000 on Thursday, down from about $79,700 when the earlier three-week inflow figures were reported. Ether traded around $2,470, while Solana hovered near $101, according to CoinGecko.

Zcash price traded near $1,216 on Sep. 10 after a seven-day rally of more than 50%, but overbought momentum, a three-day sell signal and nearby liquidation clusters raised the risk of a pullback.
Summary
- Zcash price advanced from about $814 to a multi-year high near $1,257 during the seven-day period.
- Daily RSI reached 75.72, keeping ZEC in overbought territory after its rapid breakout.
- 4-hour Bollinger Bands place immediate support at $1,196 and resistance near $1,287.
- Analysts identified $1,000–$1,100 as a possible base if the rally enters a correction.
Zcash price action today
According to data from crypto.news, Zcash (ZEC) price was trading at $1,216.15 at the time of writing, down 2.26% for the session after opening at $1,244.18. The token traded between an intraday low of $1,204.93 and a high of $1,256.80.
Despite the daily decline, ZEC remained one of the strongest large-cap crypto performers over the past week. Its price rose more than 50% from around $814 on Sep. 4 and briefly entered the $1,249–$1,257 area before buyers lost momentum.
The breakout also placed Zcash above $1,000 for the first time in years. Price continued to hold more than $200 above the psychological level at the time of writing, even as Bitcoin and Ethereum faced broader selling pressure.
Derivatives liquidations contributed to the initial acceleration. More than $34.5 million in ZEC short positions were reportedly closed during a 24-hour period as bearish traders were forced to buy back the asset. Short liquidations accounted for about 94% of the total cited liquidations.
Forced buying helped ZEC clear resistance quickly, but the same leverage that drove the advance could increase volatility if traders begin taking profits.
Daily ZEC chart remains overextended
The daily chart shows Zcash trading far above all four moving averages. Its 20-day simple moving average stood at $942.96, while the 50-day, 100-day, and 200-day averages were positioned at $679.76, $573.86, and $468.71, respectively.
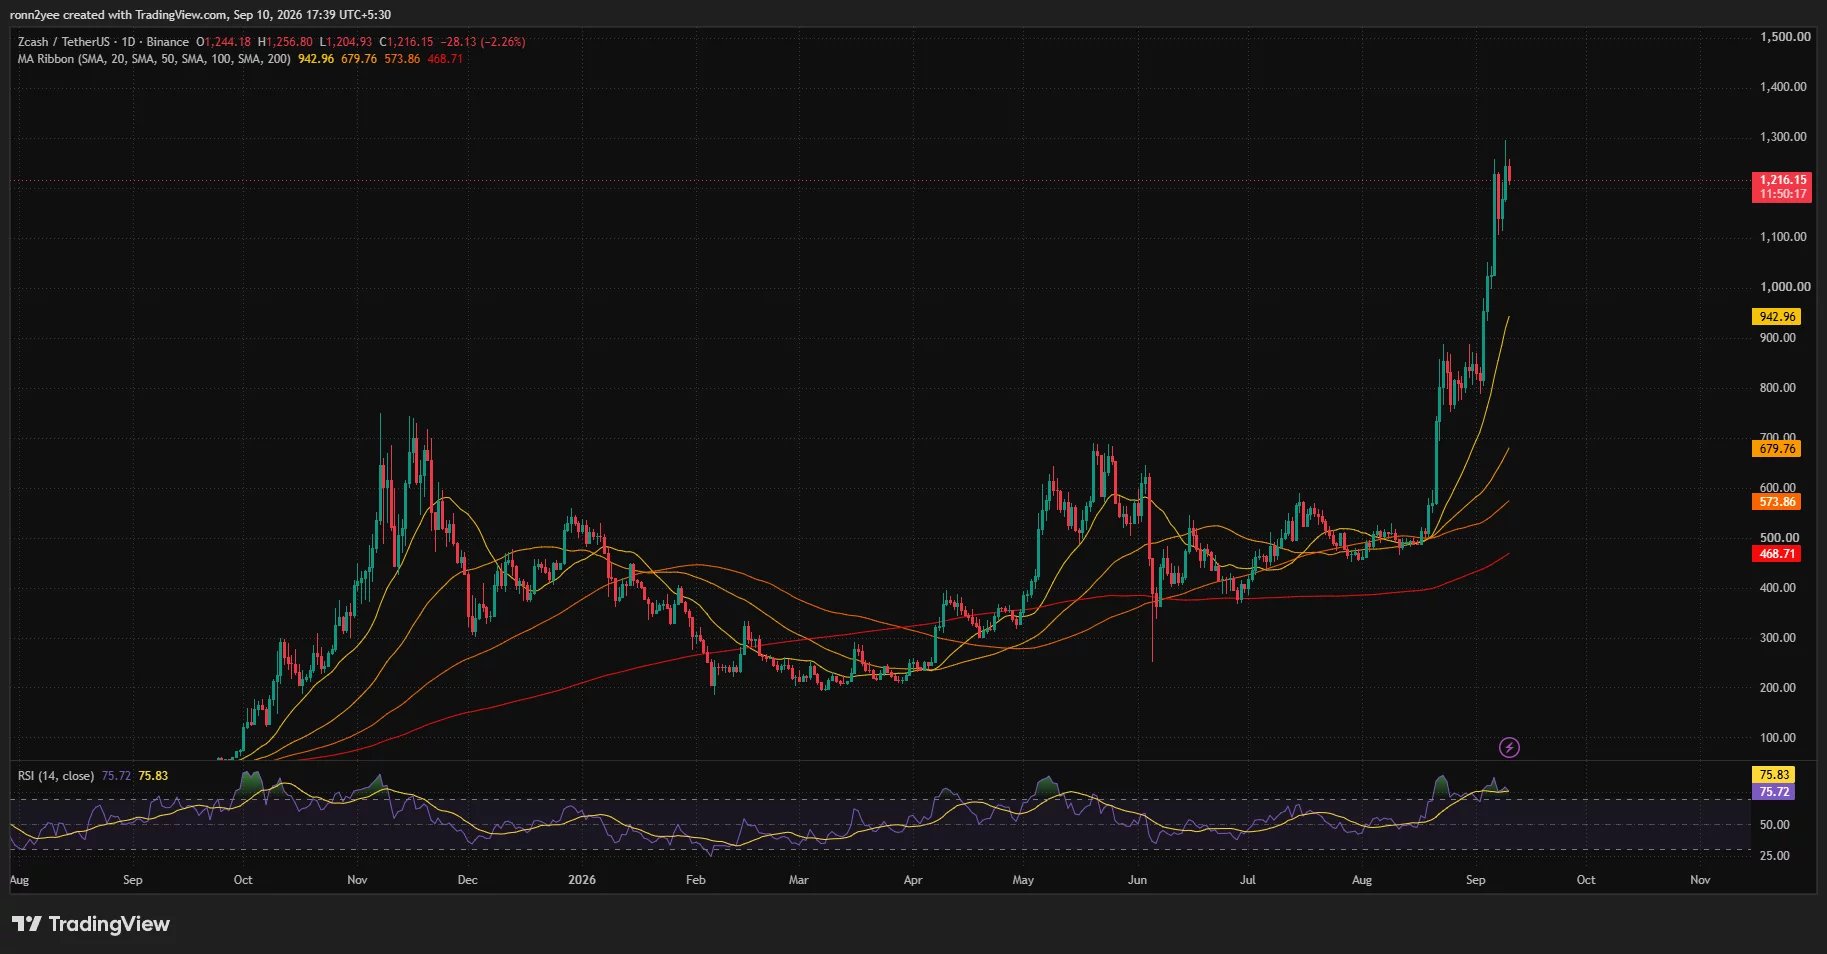
ZEC was therefore about 29% above its 20-day average and more than 159% above its 200-day average. Large gaps between price and long-term moving averages often show strong momentum, but they can also leave an asset vulnerable to mean reversion.
The moving averages remained in bullish order, with the shorter averages positioned above the longer ones. Maintaining that structure would support the broader uptrend even if ZEC experiences a short-term correction.
The daily relative strength index stood at 75.72, with its signal average at 75.83. A reading above 70 is generally treated as overbought, suggesting that the market may need to consolidate before attempting another sustained advance.
The indicator had also eased from its recent peak while ZEC held close to its highs. Continued cooling in the RSI without a sharp price decline could help reduce the overbought condition. A drop in both price and RSI, however, would point to weakening momentum.
4-hour chart puts $1,196 support in focus
Zcash was testing the middle Bollinger Band on the 4-hour chart. The indicator’s midline stood at $1,196.28, making the $1,190–$1,200 range the first support area to watch.
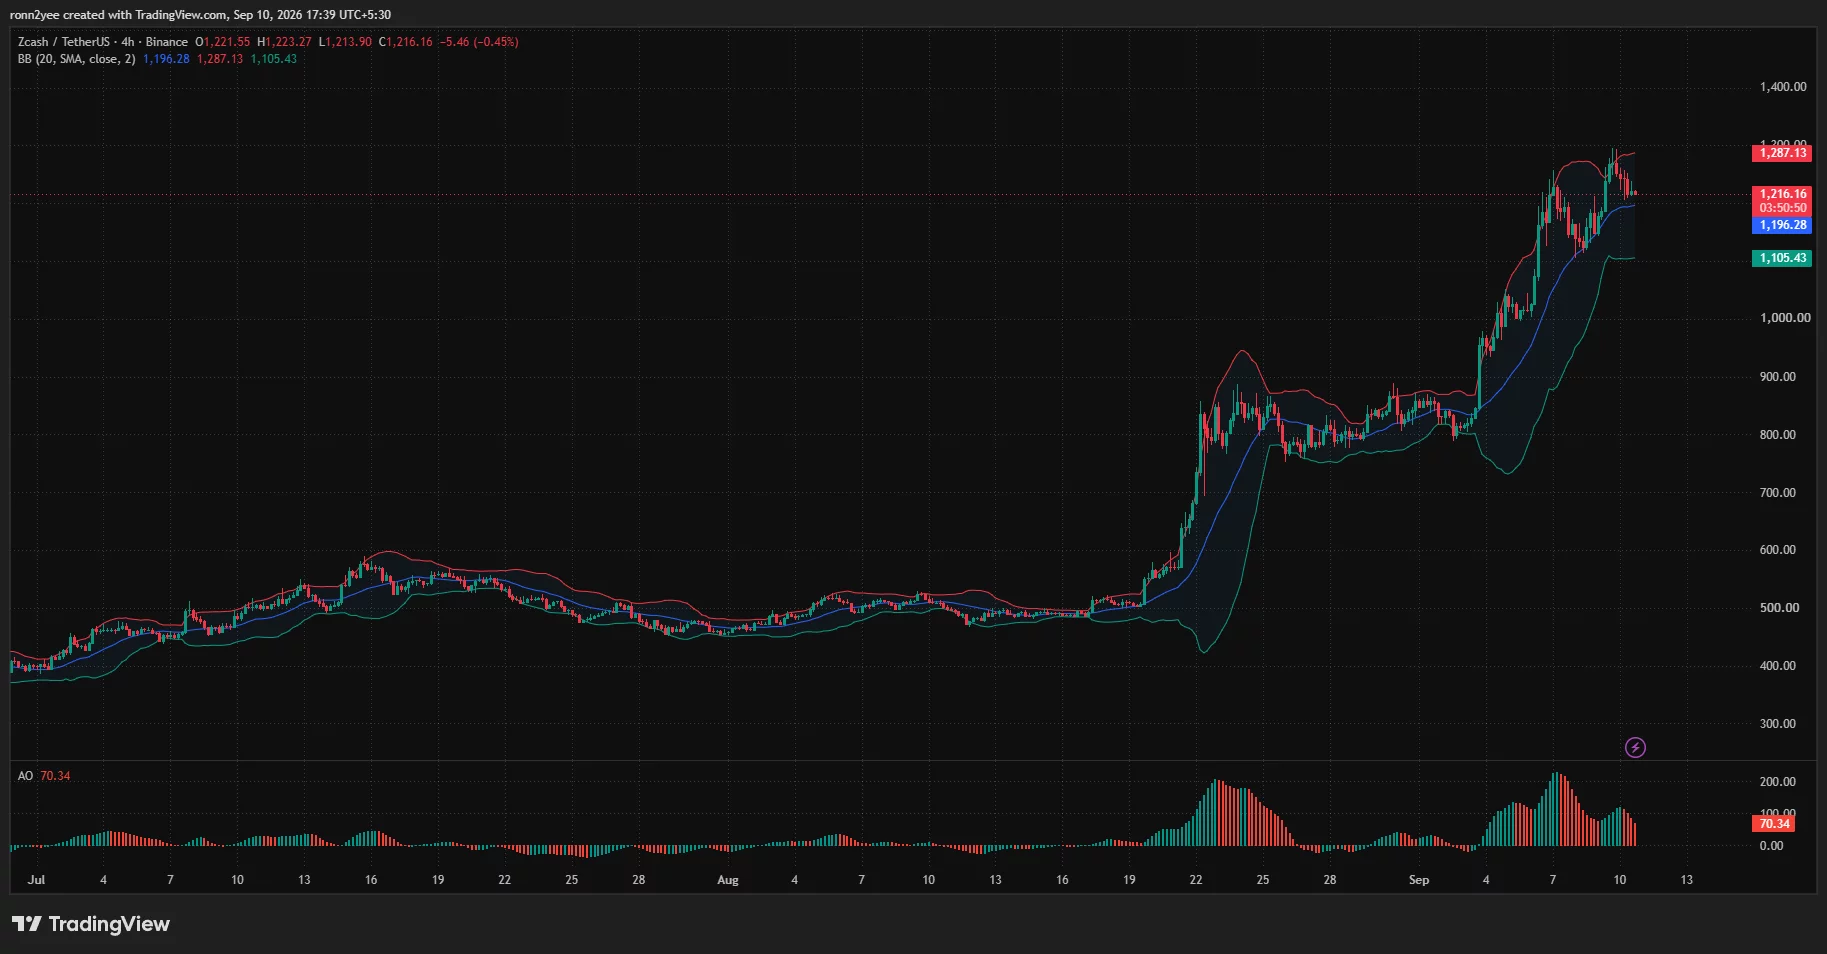
The upper Bollinger Band was located at $1,287.13. A 4-hour close above that level would place ZEC beyond the recent high and could open the way toward the round-number resistance at $1,300.
The lower band stood at $1,105.43, aligning with the wider $1,000–$1,100 demand region identified by crypto trader Altcoin Sherpa. The analyst said both levels were areas of interest but preferred to see ZEC spend time building a base instead of trying to identify an exact bottom.
The Awesome Oscillator remained positive at 70.34, showing that short-term momentum had not turned bearish. Its histogram bars were contracting, however, indicating that the pace of the advance was slowing.
A loss of $1,196 could expose the recent intraday area near $1,170, followed by the lower Bollinger Band around $1,105. A deeper decline would bring the $1,000 breakout level back into focus.
Liquidation map shows pressure on both sides
CoinGlass’ 24-hour ZEC liquidation heatmap placed several liquidity clusters above the market, including concentrations around $1,245–$1,270, $1,290–$1,305 and $1,320.
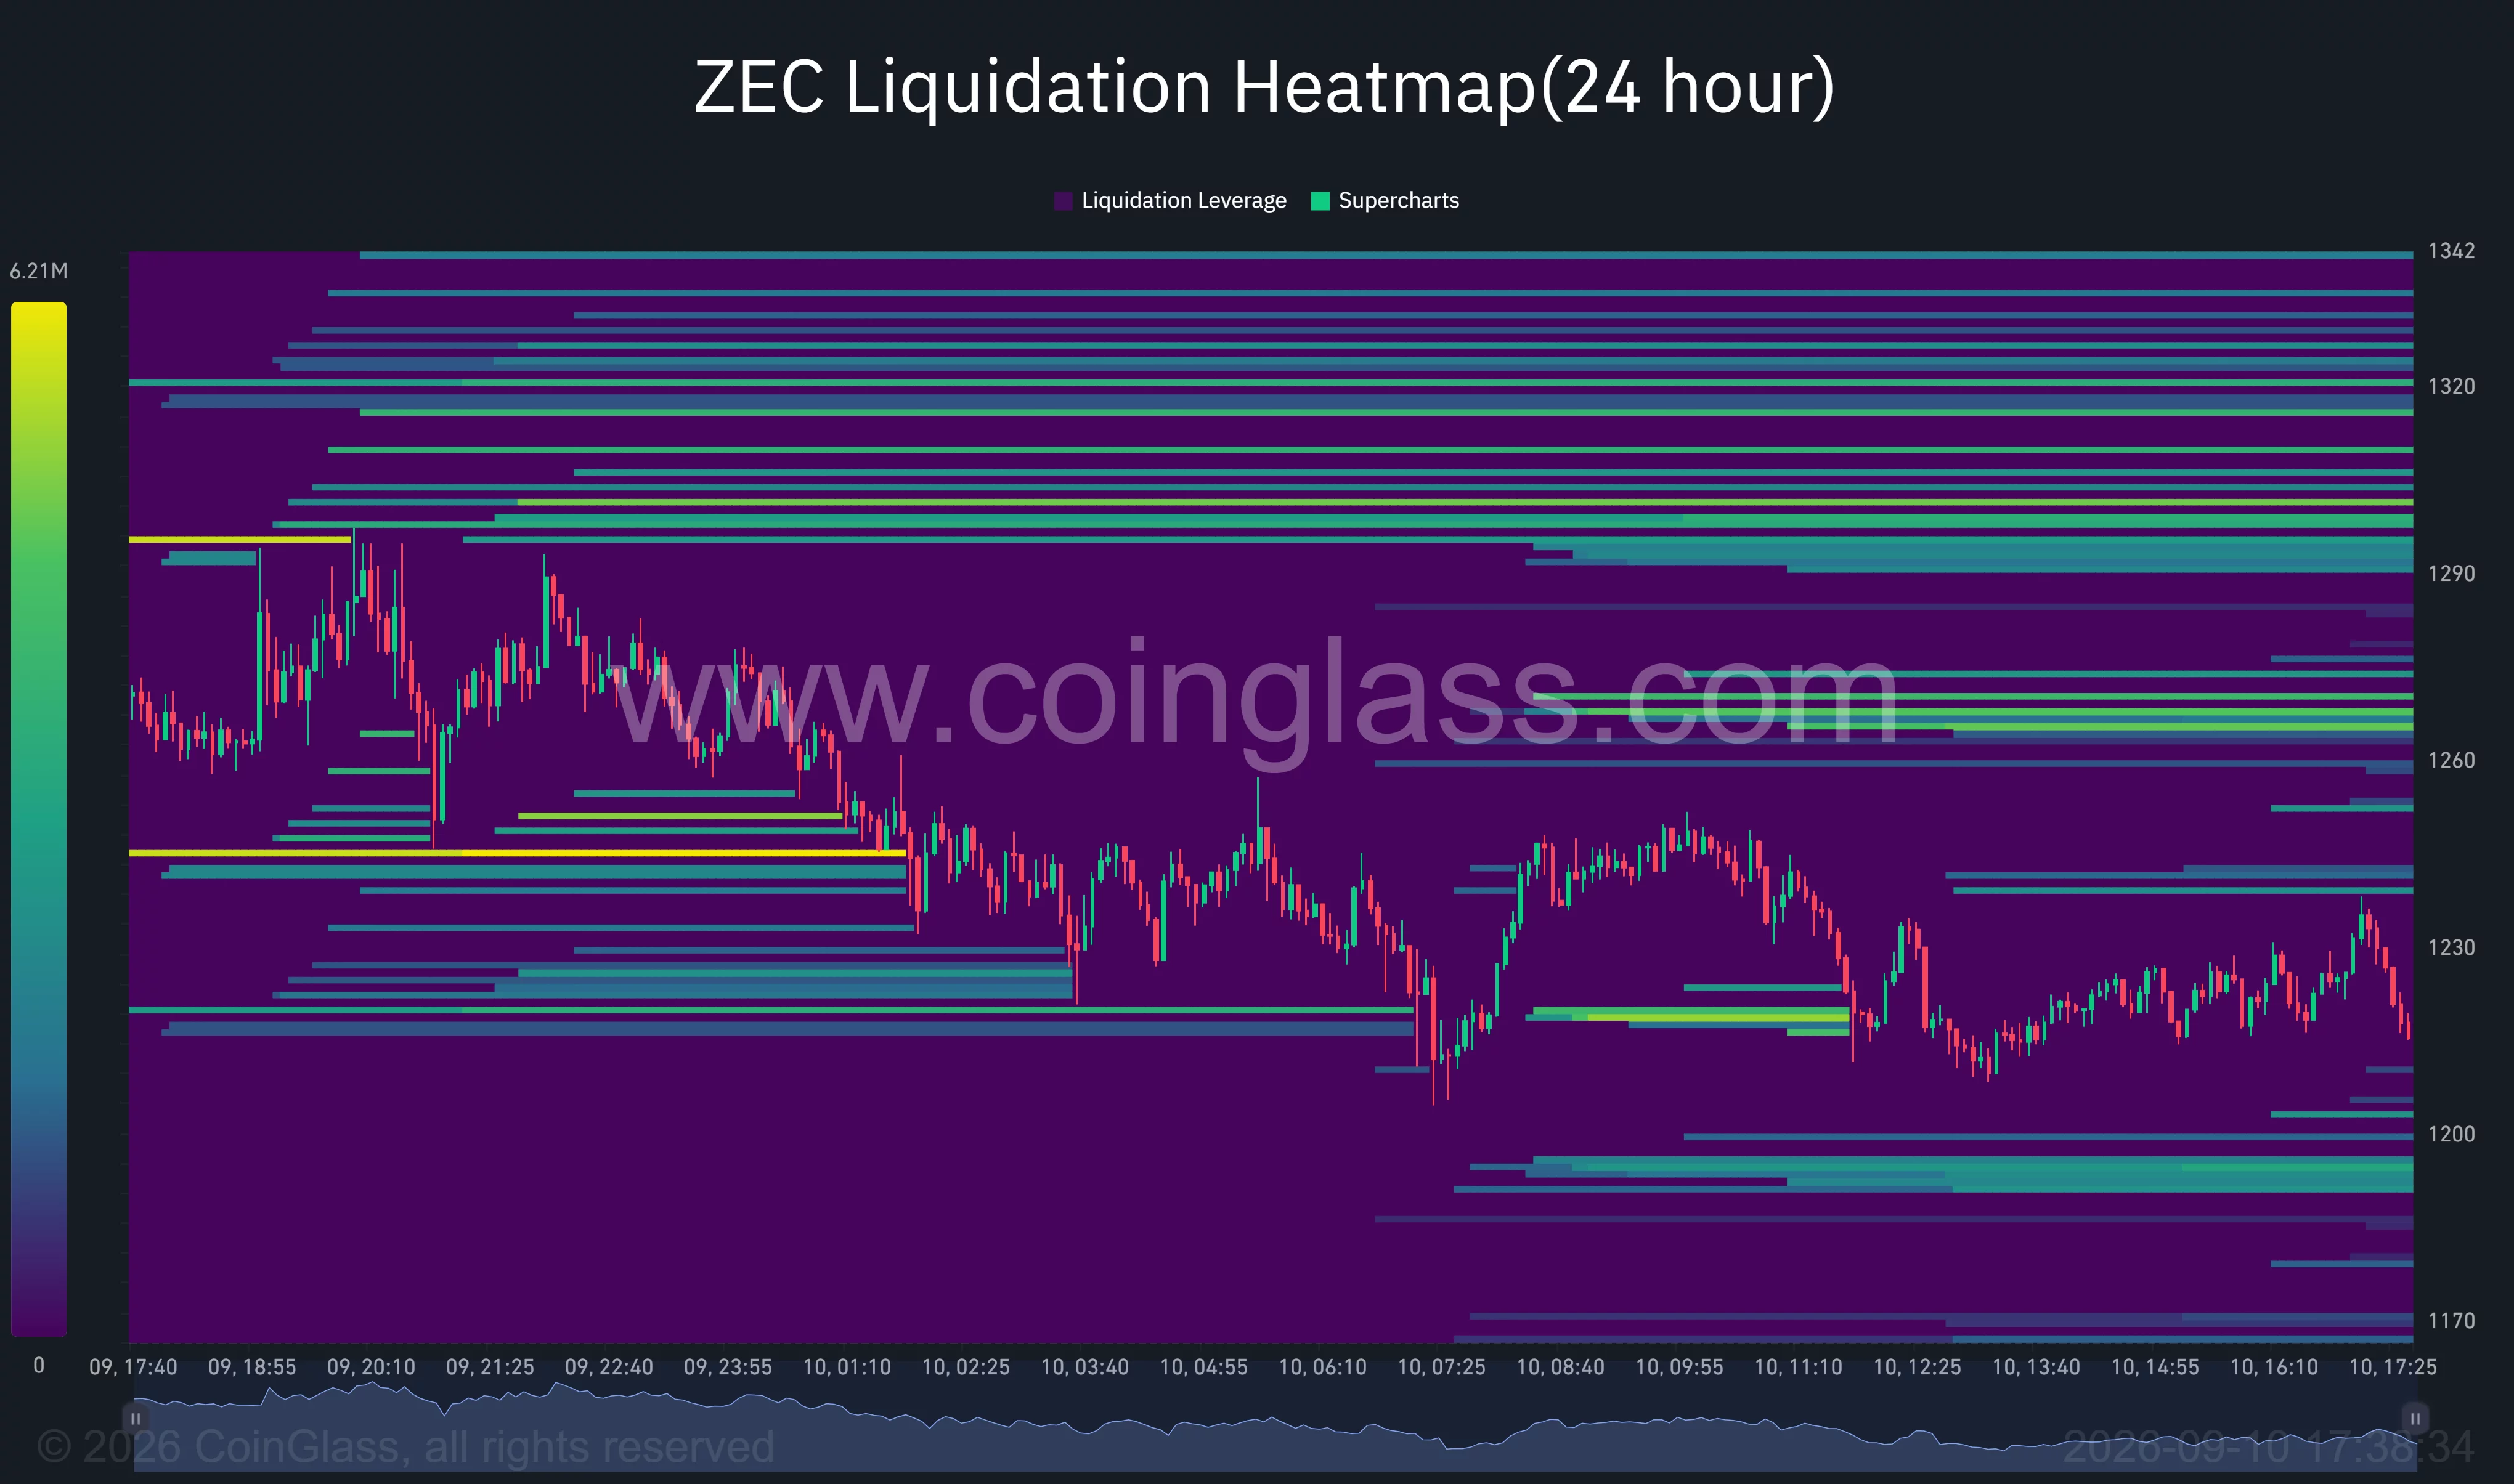
A recovery toward those levels could force short sellers to close positions, adding buy orders to the market. The nearest cluster around $1,245 also overlaps with the latest intraday trading range, making it an immediate barrier for bulls.
Below the market, the heatmap showed liquidity near $1,195–$1,200 and around $1,170. A break under $1,200 could therefore accelerate the decline as leveraged long positions face pressure.
The distribution leaves ZEC between competing liquidity zones. Holding $1,196 would keep the upper clusters within reach, while a clear loss of the level could draw price toward $1,170 or $1,105.
Analysts warn of a Zcash correction
Analyst Ali Martinez said the TD Sequential indicator had produced a sell signal on Zcash’s three-day chart. He compared the setup with a previous signal on May 19 that preceded a 64% correction.
The historical comparison does not mean ZEC will repeat the earlier decline, but it adds to the caution signaled by the elevated daily RSI and contracting 4-hour momentum.
Altcoin Sherpa maintained a longer-term bullish view but said the current move would benefit from a period of consolidation. His chart presented a possible path in which ZEC retreats toward the $1,000–$1,100 area, forms a base, and later resumes its advance.
For US traders, derivatives positioning may remain the key short-term risk after the reported short squeeze. A move above $1,287–$1,300 would strengthen the bullish case, while a sustained break below $1,196 could shift attention toward $1,105 and the former $1,000 resistance zone.
Disclosure: This article does not represent investment advice. The content and materials featured on this page are for educational purposes only.

Bitcoin price fell below $78,000 on Sept. 10 as hotter U.S. producer inflation, ETF outflows and weakening technical indicators weighed on demand ahead of the Federal Reserve’s September meeting.
Summary
- Bitcoin price fell 1.31% to $77,278 after reaching an intraday low of $76,676.
- Price broke below the daily Bollinger Band midpoint and 4-hour Supertrend support.
- 4-hour CMF dropped to -0.06, indicating that capital flows favored sellers.
- Liquidation clusters near $79,500–$80,000 could become an upside price magnet.
Bitcoin price falls toward its lower Bollinger Band
According to data from crypto.news, Bitcoin (BTC) price was trading near $77,278 at the time of writing, down 1.31% on the daily chart. The asset opened the session at $78,306 before falling as low as $76,676, placing it near the bottom of its recent trading range.
The wider crypto market also declined 2.01% over 24 hours to $2.65 trillion. Ether traded near $2,420, while XRP and Solana changed hands around $1.36 and $99.31, respectively.
U.S. producer inflation contributed to the risk reduction. August headline producer price inflation reached 5.4%, slightly above the 5.3% forecast, while core PPI climbed to 4.6%, its highest reading since June 2026.
The hotter figures added to concerns that the Federal Reserve could raise rates at its Sept. 15–16 meeting. Higher rates can place pressure on crypto and other risk assets by raising yields on cash and government debt.
Bitcoin’s daily chart shows that the latest retreat followed several failed attempts to sustain gains above $80,000. Price also formed lower highs after its early September peak above $82,000, showing that buyers lost momentum near the upper end of the range.
Daily indicators point to $76,392 support
Bitcoin has dropped below the daily Bollinger Band midpoint at $78,650. Losing that level shifts attention to the lower band at approximately $76,392, which sits just below the Sept. 10 intraday low.
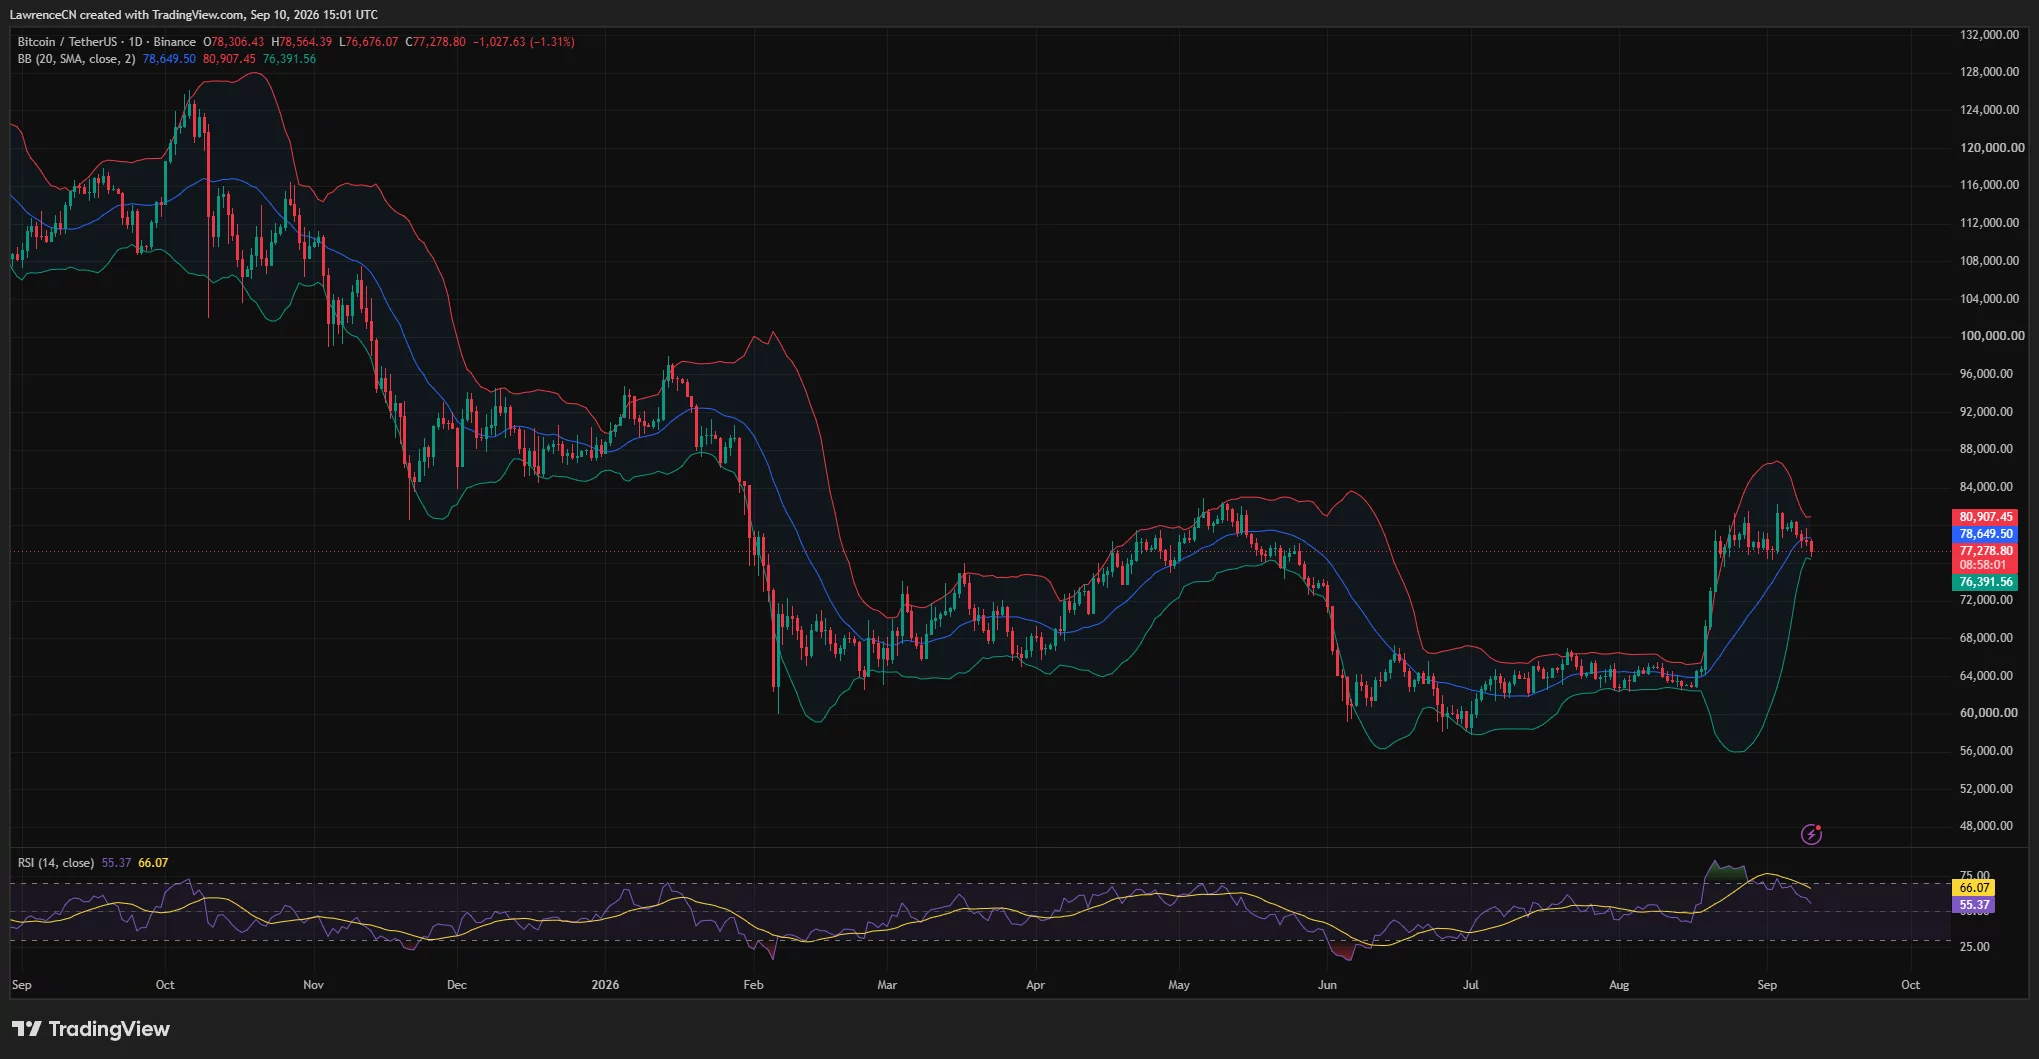
The Bollinger Bands place the upper boundary near $80,907. Bitcoin would need to recover the midpoint before mounting another attempt at that upper resistance.
Daily relative strength has also started to cool. The RSI stood at 55.37, down from its moving average of 66.07. The indicator remains above the neutral 50 mark, but the decline shows that bullish momentum has weakened since the early September rally.
A daily close below $76,392 would confirm a break under the lower Bollinger Band and expose the psychological $76,000 level. If buyers fail to defend that area, the next visible support zones are near $75,000 and $74,000.
Holding the lower band would keep Bitcoin inside its volatility range. A rebound would first face resistance around $78,650, followed by $80,907 and the recent swing area between $82,000 and $82,300.
4-hour Supertrend turns bearish below $79,676
The 4-hour chart presents a weaker short-term setup. Bitcoin closed the latest displayed candle around $77,276 after trading between $76,676 and $77,959.
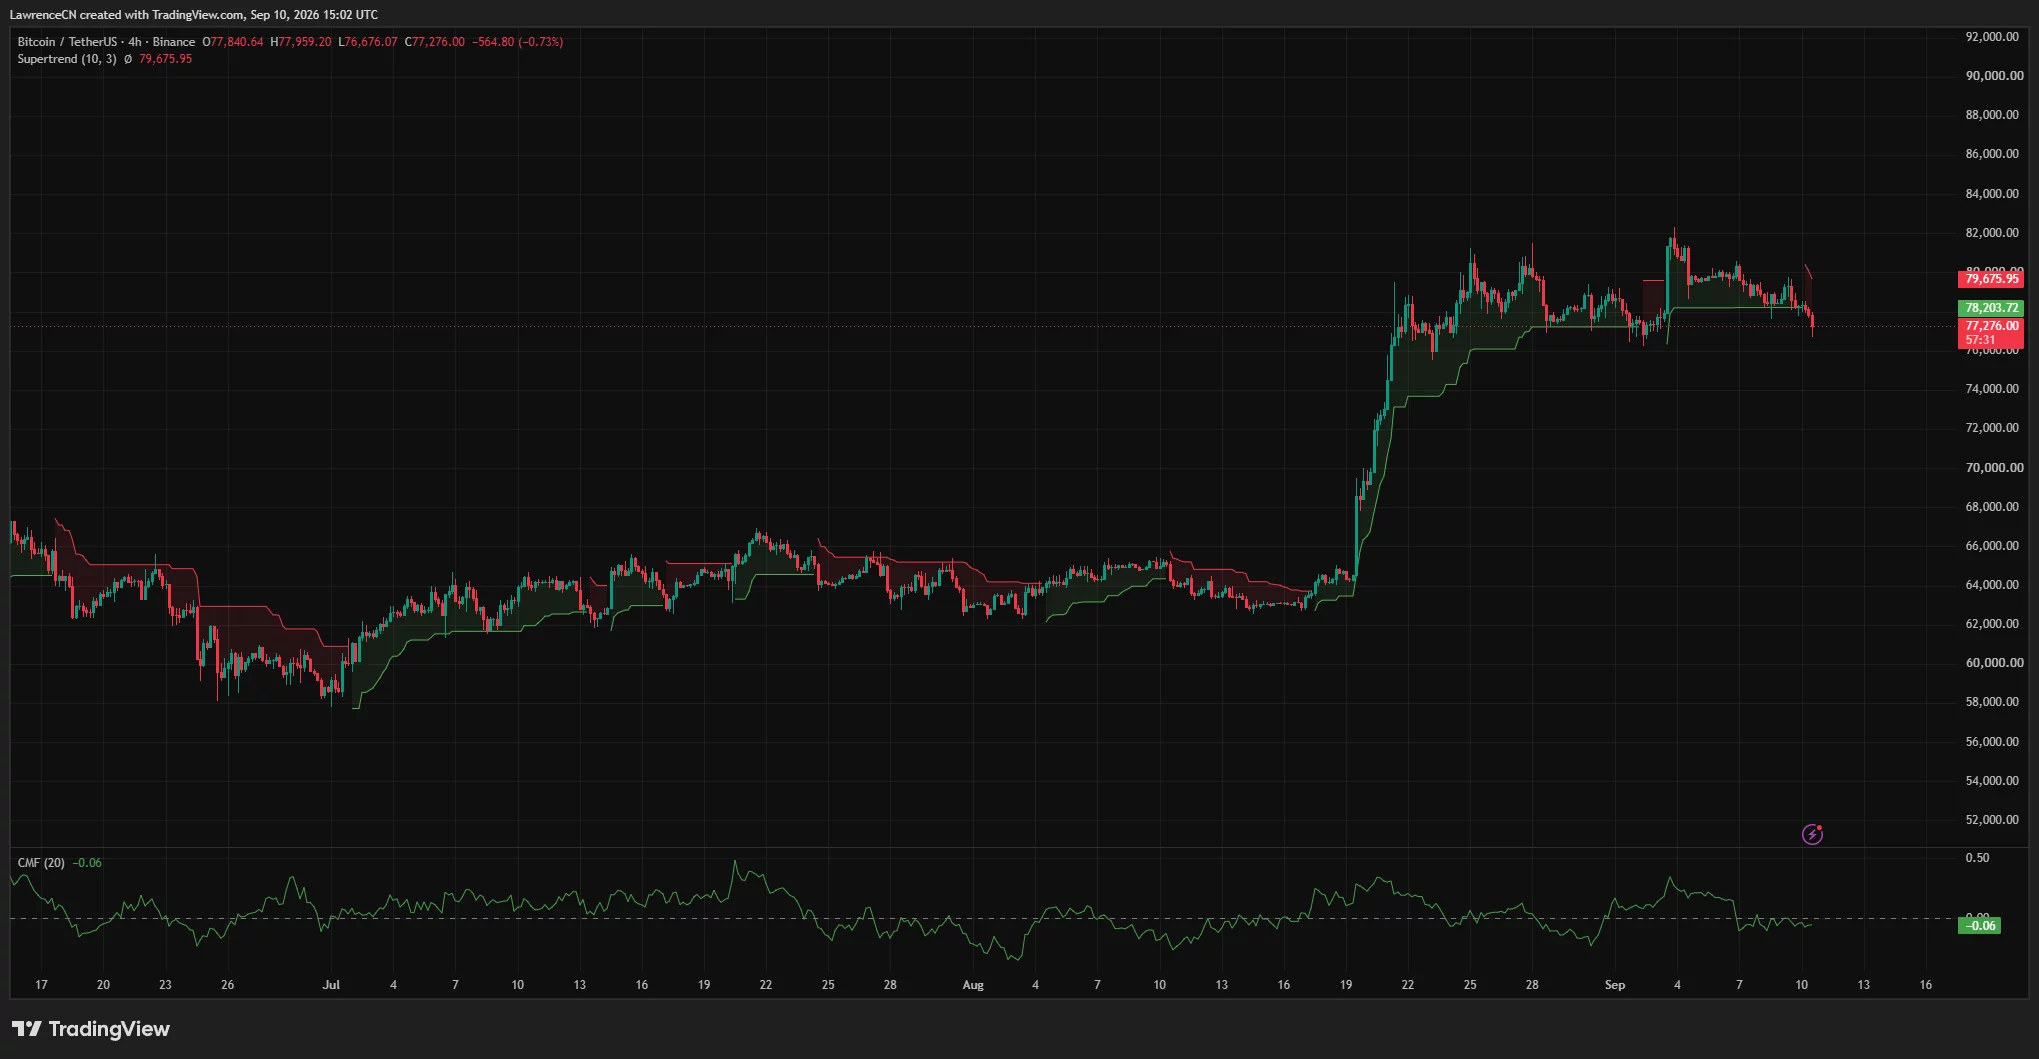
Price has fallen below the former Supertrend support near $78,204. The indicator has switched to a bearish reading, with resistance now positioned at approximately $79,676.
The change means Bitcoin would need to reclaim both $78,204 and $79,676 to weaken the current sell signal. Failure to recover those levels would leave sellers in control of the lower-timeframe trend.
Chaikin Money Flow stood at -0.06 on the 4-hour chart. A negative reading indicates that selling pressure and capital outflows outweighed buying activity during the indicator’s measurement period.
The price decline and negative CMF reading support the bearish Supertrend signal. However, Bitcoin’s bounce from the $76,676 intraday low shows that buyers remain active above the daily lower Bollinger Band.
Liquidation heatmap places major liquidity near $80K
CoinGlass’s three-day liquidation heatmap shows several concentrated liquidity zones on both sides of Bitcoin’s current price.
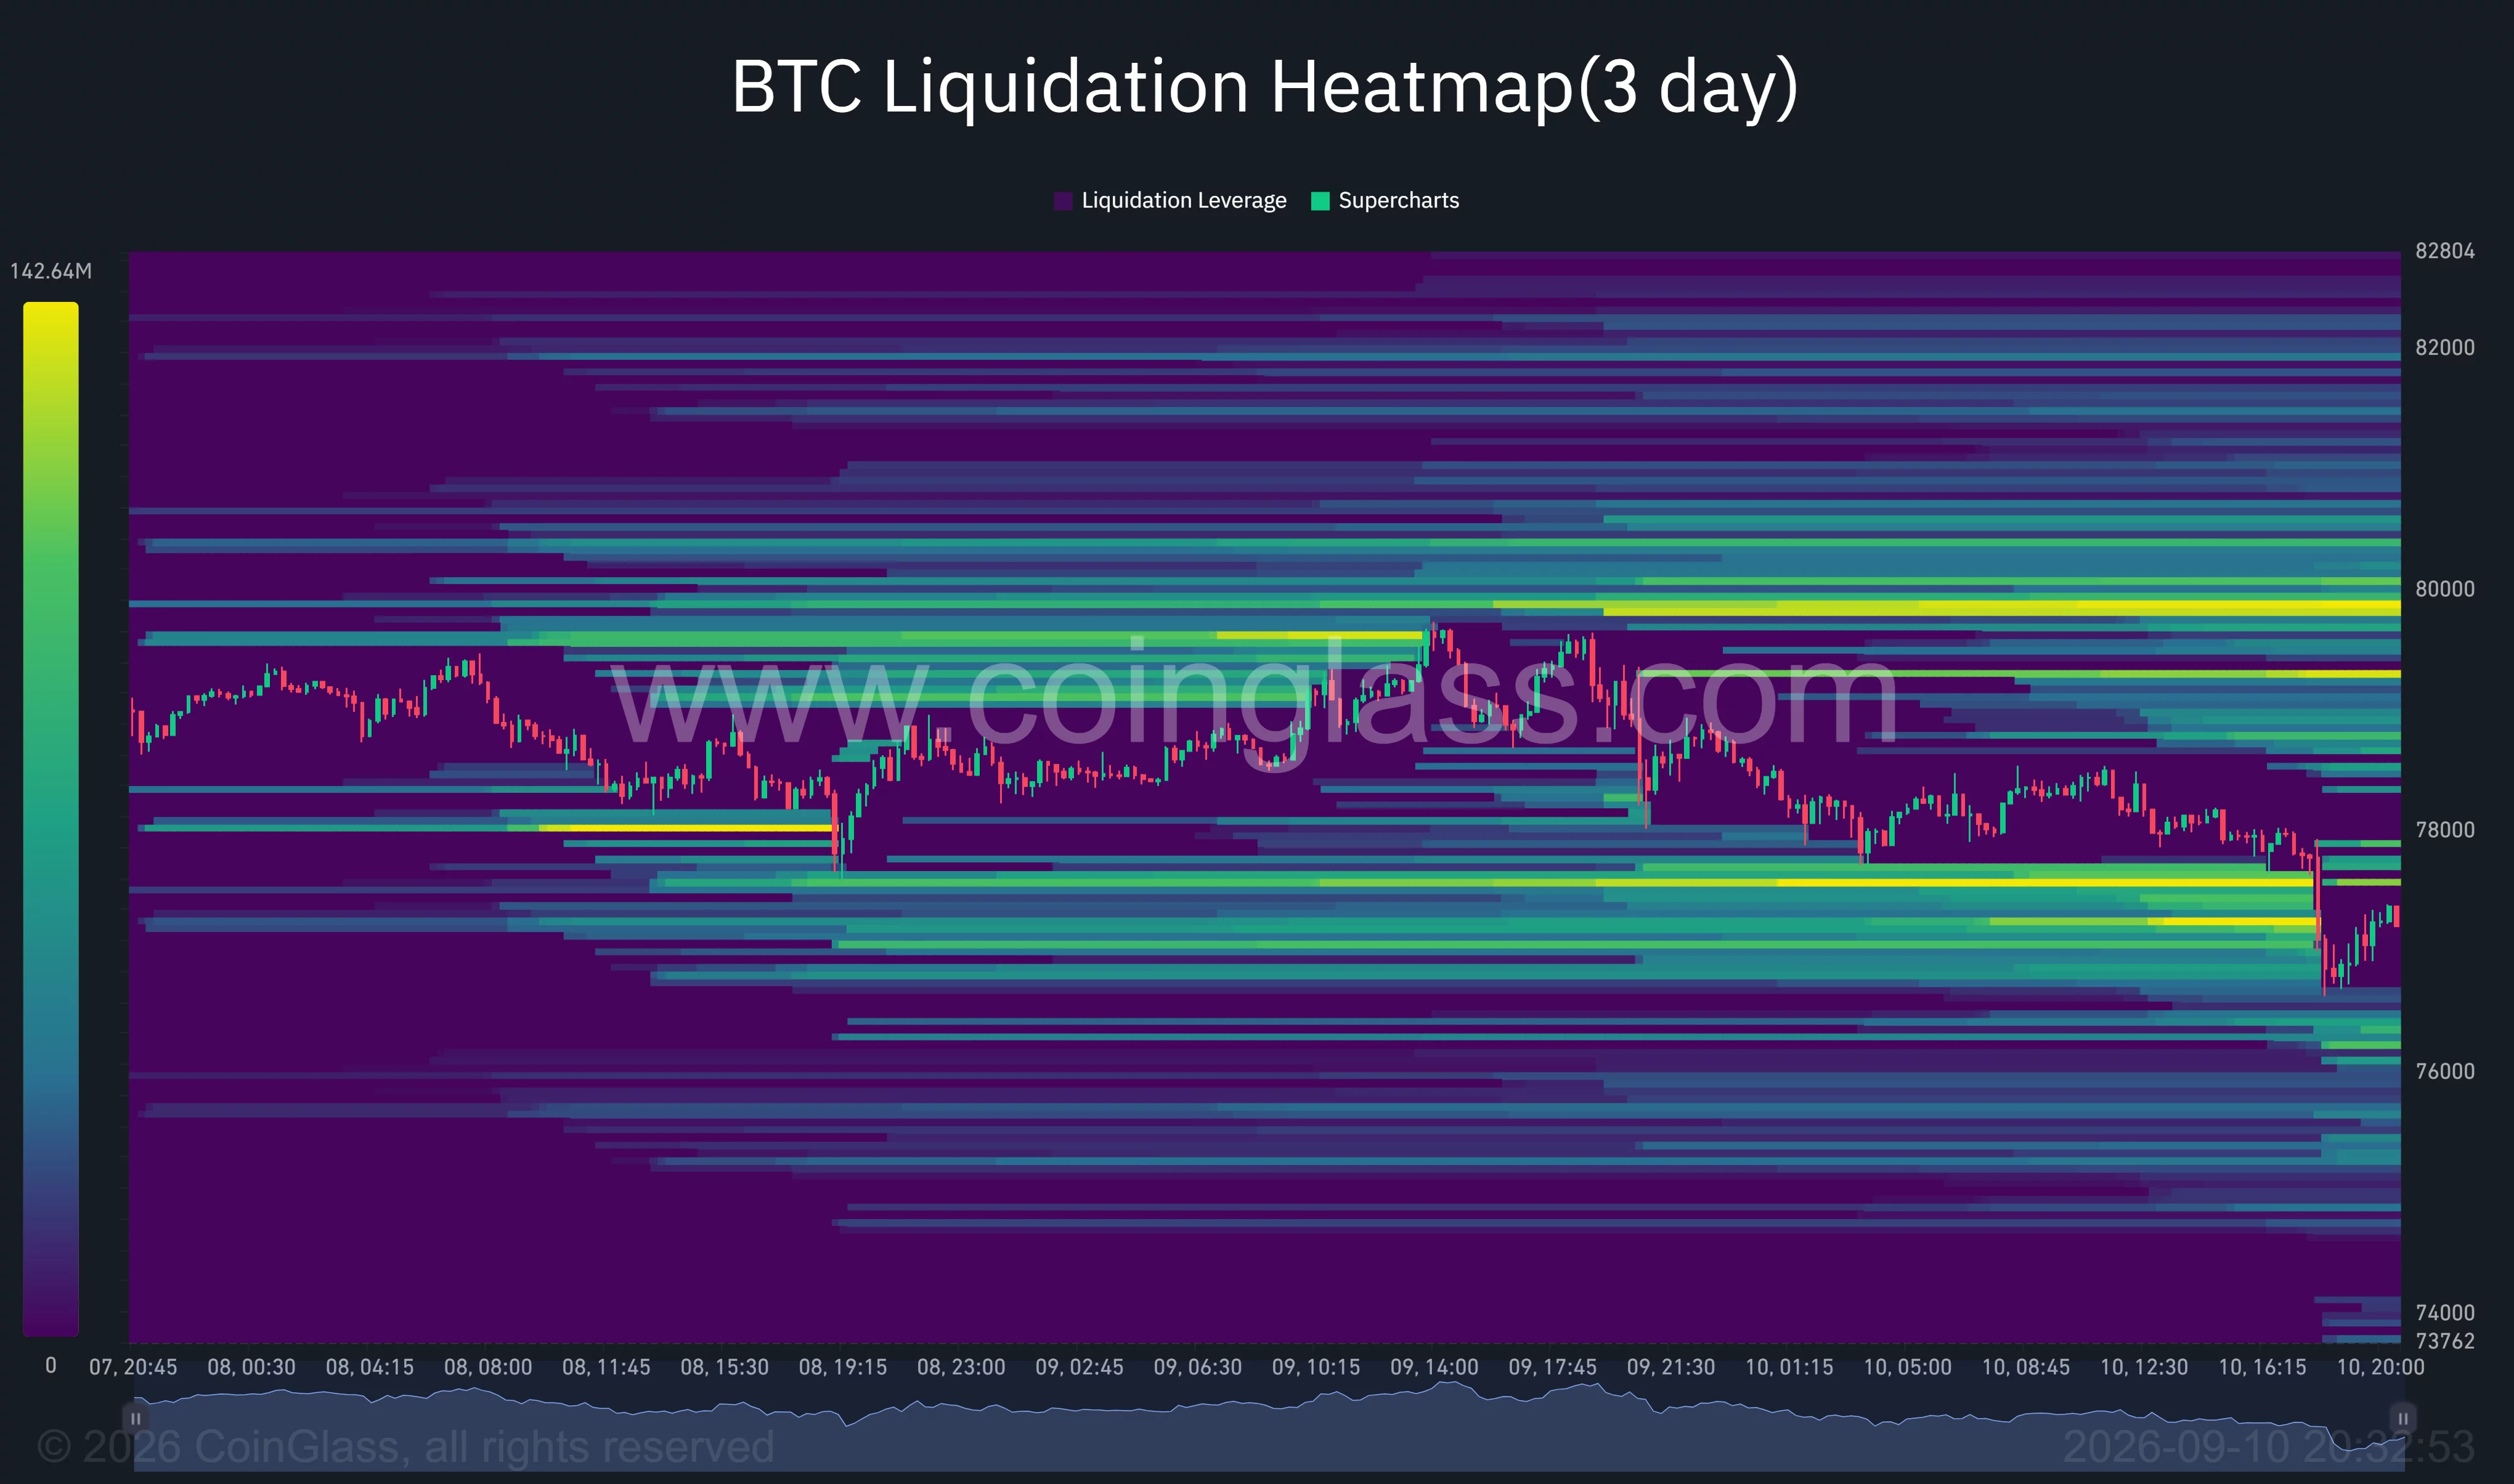
The most notable overhead cluster sits between roughly $79,500 and $80,000. Additional liquidity appears around $79,200, with smaller bands extending above $80,000. A recovery through $78,200 could draw the price toward those levels as short positions face growing liquidation risk.
Liquidity below the market is concentrated around $76,800 to $77,500, where the latest selloff appears to have cleared part of the accumulated leverage. Further bands remain near $76,000 and between $74,000 and $75,500.
Liquidation heatmaps identify areas where leveraged positions may be forced to close, but they do not determine price direction. Bitcoin could move between the nearest clusters as traders reduce exposure before the Fed decision.
US inflation and ETF outflows add pressure
CME FedWatch data placed the probability of a 25-basis-point September rate increase at about 60%, up from earlier expectations. Such a move would lift the federal funds target range from 3.50%–3.75% to 3.75%–4.00%.
Institutional demand also weakened before the meeting. U.S. spot Bitcoin ETFs recorded $201.9 million in net outflows on Aug. 29, ending a nine-day inflow streak, although the week still finished with $924.5 million in net inflows.
The technical setup leaves $76,392 as the main near-term support. A break below it could extend the decline toward $76,000 and $74,000, while a recovery above $78,650 would give bulls another chance to target the liquidation cluster near $80,000.
Disclosure: This article does not represent investment advice. The content and materials featured on this page are for educational purposes only.

The Actual Reason Crypto Coins Are Pumping (most don’t realize yet)

China could switch the lights off at any second, such is Beijing’s grip on our infrastructure, former MI6 chief warns

Porsche AG Eyes Wider Margins After $1.2 Billion Sale of Bugatti, Rimac Stakes


-
 Tech3 days ago
Memory prices are slowing because buyers ran out of money
-

 Business1 day ago
Micron Stock Climbs Above $1,031 as AI Memory Crunch and a $50 Billion Outlook Fuel the Rally
-
 Crypto World2 days ago
Bitcoin price risks $76K drop as $78K support weakens
-

 Business1 day ago
AMD Stock Climbs After Management Lifts 2027 Data Center Outlook Toward $70 Billion in AI Sales
-
 Crypto World2 days ago
Ethereum price stalls below $2,500 as ADX drops to 11
-

 Crypto World2 days ago
Robinhood Stock: How To Take Advantage With Reduced Risk
-

 NewsBeat2 days ago
What went right this week: an ‘historic’ fall in violent crime, plus more
-
 Crypto World1 day ago
Bitcoin price risks $70K if $78K neckline breaks
-
 Crypto World3 days ago
Brent Crude Oil Moves Above $100 for the First Time in 3 Months
-
 Crypto World2 days ago
Bitcoin price holds near $79K as cycle drawdowns narrow
-

 NewsBeat3 days ago
England up in reading, maths and science rankings as Scotland and Wales dip
-

 Business2 days ago
Meta debuts long-awaited personal AI agent, Muse
-
 Sports3 days ago
Phones confiscated, players sent home: Pakistan’s England tour turmoil revives memories of Mohammad Amir, Salman Butt and Mohammad Asif’s 2010 Lord’s spot-fixing scandal | Cricket News
-
 Crypto World3 days ago
Intel Stock Jumps 9% on Chip Price Hike Report, US Stake Gains $36 Billion
-
 Crypto World1 day ago
Ethereum price breakout hinges on a close above $2,535
-

 Crypto World3 days ago
Pump Fun and Kraken delete Hunter Biden $LAPTOP promotion
-

 Crypto World3 days ago
Visa expands stablecoin card network to 160 programs
-
 Tech3 days ago
Strong Password Policy and Password Manager Guide
-

 Business3 days ago
Egyptian TV Presenter Sarah Khalifa, 11 Others Sentenced To Death In Major Drug Trafficking Case In Cairo
-

 Tech2 days ago
Meta debuts its Muse AI agent. Will consumers trust it?
You must be logged in to post a comment Login