

Crypto World
The Hidden On-Chain Signal That Shows Bitcoin Is Closer to a Bottom Than Most Think
Bitcoin is currently trading at one of the most pivotal levels of this cycle, caught between long-term on-chain support and a wall of overhead resistance created by millions of underwater short-term holders.
Spot price $70,925
Weekly change +2.74%
Weekly RSI (14) 33.59
ATH drawdown -43%
Using Glassnode’s latest on-chain indicators alongside weekly and daily technical charts, this analysis breaks down exactly where Bitcoin stands today and what needs to happen next. Two clear scenarios emerge.
How Bearish is Bitcoin Right Now? Four Cost-Basis Levels are Critical
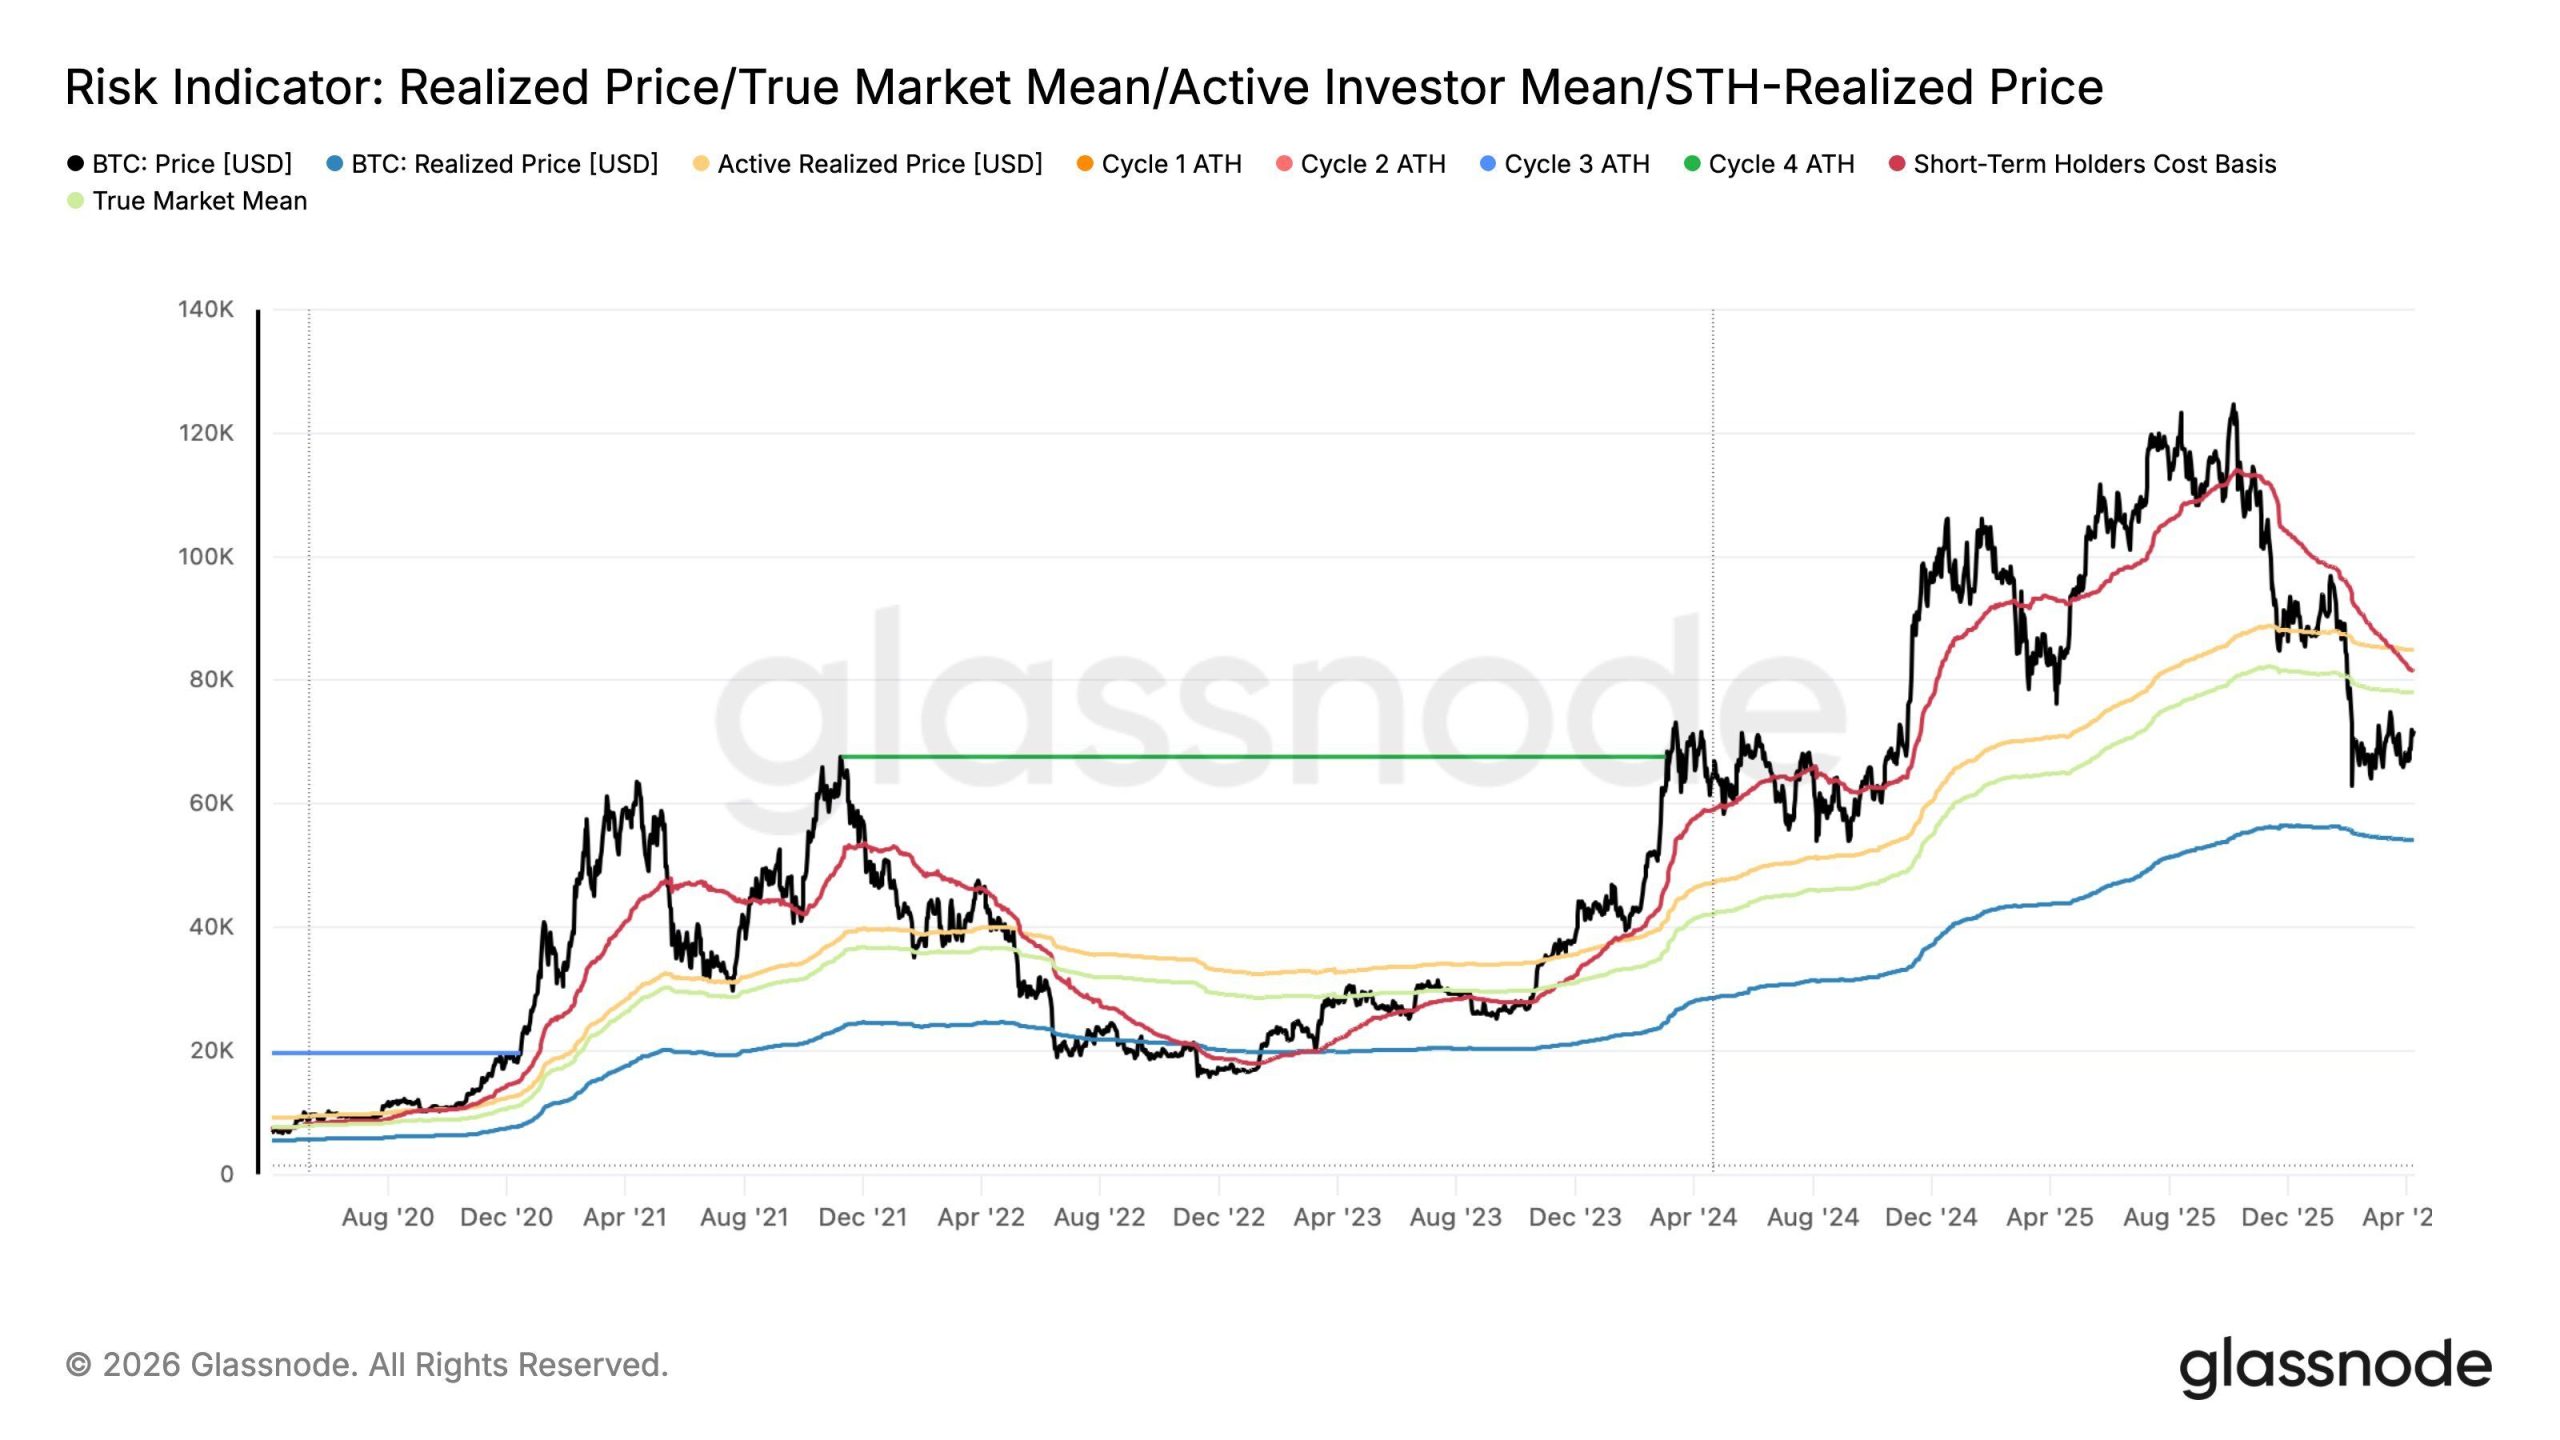
Glassnode’s latest Risk Indicator chart overlays four key on-chain price models against the Bitcoin spot price. Together, these models reveal where the market stands relative to the cost basis of different investor cohorts.
- Realized price — $54,000
The average cost basis of every coin on the network. Bitcoin trading above this level means the average holder is in profit. This is the most fundamental long-term support and is currently well below spot, which is a structurally positive signal.
- True market mean — $82,000
A more refined cost basis weighted by actual economic activity, filtering out dormant coins. Spot is currently below this level, meaning a meaningful portion of active participants are underwater.
- Active investor mean — $88,000
The average cost basis of active market participants. Price trading significantly below this level signals stress among engaged investors and acts as overhead resistance.
- Short-term holder cost basis — ($83–$84,000)
The average entry price for recent buyers (coins held for less than 155 days). With spot well below this level, short-term holders are sitting on unrealised losses — historically a source of continued selling pressure, but also a precondition for a capitulation bottom.
The key takeaway: spot at $70,925 sits above only the realized price and below the three other indicators.
This places Bitcoin in a historically recognized stress zone. Not the deep bear market territory of 2022 (when price fell below even the realized price), but a mid-cycle correction where short-term holders are underwater and overhead supply is significant.
Bitcoin’s Macro Structure In a Key Position
The weekly chart (August 2020 to present) provides the macro technical backdrop.
Bitcoin peaked at approximately $126,000 in October 2025 and has since corrected roughly 43% to current levels.
The current price is retesting the previous cycle’s all-time high from 2021 (~$69,000, yellow line), a level that historically transitions from major resistance into long-term support. This week’s green candle suggests early signs of a defense of that zone.
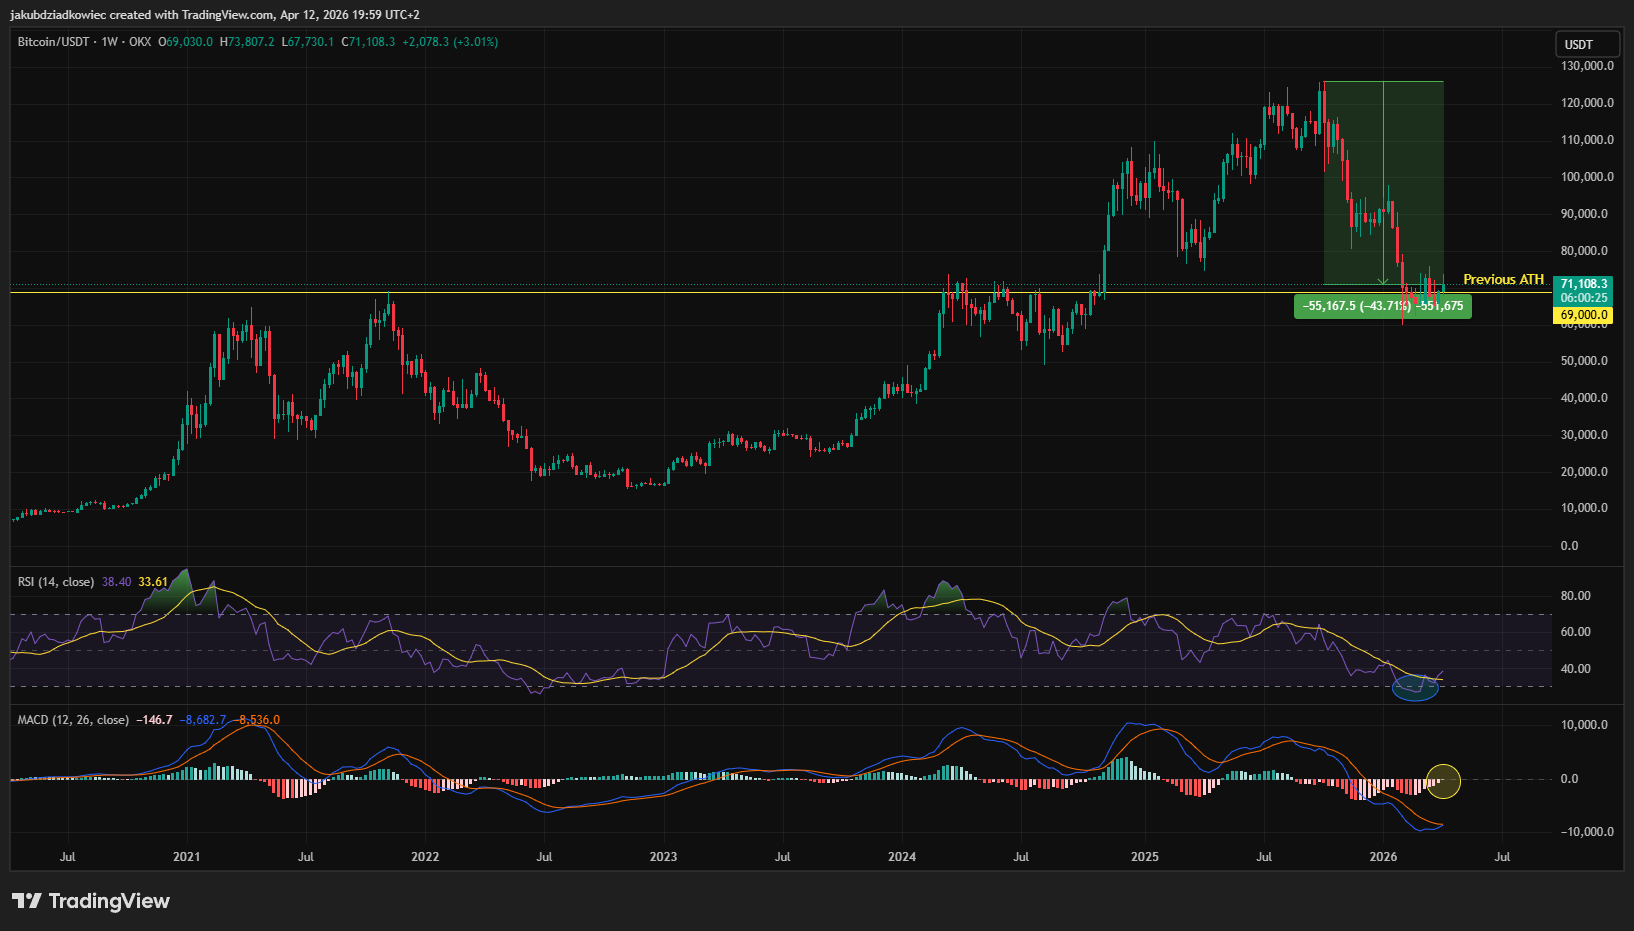
The RSI is right above the oversold territory (below 30) after visiting it for a few weeks in February 2026 (blue ellipse). Historically, the 2022 bear market saw RSI remain deeply oversold for many weeks.
The current reading is approaching those levels, which either signals further downside ahead or that a significant bounce is near. A bullish divergence — price making a lower low while RSI holds higher — would be a meaningful signal to watch.
The MACD is approaching its first bullish crossover (yellow circle) on the weekly chart since May 2025. This is a clear positive signal that has historically led to sharp rallies.
However, during the 2022 bear market, even a bullish MACD crossover failed to trigger a price rebound.
A bullish MACD crossover on the weekly chart would be a high-conviction reversal signal, but it has not yet occurred.
Broken Support, Fragile Crossovers, and a Key Demand Zone
The daily chart (January 2025 to present) provides the shorter-term picture and is where the most actionable signals currently reside.
The green-dotted box on the daily chart, at approximately $73-74,000, represents the March 2024 all-time high. It was a previously important resistance level that briefly became support, and has now been broken to the downside.
This breakdown is technically significant: price is now trading below that structural level, which has flipped into overhead resistance. The February 2026 low around $65,000 remains the key support level below current prices.
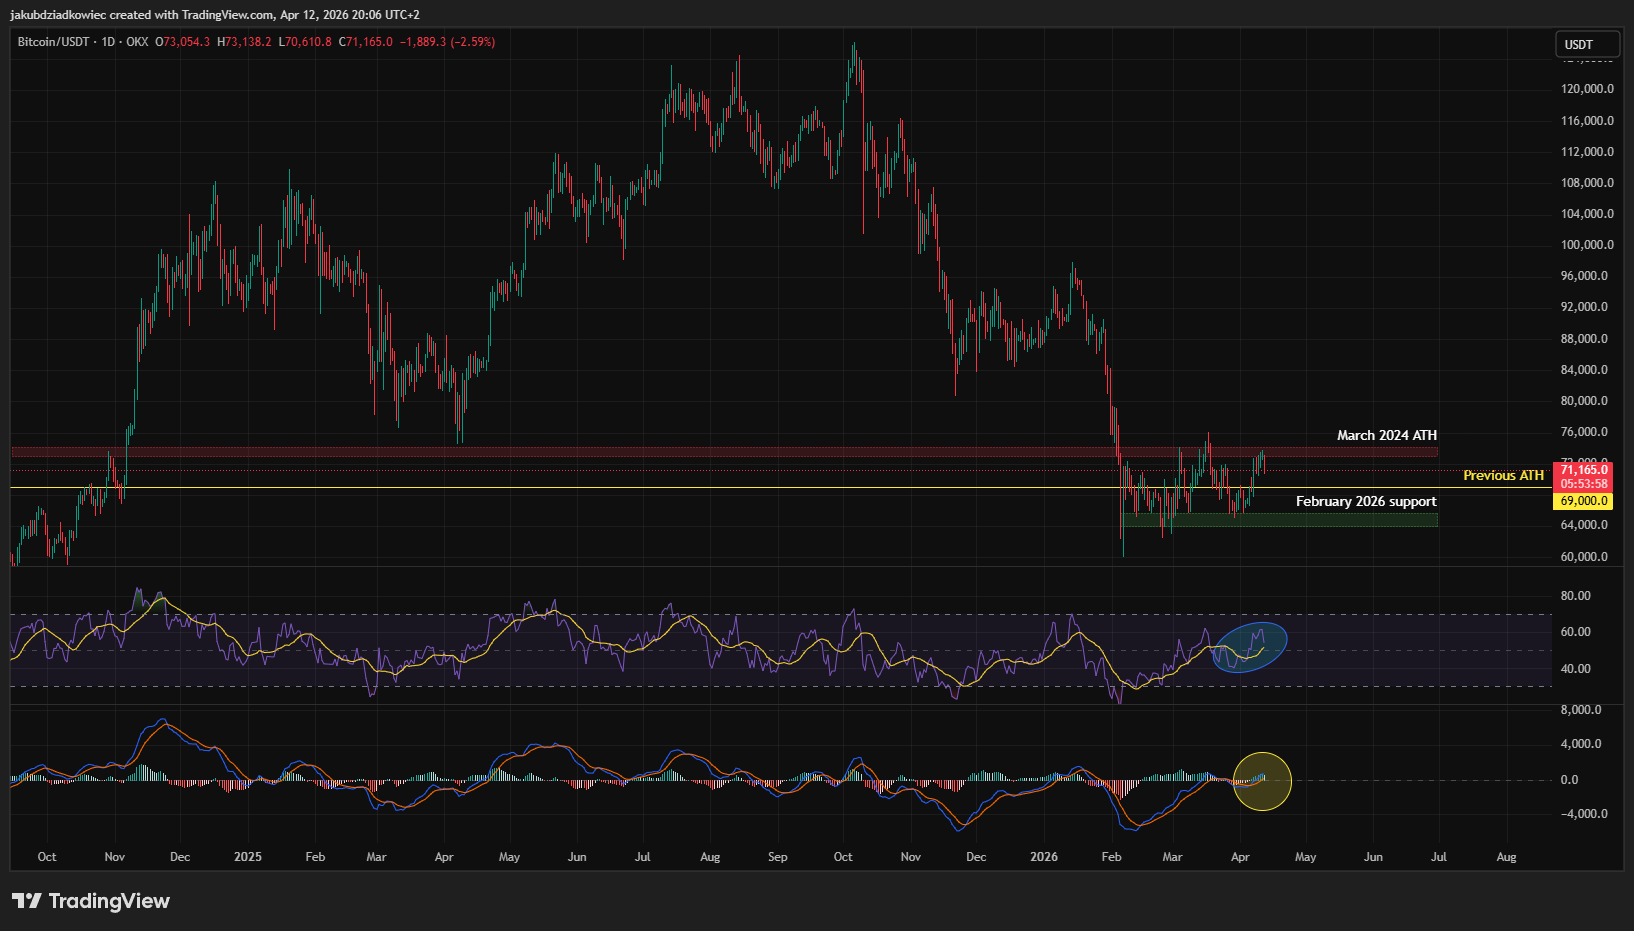
After reaching deeply oversold levels in December 2025 and again in February 2026, the daily RSI has recovered to a neutral mid-40s to low-50s range (blue ellipse).
This suggests panic selling has subsided, but bullish momentum has not yet been confirmed. A move above 60 on the daily RSI would indicate a genuine trend shift.
The daily MACD lines have crossed bullish and are hovering just above zero — a tentative positive signal (yellow circle). The histogram bars are small and mixed, reflecting consolidation rather than directional conviction.
This crossover needs to hold, and the histogram needs to expand into green territory to confirm follow-through buying.
Putting It All Together: Two Scenarios, One Line in The Sand
Combining Glassnode on-chain data with both timeframes of technical analysis yields two scenarios. The levels that confirm or invalidate each scenario are clearly defined.
Bullish Scenario: Mid-Cycle Correction, Continuation Higher
In a bullish scenario, the $69,000 level (previous cycle ATH) holds as support, short-term holders capitulate, and the market resets for a new leg higher:
- Price defends the $69,000 weekly support zone and forms a higher low on the daily chart
- Daily RSI breaks above 60, confirming bullish momentum restoration
- Daily MACD histogram expands into green territory with increasing bar size
- Price reclaims the $73-74,000 level (former support, now resistance) — this is the first key confirmation
- Price then targets the $80-84,000 cluster (True Market Mean + STH Cost Basis) — reclaiming this zone would confirm a bullish trend reversal
- On-chain: STH cost basis reclaimed would mean short-term holders return to profit, removing a key source of selling pressure
Bearish scenario — deeper correction, structural breakdown
In a bearish scenariu overhead supply from underwater short-term holders is too heavy, the $69,000 support fails, and Bitcoin seeks deeper value:
- Price breaks below $69,000 on a weekly close. This is the primary bearish confirmation signal
- Weekly RSI drops below 30 and stays there, mirroring 2022 bear market conditions
- Daily MACD bullish crossover fails, and lines roll back below zero
- Next downside target: $65,000 (February 2026 demand zone) — a break here accelerates selling
- Deeper target: $54,000 (realized price). Historically the zone where bear markets find their ultimate floor
- On-chain: price approaching realized price would represent maximum fear, and historically, the highest-probability long-term entry zone
Overall Assessment: $69,000 is the Line in the Sand
The weight of evidence currently leans cautiously bearish on the short-term but constructive on the medium-to-long term. Bitcoin is in a historically recognized stress zone — below the STH cost basis and the True Market Mean, but well above the realized price floor.
The weekly RSI is approaching oversold territory, and the daily MACD is poised for a bullish crossover, suggesting the worst of the selling may be near, but confirmation has not yet arrived.
The $69,000 level is the line in the sand: hold it, and the bull case builds; lose it on a weekly close, and significantly lower prices become the base case.
The post The Hidden On-Chain Signal That Shows Bitcoin Is Closer to a Bottom Than Most Think appeared first on BeInCrypto.


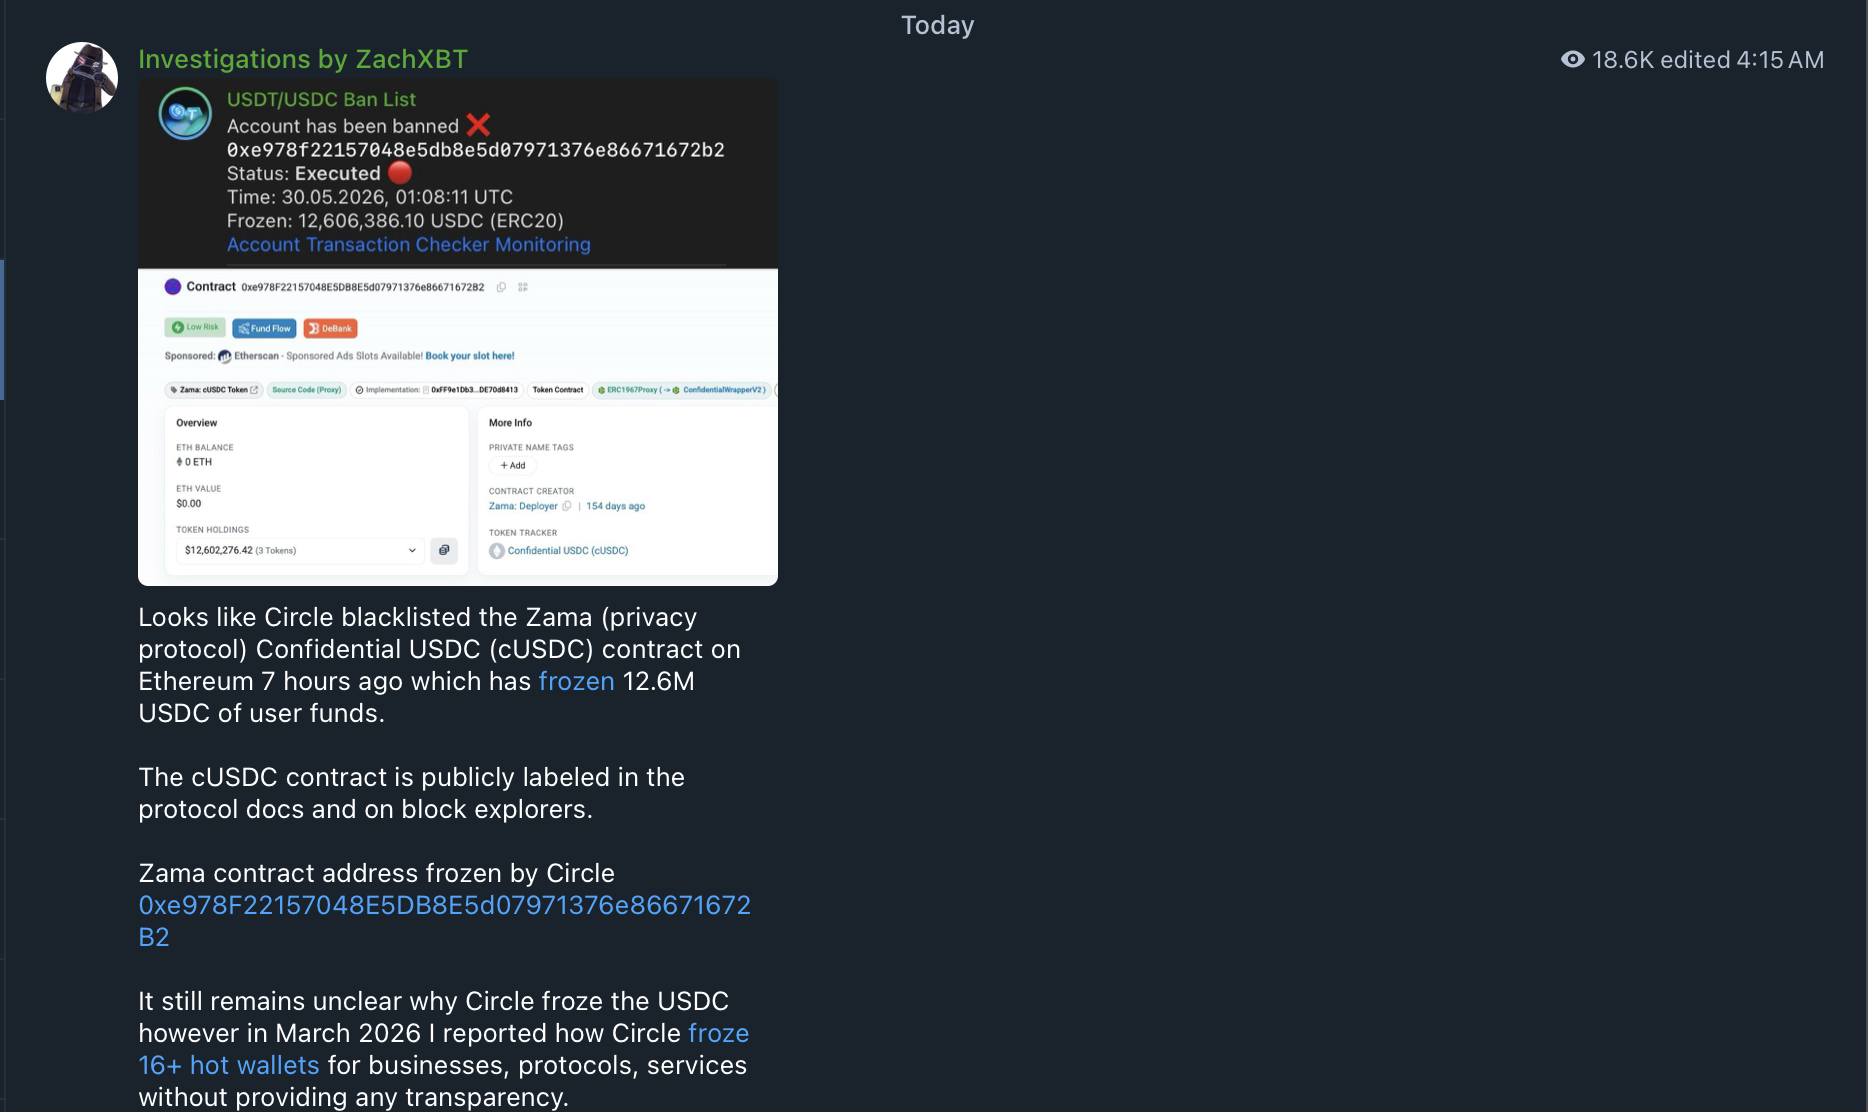
Stablecoin issuer Circle froze $12.6 million in USDC dollar-pegged tokens linked to privacy protocol Zama’s confidential USDC smart contract on Saturday, according to onchain sleuth ZachXBT.
The smart contract is “publicly labeled” on block explorers and the privacy protocol’s technical documentation, ZachXBT said.
The exact reason for the freeze is “unclear,” he said, adding that wallets linked to the Overnight Finance decentralized finance (DeFi) protocol deposited $12.4 million into the Zama protocol on May 11, 2026. He said:
“Overnight Finance held a governance vote recently to distribute treasury funds after holders alleged the team was rug-pulling. Regardless, it’s precedent-setting to unilaterally freeze the contracts or addresses of a protocol where funds have been commingled with Zama users.”
Source: ZachXBT
“From my understanding, the Zama team does not appear to have been notified of the Circle freeze prior,” he said. Cointelegraph reached out to Circle but did not receive a response by the time of publication.
The company has come under fire for failing to freeze funds following major hacks of crypto platforms, and freezing wallets of legitimate crypto projects and protocols without giving those projects prior notice.
Related: Tether freezes over $500M of USDT in 30 days, BlockSec data shows
Circle comes under fire for freezing legitimate user funds, but not stolen crypto
In March, ZachXBT accused Circle of “wrongfully” freezing 16 stablecoin wallets linked to online casinos and legitimate crypto exchanges.
The wallets were frozen in connection with ongoing civil court cases in the United States; however, the businesses and wallets “do not appear related at all,” he said.
He later added that Circle failed to freeze about $420 million in 15 separate cases involving fraudulent transactions or funds stolen through crypto hacks since 2022.
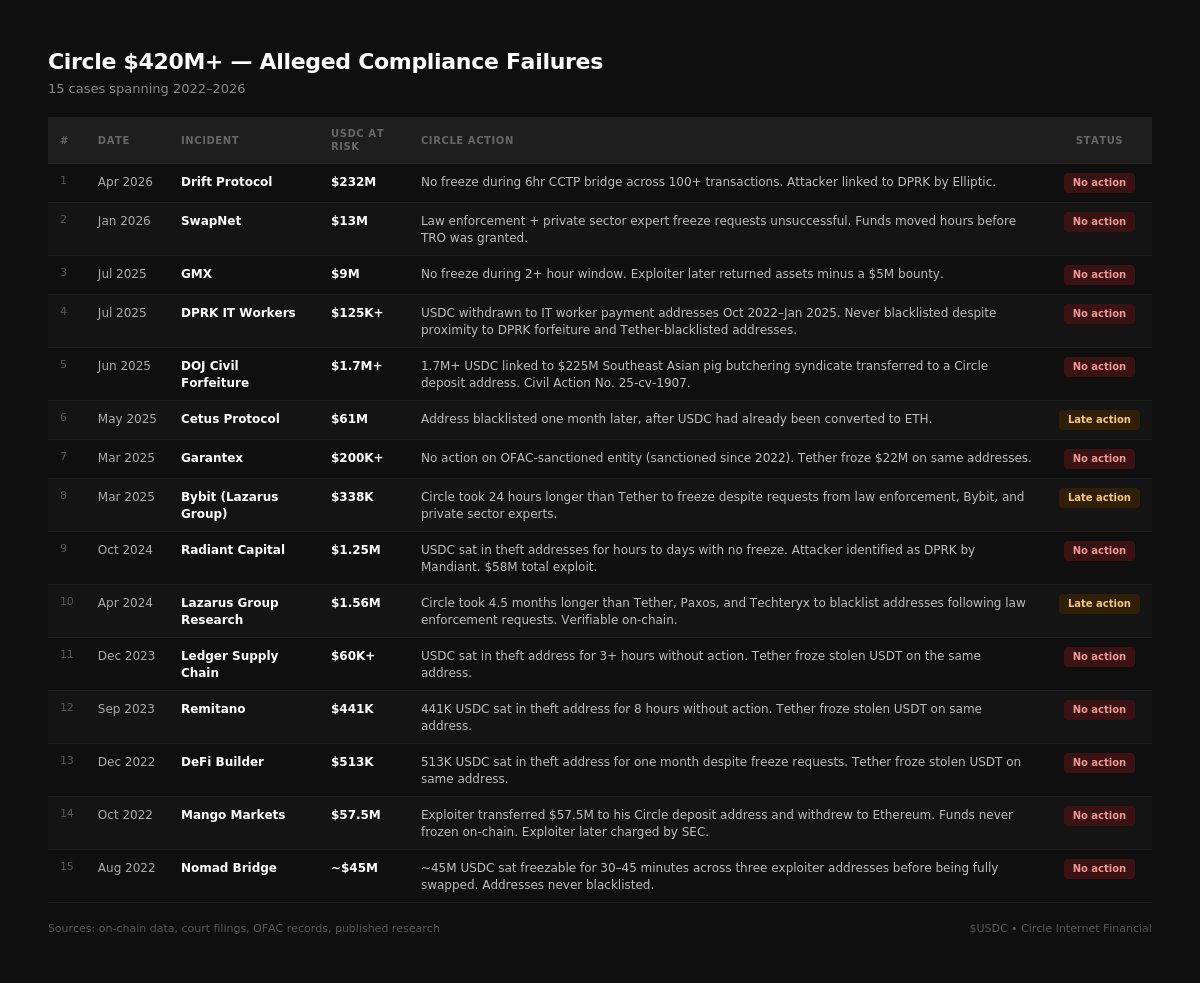
A list of 15 incidents since 2022, in which Circle failed to freeze funds, according to ZachXBT. Source: ZachXBT
These incidents included the failure to freeze $232 million in stolen user funds from the April 2026 Drift Protocol hack, despite having a six-hour window to act, he said.
Following the incident, users filed a class action lawsuit against Circle for failing to freeze the funds, which flowed through Circle’s Cross-Chain Transfer Protocol (CCTP), a bridge that allows assets to move between different blockchain networks.
Magazine: Are DeFi devs liable for the illegal activity of others on their platforms?


Senator Cynthia Lummis said Congress may not get another real chance to pass digital asset legislation until 2030 if the CLARITY Act fails.
Summary
- The CLARITY Act would create federal rules for crypto assets, exchanges, developers, stablecoin issuers, and market regulators.
- JPMorgan CEO Jamie Dimon criticized the bill, saying banks may oppose it unless lawmakers strengthen stablecoin, AML, and BSA rules.
- Senator Cynthia Lummis has warned that U.S. lawmakers may lose their best chance to pass digital asset market rules until 2030 if the CLARITY Act stalls this session.
Lummis, in a post on X, said Congress faces a narrow window to move the Digital Asset Market Clarity Act before election politics and legislative delays push crypto policy further down the agenda. The Wyoming Republican argued that the bill would give crypto developers legal protection while helping law enforcement pursue illicit activity in digital asset markets.
Senate pressure builds over CLARITY Act
Her warning places new pressure on the Senate, where the bill remains short of final passage despite support from both parties. Lummis said developers need clear rules instead of legal uncertainty, while enforcement agencies need a defined framework for digital asset crime.
The CLARITY Act would create a federal structure for crypto oversight in the United States. The bill sets out how digital assets are classified, which regulators supervise them, and what obligations apply to exchanges, developers, and other market participants.
Supporters of the bill, including several crypto firms, say federal rules would help keep digital asset activity in the United States. They argue that companies now face unclear standards and case-by-case enforcement actions.
Senate remains the main hurdle
The House of Representatives has already passed the legislation with bipartisan support. In the Senate, however, lawmakers have debated revisions, stablecoin provisions, banking concerns, and agency authority.
The Senate Banking Committee recently advanced an amended version of the bill in a 15–9 bipartisan vote. The measure still needs enough support to clear the Senate floor, where most major legislation requires 60 votes.
Any Senate changes must also be reconciled with the House version before the bill can reach the White House. Lummis said the timeline matters because the 2026 midterm elections could slow the process and reduce the chance of a final vote.
Banking industry pushes back
JPMorgan Chase CEO Jamie Dimon criticized the current bill during a Fox Business interview. Dimon said banks would oppose the legislation unless lawmakers revise key sections.
According to Dimon, the proposal could allow crypto firms to offer rewards on stablecoin holdings, similar to interest on bank deposits. He said such products should come with stronger legal protections, anti-money laundering controls, and Bank Secrecy Act requirements.
Banks have warned lawmakers that stablecoin rewards could pull deposits away from traditional lenders. Crypto firms, including Coinbase, have told lawmakers that customers should be allowed to receive benefits from regulated digital asset products.
White House support adds pressure
President Donald Trump’s administration has backed the CLARITY Act, according to prior statements from the White House. Treasury Secretary Scott Bessent has also supported digital asset legislation, while SEC Chair Paul Atkins has said Congress can still send a crypto bill to the president.
Federal agencies have continued changing crypto policy through guidance, approvals, and no-action letters. Lummis has argued that agency action alone cannot give markets lasting certainty because future administrations can change those decisions.
Her 2030 warning now frames the CLARITY Act as a test for Congress. If the bill fails, Lummis said developers, exchanges, stablecoin issuers, and enforcement agencies could remain without a durable federal rulebook for years.

The U.S. Securities and Exchange Commission has charged a Cypress, Texas, man with orchestrating a crypto-focused investment fraud that drew roughly $12.3 million from about 150 investors by falsely claiming to operate AI-powered trading bots capable of delivering guaranteed gains. The SEC’s complaint—filed in the U.S. District Court for the Southern District of Texas—names Nathan Fuller and his entities Privvy Investments, LLC, and Gateway Digital Investments, alleging a multi-year scheme that spanned at least October 2022 to mid-2024.
According to the SEC, Fuller promised investors returns of 40% to 50% within 30 to 45 days, with some pushes suggesting guarantees of profits exceeding 100% in as little as 21 days. He purportedly backed these claims by asserting that investor funds were secured by a surety bond, insured by the Federal Deposit Insurance Corporation (FDIC), and protected by a professional liability policy. The SEC contends that none of these assurances were true, and that the marketing hinged on exaggerated, misleading assurances rather than verifiable trading performance.
Key takeaways
- Approximately $12.3 million was raised from about 150 investors through Privvy Investments and Gateway Digital Investments, according to the SEC complaint.
- Fuller allegedly promised outsized short-term returns—40% to 50% in 30–45 days, with some investors told they could secure more than 100% profits in as little as 21 days—based on AI-driven trading bots that allegedly did not function as claimed.
- The marketer claimed funds were secured by a surety bond, FDIC insurance, and professional liability coverage; the SEC alleges these representations were false.
- More than half of the raised funds—at least $6.2 million—were allegedly used for Fuller’s personal expenses, with about $5.5 million diverted to make Ponzi-like payments to earlier investors.
- Investors received fake account statements and fabricated correspondence from fictitious entities to sustain the illusion of activity and profitability.
What the SEC alleges Fuller did and did not deliver
The core of the SEC’s case rests on a pattern of misrepresentation surrounding the use of artificial intelligence in trading. Fuller pitched proprietary AI-based bots that would conduct high-frequency arbitrage across crypto platforms. The complaint asserts that “Fuller’s bots did not function as represented,” undermining the central claim of guaranteed, AI-generated profits. By coupling the purported technology with promised protections like a surety bond and FDIC backing, the scheme sought to reassure risk-averse investors while masking its true operational status.
As described in the complaint, the marketing material allegedly painted an image of automated, professional-grade trading that could produce reliable returns even in volatile markets. The SEC contends that this marketing was designed to obscure the lack of any verifiable trading track record and to maintain liquidity in the scheme as new investors funded the payouts to earlier participants.
Financial flows and investor deception
From a financial perspective, the scheme’s cash movements paint a telling picture of its inner workings. Of the total $12.3 million raised, the SEC says Fuller misappropriated at least $6.2 million for personal use. An additional roughly $5.5 million reportedly went toward Ponzi-like payments to earlier investors, a classic feature used to prop up the illusion of steady returns and to prolong the lifecycle of the scheme. To maintain credibility, Fuller is alleged to have issued fake account statements and created correspondence from non-existent entities, enabling him to present a veneer of legitimacy to unsuspecting participants.
The allegations suggest a deliberate attempt to replicate the quasi-professional aura of legitimate asset management operations while exploiting the credibility of AI branding to entice retail investors. The use of fabricated documents and fictitious entities underscores a broader issue in crypto fraud: the ease with which persuasive presentation can mask actual performance that never materialized.
Regulatory context and what comes next
The Fuller case sits within a broader pattern of enforcement activity at the intersection of AI branding, crypto, and securities-like promises. Earlier this year, the SEC charged three purported crypto asset trading platforms and four investment clubs in a separate $14 million scheme that also leaned on AI branding to lure retail investors, with fraudsters using messaging apps to tout supposed AI-generated trading tips. The concurrent wave of actions illustrates the agency’s heightened focus on AI-enabled misrepresentations within crypto-adjacent investment strategies.
The SEC has signaled a more nuanced approach to crypto enforcement, acknowledging in its enforcement results that some actions over the past years did not always align cleanly with investor harm or traditional securities-law interpretations. In a 2025 update on enforcement, the agency noted that it had brought 95 actions and secured about $2.3 billion in penalties for issues like book-and-record violations that, in some cases, didn’t directly translate into demonstrable investor harm or protection. The regulator’s stance remains in flux as the crypto landscape evolves, particularly with the increasing convergence of AI and digital assets.
In Fuller’s case, the SEC is seeking permanent injunctions, disgorgement of ill-gotten gains, and civil penalties. The action underscores the agency’s willingness to pursue individuals who leverage AI narratives and crypto-like instruments to extract funds from retail investors under false pretenses. The case also serves as a cautionary tale for vendors, brokers, and social platforms that amplify or amplify-signal fraudulent schemes by enabling marketing claims that may misrepresent actual capabilities or protections.
What investors should watch next
As the SEC pursues its case, readers should monitor developments around investor restitution, the timeline for potential settlements or judgments, and the status of Fuller’s operational entities. The broader takeaway for investors is the importance of scrutinizing claims around AI-driven strategies, guarantees of short-term returns, and promised insurance or backing. When a seller makes extraordinary promises tied to technology—especially in a relatively new space where verifiable performance data is scarce—investors should demand concrete, auditable performance records, independent custodians, and clear disclosures about risk and liquidity.
Looking ahead, the industry will likely see continued scrutiny of AI branding in crypto-related solicitations, with regulators seeking clearer boundaries between legitimate automated trading tools and deceptive marketing that implies guaranteed results. For traders and users navigating the space, the message remains: verify, verify again, and rely on independently verifiable performance and regulatory compliance rather than promotional narratives built on AI mystique.
Sources: U.S. Securities and Exchange Commission complaint filed in the Southern District of Texas, SEC enforcement releases, and related reporting on AI-powered crypto marketing schemes.

VanEck has ranked the XRP Ledger (XRPL) as the top corporate blockchain, placing it above JPMorgan’s Kinexys, Coinbase’s Base, and Canton Network. Will this boost The VanEck assessment cites XRPL’s implied market capitalization of approximately $88 billion alongside $47 million in DeFi total value locked (TVL), reflecting early but real liquidity activity on-chain.
What makes the ranking striking is the competition it bests: Kinexys (formerly JPMorgan Onyx) is one of the most mature bank-led blockchain initiatives in existence, processing tokenized deposits and interbank settlement at an institutional scale.

Discover: The Best Crypto to Diversify Your Portfolio
XRP Price Prediction: Can it Ever Hit $3 Again?
XRP price prediction remains under pressure after the latest crypto market pullback, currently stabilizing at the $1.33 range after briefly dipping under $1.30. The chart structure still leans bearish, with lower highs continuing to dominate short-term price action.
Key levels are now clearly defined. Support sits around $1.30, while $1.20 becomes the next downside target if selling accelerates. On the upside, XRP must reclaim $1.50 before bulls can realistically target the psychological $2 level again.
The big question remains whether XRP can revisit $3. In a bullish scenario, renewed ETF momentum, institutional inflows, and crypto recovery could push XRP back toward $2 first, with $3 becoming possible if Bitcoin regains strong momentum.
For now, XRP still has a path back to $3, but the market needs a major catalyst before that conversation becomes realistic again.
Discover: The Best Token Presales
Bitcoin Hyper Targets Early Mover Upside as XRP Tests Key Levels
XRP’s institutional validation story is compelling, but with an $88 billion implied market cap already baked in, the asymmetry available to new entrants is structurally limited. That dynamic is pushing a segment of active traders toward infrastructure plays still in price-discovery mode.
The question isn’t whether XRP is legitimate. It clearly is. The question is where the next 10x actually lives.
Bitcoin Hyper has raised $32 million in presale at a current price of just $0.0136 per $HYPER token. The project’s core proposition is structurally differentiated: it’s the first Bitcoin Layer 2 integrating the Solana Virtual Machine (SVM), delivering sub-second finality and low-cost smart contract execution, on top of Bitcoin’s security layer.
It targets Bitcoin’s three core limitations simultaneously: slow transaction throughput, high fees, and the near-total absence of native programmability. A Decentralized Canonical Bridge handles BTC transfers across the L2, while staking offers high APY for early participants.
To evaluate the full technical case, research Bitcoin Hyper here.
The post XRP Price Prediction: XRPL Beats JPMorgan Kinexys and Coinbase in VanEck’s Ranking appeared first on Cryptonews.


Patrick Hansen, Circle’s EU strategy and policy lead, says the bloc’s crypto tax revenue projections may fall short. The European Commission has modeled up to $23 billion across the 2028 to 2034 EU budget cycle.
Hansen argued that a transaction-based crypto tax would push users toward DeFi protocols. Self-custody wallets and non-EU venues would erode the centralized exchange volume Brussels expects to capture.
What the Commission’s Proposal Includes
The leaked Commission services paper outlines two crypto tax models for member states to consider:
- A 0.1% levy on the value of crypto transactions could generate $3.5 billion to $4.7 billion per year.
Crypto-asset service providers (CASPs) would act as collection and reporting points.
- A separate capital gains tax on realized crypto profits would raise an estimated $1.2 billion to $2.8 billion annually.
Combined, the two options could yield close to $23 billion across the seven-year EU budget. Officials acknowledge the figures depend on market volatility.
The paper signals that stablecoins used as payments would likely fall outside the transaction levy.
Capital gains taxation generally would not apply to dollar-pegged tokens either, given their minimal price movement.
Why Hansen Thinks the Forecast Misses
Hansen pointed to three structural weaknesses in the modeling:
- Reliable data from DAC8, the EU’s crypto reporting framework, will only arrive from 2027. Early estimates rest on incomplete inputs.
- The proposal also requires unanimous Council approval and a harmonized EU tax base.
France has pushed hardest for new EU revenue sources. Crypto tax compliance burdens and resistance from exchange-heavy economies like Malta could harden opposition.
- The behavioral risk looms largest, according to Hansen.
Users facing a centralized exchange levy can move activity to self-custody wallet options, DeFi protocols, or non-EU platforms. Any transaction tax depends on that volume.
“Any transaction-based crypto tax would likely accelerate migration towards non-taxed channels…and/or non-taxed assets…In practice, imo, that would significantly reduce the revenue potential on which these projections are based,” he stated.
Cyprus, which holds the rotating Council presidency, plans to share a revised budget proposal around June 10.
The outcome will signal whether crypto stays on the menu, and how it interacts with the bloc’s MiCA review consultation.
The post $23 Billion EU Crypto Tax Forecast Draws Pushback From Circle Policy Lead appeared first on BeInCrypto.

The UK has targeted 18 crypto platforms, banks, and financial networks used by the Kremlin-backed “A7” payment network to bypass international economic restrictions.
The sanctioned entities are accused of processing more than $90 billion in 2025 to fund Russia’s invasion of Ukraine.
Crypto Platforms Linked to Illicit Russian Flows
A TRM Labs report reveals that Huobi, Exmo Exchange, Bitpapa, and Rapira Group were some of the targeted exchanges, with Huobi alone sending more than $4.9 billion in on-chain transactions to UK-sanctioned entities and the A7 network since 2021. Additionally, $1.13 billion of this occurred 14 months after the March 2025 takedown of Russian crypto exchange Garantex, with $838 million directed specifically to the A7 network last year.
According to TRM’s findings, the crypto activity associated with Russia did not slow down after the Garantex collapse but was instead migrated to successor exchanges and payment platforms like Rapira, Aifory Pro, Grinex.io, and ABCex. Exmo exchange is said to have directly transacted over $19.5 million with sanctioned entities like Garantex and Chatex, while BitPapa was also reported to have transferred millions to these actors.
The report notes that Rapira moved more than $543 million, including $375.6 million tied to Grinex.io, while Aifory Pro transferred over $189 million, of which $175.2 million was attributed to ABCex. Meanwhile, ABCex itself recorded $355 million in transactions across the restricted firms, sending $175.2 million to Aifory Pro, $133.4 million to Garantex, and $38.1 million to Rapira.
The government has now added all 18 sanctioned entities to the UK Consolidated List, with businesses operating in the country now required to freeze any assets connected to them and block transactions involving the listed companies.
“If the Kremlin thinks it can evade our sanctions by hiding behind crypto networks and shadow financial systems, it is gravely mistaken,” said the Foreign Secretary Yvette Cooper.
She added that the restrictions were being made to cut off the financial flows sustaining Putin’s war in Ukraine.
Russia-Related Illicit Crypto Activity Has Rebounded
The new measures also extend to target individuals linked to the A7 network. In its report, the government says that the group is backed by a Kyrgyz bank suspected of processing payments within the system, alongside a major global crypto exchange that is believed to have transferred more than $1.5 billion back into Kremlin-linked financial channels.
Meanwhile, a separate TRM Labs analysis discovered that illicit crypto activity went up sharply last year. According to the company, most of that was related to Russian-linked trades, with A7’s A7A5 token contributing $72 billion worth of trades alone while the group’s own wallets accounted for another $39 billion. Most of that money reportedly flowed through Garantex and Grinex.
The post UK Sanctions 18 Crypto Firms Tied to Russia’s $90B War Network appeared first on CryptoPotato.
Crypto World
SEC sues Texas man over $12.3 million alleged crypto scheme built on fake AI trading bots


The U.S. Securities and Exchange Commission (SEC) has sued Texas resident Nathan Fuller, alleging he raised about $12.3 million from roughly 150 investors through a crypto investment scheme built around false claims of AI-powered trading bots, guaranteed returns and insurance protections.
According to a complaint filed in the U.S. District Court for the Southern District of Texas, Fuller operated through Privvy Investments LLC and the assumed business names Privvy Investments and Gateway Digital Investments.
The SEC says he sold passive joint-venture interests in a purported crypto arbitrage trading operation from at least October 2022 through mid-2024.
The agency claims that Fuller told investors that proprietary AI-based trading bots could scan crypto markets, execute high-frequency arbitrage trades and limit losses through stop-loss coding.
The complaint alleges investors were promised returns of 40% to 50% within 30 to 45 days and, in some cases, exceeding 100% in less than a month.
The SEC says those representations were false. According to the complaint, only about $380,000, or roughly 3% of investor funds, was used to purchase cryptocurrency without the involvement of bots. The agency says those trades were conducted without the advertised bots and generated no profits.
Fuller, instead, allegedly misappropriated at least $6.2 million for personal expenses, including the purchase of a home, gambling, travel and vehicles, while using about $5.5 million to make “Ponzi-like payments” to investors.
As withdrawal concerns grew, the complaint says, Fuller created fabricated account statements showing gains, referenced fictitious entities, and used artificial intelligence to generate a letter from a purported auditing firm claiming investor accounts were under review and would later be liquidated into a trust.
The SEC charged Fuller with violating the registration and antifraud provisions of federal securities laws and is seeking permanent injunctions, disgorgement, civil penalties and a ban on participating in securities offerings.
The case follows a separate bankruptcy proceeding in which the Justice Department said Fuller was denied discharge of more than $12.5 million in debt after admitting he operated Privvy as a Ponzi scheme and fabricated documentation, according to court records cited by the DOJ.
Hyperliquid (HYPE) should be valued against the $600 trillion global asset market, not crypto’s $3 trillion universe. That is the case Bitwise Chief Investment Officer Matt Hougan made for the fast-growing perpetual futures platform.
Hougan said BHYP, Bitwise’s spot Hyperliquid ETF, has pulled in close to $60 million since its mid-May NYSE debut. He called it the strongest single-asset crypto ETP launch since Bitcoin.
Bitwise CIO Says Hyperliquid Is a Gen 2 Token
Hougan said HYPE differs from prior exchange tokens. The platform routes nearly all trading fees into buybacks.
“I think it’s going to take investors a while to realize that this is a Gen 2 token. Like it’s a new version. It’s not like the past,” he noted during a Friday interview with Nate Geraci.
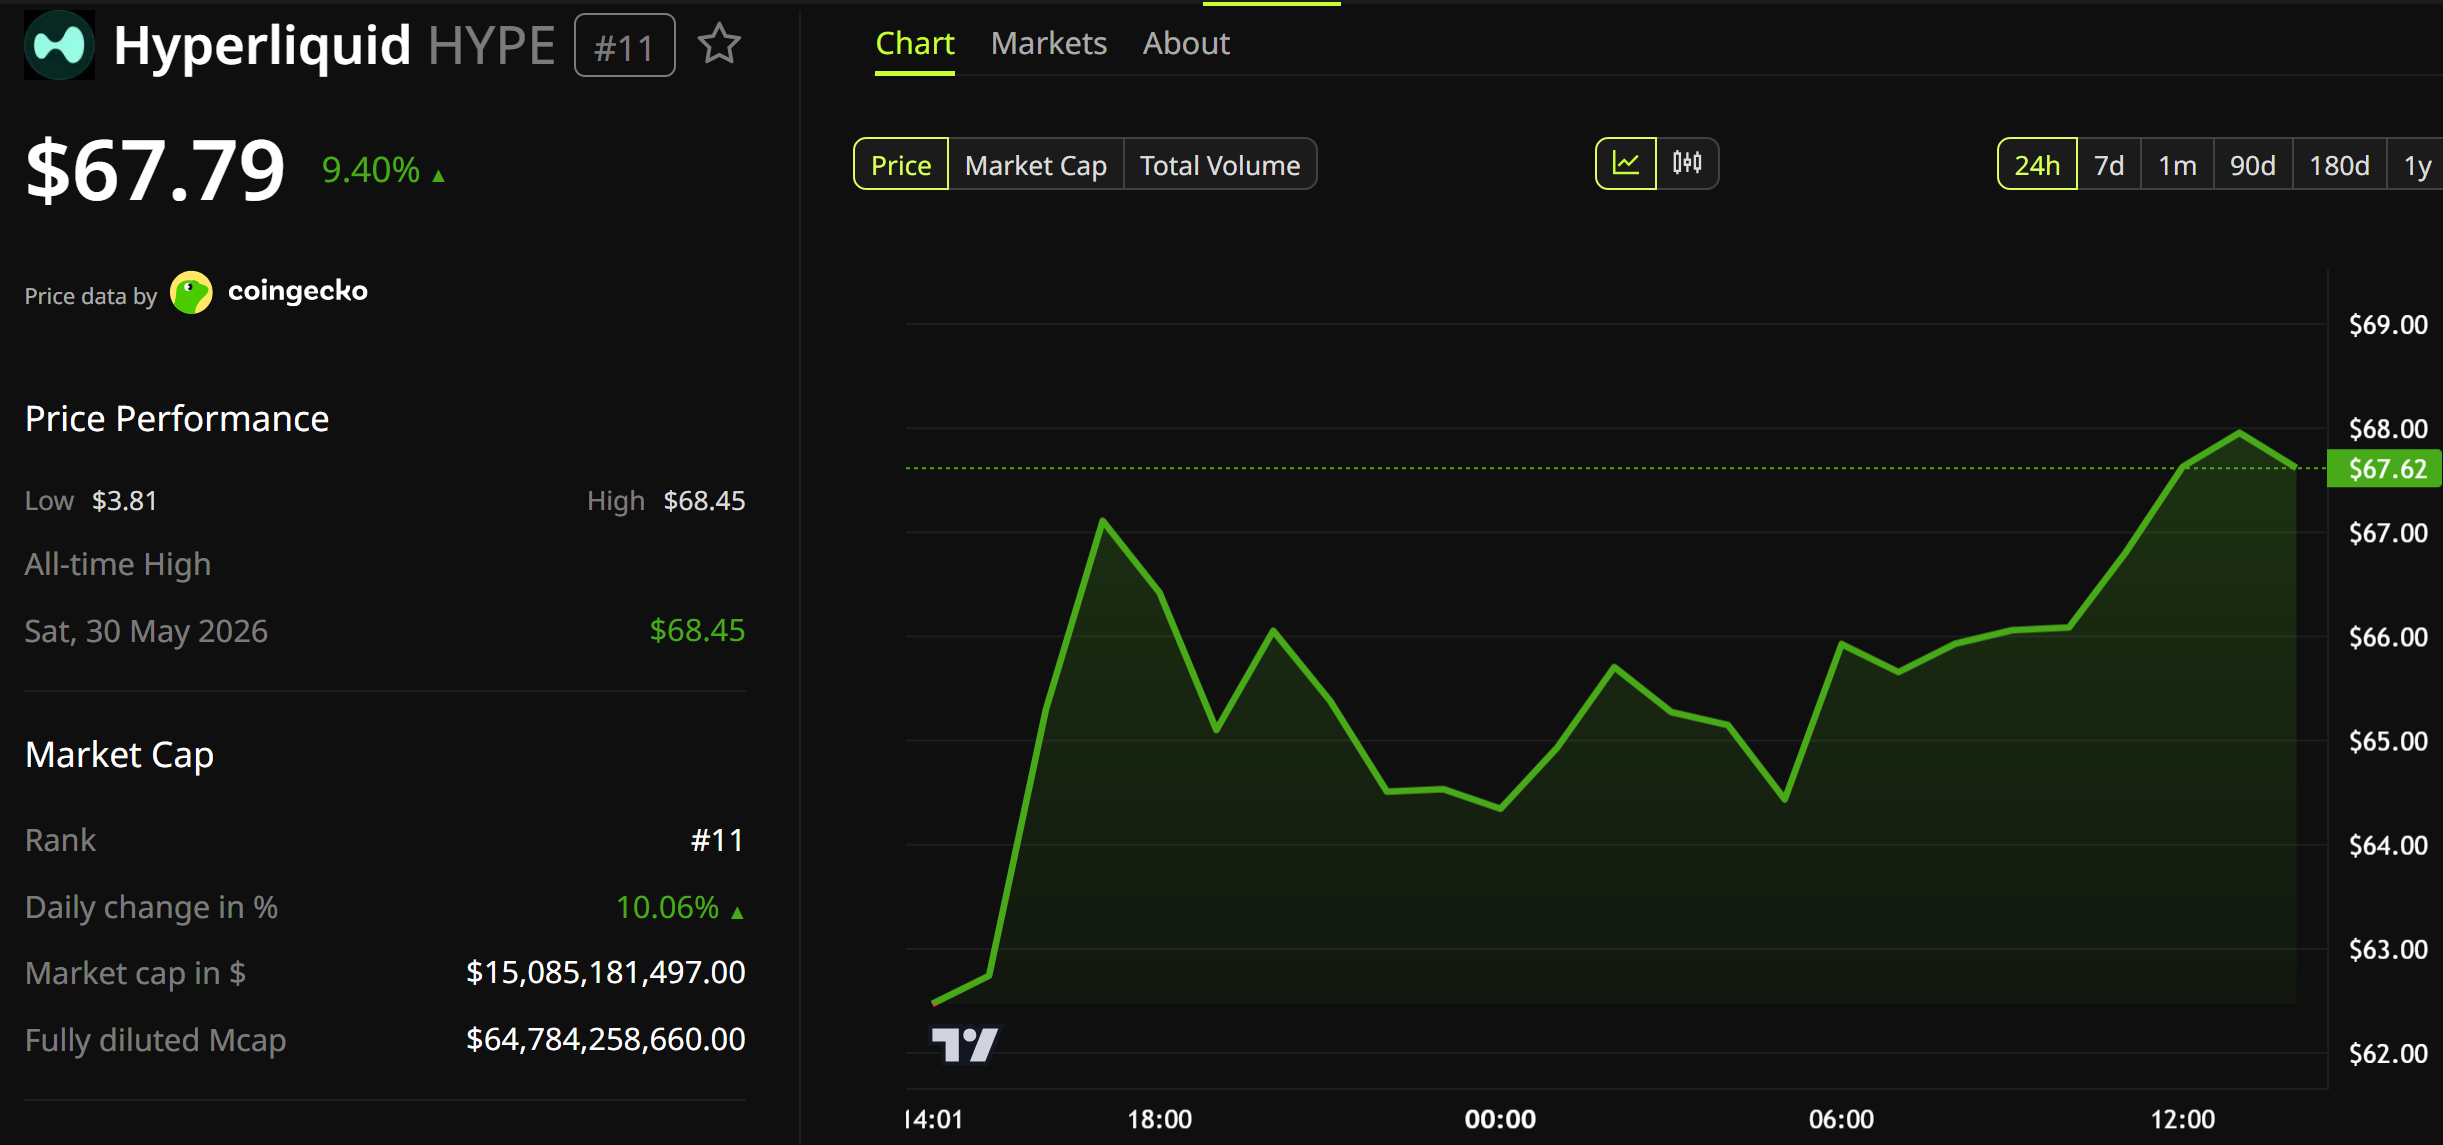
HYPE traded near $68 on Saturday, up 10% in 24 hours. It ranked 11th by market cap, per BeInCrypto data.

Subscribe to our YouTube channel to watch leaders and journalists provide expert insights
Why Hyperliquid Targets $600 Trillion in Assets
Hougan framed Hyperliquid as a fintech application, not a crypto play.
“This is not a crypto app. This is a financial app that uses crypto in the back end to create a new financial experience that in many ways is better than the traditional system.”
He said non-crypto assets like S&P 500 perpetuals and oil already make up half of perpetuals volume.
“Already today, Nate, about 50% of the volume is in non-crypto assets. I think that will eventually be 90% plus of the volume.”
Competition and US Access Remain Open Risks
Hougan acknowledged execution risk. He named the NYSE, the CME and rival DeFi protocols as preparing to challenge Hyperliquid.
“…there is going to be significant competition for Hyperliquid in the future, and there is no guarantee that it will win.”
US investors still cannot trade directly on the offshore exchange. The BHYP ETF stakes about 70% of holdings using Bitwise’s own infrastructure.
The firm also routes 10% of management fees into HYPE held on its balance sheet.
The post Bitwise Leader Thinks Hyperliquid is Bigger Than the Crypto Market appeared first on BeInCrypto.
Crypto World
Top 3 Cryptos That Could Deliver Bigger Gains Than Ripple (XRP) Did in the Last Bull Run

Many investors still remember watching XRP explode during past bull runs and feeling they entered too late. That’s why traders are now searching for projects that still look early before the broader market fully heats up again. Some meme coins have already made their biggest move. Others are only starting to build momentum quietly in the background. And in crypto, timing often matters just as much as the project itself. Here are three cryptos traders are watching closely as they hunt for the next major breakout opportunity.
One of the hardest parts of crypto investing is realizing the biggest returns usually happen before everyone agrees a project is real. That realization is part of why Little Pepe (LILPEPE) is beginning to stand out among traders seeking earlier-stage opportunities rather than chasing established meme ecosystems. Unlike many meme projects built purely around attention, Little Pepe is developing its own Layer-2 blockchain focused on ultra-fast transactions, low fees, and infrastructure specifically designed for meme coin activity. LILPEPE is currently priced at $0.0022 in Stage 13, with more than $28 million already raised and the current stage nearing completion. For many investors, the appeal is not just the meme’s branding, but the idea of entering before broader exchange exposure begins. The project has also leaned heavily into community engagement through its ongoing $777,000 giveaway campaign and the Mega Giveaway running between Stages 12 and 17, where both large buyers and random participants remain eligible for rewards exceeding 15 ETH. For traders who missed earlier meme cycles entirely, that feeling of being too late again is exactly what makes projects like Little Pepe difficult to ignore right now.
Pudgy Penguins (PENGU): Can the Momentum Continue After the First Big Rally?
Pudgy Penguins is holding steady at about $0.0102, even after some dips last month.
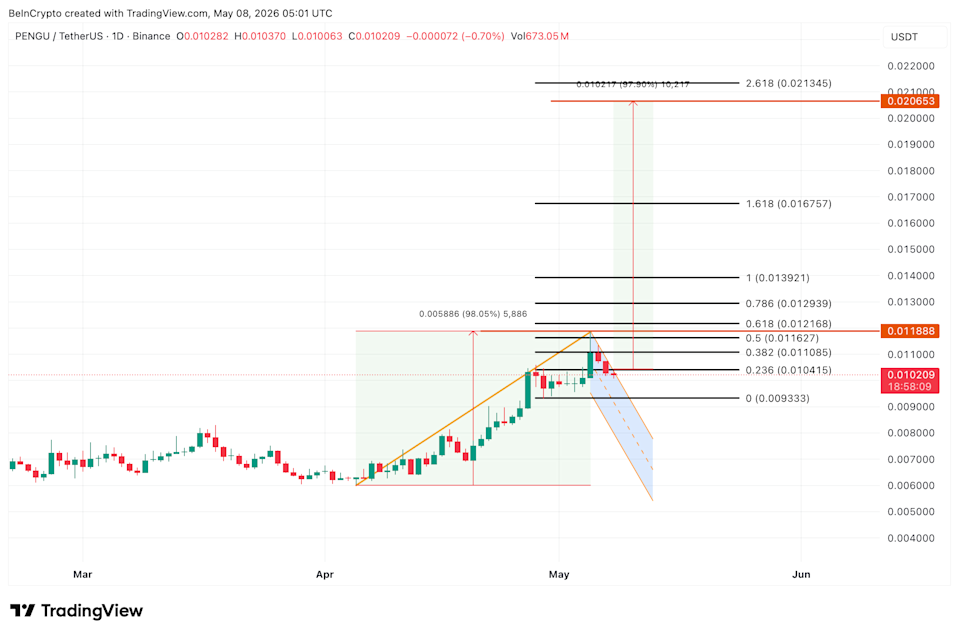
Pudgy Penguins Price Analysis: TradingView
For many traders, this is where the hesitation begins. Nobody wants to buy the top after watching a token already rally nearly 100% in a short period. But PENGU’s chart is still giving traders something to watch. The recent move toward $0.0118 created a bullish pole-and-flag setup. In simple terms, the strong rally formed the pole, while the current sideways consolidation may simply be the market cooling off before another move higher. The setup only becomes convincing if PENGU cleanly reclaims $0.0104 and breaks above $0.0110 again. If that happens, traders are already watching potential upside targets near $0.0121 and $0.0129. Some projections even point toward $0.0206 if meme coin momentum accelerates again.

Bonk (BONK): Solana’s Meme Economy Is Starting to Heat Up Again
Bonk trades near $0.0000068 and is beginning to attract attention again as activity returns across Solana’s meme ecosystem.
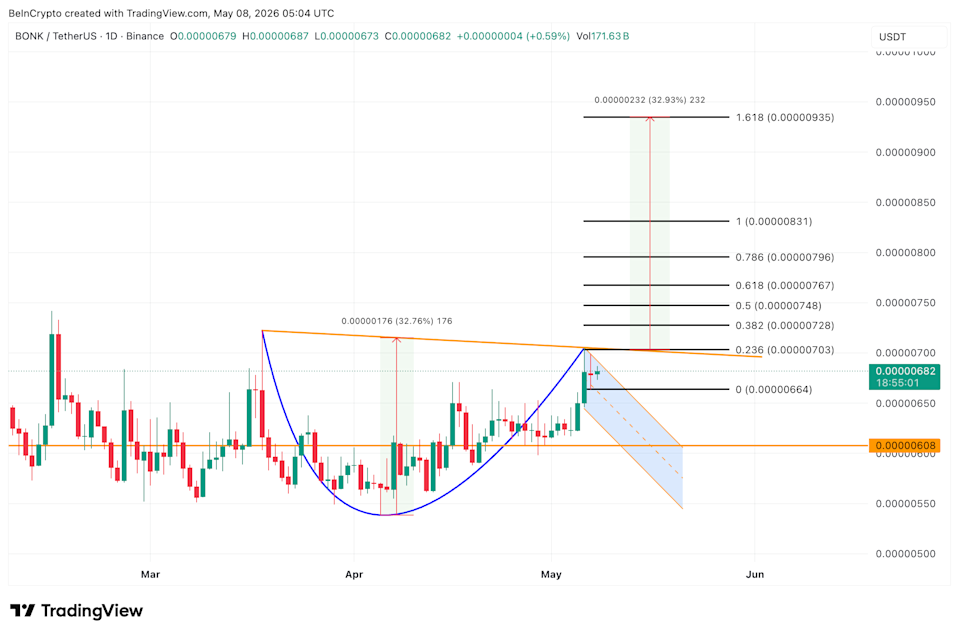
BONK Price Analysis: TradingView
Many traders missed BONK’s first major breakout because they assumed Solana meme coins had already peaked. But recent market activity suggests capital may be slowly rotating back into that sector. The chart is also looking interesting. If BONK closes above that mark, it’s got room to run up to $0.0000093, which would mean a jump of about 33% from where it is now. That may not sound life-changing compared to LILPEPE, but as long as Solana meme activity continues improving, BONK may remain one of the first places meme capital flows back into.
Conclusion
XRP’s previous bull run reminded the market how quickly crypto wealth can be created when momentum, timing, and community align. Now traders are searching for the next wave before it fully arrives. PENGU is trying to prove its first rally still has room left. BONK is benefiting from renewed activity across Solana’s meme ecosystem. And Little Pepe (LILPEPE) is attracting the attention of investors who no longer want to wait until projects become mainstream before investing.
For more information about Little Pepe (LILPEPE) visit the links below:
Website: https://littlepepe.com
Whitepaper: https://littlepepe.com/whitepaper.pdf
Telegram: https://t.me/littlepepetoken
Twitter/X: https://x.com/littlepepetoken
$777k Giveaway: https://littlepepe.com/777k-giveaway/
Disclaimer: This is a Press Release provided by a third party who is responsible for the content. Please conduct your own research before taking any action based on the content.

Crypto World
Wintermute Starts Quoting Prediction Markets as Event-Contract Volume Tops $60B in 2026


Wintermute, a London-based algorithmic trading firm with more than $3.5 trillion in annual trading volume, said on Friday it is now providing two-sided liquidity on prediction markets, becoming the latest institutional market maker to plug into a sector that has cleared more than $60 billion in… Read the full story at The Defiant

Vikings hire Seahawks assistant Nolan Teasley as their general manager, AP source says

Meta is reportedly developing an AI pendant

41 Must-Watch TV Shows on Hulu Right Now (May 2026)


-

 Business6 days ago
NYT Strands Answers May 24 2026 Revealed for Puzzle No. 812 Theme Summer Essentials
-

 NewsBeat3 days ago
Israel says it has killed new Hamas military leader in Gaza City airstrikes
-

 Politics5 days ago
Bridgerton Season 5: Cast, Release Date And Everything We Know So Far
-

 Business4 days ago
Selena Gomez Reportedly Upset Over Benny Blanco’s Comments on Her ‘Terrible’ Diet
-
 Crypto World4 days ago
Micron Crosses $1 Trillion Market Cap as AI Demand Reshapes Memory Sector
-

 Business5 days ago
BTS Sells Out Four Las Vegas Shows at Allegiant Stadium for ARIRANG World Tour
-

 Tech5 days ago
Microsoft’s quiet Claude Code retreat and the real cost of enterprise AI
-
 Tech5 days ago
China assigns ID codes to 28,000+ humanoid robots
-

 News Videos4 days ago
XRP *JUST* SUCCEEDED!!!! CLARITY ACT EXPOSED!!! (SHE EXPOSED IT)
-

 Tech2 days ago
Waymo dominates autonomous vehicle registrations as Tesla trails behind
-
Tech3 days ago
The Samsung pay deal is the moment Korean unions changed register
-

 Tech5 days ago
Westone Audio and Etymotic Acquired by Fidelity Collective in Major IEM Market Move
-
Crypto World6 days ago
Brian Armstrong Outlines Crypto Vision for the Future Financial System
-

 Tech4 days ago
Millions of AI agents imperiled by critical vulnerability in open source package
-
Crypto World3 days ago
SpaceX’s $2 Trillion IPO: Why Tech Giants Nvidia (NVDA), Apple (AAPL), and Microsoft (MSFT) May Face Pressure
-
 Entertainment5 days ago
‘Breaking Bad’ Star’s Easy-to-Binge 6-Part Crime Series Spin-Off Is Finally Heading to Free Streaming
-
 Crypto World5 days ago
Nvidia (NVDA) CEO Calls on Super Micro to Strengthen Export Controls Amid Smuggling Probe
-

 Tech4 days ago
NASA taps Blue Origin to deliver lunar rovers for Moon Base initiative
-
 NewsBeat5 days ago
Hottest May day ever as London hits 34.8C in 2C leap from previous records
-
 Crypto World1 day ago
Snowflake (SNOW) Stock Rallies on Strong Q1 Results and AI Product Growth
You must be logged in to post a comment Login