

Crypto World
The Real Edge in DeFi Trading
Decentralized finance has a reputation for fast money, explosive yields, and dramatic price swings. Social feeds amplify entry signals, token calls, and screenshots of 10x gains. But beneath the noise lies something far more consistent — and far less glamorous.
The real edge in DeFi trading isn’t a secret indicator.
It’s an understanding structure.
DeFi Is a System of Incentives
Unlike traditional markets, decentralized finance runs on programmable incentives. Protocols aren’t just marketplaces — they are engineered ecosystems designed to attract, direct, and reward capital.
Capital flows based on:
When emissions are high, liquidity floods in. When rewards decline, capital rotates out. Price movements often follow these structural changes more than narratives or social sentiment.
In other words, DeFi participants — especially yield farmers — respond to return optimization, not brand loyalty.
If you track incentives, you track liquidity migration.
Liquidity Is More Important Than Price
Most retail traders focus on price charts. But in DeFi, liquidity is often the more critical variable.
Liquidity determines:
-
Slippage severity
-
Volatility intensity
-
Liquidation cascades
-
Manipulation risk
Thin liquidity environments amplify volatility. Large trades move markets aggressively. Stop losses get hunted. Liquidations cascade faster.
Deep liquidity environments, on the other hand:
Experienced traders look for liquidity pockets, not just price patterns. Because large players target liquidity zones — that’s where capital can enter or exit efficiently.
Volatility Is Often Engineered
In decentralized finance, volatility isn’t always organic. It is frequently linked to:
A major unlock can introduce supply pressure. A change in staking yield can alter token demand. A governance proposal can shift long-term value capture assumptions.
When traders understand these structural drivers, they can anticipate moves before charts fully reflect them.
The Role of Automated Systems
In DeFi, you are not trading against human emotion alone. You are interacting with:
-
Automated Market Makers (AMMs)
-
Liquidation bots
-
MEV (Maximal Extractable Value) searchers
-
Arbitrage algorithms
-
Yield optimization strategies
These systems operate on logic, not feelings. They react instantly to mispricings and inefficiencies.
If you do not understand how automated liquidity pools price assets or how liquidations are triggered, you are exposed to risks invisible on a standard chart.
Studying protocol mechanics often provides more edge than studying technical indicators.
Tokenomics Over Hype
Many DeFi tokens struggle not because the product fails, but because the token design is misaligned.
Critical factors include:
High emissions with low utility create sales pressure. Weak value capture models disconnect the token price from protocol revenue.
Understanding tokenomics helps determine whether appreciation is structurally supported — or temporarily subsidized.
Risk Management: The Unpopular Advantage
The most consistent performers in DeFi often rely on fundamentals that are not exciting:
-
Strict position sizing
-
Diversification across protocols
-
Tracking unlock calendars
-
Monitoring treasury and whale wallets
-
Entering during forced selling events
-
Exiting during peak incentive periods
DeFi markets can reward boldness, but they punish recklessness.
Volatility can multiply gains — or erase capital quickly. Sustainable trading requires structure, not adrenaline.
The Real “Hidden Secret”
There is no mystical alpha channel.
The consistent edge in decentralized finance comes from understanding:
DeFi is programmable finance. Its behavior is shaped by design.
Traders who study the architecture — not just the candles — operate with informational clarity. Those who trade only momentum often become liquidity for those who understand the system.
In the end, decentralized finance rewards structural awareness more than prediction.
And that’s the closest thing to a secret it has.
REQUEST AN ARTICLE

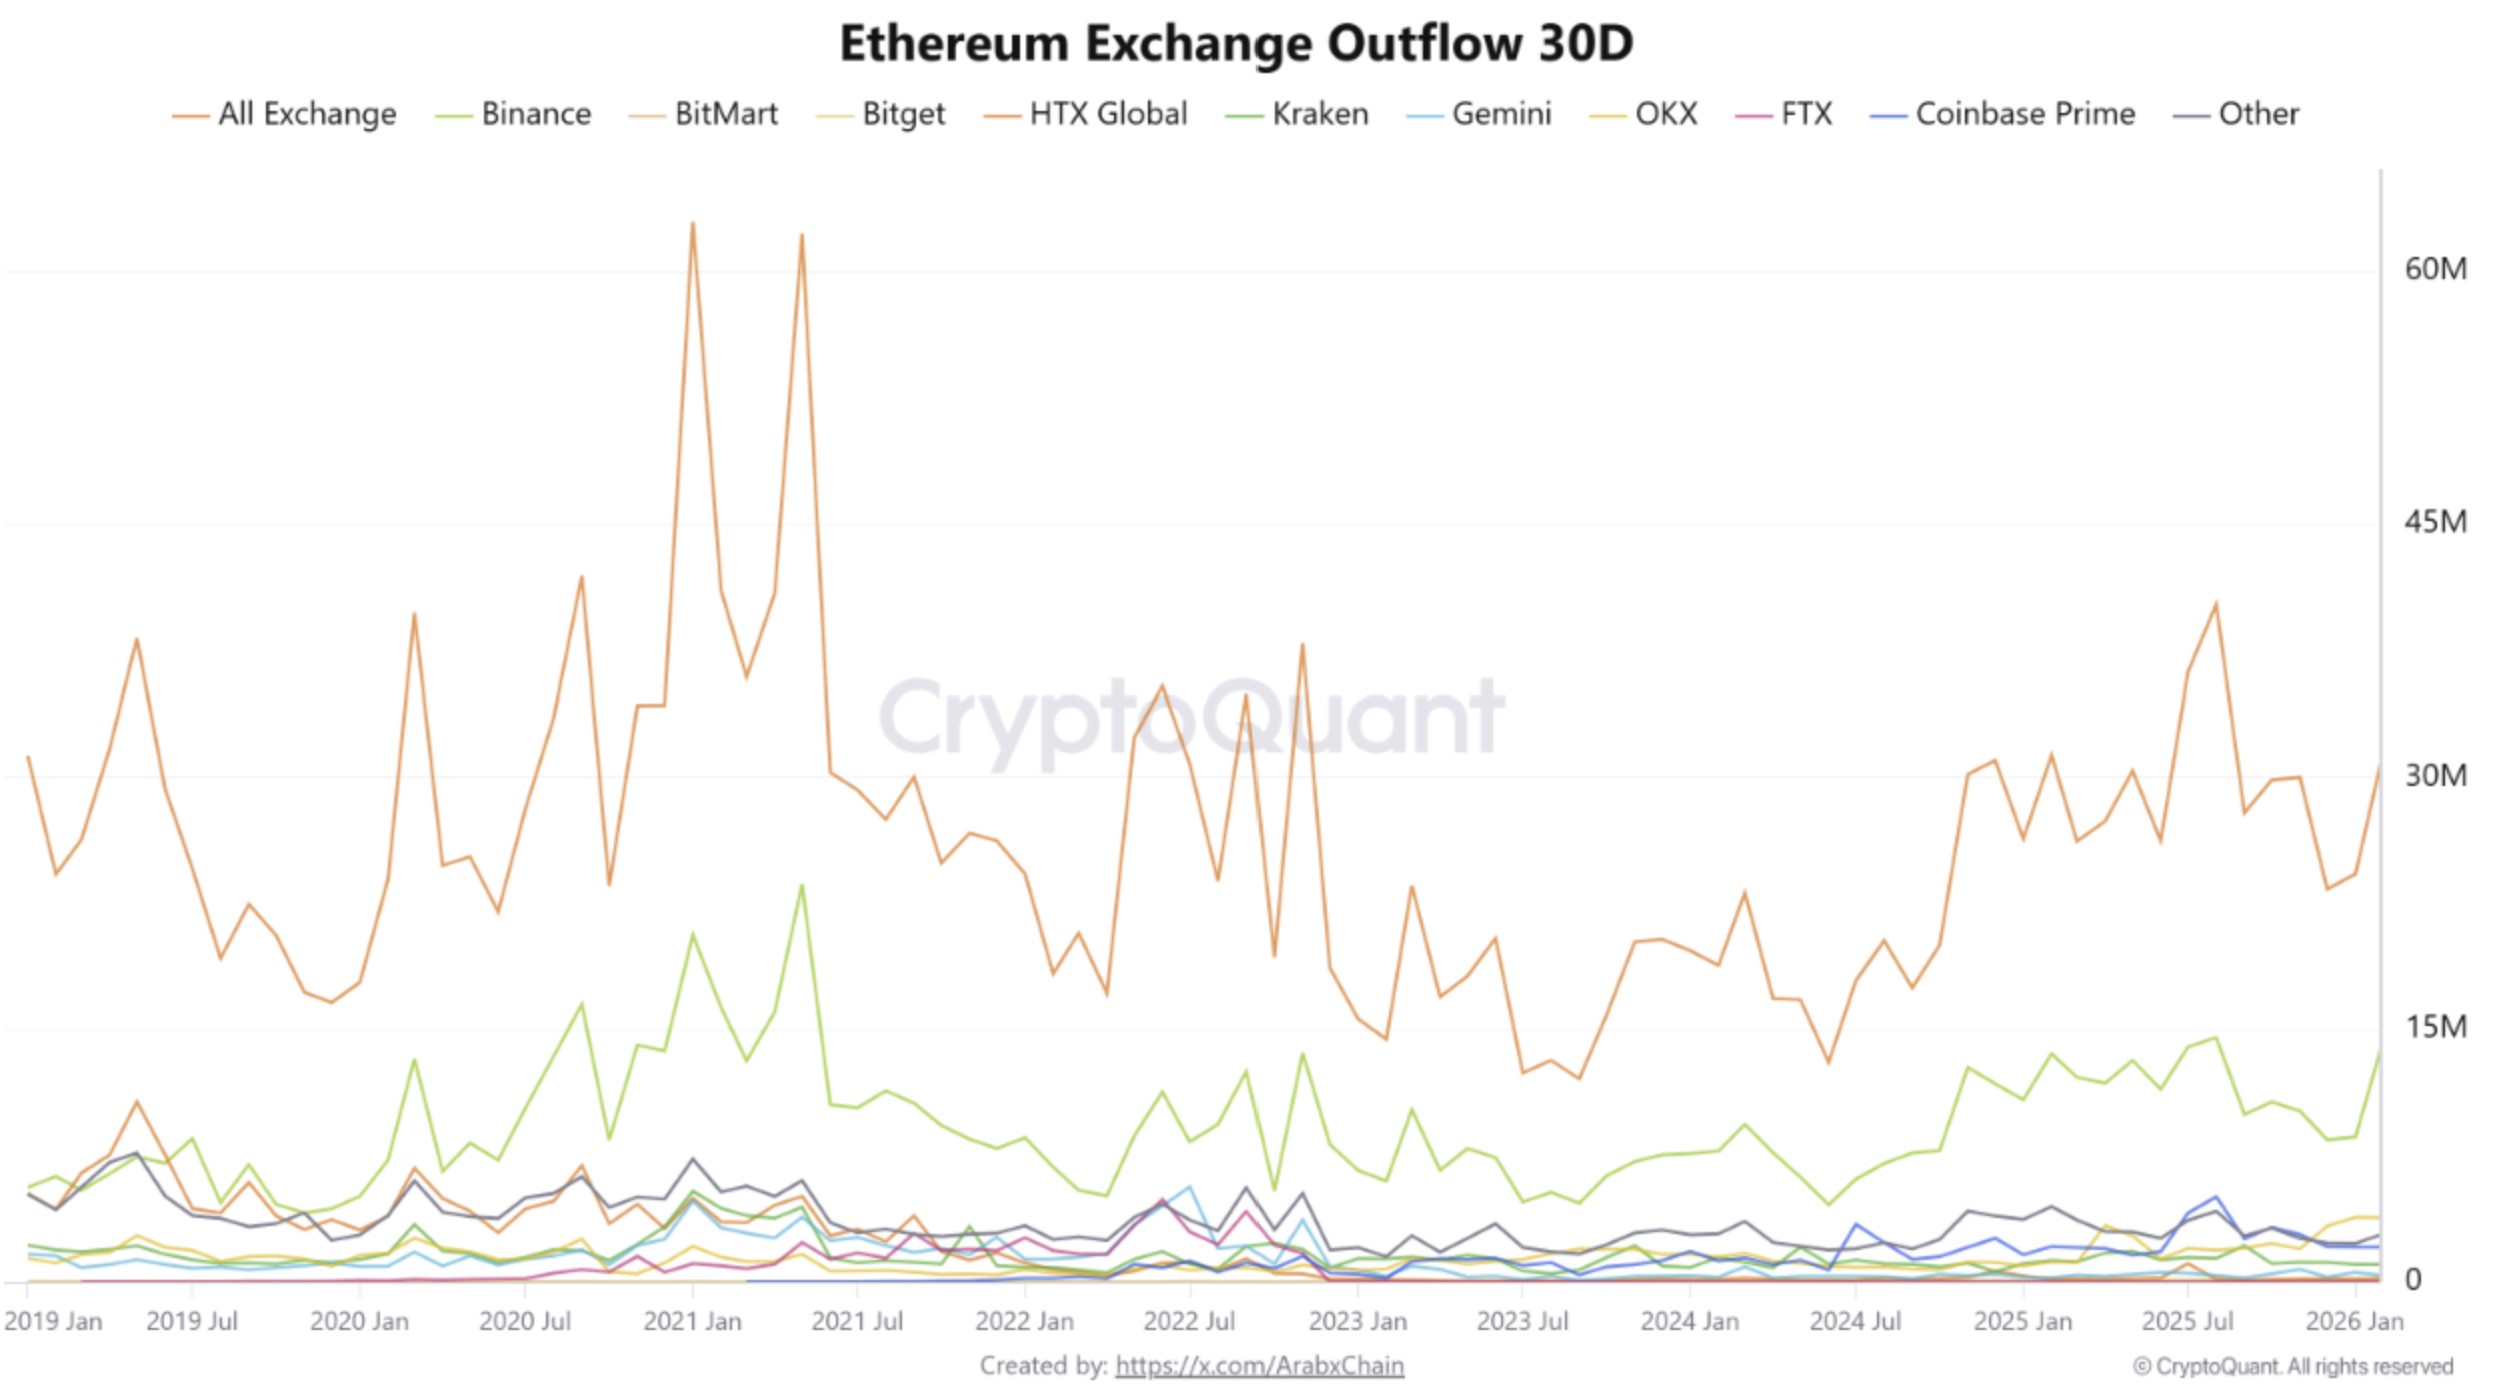
The balance of Ether (ETH) held on exchanges has slid to a multi-year low, with more than 31 million ETH leaving centralized exchanges in February, marking the largest monthly withdrawal since November.
While the ETH price remained near $2,000, derivatives data show a split between small buyers and larger sellers, raising the question of how the price may respond if demand becomes uniform across both retail and whale wallets.
Ether exchange reserves signal supply squeeze
Crypto analyst Arab Chain said that more than 31.6 million ETH left major exchanges in February, the highest monthly outflow since November. Binance led with roughly 14.45 million ETH withdrawn, nearly half of the total. OKX followed with about 3.83 million ETH, and Kraken recorded close to 1.04 million ETH.

Sustained withdrawals reduce the pool of coins readily available for spot trading activity. Coins moving to private wallets or staking platforms are typically less liquid in the short term. As a result, thinner exchange balances can heighten the price volatility when market activity surges.
Likewise, CryptoQuant data also showed that Binance’s Ether reserves have dropped to around 3.46 million ETH, the lowest level since 2020. In previous cycles, reserves peaked above 5 million ETH before entering a gradual downtrend marked by lower highs. The latest reading extends that decline.

With ETH trading below $2,000, the contraction in exchange supply places added focus on future demand. If buying pressure expands while reserves continue to fall, the available liquidity on order books may tighten further around the $2,000 threshold.
Related: Ether price again rejected at $2K: How low can ETH go in March?
Market remains split between retail and whales
Hyblock data highlighted a divergence across trade sizes. The cumulative volume delta (CVD), which tracks net aggressive buying and selling, stands near $95 million for smaller trades (between $0 and $10,000). That shows consistent retail-led buying pressure.

In contrast, the $10,000–100,000 trade bracket records roughly -$162 million in CVD, while the $100,000+ category sits near -$357 million. As observed, the larger participants have leaned towards net selling during the same period.
The bid–ask ratio has turned slightly positive, rising to around 0.2 before dipping to 0.03, indicating marginally stronger buying interest in recent sessions. The move follows a stretch of negative readings and points to short-term stabilization rather than broad conviction.

The aggregated open interest is near $9.41 billion, down from levels close to $10 billion in late February. The reduction signals that leverage has been trimmed as the price consolidates between $1,900 and $2,000.
If retail accumulation persists and large-scale selling slows, bullish positioning may become more aligned. In that case, the reduced exchange supply may amplify the price move once ETH solidifies a position above $2,000-$2,150.
Related: AI ‘vibe coding’ could put Ethereum roadmap ahead of schedule: Vitalik Buterin
This article does not contain investment advice or recommendations. Every investment and trading move involves risk, and readers should conduct their own research when making a decision. While we strive to provide accurate and timely information, Cointelegraph does not guarantee the accuracy, completeness, or reliability of any information in this article. This article may contain forward-looking statements that are subject to risks and uncertainties. Cointelegraph will not be liable for any loss or damage arising from your reliance on this information.

TLDR
- Circle shares rose more than 20% this week following Israeli and U.S. airstrikes on Iran.
- Mizuho linked the rally to higher oil prices and fading expectations for Federal Reserve rate cuts.
- WTI crude climbed about 7 to 8% after tensions in the Middle East escalated.
- Circle earns most of its revenue from interest on U.S. government debt backing its USDC stablecoin.
- Analysts said reduced rate cut expectations add about 1% to Circle’s 2026 and 2027 revenue forecasts.
Circle (CRCL) shares jumped over 20% this week after Israeli and U.S. strikes on Iran lifted oil prices and rate expectations. Mizuho linked the rally to higher crude and fading Federal Reserve rate cut hopes. The bank raised its price target to $100 while keeping a neutral rating.
Circle shares gain as oil surge shifts rate outlook
Circle shares outperformed the broader market as WTI crude rose about 7% to 8% since the weekend strikes. Japanese bank Mizuho said higher oil prices could revive inflation pressures and reduce expectations for Federal Reserve rate cuts.
The bank explained that Circle earns most revenue from interest on U.S. government debt backing its USDC stablecoin. Higher interest rates increase yields on those reserves and support revenue growth. Conversely, lower rates compress that income stream and limit earnings potential.
Mizuho analysts Dan Dolev and Alexander Jenkins adjusted their forecasts after reviewing recent market data. They estimated that reduced expectations for rate cuts add about 1% to their 2026 and 2027 revenue forecasts.
They also cited Chicago Mercantile Exchange FedWatch data to support their outlook. The analysts said the probability of a no-rate-cut scenario in 2026 has doubled in the right tail risk distribution.
Bitcoin rebound supports market sentiment
Crypto markets reacted sharply when the Middle East conflict began over the weekend. Bitcoin fell in early trading during a broad risk-off move but later stabilized.
Bitcoin now trades near $68,100 after rising roughly 5% in the past 24 hours. The recovery has helped improve overall market sentiment around digital assets.
Mizuho increased its Circle price target to $100 from $90 following these developments. The stock traded 6% higher at $101.90 at publication time.
The bank maintained a neutral rating despite the revised target price. Analysts stated that higher-for-longer rates create a near-term revenue benefit for the company.
However, the report warned that long-term growth could slow as stablecoins become more commoditized. Competitive pressures may affect margins over time.
Circle shares also surged more than 45% last week after fourth-quarter earnings triggered a short squeeze. That rally ended an 80% decline from record highs reached last year.
The recent price action reflects shifting macro expectations and crypto market movements. At publication time, Circle shares traded above the revised $100 target set by Mizuho.

Crypto World
Middle East tensions, higher oil boost Circle (CRCL) shares as rate-cut odds fade: Mizuho

Shares of stablecoin issuer Circle (CRCL) have risen over 20% this week, outperforming the broader market following Israeli and U.S. airstrikes on Iran over the weekend.
Japanese bank Mizuho attributed the rally in part to a sharp rise in oil prices, as tensions in the Middle East exploded. Higher crude prices could rekindle inflationary pressures, lowering expectations for Federal Reserve rate cuts.
That dynamic matters for Circle. The company earns the bulk of its revenue from interest income on the U.S. government debt it holds as reserves backing its USDC stablecoin. Higher interest rates translate into greater yield on those reserves, directly supporting revenue. Conversely, rate cuts compress that income stream.
Since U.S. and Israeli strikes on Iran over the weekend, WTI crude has climbed roughly 7%–8% on elevated geopolitical risk and supply disruption concerns.
Crypto markets were jolted at the outbreak of war in the Middle East on Saturday, with bitcoin sliding sharply in early trading amid a broader risk-off move, but prices have since stabilized.
Analysts Dan Dolev and Alexander Jenkins estimated that reduced expectations for rate cuts add about 1% to their Circle 2026 and 2027 revenue forecasts.
More importantly, the analysts pointed to a doubling in the “right tail risk” of a no-rate-cut scenario in 2026, according to Chicago Mercantile Exchange (CME) FedWatch data, a shift that could further support Circle’s valuation multiple.
A roughly 5% rise in bitcoin over the past 24 hours may also be contributing to positive sentiment. The largest cryptocurrency is currently trading around $68,100.
The bank raised its Circle price target to $100 from $90, while maintaining a neutral rating on the shares. The stock was trading 6% higher at $101.90 at publication time.
While higher-for-longer rates are a near-term positive, longer-term revenue growth could face pressure as stablecoins become increasingly commoditized, the report added.
Circle shares gained more than 45% last week in a violent short squeeze following fourth quarter earnings. That move snapped what had been a brutal 80% drawdown from record highs hit last year.
Read more: Circle’s post-earnings surge nears 50% as short squeeze, not strong financials, fuels rally
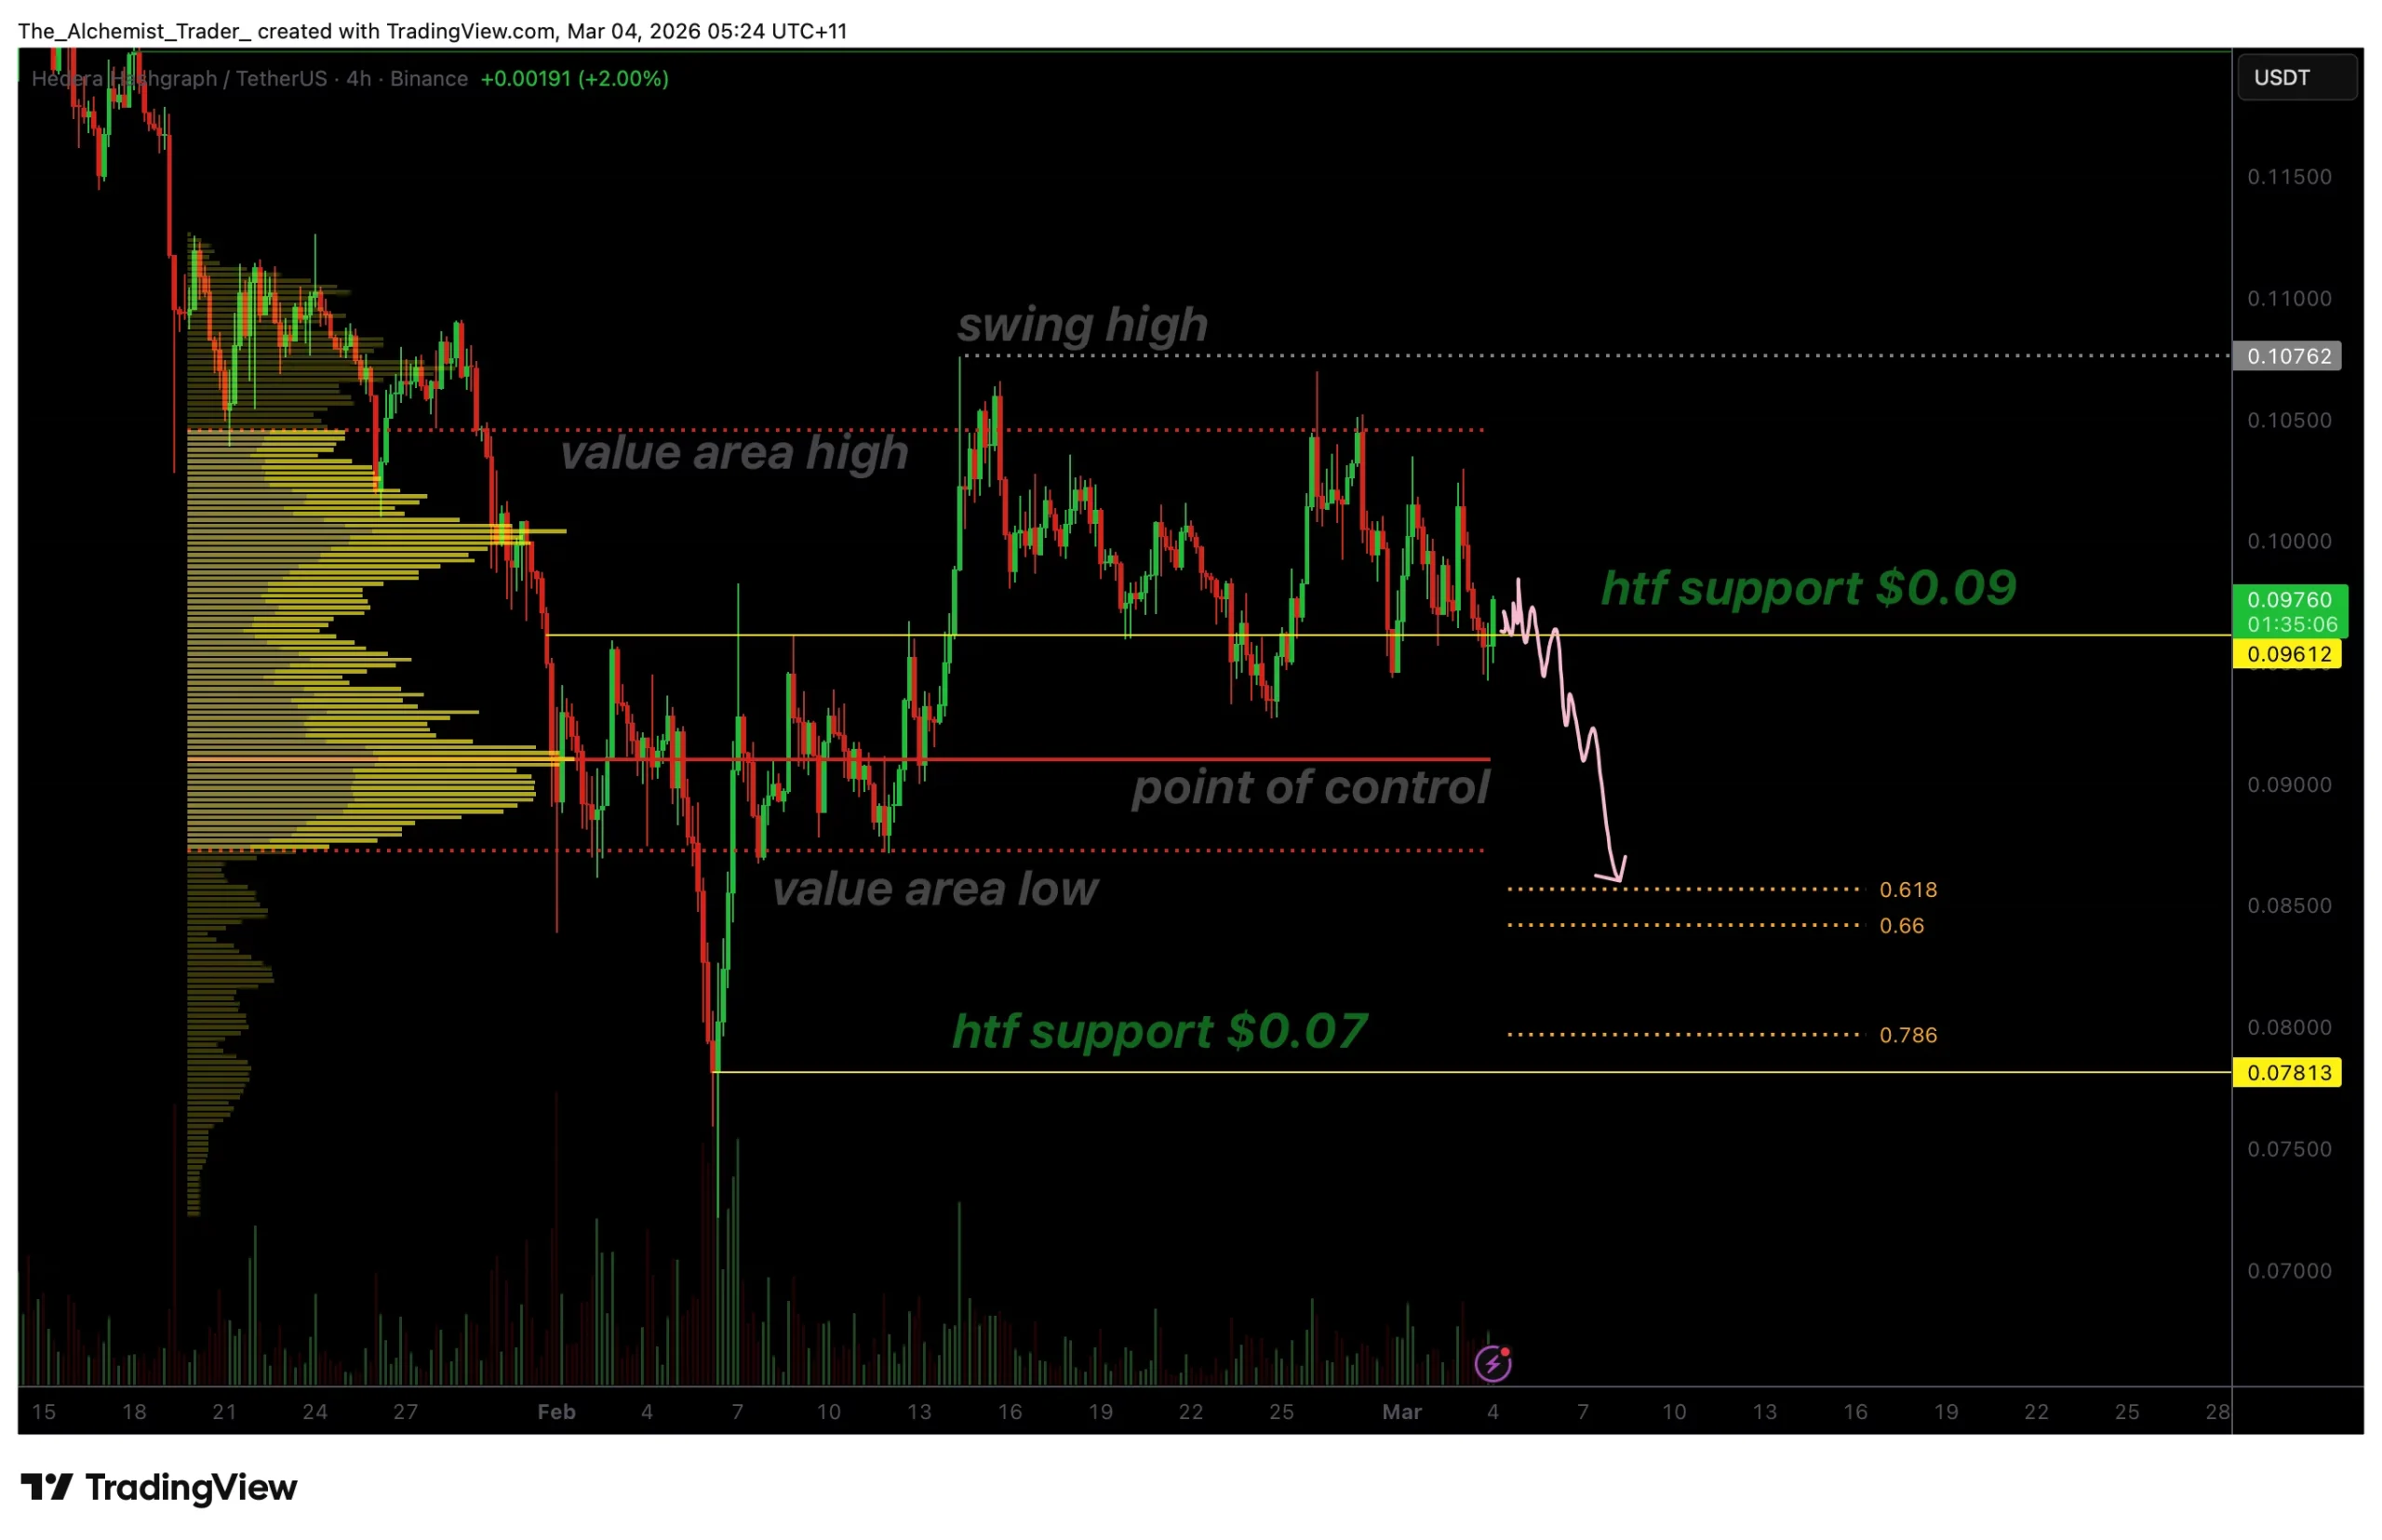
HBAR price has faced repeated rejection at the value area high, signaling fading upside momentum. With demand weakening, the market now risks rotating toward deeper support near $0.07.
Summary
- Repeated rejection at value area high resistance
- $0.09 support critical for short-term structure
- Breakdown exposes $0.07 high timeframe support
HBAR (HBAR) price remains locked in a corrective phase as price continues to trade within clearly defined value levels. Multiple failed attempts to break above resistance highlight persistent supply overhead, preventing bullish continuation.
As momentum fades near the upper boundary of the range, attention shifts toward whether key support can hold or if further downside rotation will unfold.
HBAR price key technical points
- Resistance Zone: Value Area High continues to cap upside attempts.
- Immediate Support: $0.09 high timeframe demand level.
- Downside Target: Breakdown exposes $0.07 high timeframe support.
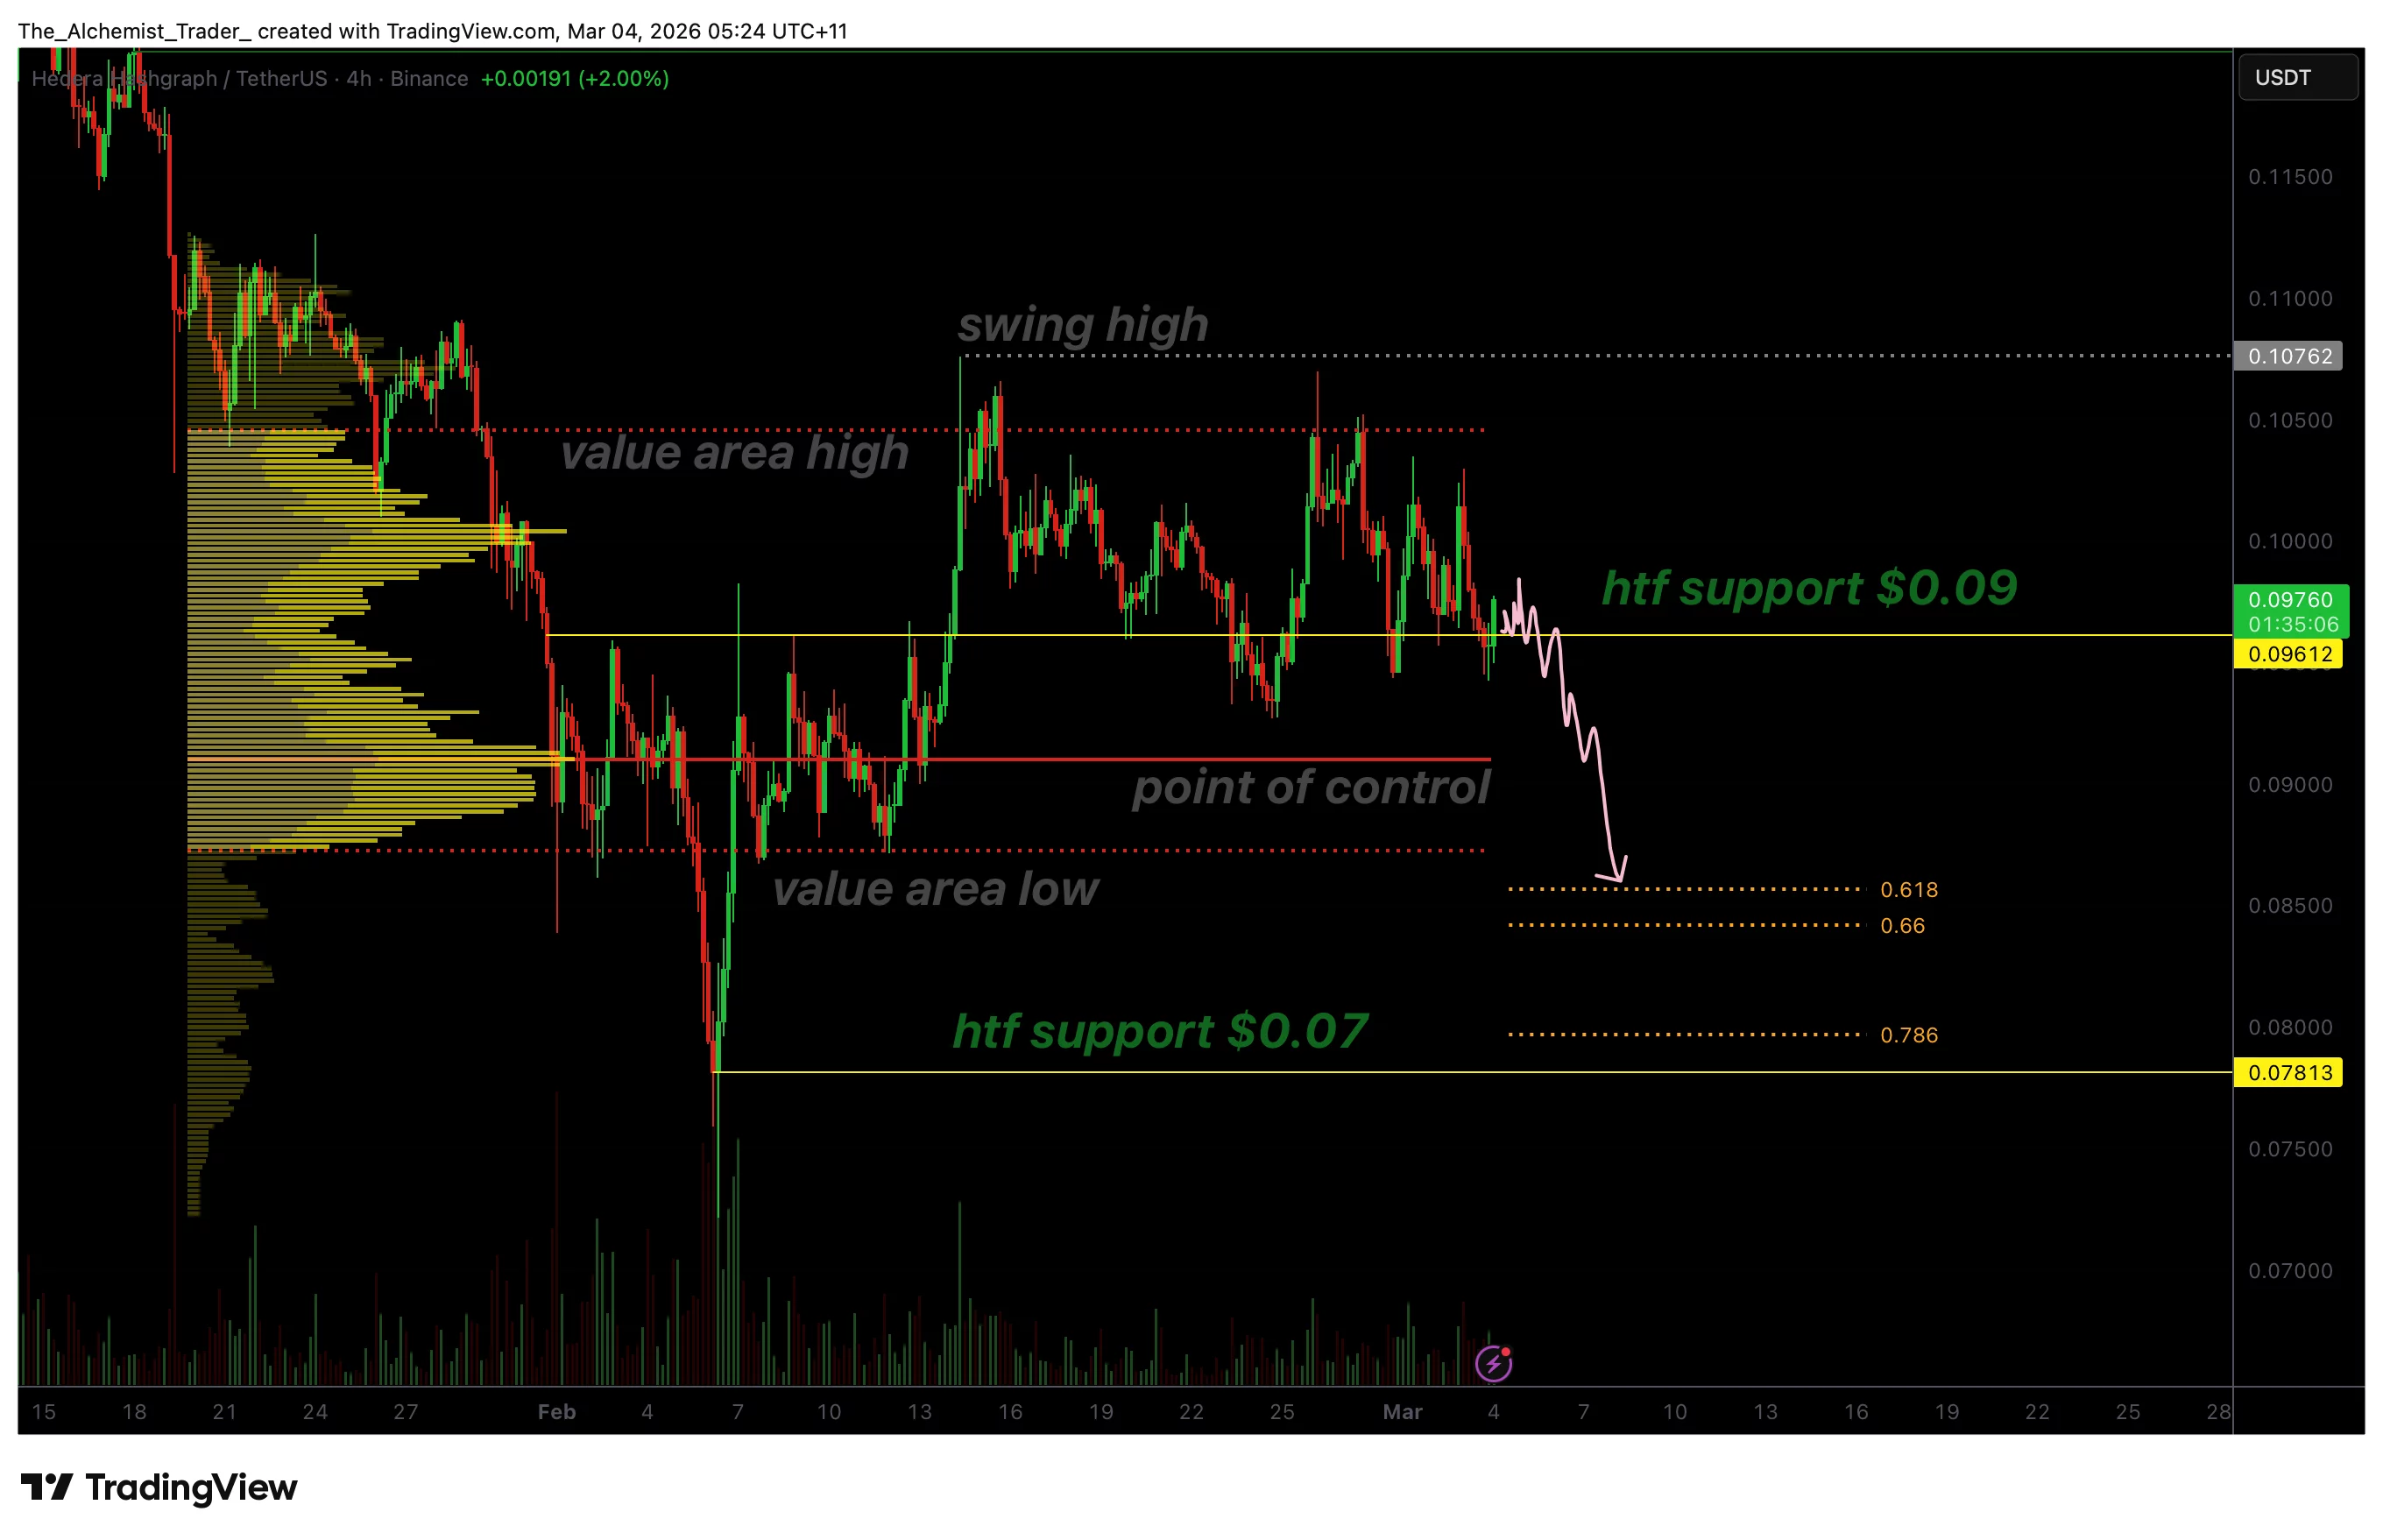
HBAR’s recent price action reflects rotational market behavior rather than trending expansion. The asset has repeatedly tested the Value Area High, only to be rejected on multiple occasions. This level acts as a ceiling within the current trading structure, signaling that buyers lack the conviction necessary to sustain a breakout.
The inability to reclaim the Value Area High suggests weakening demand at higher prices. When price repeatedly fails at resistance without strong volume confirmation, markets often rotate lower in search of stronger liquidity zones. In HBAR’s case, price has now reverted back toward the $0.09 high timeframe support, which serves as the next immediate demand area.
The $0.09 region represents a structural pivot within the range. Holding this level would preserve consolidation dynamics and maintain rotational price behavior between the value area boundaries, especially after HBAR recently rebounded from its year-to-date low of $0.0725 to the psychological $0.100 level.
However, a confirmed close below this support would indicate acceptance at lower prices and significantly increase the probability of continuation toward the Point of Control (POC) and ultimately the Value Area Low.
From a volume profile perspective, markets frequently move between the Value Area High, POC, and Value Area Low as liquidity shifts. With the upper boundary firmly rejecting price, the path of least resistance favors a move toward the lower end of the range.
Should $0.09 fail to hold, the next major high timeframe support lies near $0.07, a region that previously acted as a structural demand zone. A move toward this level would represent a deeper corrective rotation within the broader consolidation structure.
Market structure analysis further reinforces caution. HBAR has not established higher highs or sustained bullish momentum above resistance. Instead, the chart reflects ongoing equilibrium conditions where buyers and sellers are battling for control without decisive resolution.
Volume behavior also remains subdued. Without a meaningful influx of buying participation, upside continuation becomes increasingly difficult. For HBAR to invalidate the bearish rotation scenario, price would need to decisively reclaim the Value Area High with strong volume expansion.
Until that occurs, the market remains vulnerable to gradual downside exploration.
What to expect in the coming price action
HBAR is likely to continue rotating within its value range unless a decisive breakout occurs. Loss of $0.09 support would increase the probability of a move toward $0.07. Conversely, reclaiming the Value Area High would signal renewed strength and invalidate the short-term bearish bias.
Crypto World
Bitcoin Price Prediction: Billion-Dollar Asset Manager Signals Explosive Opportunity After Market Drop

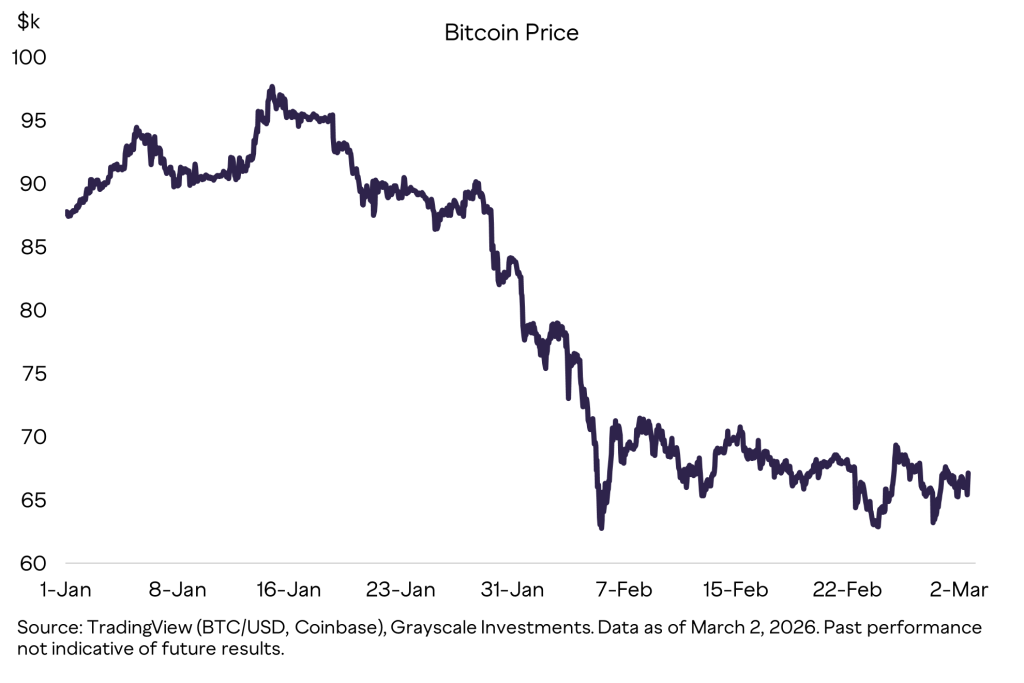
Crypto has been bleeding. Bitcoin slid toward the $60,000 zone. Altcoins followed. Sentiment at its worst and bearish price prediction everywhere.
Right on cue, a billion dollar asset manager stepped in and said what most retail traders are afraid to think: this might be the opportunity.
In its latest market commentary, Grayscale argued that the recent drawdown does not break the long term thesis. Instead, it may present a strategic entry point for investors willing to zoom out.
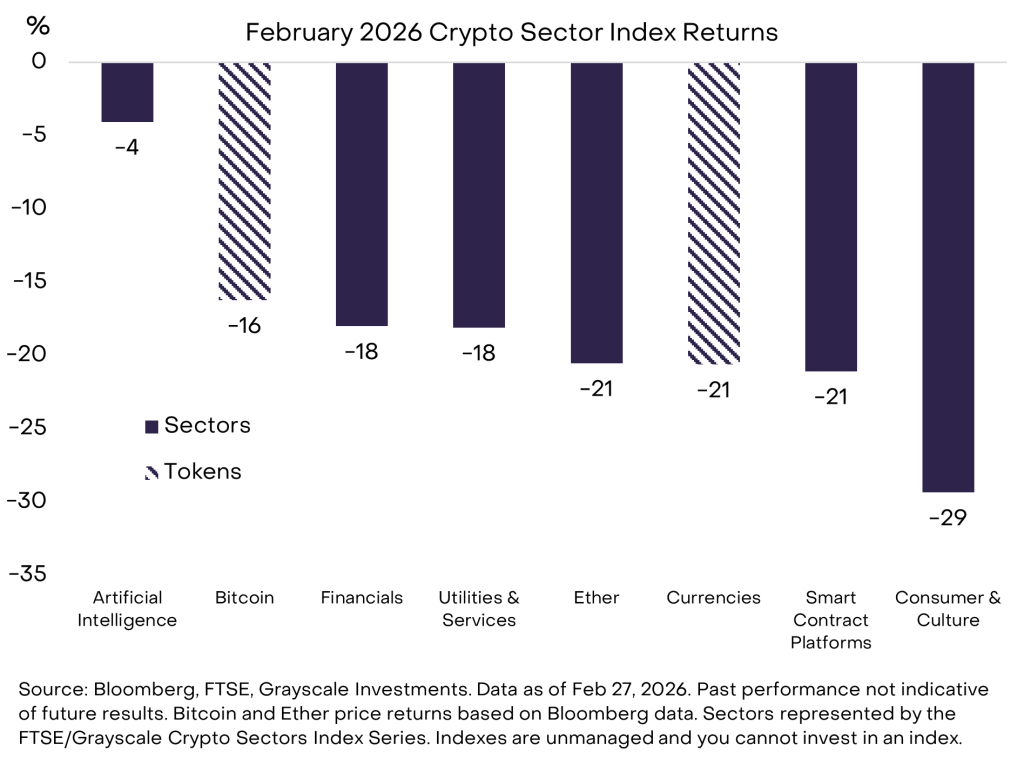
The firm pointed to the sharp correction across crypto and tech equities, but stressed that structural drivers remain intact.
One key theme is the growing overlap between AI and blockchain. According to Grayscale, these technologies are complementary, not competitive.
As AI agents become more autonomous, blockchains could serve as their financial rails. That narrative has already shown relative strength compared to other crypto segments during the downturn.
The report also highlighted stablecoins and tokenization as major institutional gateways. Regulatory progress and renewed interest from firms like Meta, Stripe, and BlackRock suggest that traditional finance is not stepping back from crypto. It is building into it.
At the macro level, Grayscale maintains that the broader US economic backdrop remains supportive for risk assets, even with uncertainty around monetary policy leadership. Volatility, in their view, does not equal collapse.
Bitcoin Price Prediction: Is This the Setup for the Next Leg?
Bitcoin price looked ready to break out.
It pushed above the descending trendline of that compressing triangle and started moving toward $72,000. For a moment, it felt like expansion was coming.
But there was no follow-through.
Instead of flipping the breakout level into support, the price stalled and slipped back inside the triangle. That is a classic failed breakout.
Now the focus shifts back to $64,000. If price keeps drifting lower and that support cracks, the structure turns bearish and $60,000 comes into play quickly.
A failed breakout plus support loss is usually a strong downside combo.
That said, the whole setup is not ruined yet. If $64,000 holds and Bitcoin reclaims the upper trendline again, this could still turn into a shakeout.
Can Bitcoin Hyper Presale Grab Everyone’s Attention? One Of The Most Anticipated Projects In 2026
Bitcoin Hyper ($HYPER) is a new presale using Solana tech to make Bitcoin a lot faster and cheaper, without messing with its core security.
It basically turns Bitcoin from something you just watch on a chart into something you can actually use. Payments. Staking. Apps. Real on-chain action.
And this is not just hype. The presale has already raised over $32 million, with $HYPER priced at $0.0136751 before the next increase.
Staking is paying up to 37% right now, which definitely catches attention.
If Bitcoin takes off, Bitcoin Hyper probably moves with it. If Bitcoin keeps moving sideways, Bitcoin Hyper still benefits from actual network usage. It is built around activity, not just waiting for price to pump.
To buy HYPER before it lists on exchanges, simply visit the official Bitcoin Hyper website and connect a wallet (such as Best Wallet).
Visit the Official Bitcoin Hyper Website Here
The post Bitcoin Price Prediction: Billion-Dollar Asset Manager Signals Explosive Opportunity After Market Drop appeared first on Cryptonews.
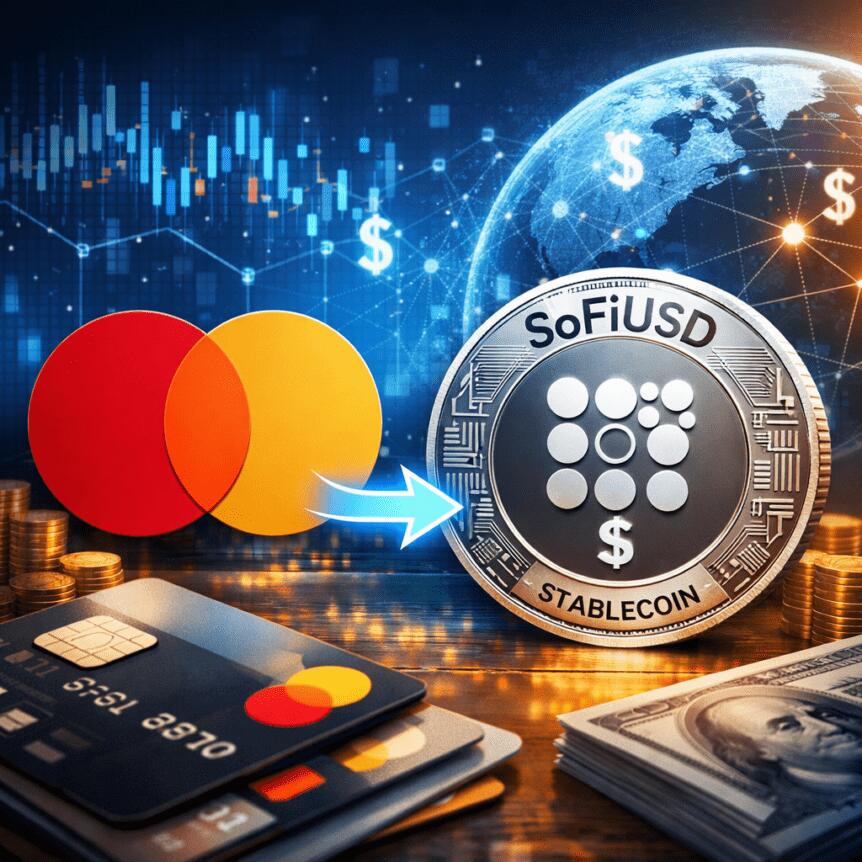
Two financial technology powerhouses are accelerating the integration of tokenized money into everyday payments. SoFi Technologies and Mastercard unveiled a partnership that will allow settlement of Mastercard card transactions using SoFiUSD, the dollar-backed stablecoin issued by SoFi Bank N.A. Across Mastercard’s global network, so-called stablecoin settlement could run around the clock, enabling 24/7 processing. In practical terms, SoFi Bank will settle its own Mastercard credit and debit transactions in SoFiUSD, while SoFi’s Galileo payments platform will give issuer banks and card programs the option to use the stablecoin for settlement across Mastercard’s network—the second-largest processor in the world. SoFiUSD, which launched in December, is issued by an OCC-regulated insured depository institution and is backed 1:1 by cash reserves. The move signals a deeper push by major rails to incorporate bank-issued digital dollars into everyday financial activity, expanding the reach of tokenized money beyond niche crypto use cases.
The announcement clarifies that the SoFiUSD settlement capability is designed to operate on a public, permissionless blockchain, underscoring the growing interplay between traditional banking infrastructure and programmable digital currencies. Mastercard’s Multi-Token Network is expected to support the stablecoin alongside fiat currencies, tokenized deposits, and other digital assets, enabling seamless, near real-time settlement across a broad base of merchants and cardholders. In addition to the technical integration, the parties indicated they will explore further use cases that could amplify efficiency and liquidity, including cross-border remittances, business-to-business transfers, programmable treasury applications, and stablecoin-enabled card programs—though these initiatives will be subject to applicable regulatory requirements and Mastercard network rules.
The collaboration arrives as Mastercard has been tightening its focus on stablecoins and tokenized payments. Earlier in the year, the payments giant partnered with Thunes to bring stablecoin payouts to the mainstream via Mastercard Move, enabling near real-time transfers to regulated stablecoin wallets through Thunes’ Direct Global Network. The broader context is reinforced by parallel activities from Visa, which has been expanding stablecoin settlement and payout infrastructure across its network. In September, Visa began testing a stablecoin-based cross-border settlement pilot that used Circle’s USDC ((CRYPTO: USDC)) and another token, EURC, to pre-fund international transfers, a capability that Visa subsequently broadened to support four stablecoins across four blockchains and more than 25 fiat currencies. A separate Visa Direct pilot in November has started enabling businesses to send funds directly to recipients’ stablecoin wallets, so freelancers and marketplaces can receive USD-backed tokens instead of traditional bank transfers. And Europe-based Quantoz Payments recently joined as a Visa principal member, enabling it to issue Visa-branded debit cards backed by regulated e-money tokens and to support stablecoin-linked products regionally.
Key takeaways
- SoFi Bank N.A. will settle Mastercard-processed transactions in SoFiUSD, expanding the utility of the dollar-backed stablecoin within a major card network.
- SoFiUSD is issued by an OCC-regulated, insured institution and is backed 1:1 by cash reserves, with the promise of 24/7 settlement across Mastercard’s network via Galileo’s platform enhancements.
- The collaboration paves the way for additional use cases, including cross-border remittances, B2B transfers, programmable treasury tools, and stablecoin-enabled card programs, all contingent on regulatory compliance and network rules.
- Mastercard’s ongoing stablecoin strategy aligns with broader industry moves, including Visa’s cross-border settlement pilots and stablecoin payout initiatives, signaling a shift in how banks and fintechs view digital dollars on settlement rails.
- Industry data point: the stablecoin market cap sits in the hundreds of billions, with transaction volumes approaching the trillions in certain months, illustrating the scale at which these rails could operate in the near term.
Tickers mentioned: $USDC, $EURC
Sentiment: Neutral
Price impact: Neutral. The news centers on settlement infrastructure and utilization of a bank-issued stablecoin, with no immediate price guidance given.
Trading idea (Not Financial Advice): Hold. The development underscores ongoing infrastructure improvements rather than a near-term price catalyst for mentioned assets or networks.
Market context: The move sits within a broader trend of traditional payments networks embracing tokenized digital cash, as stablecoins and bank-issued digital dollars become more embedded in everyday settlement, remittance, and payout flows. Regulatory clarity and network rules will shape how quickly and widely these capabilities roll out across banks and merchants. The momentum from Mastercard and Visa complements industry data showing growing stablecoin usage in both retail and enterprise contexts, while total stablecoin market activity continues to scale alongside mainstream financial rails.
Why it matters
The SoFi-Mastercard settlement arrangement underscores a practical transition from purely fiat settlement to tokenized digital dollars within established card networks. For card issuers and merchant acquirers, this reduces settlement latency and potentially lowers liquidity costs, especially for cross-border transactions that traditionally require multiple intermediaries. By enabling 24/7 settlement on Mastercard’s rails, SoFiUSD could improve cash flow matching for partners and suppliers and broaden the use of their own stablecoin beyond consumer wallets and crypto exchanges.
From a regulatory perspective, the use of a bank-issued stablecoin on a public blockchain adds a familiar governance layer: an OCC-regulated issuer with cash-backed reserves, combined with a trusted payments network. The collaboration also reinforces the role of banks as the backbone of tokenized money: even as blockchain-native settlement grows, the need for regulated, insured custody and robust compliance remains a central requirement for large institutions. In this sense, the partnership serves as a proof of concept that banks can participate in tokenized settlement without ceding control of risk management to decentralized finance-native models.
For fintech ecosystems, the initiative expands the potential for programmable treasury operations—allowing corporate treasuries and fintech platforms to automate liquidity moves, optimize working capital, and route funds with greater precision. That, in turn, could spur new product configurations, such as stablecoin-enabled card programs or cross-border remittance corridors, that leverage existing consumer banking infrastructure while leveraging the speed of digital dollars. The broader landscape—where Visa and Mastercard actively push stablecoin payouts and cross-border settlement—suggests a more interconnected payments environment where digital dollars move with the same confidence and traceability as traditional currencies.
What to watch next
- Regulatory milestones: how global and national regulators clarify bank-issued stablecoins and cross-border settlement rules this year.
- Adoption by other banks and issuers: any new partners integrating SoFiUSD for settlement on Mastercard’s network or similar rails.
- Cross-border pilots: initial remittance or B2B pilots using SoFiUSD or other bank-issued stablecoins for settlement on a global scale.
- Expansion of stablecoin payout programs: updates from Visa and Mastercard on new partners, supported tokens, and regional rollouts (e.g., Europe, Asia).
- Market data trends: ongoing evidence of liquidity, volume, and volatility in tokenized settlement ecosystems as rails expand beyond pilot stages.
Sources & verification
- SoFi and Mastercard press release detailing SoFiUSD settlement across Mastercard’s global payments network.
- Announcement that SoFiUSD launched in December and is issued by SoFi Bank with 1:1 cash reserves.
- Visa’s stablecoin settlement pilots and multi-stablecoin payout expansions, including USDC and EURC references.
- Aktual industry references to Mastercard’s Thunes partnership and Quantoz’s Visa principal membership for European stablecoin-linked products.
- DefiLlama data on total stablecoin market cap and CoinLedger projections for transaction volumes.
Why it matters
What makes this development noteworthy is the explicit bridging of a bank-issued stablecoin to a major card network’s settlement rails. If banks can settle card transactions in stablecoins with the same certainty and risk controls as fiat settlements, the path to broader tokenized money adoption becomes more tangible for mainstream merchants and large issuers. The architecture—cash-backed, bank-issued stablecoins moving on permissioned and public networks—offers a balance between regulatory oversight and the efficiency gains associated with tokenized payments.
At the same time, the pace and scope of these pilots will hinge on regulatory clarity and network governance. While 24/7 settlement promises improved liquidity management, financial institutions will scrutinize contingency plans, risk controls, and consumer protections as stablecoins become more deeply integrated into everyday spending. The collaboration also signals a broader strategic play by Visa and Mastercard to reshape settlement and payout flows—particularly across borders and in enterprise contexts—where the speed of liquidity delivery can translate into meaningful cost savings and new business models.
What to watch next
- Regulatory updates on bank-issued stablecoins and their use in settlement rails.
- New bank and issuer partnerships adopting SoFiUSD or similar tokens for card settlement.
- Cross-border remittance pilots and measurable improvements in settlement speed and costs.
- Regional rollouts of stablecoin-enabled payout programs through Visa and Mastercard ecosystems.
Trump family-backed American Bitcoin said Tuesday it has expanded its fleet of Bitcoin mining machines, increasing its computing capacity as competition among large-scale miners intensifies.
The company has acquired 11,298 new application-specific integrated circuit (ASIC) miners, which are expected to add about 3.05 exahashes per second (EH/s) to its operations once it is deployed at its Drumheller, Alberta site this month.
The purchase will boost American Bitcoin’s fleet size to 89,242 miners, representing about 28.1 EH/s of owned capacity.
The additional machines are rated at about 13.5 joules per terahash, a measure of energy efficiency that can influence operating margins in an industry where electricity costs are a primary expense.
The expansion increases American Bitcoin’s share of the global Bitcoin network’s total hashrate, modestly improving its probability of earning block rewards. However, higher computing power does not automatically translate into higher revenue. Mining profitability remains dependent on Bitcoin’s market price, network difficulty levels and energy costs.
Network difficulty stands at 144.40 T, meaning that 144.40 trillion hashes are needed to find a valid block hash, according to CoinWarz. It has been at that level since Feb. 19.
Shares of American Bitcoin were little changed following the announcement before trading lower into Tuesday’s session, broadly in line with weakness across equity markets.

Related: Bitcoin mining’s 2026 reckoning: AI pivots, margin pressure and a fight to survive
Bitcoin-heavy treasury strategy carries risk
American Bitcoin, which went public last year through a reverse merger with Gryphon Digital Mining, has adopted a Bitcoin-centric corporate strategy that extends beyond mining operations.
In addition to expanding its hashrate, the company has accumulated more than 6,000 Bitcoin (BTC) on its balance sheet, according to industry data. The strategy mirrors a growing trend among mining companies that retain a significant portion of the Bitcoin they mine rather than sell it immediately, effectively using production to build long-term exposure to the asset.
Holding large Bitcoin reserves can amplify gains during price rallies, strengthening the company’s balance sheet and potentially enhancing shareholder value. However, the strategy also increases exposure to price volatility.

That risk became evident in the fourth quarter, when American Bitcoin reported a net loss of $59 million. The loss was largely driven by a $227 million non-cash mark-to-market adjustment reflecting Bitcoin’s price decline during the period. Such accounting adjustments do not represent realized losses but can materially impact reported earnings.
Related: Bitcoin miners chase 30 GW AI capacity to offset hashprice pressure
In a key move connecting traditional and digital finance, the Depository Trust and Clearing Corporation (DTCC) added Hidden Road Partners CIV US LLC to its NSCC Market Participant Identifiers directory.
Effective March 2, 2026, the NSCC update allows Ripple Prime to route institutional post-trade volumes directly onto the XRP Ledger (XRPL). Notably, the move bridges traditional market infrastructure with blockchain settlement.
XRPL Moves Deeper Into Wall Street Infrastructure
According to the DTCC notice dated February 27, 2026, the update is part of broader changes to participant lists for insurance processing. It also reflects NSCC updates across OTC, corporate, municipal, and UIT products.
As a result, Hidden Road appears under clearing broker code 0443 with executing broker alpha “HRFI,” approved specifically for OTC trades. The inclusion sets the stage for Ripple Prime to integrate traditional clearing infrastructure with blockchain settlement.
The integration enables Ripple Prime to combine NSCC’s centralized clearing, risk management, and settlement services with the XRPL’s speed and low transaction costs. Also, the arrangement could compress settlement times and improve capital efficiency across a system handling over $2 quadrillion annually.
In line with its growth strategy, Ripple acquired Hidden Road in April 2025 for $1.25 billion, marking one of the largest deals in digital assets history. Rebranded as Ripple Prime in October 2025, the platform now offers multi-asset prime brokerage. It provides clearing, financing, and OTC spot trading for XRP and RLUSD stablecoins.
Before the acquisition, Hidden Road cleared $3 trillion yearly for more than 300 institutional clients across FX, derivatives, and digital assets. Ripple plans to migrate post-trade activities to the XRPL, using RLUSD as collateral to streamline cross-margining between traditional and crypto markets.
An Important Development?
Ripple CTO Emeritus David Schwartz described the development as one that “seems important” on social media, noting its potential impact on XRPL adoption. Industry experts suggest the integration may boost settlement speed and institutional access while embedding blockchain deeper in U.S. financial infrastructure.
Beyond Ripple Prime, the DTCC notice also highlighted other updates. These include Summit Wealth Group joining insurance processing on March 9, 2026, and U.S. Securities International Corp. changing its clearing broker from NFSC to SWST.
Meanwhile, firms including Azzad Funds and Bain Capital Private Credit retired, with reassignments ensuring continuity of clearing and settlement operations.
The post Wall Street Meets XRPL: Why Ripple’s Latest DTCC Integration ‘Seems Important’ appeared first on CryptoPotato.
TLDR
- CFTC Chairman Mike Selig said the agency will issue guidance on U.S. crypto perpetual futures within weeks.
- He stated that earlier regulatory approaches pushed crypto derivatives activity and liquidity offshore.
- Selig said the CFTC aims to establish professional perpetual futures products in the United States.
- He confirmed that the agency will clarify its approach to decentralized finance developers.
- Selig announced that the CFTC will soon release guidance on prediction markets.
U.S. regulators plan to outline a path for domestic crypto perpetual futures within weeks. CFTC Chairman Mike Selig said the agency will issue guidance soon. He spoke at a Milken Institute event in Washington and stressed faster action.
CFTC Moves to Establish Perpetual Futures Framework
Selig said crypto perpetual futures developed offshore because U.S. regulators avoided clear industry rules. He stated that prior policies pushed firms and liquidity outside the country. He added that the CFTC now works to bring professional futures products back to U.S. markets.
He said the agency expects to release guidance within the next month. “We expect to announce that very soon,” Selig told attendees. He explained that he can act independently because he is currently the only commissioner serving on the five-member CFTC panel.
He said the agency will define how it treats decentralized finance developers. He noted that past enforcement actions created uncertainty for DeFi builders. He added that the CFTC and the Securities and Exchange Commission coordinate their digital asset efforts under “Project Crypto.”
Selig and SEC Chairman Paul Atkins appeared together on stage. They emphasized a unified regulatory strategy for digital assets. They also said they support innovation exceptions to allow crypto experimentation without enforcement action.
SEC and CFTC Seek Clear Standards and Legal Certainty
Selig said the CFTC will issue guidance on prediction markets soon. He promised clear standards for firms offering event-based contracts. He said the agency also plans a broader rulemaking process to formalize that position.
He stated that guidance alone remains easy to reverse. Therefore, the agency aims to secure a more durable regulatory framework. He said oversight disputes continue with state gambling regulators over sports contracts.
Event contract firms such as Polymarket and Kalshi face scrutiny from state authorities. Selig said federal and state regimes can operate in parallel. “They can exist in parallel,” he told the audience.
Atkins addressed limits on agency authority during the same event. He said the SEC needs clearer statutory backing from Congress. “We really do need statutory certainty,” Atkins stated.
He explained that a U.S. Supreme Court decision reduced agency authority in court disputes. He said agencies now face stronger legal challenges to policy actions. He noted that Congress continues work on the Digital Asset Market Clarity Act.


- BNB gets institutional boost from YZi Labs amid broader market price weakness.
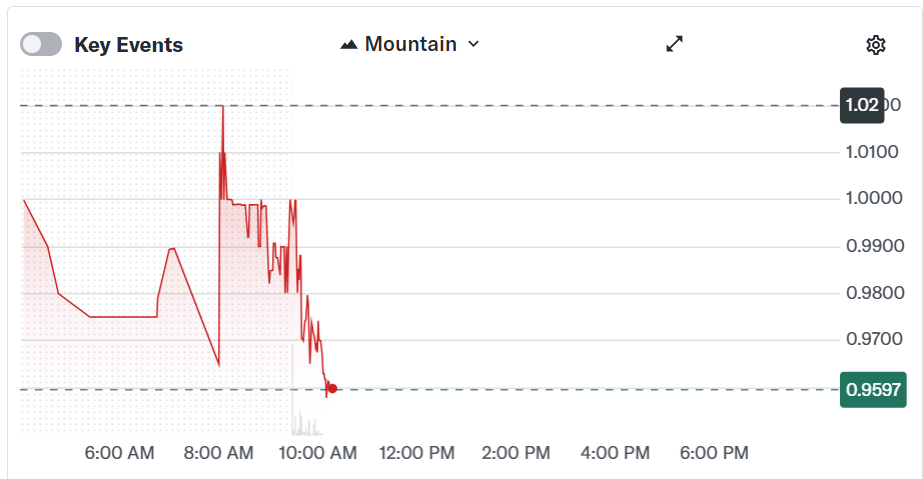
- This $100 million infusion arrives as BNB price holds near $630
- Commitment highlights institutional faith in BNB’s utility and yield potential.
BNB price hovers near $630 as investor jitters mount amid escalating US/Israel-Iran tensions.
The negative sentiment across crypto and risk assets aside, YZi Labs has announced a fresh $100 million commitment to Hash Global’s BNB Holdings Fund.
Can this move help the bulls hold onto gains?
BNB gets institutional boost
YZi Labs, formerly Binance Labs, announced a $100 million strategic investment into Hash Global’s BNB Holdings Fund, building on prior support for the compliant yield vehicle launched in June 2025.
Ella Zhang, Head of YZi Labs, highlighted BNB as a “foundational utility asset with attractive yield, powering the future of financial infrastructure,” inviting traditional capital for its structural returns and growth.
The fund has delivered strong performance, posting 32.5% returns since inception through diversified revenue streams including BNB price appreciation, launchpad allocations, airdrops, and custody yields, with bi-weekly liquidity for investors.
This move signals deepening institutional adoption, amid continued interest from private wealth platforms and high-net-worth individuals.
Despite price weakness and notable ecosystem downsides, BNB looks to be attracting investment from individuals seeking regulated exposure to the token.
KK, founder of Hash Global, noted:
“BNB’s institutionalization should not be viewed merely as portfolio inclusion, but as a structural alignment between capital and ecosystem development. The ecosystem co-building model is the defining feature that differentiates BNB from other digital assets.”
BNB price outlook
Current market data shows BNB trading around $629, down 3% in the last 24 hours.
Prices are also down in the past week and month, but BNB has held steady within this range since dipping from above $700 in February.
Downtrend weakness remains as Bitcoin struggles to break $70,000 amid headwinds from the intensifying US/Israel-Iran conflict.
With reports of further strikes and risks of the conflict spilling across the region, cryptocurrencies could dip even further. On Tuesday, BNB dropped from highs of $651 amid such fresh derisking.
If extreme fear grips sentiment, with odds rising of a deeper war, prices may retest support around $550. Lower demand reload zones lie in the $450-$500 range.
However, if bulls hold onto gains above immediate support, resilience could see prices bounce higher.
BNB’s ecosystem strength, including BNB Chain’s growing daily transactions, real-world asset adoption and investment inflows, provides a buffer.
The institutional inflows could counter prevailing macro fears and help buyers keep bears off.
‘Facing the unimaginable’: Community rallies to support family after sudden death of young mum

A hit of Doughpamine

Ether Exchange Supply Falls To 6-Year Low on Binance


-

 Politics5 days ago
ITV enters Gaza with IDF amid ongoing genocide
-

 Fashion4 days ago
Weekend Open Thread: Iris Top
-

 Politics11 hours ago
Alan Cumming Brands Baftas Ceremony A ‘Triggering S**tshow’
-

 Tech3 days ago
Unihertz’s Titan 2 Elite Arrives Just as Physical Keyboards Refuse to Fade Away
-

 Business7 days ago
True Citrus debuts functional drink mix collection
-

 NewsBeat6 days ago
Cuba says its forces have killed four on US-registered speedboat | World News
-
Sports4 days ago
The Vikings Need a Duck
-
 NewsBeat3 days ago
Dubai flights cancelled as Brit told airspace closed ’10 minutes after boarding’
-
 NewsBeat6 days ago
Manchester Central Mosque issues statement as it imposes new measures ‘with immediate effect’ after armed men enter
-
 NewsBeat3 days ago
The empty pub on busy Cambridge road that has been boarded up for years
-

 NewsBeat2 days ago
‘Significant’ damage to boarded-up Horden house after fire
-

 NewsBeat3 days ago
Abusive parents will now be treated like sex offenders and placed on a ‘child cruelty register’ | News UK
-
 NewsBeat7 days ago
Police latest as search for missing woman enters day nine
-

 Entertainment1 day ago
Baby Gear Guide: Strollers, Car Seats
-

 Business6 days ago
Discord Pushes Implementation of Global Age Checks to Second Half of 2026
-

 Business5 days ago
Only 4% of women globally reside in countries that offer almost complete legal equality
-
 Tech4 days ago
NASA Reveals Identity of Astronaut Who Suffered Medical Incident Aboard ISS
-
Politics3 days ago
FIFA hypocrisy after Israel murder over 400 Palestinian footballers
-

 Crypto World7 days ago
Entering new markets without increasing payment costs
-
 NewsBeat2 days ago
Emirates confirms when flights will resume amid Dubai airport chaos