
Crypto World
The world cup turned Polymarket into a $5B market



The biggest sporting event on Earth has become the biggest liquidity event in prediction market history. Billions in tournament volume, a $45 billion June across the sector, one very expensive longshot trap, and a CFTC probe arriving right on schedule.
Summary
- Polymarket processed about $5 billion in World Cup trading as the tournament drove prediction market volumes to record highs across the sector.
- The expanded World Cup format and deeper liquidity pushed crypto based event markets into mainstream scale while attracting a large wave of first time users.
- The surge in activity also brought regulatory scrutiny and raised questions over whether the new liquidity will remain after the tournament concludes.
Four years ago, during the Qatar World Cup, Polymarket processed a grand total of $138,000 in tournament bets. That is not a typo missing some zeros. One hundred thirty-eight thousand dollars, roughly the price of a nice car, across the entire biggest sporting event on the planet.
This summer, the same platform blew through $5 billion in World Cup trading before the knockout rounds finished forming, with tournament totals now estimated around $6.4 billion and climbing. The flagship winner market alone has turned over more volume than many mid-cap tokens see in a month. Across the whole prediction market sector, June closed at $44.8 billion in combined monthly volume, a 75% jump from May, and Bernstein analysts project World Cup wagering could top $10 billion by the July 19 final at MetLife Stadium. Measured against its own 2022 self, Polymarket’s World Cup business grew by a factor of more than forty thousand.
Something changed between Qatar and now, and it was not football. The 2026 tournament has become the moment crypto-native prediction markets stopped being a curiosity and started operating at the scale of the industries they intend to eat. It has also, in the same six weeks, exposed exactly where the model creaks: a longshot problem hiding $1.6 billion of dubious positioning, a regulatory net closing from two directions, and an open question about what happens to all this liquidity on July 20.
The numbers, and why they are absurd
The tournament kicked off on June 11 with a format built for market makers: 48 teams instead of 32, 104 matches instead of 64, three host countries, and a brand-new Round of 32 that added an extra layer of binary, elimination-stakes events. Every match is a market. Every market is several: winner, draw, total goals, advancement. The expanded format nearly doubled the tradeable surface area of the world’s most-watched event.
The results by the numbers:
- Polymarket’s World Cup-linked contracts passed $2 billion in the group stage, $3.3 billion days later, and roughly $6.4 billion at the latest count, against $138,000 for the entire 2022 tournament.
- Kalshi, the CFTC-regulated rival, processed about $7.4 billion in World Cup trades, more than its entire March Madness, with its flagship winner market alone drawing over $832 million.
- Combined June volume across Kalshi, Polymarket, and Polymarket’s new US-regulated exchange hit $44.8 billion, up 75% from May’s $25.66 billion. Kalshi grew 87% month over month to $31.5 billion; Polymarket did $14 billion across both venues, including $3.04 billion on the US platform.
- Weekly sector volume peaked at a record $14.5 billion, with open interest holding at a record $1.6 billion for three consecutive weeks. Kalshi’s open interest alone crossed $1.16 billion.
- Reports put Polymarket’s revenue run-rate at $1 billion annualized on World Cup flow.
Individual matches show how deep the liquidity runs. A group-stage fixture between Algeria and Austria, two mid-tier footballing nations, drew $2.82 million. England versus Panama drew $1.76 million even though Panama arrived as the weakest side in the field and left without scoring a goal. Even Paraguay versus Australia, a match with all the global glamour of a Tuesday, cleared $329,000. When dead rubbers between minnows clear six figures, the order book is no longer a novelty. It is a market with depth at every rung of the attention ladder, which is exactly what market makers need before committing balance sheet.
Pricing on the big question has stayed remarkably stable through the chaos. France leads the winner market at roughly 23% to 24% implied probability, with Argentina at 20% to 21%, a rematch scenario the finalist markets take seriously: France at 39% and Argentina at 38% to reach the July 19 final. Argentina has drawn about $81 million in winner-market volume, France $77 million, Portugal $76 million, Spain $68 million, and England $61 million.
How the machine works, for the newcomers it just onboarded
Given how many of this tournament’s traders are first-timers, the mechanics deserve a plain-language pass, because they explain both the volume numbers and the regulatory fight.
A prediction market contract is a share that pays $1 if an outcome happens and nothing if it does not. France to win the World Cup trading at 24 cents means the market assigns France a 24% implied probability; buy at 24 cents and a French title returns $1 per share. Prices move with news, form, and money flow exactly like any order book, and because every share is a token settling on-chain, positions trade continuously until resolution. Polymarket runs on Polygon with markets denominated in USDC, and outcomes resolve through an oracle process, with the UMA optimistic oracle as the traditional backstop where disputes over real-world results get adjudicated by token-holder vote. Kalshi runs the same economic structure through a CFTC-regulated exchange with dollars instead of stablecoins.
The tradability is the entire difference from a sportsbook, and it is why volume comparisons flatter prediction markets. A bettor who backs France at a book locks the position until the final; a Polymarket trader might turn the same conviction over dozens of times, buying strength, selling wobbles, rotating into match markets and back. High turnover on stable open interest, precisely Polymarket’s tournament signature, is the fingerprint of trading behavior layered on top of betting behavior. It also means the platforms earn their status as information machines honestly in one respect: continuous two-sided pricing on live global events, updating in seconds, visible to anyone. During the group stage, Polymarket priced a draw as the most likely single outcome in Paraguay versus Australia at 42.5% while traditional books had Paraguay clearly favored, the kind of public disagreement between market structures that quants notice and harvest.
From election-night stunt to billion-dollar business
The tournament did not create Polymarket’s scale from nothing. It compounded an arc three cycles in the making.
The platform’s first mainstream moment came with the 2024 US election, when its presidential market became a media fixture and its pricing beat several polling aggregates to the result. That visibility arrived with a compliance hangover: Polymarket had operated outside US jurisdiction since a 2022 CFTC settlement barred it from serving American users, and the election spotlight brought raids, investigations, and a long regulatory negotiation. The resolution came in 2025, when the platform acquired a regulated derivatives venue and resumed limited US operations through a compliant exchange, the entity now posting $3.04 billion monthly volumes as Polymarket US.
Kalshi ran the mirror-image path: US-regulated from birth, it fought the CFTC in court for the right to list election contracts, won, and then leveraged the precedent into sports-adjacent event contracts that state gaming regulators now contest. Its reported $1 billion funding round earlier in 2026 and its $31.5 billion June say the strategy found product-market fit at scale.
The World Cup is the first event both platforms entered at full institutional strength, regulated venues live, market-maker relationships mature, mobile products polished, and the $45 billion June is what that maturity looks like when the biggest audience on Earth shows up. For perspective on how completely the sector has outgrown its origins: the entire prediction market industry’s 2022 World Cup handle would not cover thirty seconds of this tournament’s average volume.
The longshot trap: $1.6 billion of hope
Underneath the headline volume sits the tournament’s strangest statistic, and the one that says the most about who is actually trading. Roughly $1.6 billion, a quarter or more of Polymarket’s World Cup total, has been wagered on teams priced at 1% implied probability or less.
Think about what that means. Traders have committed nine figures to the proposition that sides the market gives essentially no chance will lift the trophy. Some of that is rational lottery-ticket buying, one-cent shares that pay a hundredfold if the miracle lands. Some is liquidity provision and hedging that looks stranger in aggregate than it is in detail. But a large share is the oldest pattern in betting: retail money chasing the thrill of the impossible payout, in a venue where the thrill is dressed up as trading.
Prediction market advocates have spent years arguing these venues are information machines, truth engines that price reality better than pundits. The longshot trap complicates the pitch. Markets in which a quarter of the money sits on near-impossible outcomes are not purely information machines. They are also entertainment products, and entertainment money behaves differently: it arrives for the event, it does not shop for edge, and it leaves when the confetti drops. Both things can be true at once, the sharp pricing at the top of the book and the lottery counter at the bottom, but the ratio between them decides what these platforms are when the World Cup is not on.
The user data leans the same direction. A Bitget Wallet study of 857,000 active Polymarket users found 60% had no prior on-chain trading history of any kind. Prediction markets are onboarding people crypto never reached, an achievement by any adoption metric, and those people are arriving to bet on football, not to discover decentralized finance.
What the tournament proved about the rails
Strip out the froth and the infrastructure story is the strongest one here. Positions on Polymarket are tokens settling on-chain via Polygon, which means the tournament has doubled as a live stress test of whether blockchain rails can host institutional-scale event trading. The answer, six weeks in, is yes. You can buy France at 24% today, watch a shaky quarterfinal drop the price, and sell before the next whistle. Positions are tradeable instruments with a live order book, not slips waiting for settlement, and the distinction is precisely why turnover figures dwarf what a sportsbook handle would show for the same interest.
The flow data show the two market leaders running different races. Polymarket’s open interest has held roughly flat while volume spiked, the signature of heavy turnover, traders rotating in and out around every match. Kalshi’s open interest has climbed steadily, pointing to stickier positioning from a user base that skews more institutional and holds through events. Kalshi also entered the tournament with a war chest, having closed a reported $1 billion funding round earlier in 2026, and its $31.5 billion June says the money is being put to work against sportsbooks as much as against Polymarket.
Competition is arriving from inside crypto too. World, a Solana-based prediction market, went live inside the Phantom wallet during the tournament, using Chainlink oracles and taking direct aim at the duopoly, while ADI Predictstreet operates as FIFA’s own first official prediction market partner. The sector that spent 2024 as an election-night curiosity now has a governing-body partnership, a regulated US exchange, and venue competition on three chains. That maturation is happening alongside the industry’s broader mainstream moment at this tournament, with Kraken serving as FIFA’s first official crypto exchange partner across the same six weeks, a deal we examine in full in a companion feature.
Six weeks of price discovery, match by match
The aggregate numbers hide the part traders actually enjoyed: watching the market metabolize a football tournament in real time.
The favorites’ pricing barely moved through six weeks of chaos, France oscillating between 23% and 24% and Argentina between 20% and 21%, a stability that says the market treated group-stage drama as noise around strong priors. The action was in the tails and the match markets. Cape Verde drawing with both Spain and Uruguay to escape Group H repriced an entire bracket path in minutes. DR Congo reaching their first knockout stage since 1974 sent their sub-1% title shares on the kind of hundredfold percentage ride that longshot buyers live for, right up until Harry Kane ended it with two goals in the final fifteen minutes. Panama, priced as the group’s doormat, performed exactly to market: three losses, zero goals, and $1.76 million traded on the England fixture anyway, proof that liquidity follows attention rather than quality.
The draw markets produced the tournament’s most interesting structural signal. Prediction market traders repeatedly priced draws as the most likely single outcome in tight fixtures, 42.5% in Paraguay versus Australia, 46.5% in Algeria versus Austria, while traditional books held moneyline favorites. Two market structures, two different opinions about the same ninety minutes, and a standing arbitrage question for anyone with accounts on both. Group-stage match markets settled into a reliable $500,000 to $2 million volume band regardless of the teams involved, which is the statistic that best captures what changed: four years ago, the entire tournament did $138,000; now that is a slow first half.
The quiet winners underneath the order book
Every trade in this boom runs on infrastructure that predates it, and the tournament has been a revenue and relevance event for the stack beneath the platforms.
Polygon carries Polymarket’s settlement, which means tens of millions of tournament transactions and billions in USDC transfer volume ran through a network that spent two years searching for a flagship consumer use case and found one wearing football boots. Circle benefits wherever the collateral pool grows, since every open position is USDC sitting on-chain. Chainlink’s oracle infrastructure gained a governing-body endorsement through ADI Predictstreet, FIFA’s own first official prediction market partner, and powers World, the Solana prediction market that launched inside Phantom mid-tournament to contest the duopoly on faster rails, one more front in the widening execution-layer contest between Solana and Ethereum. Even the losers of the platform war stand to inherit something: liquidity programs, market-making firms, and resolution tooling built for this tournament become sector infrastructure that any new entrant can rent.
That is the pattern worth filing away. Prediction markets have become the rare crypto vertical whose growth mechanically feeds the base layers underneath it, stablecoin float, L2 throughput, oracle demand, without requiring anyone to believe a new narrative. The World Cup did not just make Polymarket bigger. It made the case that event markets are a durable consumer category for the chains that host them, which is why Solana wants in and why the next cycle of this fight will be fought partly on infrastructure costs.
The real opponent is DraftKings, not each other
Frame the tournament as Polymarket versus Kalshi and you miss the actual contest. The $2 billion-plus that crypto prediction markets processed in World Cup contracts is being measured in real time against sportsbook scale, and the next four weeks decide whether the platforms keep that capital or hand it back to DraftKings and FanDuel when the novelty fades.
The traditional books still dwarf the challengers on absolute handle; US regulated sportsbooks process tens of billions per year on football alone, with decades of brand, state licenses, and parlay products engineered for maximum hold. What prediction markets attack is the margin structure. A sportsbook builds roughly 4% to 6% vig into a standard two-way line and far more into parlays; a prediction market charges the spread plus small fees, with two-sided order flow compressing costs toward exchange levels. For a sharp bettor, the difference between negative-5% expected value at a book and near-zero at an exchange is the difference between a hobby and a career, which is why professional money migrated first.
The Mexico versus England Round of 16 fixture made a clean case study: a high-attention knockout tie where Polymarket’s pricing stayed tight under both retail flood and institutional size, the market-maker backbone absorbing volume without spreads blowing out. Passing liquidity tests like that, repeatedly, on the sport’s biggest stage, is how an exchange steals a customer segment that never comes back to paying vig. The books know it; their lobbying against event-contract sports markets in state legislatures is the sincerest compliment the sector has received.
The structural irony is that prediction markets may win the comparison while losing the framing. The more their World Cup product resembles a better-priced sportsbook, the stronger the state regulators’ argument that it is one.
The regulators arrive at the party
A $5 billion-plus event was always going to draw the state’s attention, and it has, from two directions at once.
The federal track came first: the Wall Street Journal reported the CFTC has opened an investigation into Polymarket, landing just as the platform’s volumes peaked and barely a year after it resumed limited US operations through its regulated exchange. The probe’s scope remains unclear, which in practice means everything from market manipulation surveillance to the perimeter question of which event contracts count as legitimate derivatives.
The state track is broader. More than a dozen state-level authorities have taken legal action against Kalshi and Polymarket, accusing them of offering unlicensed sports betting to residents. The legal theory war here is existential for the sector: if a World Cup winner contract is a financial derivative, the CFTC owns it and federal preemption shields the platforms; if it is a sports bet, thirty-plus state gaming commissions get a vote, and the compliance map fragments overnight. Consumer protection advocates have pushed the second reading hard, and the tournament’s own success is their best exhibit. It is difficult to argue that $1.6 billion of one-percent longshots is hedging activity.
The jurisdictional map adds a third layer of mess, because this World Cup spans three host countries with three different rulebooks. American users navigate the federal-versus-state fight described above. Canadian provinces run their own gaming monopolies with their own views on event contracts. Mexican users face a framework that barely contemplates the product category at all. A tournament marketed as borderless is being traded through one of the most fragmented compliance environments in consumer finance, and every platform’s growth team is effectively running fifty different products wearing one interface.
The platforms are betting that regulated structure wins the argument, and the irony is thick enough to trade: prediction markets are now the subject of the kind of binary, high-stakes, externally resolved event they would normally list. Traders being traders, they occasionally do list it. The outcome will land on an industry already conditioned by this cycle’s macro whiplash, where risk assets have traded like leveraged tech exposure and volume booms have repeatedly decoupled from underlying token prices.
The question that matters: July 20
Every liquidity boom tied to a calendar event carries the same asterisk, and this one expires at full time on July 19.
The bear case writes itself. Fan-adjacent crypto products have a documented post-tournament decay pattern; volumes tied to the Qatar cycle collapsed within weeks of the final. If June’s $44.8 billion was mostly football, July’s number tells us so immediately, and the sector’s valuation narratives, including that billion-dollar Polymarket run-rate, deflate with it. Sixty percent of those 857,000 users have no other on-chain footprint to return to. They came for the World Cup. The World Cup ends.
The bull case is quieter but has data behind it. The June figures functioned as a stress test, and the infrastructure passed: record open interest held for three straight weeks, spreads on marquee matches stayed tight under institutional size, and non-sports volume across Kalshi and Polymarket reached $3.6 billion during the same window, meaning roughly a third of the boom had nothing to do with football at all. Elections, Fed decisions, crypto prices, and cultural events all inherited liquidity and market-making muscle built for the tournament. If even a modest fraction of the new cohort stays, the World Cup becomes the sector’s customer-acquisition event of the decade, acquired at zero marketing cost.
The honest position is that nobody knows the retention number, and the retention number is the entire question. What the tournament has already settled is capacity: prediction markets can absorb global-event liquidity at sportsbook scale on crypto rails without breaking. Whether they can keep it is the trade still open on the board.
Full time approaches
The 2026 World Cup will crown a champion at MetLife Stadium on July 19, and the winner market says it will probably be France or Argentina, though a combined $1.6 billion in longshot money is praying otherwise. For the prediction market industry, the trophy has arguably been lifted already: a forty-thousand-fold improvement on its 2022 self, a June that redefined the sector’s ceiling, and proof that on-chain event trading can operate at the scale of the businesses it wants to replace. The costs of that visibility, a federal probe, a state-by-state legal siege, and a user base of unknown loyalty, all come due in the quiet weeks after the final whistle. The tournament turned Polymarket into a $5 billion market. The off-season decides whether it stays one.
Disclaimer: This article is for informational purposes only and does not constitute investment or betting advice. Prediction markets carry significant financial and regulatory risk, and availability varies by jurisdiction. Always do your own research. Information current as of July 3, 2026.


Crypto’s most prominent former regulator wants the industry to stop treating the CLARITY Act as make-or-break. Chris Giancarlo, who chaired the Commodity Futures Trading Commission from 2017 to 2019, says the technology gets built either way.
Giancarlo still wants the bill passed. However, he argues the industry has staked its public message on legislation that has sat idle in the Senate for 80 days.
The CLARITY Act Is Not a Precondition
Speaking in a recent interview, Giancarlo said the sector has overcommitted to one piece of legislation.
“Now, what I’d say to the industry is perhaps it’s time to stop making such a big deal out of CLARITY,” he said.
The timeline explains the anxiety. The House passed H.R. 3633 on July 17, 2025, by 294 votes to 134. The Senate Banking Committee advanced it 15-9 on May 14, 2026.
No floor vote has followed. The Senate calendar sends the chamber home from August 10 until September 11, leaving roughly one week of floor time.
Giancarlo pointed to an older technology as precedent.
“The industry is running around saying we need clarity, we need clarity. Yeah, we do. But the internet is still happening and there’s never been an authorizing statute 30 years later. If we don’t get clarity, innovation goes on.”
Follow us on X to get the latest news as it happens
That cuts against the message from the bill’s loudest backers, including MicroStrategy and its lead Senate author, Cynthia Lummis.
Why Giancarlo Still Wants the Bill
His position is not opposition, and part of it is personal. Section 503 codifies LabCFTC, the fintech office he created in May 2017 as acting chairman.
He wants every financial regulator in Washington to run something similar.
“I’d like to see clarity pass, but I think we need to brace ourselves that it might not and the world is going to go on.”
The Precedent That Worries Him
Giancarlo also warns that legislation drags surveillance along with it. Public Law 119-27, the GENIUS Act, subjects permitted stablecoin issuers to the Bank Secrecy Act.
CLARITY applies the same standard to digital asset transactions. Giancarlo argues that approach violates Fourth Amendment privacy rights.
What Happens If CLARITY Fails
The CFTC is running on one Senate-confirmed official. Michael Selig, sworn in as the 16th chairman in December 2025, occupies the only filled seat of five.
Giancarlo expects the agency to keep moving with or without a statute.
“This is a change that is going to happen whether the clarity bill passes or not… Clarity will bring order to how that change happens. But it’s not going to stop that change.”
Failure would separate builders from spectators, he argued.
“If clarity doesn’t pass, the… premium for courage is going to go up.”
Subscribe to our YouTube channel to watch leaders and journalists provide expert insights
The post Stop Acting Like the CLARITY Act Is Everything, Former Regulator Says appeared first on BeInCrypto.
SpaceX earnings land Tuesday, August 4, marking the first since the company went public. The June listing already paid Morgan Stanley bankers about $100 million in fees.
That fee was the small part. IPOs led by SpaceX sent more than $74 billion to the bank’s wealth arm. Now SpaceX has to show the numbers behind it.
How the SpaceX IPO Built Morgan Stanley’s $10 Trillion Quarter
SpaceX sold 555,555,555 shares at $135 each on June 11. That raised $75 billion. It is the biggest IPO ever, more than double the $29.4 billion Saudi Aramco raised in 2019.
Ten banks ran the deal. Goldman Sachs, Morgan Stanley, BofA Securities, Citigroup and J.P. Morgan led them. They all shared the fee pool.
Only one of those banks also ran SpaceX employee stock plans. That is what set Morgan Stanley apart.
Here is why it matters. When staff get rich on IPO day, the money lands wherever their stock plan already lives.
Morgan Stanley’s wealth arm took in $148.1 billion of new client money last quarter. A year ago the figure was $59.2 billion.
Just over half came from IPOs of stock plan clients, its earnings release shows. That is more than $74 billion in three months. Bloomberg reported a large share came from SpaceX.
The bank calls this unit Workplace. It bought Solium Capital in 2019 and E*Trade in 2020 to build it. Both deals pushed the firm deeper into steady fee income after the 2008 crisis.
Workplace now serves over half the S&P 500. It also covers about 70% of the 100 biggest private companies worth more than $1 billion. Total client assets passed $10 trillion.
Jed Finn runs Morgan Stanley’s wealth business. He sees the IPO as a start, not a payday.
“It would be a mistake to think about the IPO as a one-off event for asset capture. These are opportunities with multiple phases, with shares that get unlocked and new shares issued.”
Follow us on X to get the latest news as it happens
Here is the catch. Most of that money is not earning fees yet.
Morgan Stanley charges a fee once clients move cash into managed accounts. Only 26% of the new money went that way last quarter. A year earlier it was 72%.
Bloomberg puts the yearly revenue from SpaceX-linked money above $100 million. Getting it depends on shares that are still locked.
What SpaceX Earnings Have to Prove on August 4
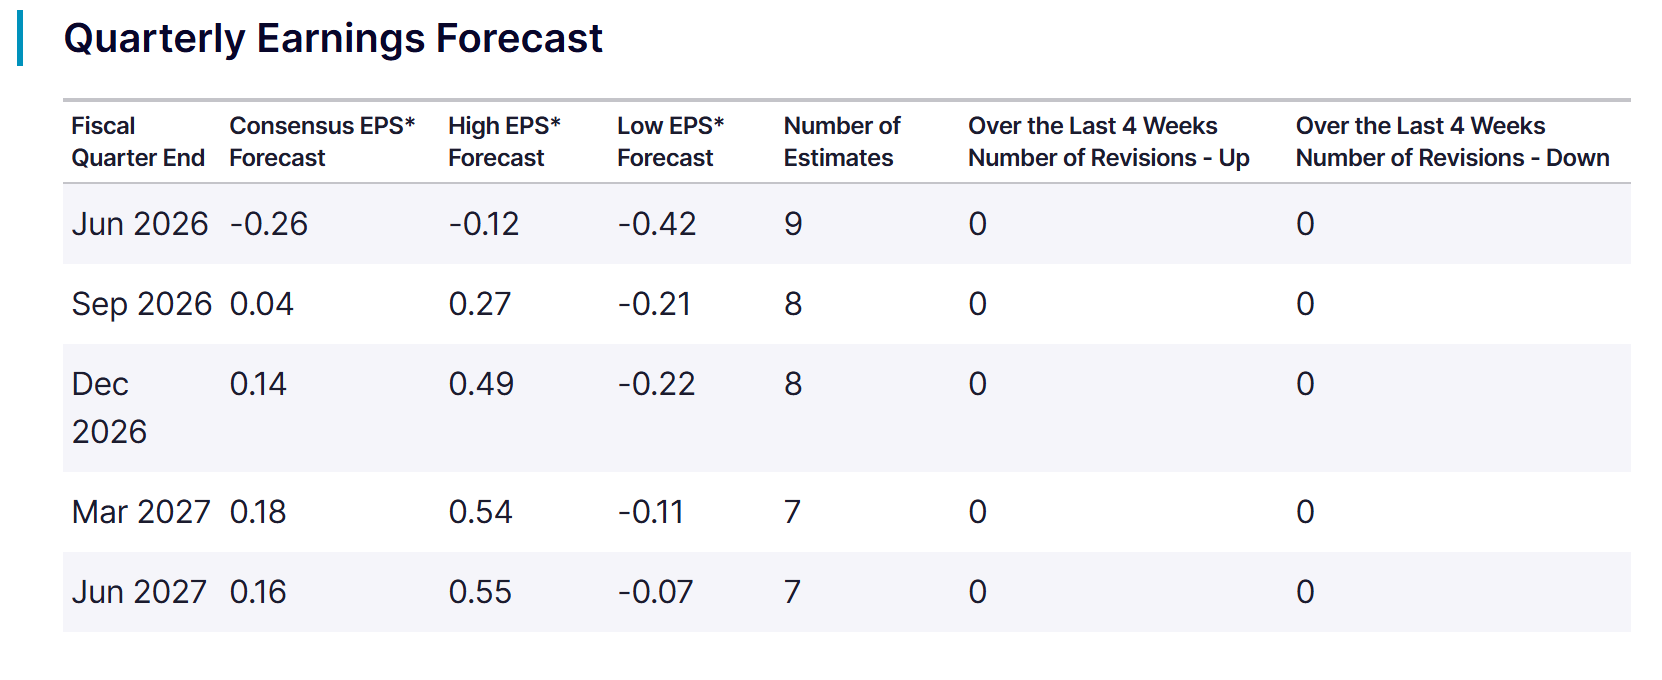
Results come after the close on Tuesday. Analysts expect a loss of 26 cents a share. Nine of them filed forecasts, per Zacks.

This is the first real look inside the business. Investors want launch numbers, Starlink revenue, and the split between government and commercial work.
The stock has not waited. SPCX closed at $108.37 on July 31. That is 20% below the $135 offer price and 33% below its $161 first-day close. It hit a record low last week.

Contracts have not helped either. Shares still fell after SpaceX won $1.6 billion in Space Force launch work through 2027.
Then comes August 6. About 911.5 million locked shares become free to sell, two trading days after earnings.
At Friday’s price that is close to $99 billion of stock. It is more than the IPO itself raised. Meta’s 2012 unlock is the closest thing to a warning here.
Morgan Stanley has already been paid. It raised its dividend 15 cents to $1.15 and approved $20 billion in share buybacks. SpaceX investors are still waiting.
The post SpaceX IPO Paid Wall Street $100 Million: Will It’s First Earnings Repay Investors? appeared first on BeInCrypto.
White House teleprompter operator Gabriel Perez is no longer employed by the federal government after being placed on unpaid leave over allegations that he used insider knowledge to bet on President Donald Trump’s speeches, according to another official.
Speaking on condition of anonymity, the official said that Perez had left his government job but did not say whether he resigned or was fired.
Inside the Allegations
The White House had suspended Perez earlier this month following an ABC News report that alleged he made more than $100,000 through bets on the online prediction market Kalshi. The report said the wagers were based on advance knowledge of what Trump would say during major speeches, including the State of the Union address earlier this year.
The allegations drew a sharp response from the White House. Press secretary Karoline Leavitt described the reported insider trading as “deeply unfortunate and, frankly, a disgrace.” Kalshi also responded after the report was published.
Robert Denault, the company’s lawyer and head of enforcement, said in a post on X that its surveillance team detected the trades, investigated them, and referred the matter to the US Commodity Futures Trading Commission (CFTC). Denault’s statement did not identify Perez by name.
Legal Battles
Kalshi has faced legal hurdles this year in Massachusetts, Michigan, Nevada, and Washington. At the same time, it has also tightened its own rules. In April, the prediction market suspended three political candidates for betting on elections they were contesting after determining that the trades amounted to political insider trading under its CFTC-approved rules.
An insider trading case on Polymarket also surfaced that same month. Federal prosecutors charged US soldier Gannon Ken Van Dyke with allegedly betting on whether former Venezuelan President Nicolás Maduro would be removed from power. Authorities said Van Dyke, who worked on the operation targeting Maduro, made about $400,000 from the trades.
The legal battle over prediction markets has also taken a new turn. This week, a federal judge temporarily blocked Minnesota from enforcing a new law that would have banned prediction markets in the state. The ruling gave a temporary win to Kalshi, Polymarket, and the CFTC as the case moves forward.
Judge Katherine Menendez said the law is likely preempted by the federal Commodity Exchange Act because many event contracts may qualify as federally regulated swaps. The law, signed by Governor Tim Walz in May, was set to take effect on Saturday. The judge said the injunction could later be narrowed if needed.
The post Teleprompter Operator Accused in Kalshi Betting Case Is No Longer a Federal Employee appeared first on CryptoPotato.


President Donald Trump reshared a White House post on Sunday about restarting California’s Sable Pipeline. The same day, OPEC+ agreed to pump more oil from September.
Both moves add oil to the market. Neither has helped drivers yet. Californians paid $5.49 a gallon in late July, the highest price in the country.
Why Trump Revived a March Order Now
Gas is expensive, and Trump knows it.
US drivers paid about $4.10 a gallon in the week to July 27, federal data shows. That is 97 cents more than a year ago.
In June, Trump told fuel retailers to cut prices to $2.50. They have not.
California hurts most at $5.49 a gallon. That is roughly $1.39 above the national average, which makes the state an obvious target.
On March 13, Trump signed an order giving Energy Secretary Chris Wright emergency powers. The law behind it, the Defense Production Act, lets Washington direct private companies during a crisis.
Wright told Sable Offshore Corp. to reopen the Santa Ynez Pipeline. It had sat unused since a 2015 oil spill.
Oil flowed the next day. Sable aimed to sell about 50,000 barrels daily from April 1, a company filing shows. The line can carry 200,000.
Courts keep pushing back. On June 17, a California appeals court blocked Sable’s coastal work, backing state regulators in a published opinion.
OPEC+ Supply Hike Opens One Tap, Not All
Seven countries agreed to pump 188,000 more barrels a day from September. Saudi Arabia and Russia account for most of that, at about 62,000 barrels each.
The move finishes one round of cuts. The group had held back 1.65 million barrels a day since April 2023. That batch is now fully back.
A second cut from November 2023 stays in place. So the taps are not fully open.
OPEC says it can still speed up, pause, or reverse, according to its July statement.
Harder talks come in 2027, when the group sets new limits for each member. Iraq already wants a bigger share.
What This Means for Crypto
More oil has not made oil cheaper.
Brent crude sat near $87 on July 20. US crude was close to $84. Those are the latest daily figures from the Energy Information Administration.
Wars in Iran and Ukraine explain the gap. They block exports, so the extra barrels stay stuck on paper.
That matters for Bitcoin. Costlier fuel pushes inflation higher, and energy costs pressure Bitcoin by making rate cuts less likely.
Cheaper fuel does the opposite. It gives the Federal Reserve room to cut, which has lifted risk assets before, such as after the Fed held rates steady.
The question now is simple. Will September’s barrels reach buyers, or stay stuck?
The post Trump’s Oil Order Meets OPEC+ Supply Hike: Why California Gas Costs $5.49 appeared first on BeInCrypto.

Data shared by Lookonchain earlier today suggests that Trump Media, the entity behind the Truth Social media platform, majority-owned by the Donald J. Trump Revocable Trust, has sold over $165 million worth of bitcoin.
This was the second substantial sale made by the entity in recent months after it had splashed over $1 billion at prices near the top last year to accumulate 11,542 units.
The on-chain analytics company noted that the latest offload was for 2,628 BTC after it had transferred the stash to crypto.com. This continued a streak that began earlier this year.
Previously, the entity had spent $1.37 billion to acquire 11,542 BTC at an average price of $118,522. Since its entry level was very close to bitcoin’s very top marked just under a year ago, this automatically means that its sales have been completed at prices well below that.
CryptoPotato reported the previous BTC disposal in May, when wallets linked to Trump Media sold another substantial batch of 2,650 BTC for $205 million.
Lookonchain’s data concurs that the entity has sold a total of 7,281 BTC since it began disposing of its assets, at an average price of under $75,000. This means that its total losses have grown to $555 million.
It looks like Trump Media sold another 2,628 $BTC($165.07M).
Trump Media bought 11,542 $BTC($1.37B) at an average price of $118,522, then started selling 7 months ago, selling a total of 7,281 $BTC ($545M) at an average price of $74,855.
Trump Media is now down a total of $555M… pic.twitter.com/9xx0MTbweg
— Lookonchain (@lookonchain) August 2, 2026
Aside from the continuous controversial decisions toward the crypto industry from the POTUS-linked companies, this move builds on a recent worrisome trend about BTC treasury firms deciding to sell during times of distress.
As we reported last week, several public companies have shifted their strategies, with some selling BTC holdings while others have paused buying the asset indefinitely.
The post Trump Media Sells Another $165M in Bitcoin, Booking a Fresh Loss appeared first on CryptoPotato.
After two consecutive painful months in which they lost billions of dollars, the spot Bitcoin ETFs finally turned the page in July, but inflows were still modest.
Meanwhile, the exchange-traded funds tracking the performance of the largest altcoin enjoyed the month more, attracting over 2x more fresh capital.
Bitcoin ETFs in July
March and April were quite bullish for the spot BTC ETFs as the financial vehicles attracted well over $3 billion. However, the trend changed violently in May when they lost $2.43 billion. June became the worst month on record, as investors pulled out just over $4.5 billion. In total, the net outflows for May and June stood at nearly $7 billion, and the cumulative total flows dropped from over $58 billion to $51 billion.
July started more positively, with almost $200 million in net inflows during the first full week. Another $76 million followed during the second, and a more modest $34 million in the third. The trend was obvious as the initial high numbers gradually declined, aligning with the underlying asset’s controversial and sporadic price performance and ultimately leading to a very modest increase throughout the month.
The last week in July was once again in the red, with investors pulling $61.53 million out of the funds. Friday was the most painful day, as the total net outflows stood at over $265 million. As such, the month ended with $172.42 million. On one hand, green finally overcame the red wave, but on the other, the number was nowhere near enough to offset some of the recent losses.
ETH ETFs Do Better
The Ethereum ETFs entered July after a similarly painful two-month streak, in which they lost $541 million in May and another $529 million in June. However, investors were more persistent, and the actual net inflows for July were at a more respectable $365.17 million, thus outpacing the BTC ETF flows by over 2x.
Moreover, the ETH ETFs closed all four full weeks of July in the green, including the last one, which saw only one day in the red. Perhaps this investor behavior is among the reasons behind the underlying asset’s major resurgence in July. As reported earlier, ETH ended the month with a substantial 20% increase, making it the best in precisely a year.
All eyes are now on August, which hasn’t been ETH’s most favorable month historically, but there are some major double-digit exceptions.
The post Bitcoin vs. Ethereum ETF Battle: Who Won July? appeared first on CryptoPotato.
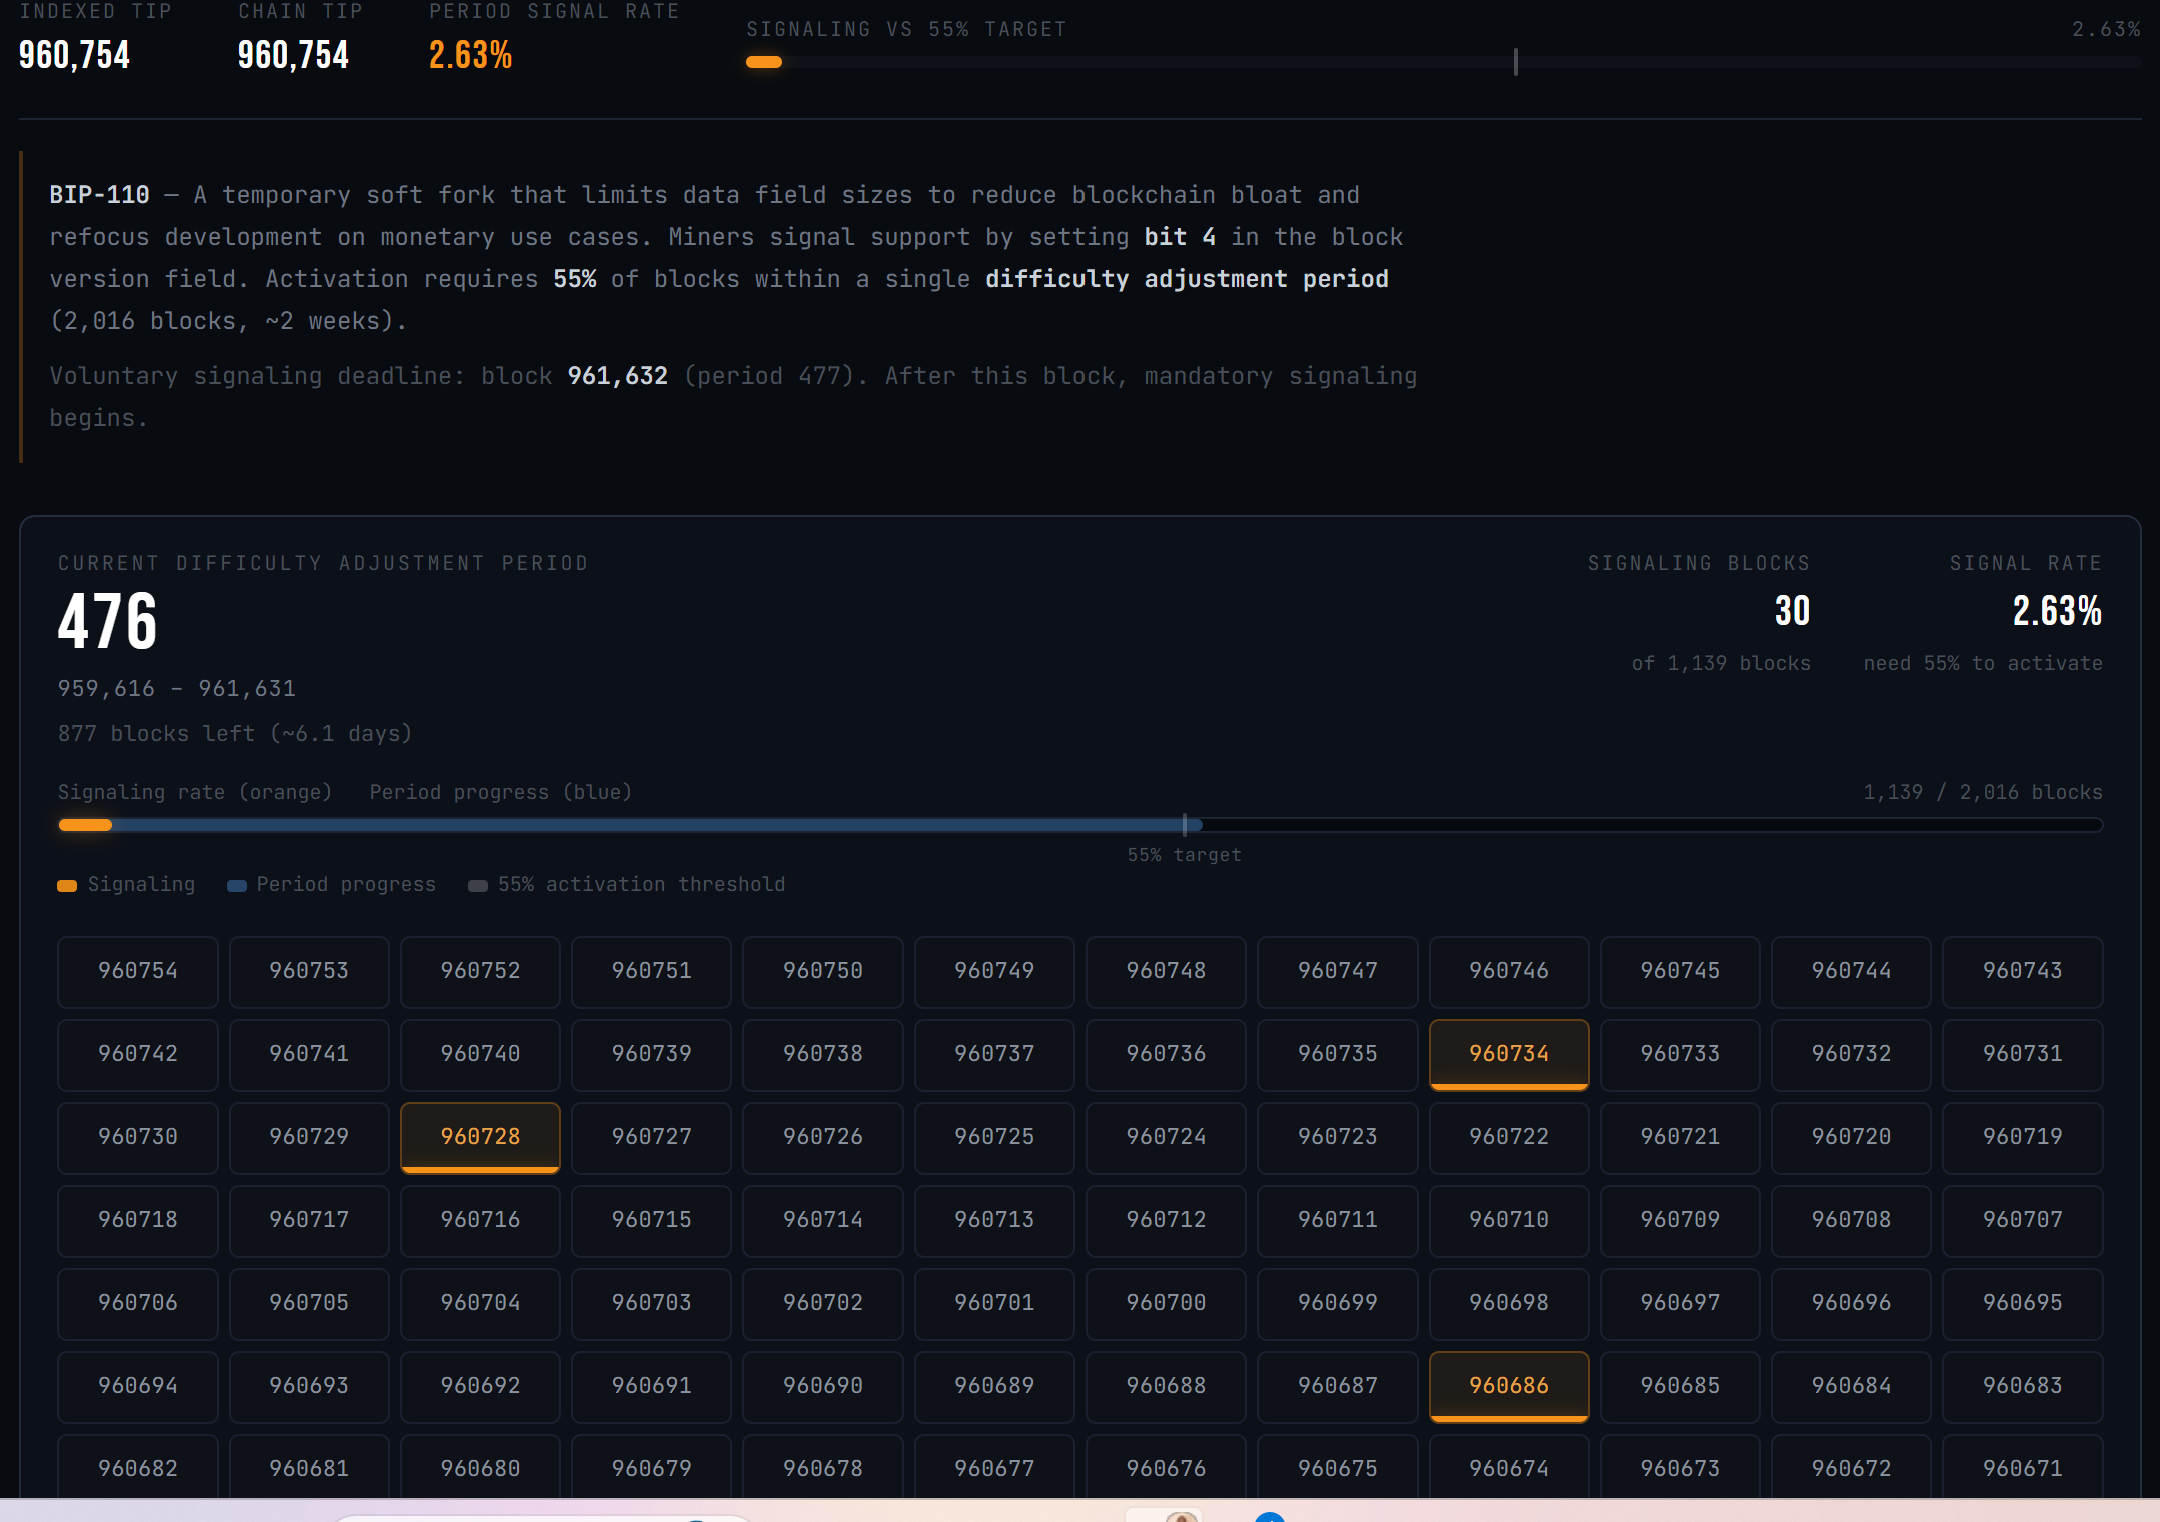
The developers pushing Bitcoin’s BIP-110 rule change have called off its launch. They blamed the industry response to a Coldcard wallet flaw that left user funds easier to steal.
Udi Wertheimer announced the delay, urging anyone running BIP-110 software to switch back to a normal Bitcoin (BTC) node. He gave no new date.
Why BIP-110 Activation Was Paused
BIP-110 is a temporary rule change, known as a soft fork. It would limit how much data people can pack into Bitcoin transactions.
Supporters say that data crowds out ordinary payments. Critics say Bitcoin should not police what users store.
The limits would last one year. Developer Dathon Ohm wrote the rules, and Bitcoin Knots software ships them.
Miners started voting on December 1, 2025. The Bitcoin blockspace spam debate had already split the community.
Then a separate problem landed.
Coinkite disclosed the bug on July 30. Its COLDCARD wallets built seed phrases, the master key behind a wallet, using far less randomness than promised. Roughly 72 bits instead of 128.
That gap makes a seed vastly easier to guess. Wallets running firmware released since March 2021 were hit hardest.
Updating the device does not fix a seed it already made. Coinkite is telling owners to move their money.
Thieves had already drained wallets tied to the flaw. The company has not said how much was lost.
Wertheimer called the delay a matter of timing, not doubt.
“…due to the coldcard incident, BIP-110 community leaders have decided to DELAY ACTIVATION. a new activation date will be announced at a later time,” he wrote.
Follow us on X to get the latest news as it happens
The Math Was Already Settled
Miners back a rule change by flagging their blocks. BIP-110 needed 55% of blocks in a two-week stretch. That means 1,109 blocks. The live monitor counted 30.

That is 2.63% of 1,068 blocks mined this period. It is the best BIP-110 has ever managed. It is still more than 20 times short.
Every earlier two-week stretch since December finished below 1.3%. Only 948 blocks are left. Even if every one voted yes, the total would reach about 48%. It could not pass this round.
That was already true days before anyone announced a delay.
Michael Saylor has warned about Bitcoin neutrality for weeks. He says almost every yes vote comes from one mining pool. Blockstream chief executive Adam Back has flagged chain split risk, calling the 55% bar too low to be safe.
A second phase was due at block 961,632, about six days away. It would reject any block that did not vote yes.
Nodes still running BIP-110 would enforce that on their own. That is why the warning to switch back matters.
No one owns Bitcoin’s rules. Nobody can flip a switch to start or stop a soft fork. This was a request, not a command.
Whether operators listen will say more about BIP-110’s support than any vote counter has.
The post BIP-110 Activation Frozen After Coldcard Exploit: Is the Soft Fork Dead? appeared first on BeInCrypto.
Senators Ruben Gallego and Thom Tillis sent a proposed revised ethics provision to the White House on Thursday, after drafting the compromise the day before, an industry source familiar with the talks told CoinDesk. As of midafternoon on Friday, the White House had not officially responded to the proposal.
Ethics remains the biggest outstanding issue to be resolved before the Clarity Act can advance. There are ongoing negotiations around other issues, including stablecoin reserves and yield, law enforcement authorities and some of the Agriculture Committee provisions addressing the Commodity Futures Trading Commission’s total remit, but these are relatively uncomplicated compared to ethics, two industry sources said. One added that they expected those other issues to be resolved relatively quickly should negotiators come to a deal on ethics.
If the White House signs off on the counter-proposal from Tillis and Gallego, that could speed the way to at least the first part of the cloture process, the other source told CoinDesk. The Senate would still need to follow the cloture process laid out in last week’s edition of this newsletter, but the timelines involved mean that it would be difficult to get the bill all the way through by the end of the week. Still, getting through that first procedural vote would be a visible win for the crypto industry, should it happen.


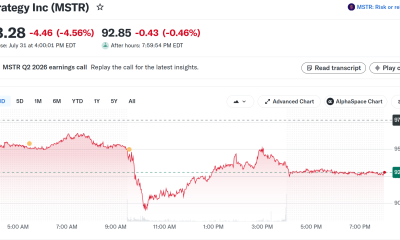
Strategy Inc. kept the annual dividend rate on its STRC preferred stock at 12% for August 2026, even though the Nasdaq-listed security ended July more than 10% below its $100 stated amount.
Summary
- 12% annualized dividend remains unchanged for August despite STRC closing July at $89.46 per share.
- $3.75 billion reserve covers roughly 2.1 years of preferred dividends and debt interest payments currently.
- Strategy repurchased 288,930 STRC shares below par while retaining $975 million in remaining authorization capacity.
The company’s official STRC information page confirms that the variable annualized rate for record dates beginning in August remains 12%. Executive Chairman Michael Saylor promoted the product on Aug. 1 as a way to “stretch your income,” emphasizing its twice-monthly payment schedule.
STRC closed at $89.46 on July 31, down $0.25 during the session. At that price, the $12 annualized payout based on the security’s $100 stated amount produces an effective yield of about 13.41%. Because Saylor announced the unchanged rate during the weekend, no post-announcement market reaction will be available until Nasdaq trading resumes.
Strategy’s STRC dividend no longer rises automatically
Strategy raised STRC’s annual dividend from 11.5% to 12% for record dates beginning in July. The increase followed a sharp June decline that took the shares as low as $71.25 and moved them far below the $100 level the company wants to maintain.
However, the company changed its rate-setting policy on June 29. Under the revised framework, management considers STRC’s market price, credit spreads, competing yields, Bitcoin volatility, cash-reserve coverage and the wider capital structure. The filing specifically states that Strategy will not necessarily raise the dividend solely because STRC trades below its stated amount.
That policy explains why July’s discount did not produce another 50-basis-point increase. Strategy instead said during its second-quarter results that it would maintain the 12% rate until STRC shows “sustained, healthy trading” near $100. The language describes management’s objective and does not guarantee that the shares will return to par.
The decision also prevents Strategy’s cash obligations from rising further while the company attempts to repair demand through other measures. Every additional 50 basis points would increase the annual cash cost across more than $10.46 billion in outstanding STRC stated value.
Buybacks now carry more of the price-support burden
Strategy has shifted part of its response from dividend increases to preferred-share repurchases. Between July 20 and July 26, the company bought back 288,930 STRC shares for approximately $25 million, paying an average of $86.53 per share. The purchase represented a 13.47% discount to the shares’ stated amount.
About $975 million remains under Strategy’s $1 billion preferred-securities repurchase authorization. Management said it intends to purchase more STRC at deeper discounts and reduce its activity as the security approaches $100. The authorization does not require Strategy to spend the remaining amount and has no fixed expiry date.
Repurchasing shares below par reduces the number of preferred shares requiring future cash distributions. It also lets Strategy retire $100 of stated value for less than $100. However, buybacks use capital that could otherwise remain available for dividends, debt interest or Bitcoin purchases.
As previously reported, Strategy funded its first $25 million STRC repurchase while increasing its U.S. dollar reserve and keeping Bitcoin purchases paused. The company raised much of that liquidity through sales of MSTR common stock rather than new STRC issuance.
The $3.75 billion reserve supports the 12% payout
Strategy reported a $3.75 billion U.S. dollar reserve as of July 26. The company said that amount covers approximately 2.1 years of expected preferred-stock dividends and interest on outstanding debt. The reserve can only be used for those obligations unless the board approves another purpose.
The cash cushion has become more important because Strategy’s preferred-stock commitments have expanded. The company recorded $400.7 million in preferred dividends during the second quarter, compared with $49.1 million one year earlier. It has paid or declared more than $1 billion in cumulative preferred distributions.
Strategy also reported an $8.22 billion second-quarter net loss, driven mainly by an $8.32 billion unrealized loss on its Bitcoin holdings. The accounting loss did not represent an equivalent cash outflow, but the preferred dividends must be paid in U.S. dollars.
The company has therefore authorized Bitcoin sales to refill the reserve, cover dividends and interest, or finance approved security repurchases. Strategy had sold approximately $218.4 million of Bitcoin during 2026 through July 26 to fund part of its preferred obligations.
As crypto.news reported, Strategy held 843,775 BTC at an average acquisition cost of about $75,476 as of July 26. The company valued that position at $54.77 billion using Bitcoin’s July 27 market price, compared with its $63.69 billion original cost.
STRC holders receive two payments each month
STRC moved from monthly to semi-monthly distributions after shareholders approved the change in June. Record dates now fall on the 15th and final day of each month, with payments generally following around 15 days later.
Strategy has already declared a payment of $0.50 per share for Aug. 15 to investors recorded as shareholders on July 31. The company’s website lists the 12% rate for August record dates, but future cash distributions still require board or committee approval and are not guaranteed.
For U.S. federal tax purposes, Strategy expects the current payments to be treated as returns of capital to the extent of an investor’s tax basis. That is the company’s expectation rather than a guarantee of each shareholder’s treatment, and Strategy advises investors to seek tax guidance based on their own circumstances.
STRC is also unsecured. Strategy states that its preferred securities are not collateralized by its Bitcoin holdings and only hold a preferred claim on the company’s residual assets. The company further warns that STRC is not a bank deposit, is not FDIC-insured and does not carry the same protections as Treasury securities or money-market funds.
What happens next for STRC and Strategy
Chief Executive Phong Le said management’s objective is for STRC to trade between $99 and $100 “over time.” Strategy has not provided a deadline for reaching that range, and the shares’ $89.46 closing price shows that the market continues to demand a yield above the stated 12% rate.
The next confirmed event is the Aug. 15 distribution. Investors will then watch Strategy’s next monthly rate decision, further STRC repurchases and weekly SEC disclosures covering common-stock sales, Bitcoin transactions and changes to the dollar reserve.
Saylor separately posted “Bitcoin Drive engaged” on Aug. 2 alongside the company’s treasury chart. The message may fuel expectations of a new purchase disclosure, but the post does not confirm that Strategy bought Bitcoin or reversed its recent pause. An SEC filing or company announcement would be needed to verify any transaction.
As of then, Strategy is relying on its existing 12% rate, twice-monthly payments, cash reserves and discounted repurchases rather than offering STRC investors another dividend increase.
The spot exchange-traded funds tracking Ripple’s cross-border token continue with their impressive performance in times of market uncertainty, and saw only one day of no reportable action in the past week, unlike the previous ones.
July also ended in the green for the funds, meaning that only one out of the nine months they have been active was in the red.
The Good Weekly and Monthly
Data from SoSoValue shows that Monday and Wednesday were quite modest in terms of net inflows. On both days, the ETFs attracted just under $600,000. However, the green streak continued and accelerated at the end of the business week, with $6 million in net inflows on Thursday and another $7.7 million on Friday.
Thus, the week ended with $14.86 million in the green, making it the best since the one that ended on July 2, when the funds attracted $17.19 million. On a monthly scale, investors poured in $27.29 million into the spot XRP ETFs.
What’s even better is that the funds have reached another all-time high in terms of cumulative total net inflows, at over $1.5 billion as of Friday’s close. Bitwise’s XRP has extended its lead over Canary Capital’s XRPC, with $511 million in net inflows compared to $467 million for the latter.
The Bad
Although July indeed ended in the green, the actual net inflows were not all that impressive. The $27.29 million places July as just the second-worst month, beating only January when investors inserted $15.59 million into the funds.
In contrast, June was a lot more positive, with the net inflows standing close to $60 million. May was even better, with almost $132 million. The all-time high from November at $666.61 million remains untouchable.
The Ugly
Although this improved at the end of the month, July saw the most days with no reportable action in terms of net flows. Precisely half of the trading days (11 out of the 22) saw no flows, according to SoSoValue, which, aligned with the more modest $27.29 million in net inflows, suggests dwindling interest in the funds.
Separately, the underlying asset’s price performance continues to disappoint despite the numerous positive developments in the broader Ripple ecosystem. Although it managed to defend the $1.05 support during the weekend, XRP is still below $1.10, and it’s down by more than 3% on a monthly scale. What’s even more worrisome is the fact that August has been a particularly painful month for the asset historically.
The post Ripple (XRP) ETF Monthly Recap: The Good, The Bad, and the Ugly appeared first on CryptoPotato.

Motor City Machine Guns debut on AEW Collision, bolster tag division

Pentagon acknowledges the US lags in drone war, taps Ukrainian tech to become ‘World Champions’

#shorts LIVE CRYPTO TRADING | #Bitcoin Live Trading | #live #bitcoin #trading #btc #tradewithsuhani

Renter of Home in Anne Heche Crash Denies Settlement With Son

No Jackpot Winner as $257 Million Prize Rolls Over to $269 Million Monday Draw

Weekend Open Thread: Staud – Corporette.com
#shorts LIVE CRYPTO TRADING | #Bitcoin Live Trading | #live #bitcoin #trading #btc #tradewithsuhani

financial accounting 4th semester || financial accounting

POV: You finally believed in yourself #disciplinedtrader #forextrading #fyp #stocks #crypto #trading
-

 Business4 days ago
Why Trees Belong on the Risk Register
-

 Fashion2 days ago
Weekend Open Thread: Wit & Wisdom
-

 Tech7 days ago
Intel is reversing course and bringing hyper-threading back to its server chips
-

 Politics2 days ago
Meta enters AI-training agreement with far-right ‘propaganda rag’ Newsmax
-

 Politics6 days ago
Luke Littler dismantles Gerwyn Price to retain title in Blackpool
-
 Crypto World1 day ago
MicroStrategy Post-Earnings CLARITY Act Push Could Add New Catalyst for Its Stock
-

 Politics5 days ago
The Part of the Electric Transition Nobody Wants to Discuss
-
 Entertainment5 days ago
‘Stargate’ Creator’s New Sci-Fi Series Returns for Season 3 Tomorrow
-

 News Videos7 days ago
BITCOIN JUST ENTERED THIS CRITICAL ZONE…
-

 Business5 days ago
Major shareholder moves on Canyon
-

 News Videos3 days ago
Bitcoin Enters the 3rd Stage of the Bear Market
-

 Crypto World2 days ago
XRP Ledger v3.3.0 brings five institutional features
-

 Crypto World5 days ago
Kraken Enables Retail Access to Jersey Mike’s IPO via Tokenized Shares
-

 Tech6 days ago
New macOS Sequoia & Sonoma security updates for older Macs
-

 News Videos5 days ago
Claude: Build Financial Dashboards in Minutes (2026)
-

 Politics3 days ago
Luke Littler’s dominance sparks GOAT debate
-

 Business5 days ago
Johnson & Johnson agrees to $5.5B settlement over talc cancer claims
-

 Sports3 days ago
Seema Kaliramna Wins Discus Throw Bronze, Takes India’s CWG Medals Tally To 17
-

 Crypto World11 hours ago
Crypto PAC spending tops $2M in Michigan House race
-
 Business2 days ago
Trump Announces Hamas Disarmament Agreement as Iran Strikes Kuwait Air Base and US Attacks Pause Overnight
You must be logged in to post a comment Login