
Crypto World
Trezor’s summer of hacks continues with Brevo email breach



Trezor is facing yet another security dilemma after its third-party email partner Brevo was breached, exposing Trezor users to a series of phishing emails.
The wallet maker revealed that hackers were able to access its email domain, which it’s since taken down, and is now launching an investigation.
Scammers warned Trezor newsletter subscribers of a “Critical Security Alert: STM32 Entropy Vulnerability” before trying to convince them to give up their wallet backups.
Read more: Trezor says mailing breach leaked 67K more users than first thought
Brevo is also the email provider for crypto firms BitBox, CoinTracking, Peach Bitcoin, and Blocktrainer, all of which have warned users to be wary of phishing emails.
CoinTracking phishing attempts used a fabricated breach to try and trick users, while BitBox phishing attempts warned of a microcontroller entropy bug.
Bad summer to be a Trezor partner
In August, Trezor revealed that its third-party shipping partner ShipMonk was breached, causing the details of 13,689 Trezor customers to be leaked.
The company then revealed a month later that ShipMonk’s leak actually impacted over 80,000 customers.
Trezor was also informed that ShipMonk hadn’t been sticking to a 90-day data deletion policy as promised.
Protos has reached out to Trezor for comment and will update this piece should we hear anything back.
Got a tip? Send us an email securely via Protos Leaks. For more informed news and investigations, follow us on X, Bluesky, and Google News, or subscribe to our YouTube channel.


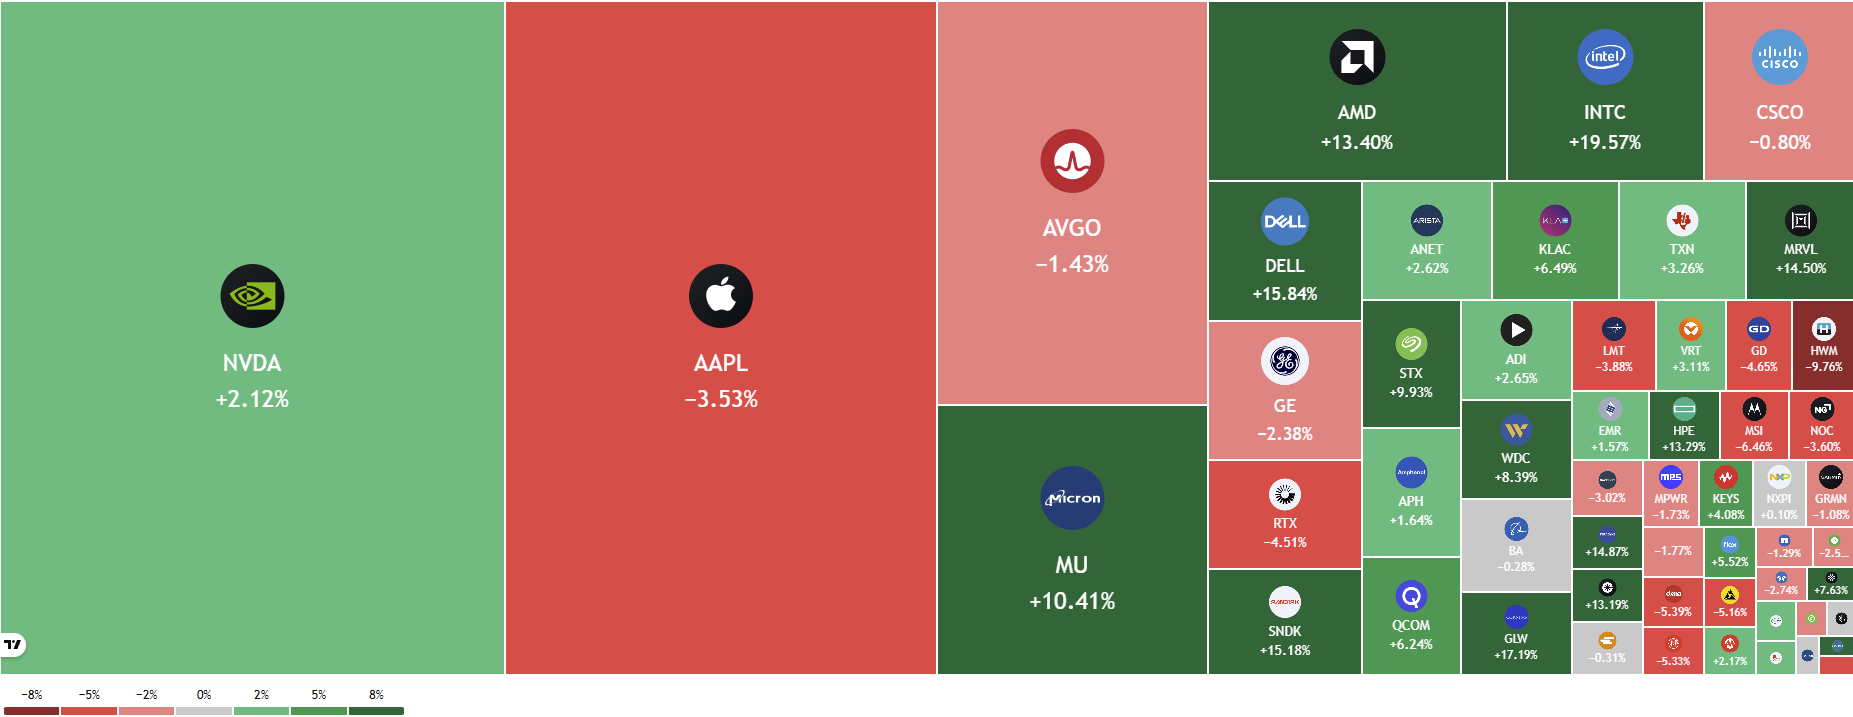
Intel Corporation (INTC) and Advanced Micro Devices (AMD) cleared multi-month resistance over the past week. Meanwhile, Nvidia (NVDA) gained just 2.12%, and Broadcom (AVGO) fell, pointing to rotation inside the AI chip trade.
Intel closed Wednesday at $106.24 and AMD at $521.10. Both eased in Thursday pre-market trading, and both still sit below their 2026 highs.

Server CPU Shortage Hands Intel and AMD Pricing Power
The rally rests on a shift in how AI workloads consume compute. Training leaned on GPUs. However, agentic systems need CPUs to coordinate tasks and move data.
Analysts now model the GPU-to-CPU ratio falling from roughly eight to one toward parity. AMD projects a $120 billion server CPU market by 2030, against a base near $30 billion.
Supply confirms the demand. Intel backlogs run beyond six months, and EPYC processors are effectively sold out for 2026. Server CPU prices have climbed 10% to 35% per quarter.
Both companies also drew their own catalysts. DigiTimes reported Intel plans a 10% CPU price increase in October. Northland upgraded the stock to Outperform with a $120 target. AMD, meanwhile, pitched a $3 trillion addressable market at the Citi Global Technology Conference, and Piper Sandler initiated coverage at Overweight.
Intel Breaks Its Downtrend and Tests $103.49
Intel remained sideways in August, just under the $95 price of its $20 billion share offering. The stock broke its descending resistance trendline on September 4.
Volume and news arrived together. Intel gained 4.5% that Friday, then 9% on September 8. A filing showing Nvidia’s Intel stake is now worth $30 billion drove the second move.
Price currently sits inside the 0.382 Fibonacci retracement at $103.49. The swing high from July 15 at $109.30 marks the next resistance.

The daily Relative Strength Index (RSI) turned first. It broke its own downtrend in early August, roughly a month before the price did. That line then held as support on August 24.
RSI now reads near 63 and rising. Notably, readings above 70 capped nothing during Intel’s April advance, when RSI peaked near 87.

AMD Clears Its Triangle and Flips $514.39 to Support
AMD traded inside a symmetrical triangle from mid-June until September 9. The stock closed at $521.10 that day and broke the upper boundary. The move cleared the previous swing high at $514.39, which should now act as support.
The $540 to $555 band is the next supply zone, sitting below the all-time high of $584.73.
AMD reported second-quarter data center revenue of $6.7 billion, up 107%. Third-quarter revenue is guided to roughly $13 billion. The stock went nowhere while earnings climbed, which compressed its multiple. Forward price-to-earnings now sits near 47, against a trailing figure above 130.

Volume has broken its own May downtrend, although it remains below the peaks set earlier in the year.
The two setups differ. Intel is attempting a reversal and still trades 25% below its 52-week high. AMD is continuing an uptrend from 11% below its high.
Money flow data had already shown institutions preferring AMD to Nvidia. Risks remain, however, with Intel Foundry losing $2.089 billion last quarter and AMD gaming revenue down 31%.
The post 2 Chip Stocks Broke Out This Week. Neither Was Nvidia appeared first on BeInCrypto.
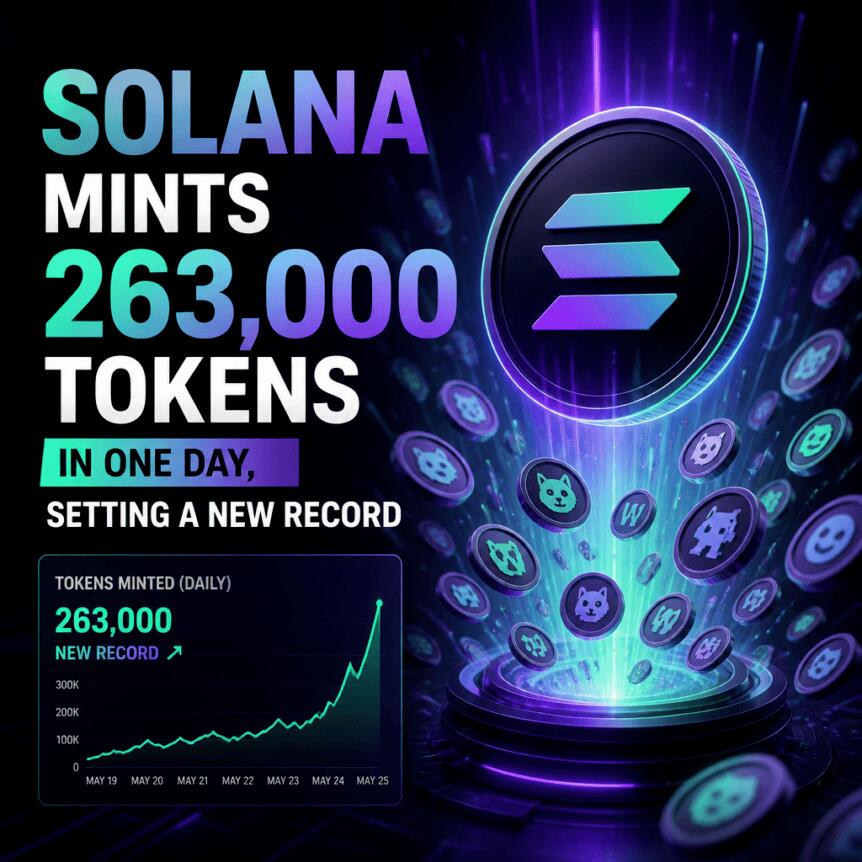
Solana has not only maintained its position as the dominant chain for retail token experiments—it is currently seeing an unusually high burst of new token creation. On Wednesday, the network recorded an all-time high in daily token issuance, with more than 263,000 new Solana Program Library (SPL) tokens minted.
That volume eclipses the scale seen during the late-2024 memecoin boom, when daily issuance was roughly in the 40,000–50,000 range. The latest jump underscores how quickly Solana’s ecosystem can shift when meme trading and launchpad activity pick up momentum.
Key takeaways
- Solscan data shows Solana minted 263,000+ new SPL tokens in a single day, a new record.
- Daily token creation in December 2024 during the memecoin cycle peaked at about 40,000–50,000 tokens.
- According to Blockworks, 40,360 tokens were issued via launchpads, with Pump.fun creating 34,184.
- DefiLlama reports Pump.fun generated $1.8 million in revenue over the past 24 hours, indicating that new token minting is being matched by monetized activity.
Record SPL token creation signals a memecoin-heavy issuance wave
The core data point comes from Solscan, which tracks newly created tokens on-chain. On Wednesday, more than 263,000 SPL tokens were minted—an all-time high for daily issuance on the network.
For readers trying to gauge whether this is “noise” or a structural shift, the comparison to December 2024 matters. During the peak of the memecoin cycle in late 2024, between 40,000 and 50,000 new tokens were issued per day. Wednesday’s total is several multiples higher than that earlier high-water mark, suggesting issuance activity has moved into a new tier.
Importantly, token minting volume alone does not guarantee market quality. Still, sustained bursts of creation typically correlate with periods when launchpad usage, speculative token demand, and retail attention align—especially in meme-driven segments.
Launchpads are driving the bulk of new tokens
Most of this issuance appears to be concentrated through established token-launch infrastructure. Blockworks’ dashboard shows that 40,360 tokens were issued through launchpads, and within that subset, the dominant share came from Pump.fun.
Blockworks reports that Pump.fun created 34,184 of those launchpad-issued tokens, accounting for the majority of launchpad-driven issuance. That concentration is notable: instead of many independent token creation paths competing evenly, a single protocol is capturing the most momentum.
In practical terms, launchpads lower the friction needed to bring tokens to market. They automate token creation and help deliver immediate liquidity and visibility—features that can speed up the “meme-to-trade” loop that retail traders tend to favor.
Pump.fun’s revenue underscores real economic pull behind the minting surge
While higher token issuance reflects technical and user behavior, the economics show whether activity is translating into fees and sustained engagement. According to DefiLlama, Pump.fun generated $1.8 million in revenue over the past 24 hours.
DefiLlama data also indicates that revenue leadership can shift even within short windows. The article notes that last Friday Pump.fun’s daily revenue was briefly overtaken by Fomo, a trading app that combines crypto trading with social feed-like features.
This matters because it suggests the market is not simply “minting for minting’s sake.” Instead, at least part of the token creation surge is being backed by monetization engines that traders interact with—potentially strengthening liquidity discovery and keeping token launches within a tighter promotional feedback loop.
Why this is more than just another memecoin headline
Solana’s record issuance should be read alongside what the ecosystem has been doing with memecoin cycles. Earlier coverage referenced in the source highlights that Pump.fun accounted for one-third of Solana’s first-quarter revenue in 2026, or $124 million out of $342 million, even as memecoin activity cooled.
That combination—meaningful contribution to revenue during a slowdown—implies that Pump.fun’s role may be larger than day-to-day memecoin volatility. If a protocol captures a substantial portion of both token creation and fees, then periods of accelerated issuance can have outsized impact on chain-level economic flows, not just token counts.
Still, uncertainty remains. A spike in minted tokens can also mean an increase in lower-quality launches, duplicates, or short-lived experiments that do not attract sustained trading. For investors and traders, the key watch items are therefore less about raw issuance and more about whether liquidity and trading interest remain strong after launch cycles pass.
In the next few sessions, market participants should monitor whether the daily token creation record persists, whether launchpad concentration continues to widen toward Pump.fun, and how competing social-trading apps perform relative to Pump.fun’s revenue. Those signals will help clarify whether Wednesday’s surge is the start of a new sustained regime—or simply a temporary peak driven by retail timing.

Ethereum trades at $2,470 as VanEck comes with a prediction news, calling the ETH base case at $11,800 by 2030. Another analyst goes further, modeling $14,135 by 2031. There’s also a number further down this piece that has nothing to do with Ethereum’s roadmap but everything to do with where early capital is rotating right now.
The bullish long-term case rests on fee revenue and staking yields, not hype. VanEck’s Matthew Sigel argues Ethereum’s path to five figures depends on Layer-2 scaling and institutional smart contract adoption, pulling value back to the mainnet. He is treating ETH less like a speculative token and more like a cash-producing settlement asset.
On the near-term side, over 116,000 ETH, or around $300 million left on exchanges in the past 48 hours, a signal traders typically read as easing sell pressure.
Zoom out and the market looks caught between two timelines: a tight consolidation this week and a five-figure valuation model for the decade. That tension is exactly where the next section starts.
Earn $50 and Enter $300K Prize Draw on EdgeX
Can Ethereum Price Hit $2,600 This Week Amid VanEck’s News?
ETH is boxed into a narrow range, having faded from a recent high near $2,550 without confirming a breakout. Support sits at $2,380–$2,430; resistance stacks up at $2,535–$2,600.
A clean weekly close above $2,540 would likely open the door toward $2,700 and, eventually, the $3,000 level analysts have flagged as the next magnet.

The base case: continued chop inside the range until volume picks a direction. The bull case: a break above $2,540 triggers momentum buying, with Tom Lee’s $10,000+ by 2027–2028 call gaining traction if it holds. The bear case: failure to hold $2,380 support reopens a retest of the low-$2,300s.
For context on how analysts are stacking targets, see this $6,000 target breakdown and the network’s upcoming protocol upgrades, both relevant to whether Ethereum’s fundamentals justify current price action.
Trade Ethereum on Bybit and Get a Chance to Win Our $1,000 USDT Airdrop
Bitcoin Hyper Targets Early Mover Upside as Ethereum Tests Key Levels
If ETH’s five-figure 2030 targets hold up, the math still favors capital already positioned. A $2,470 entry today doesn’t carry the same multiple potential as it did in 2020.
This is the trade-off long-term holders are quietly running: strong fundamentals, but diminishing asymmetric upside at this market cap. It’s why some traders are rotating a slice of capital into earlier-stage infrastructure plays instead.
Bitcoin Hyper is refining the developer experience with clearer documentation, familiar tooling, predictable APIs, and better feedback for builders. — Bitcoin Hyper (@BTC_Hyper2) September 2, 2026
The goal: make the network easier to understand, connect existing tools, and start building with less friction. 

Read the… pic.twitter.com/kAo1w7Xa06
Bitcoin Hyper ($HYPER) is positioning itself as the first Bitcoin Layer 2 with full SVM integration, claiming faster execution than Solana itself. The presale has raised $33,119,143.07 at a current token price of $0.013686, with staking APY offered.
Its core pitch: solving Bitcoin’s slow transaction speeds and lack of programmability via a decentralized canonical bridge and low-latency L2 processing, while preserving Bitcoin’s base-layer security.
Research Bitcoin Hyper directly before the funding window closes.
Discover: The Best Token Presales
The post Ethereum News: ETH Price Could Surge to $11,800 by 2030, Analysts Say appeared first on Cryptonews.

Investors are losing faith in the once high-flying battery storage company Fluence Energy (FLNC). Over the past week, analysts at Barclays and Piper Sandler issued bearish calls on the stock. Shares are at their lowest point in about year after tumbling 66% since June, according to MarketSurge. Fluence was down 1% ahead of Thursday’s open. Fluence specializes in making battery…
Copyright ©2026 Investor’s Business Daily, LLC. All rights reserved. 87990cbe856818d5eddac44c7b1cdeb8


- REAL Finance’s $ASSET white paper is now listed in ESMA’s MiCA register.
- ESMA listing gives $ASSET a standardised disclosure reference across Europe.
- REAL Finance targets over €3.5 billon in tokenised assets across Europe.
Real Technologies Inc., issuer of the $ASSET token used by the REAL Finance network, has had its crypto-asset white paper listed in the European Securities and Markets Authority’s Interim MiCA Register, giving the project a centralised disclosure reference under the European Union’s crypto rules.
The entry sits in the register for crypto-assets other than asset-referenced tokens and e-money tokens, which falls under Title II of MiCA.
ESMA stresses that white papers appearing in the register have not been reviewed or approved by an EU competent authority, leaving responsibility for their contents with the issuer.
MiCA listing adds a regulatory reference
For REAL Finance, the listing creates a common disclosure point that exchanges, institutions and other counterparties can consult when assessing $ASSET across European Economic Area markets.
The move follows the token’s listing on Kraken, where trading went live on April 30. REAL Finance says $ASSET has also traded on KuCoin and MEXC since April.
“Being listed in ESMA’s Interim MiCA Register gives institutions and exchanges a single, transparent reference for evaluating $ASSET instead of thirty separate national processes. It’s a foundational step for how we want to operate in Europe,” said Ivo Grigorov, CEO of REAL Finance.
The company said the notification addresses a different layer from exchange access, providing standardised regulatory disclosure rather than guaranteeing that any platform will list or continue supporting the token.
REAL Finance pushes deeper into tokenised assets
REAL Finance is positioning the network around the tokenisation of real-world financial assets, an area attracting growing attention from banks, asset managers and regulators.
The company says it aims to tokenise more than €3.5 billion of assets through its European ecosystem and is working with regulated partners, including Austria’s Wiener Privatbank, on custody and structuring.
The MiCA register entry does not amount to regulatory approval of $ASSET. ESMA explicitly states that white papers in the register are not reviewed or endorsed by competent authorities.
Real Technologies also said individual trading venues retain discretion over listing decisions.
That distinction is important as MiCA brings more standardised disclosure to Europe’s crypto market without turning white-paper publication into an official investment endorsement.


The Solana network reached an all-time high in daily token issuance, surpassing the number of new coins issued during the peak of the memecoin cycle in late 2024.
More than 263,000 new Solana Program Library (SPL) tokens were minted on the Solana blockchain on Wednesday, marking a new record high, according to Solscan. Some 40,000 to 50,000 daily tokens were issued on Solana at the peak of the memecoin cycle in December 2024.
Of the total 40,360 tokens issued through launchpads, memecoin platform Pump.fun accounted for the majority, or 34,184 coins, according to Blockworks’ dashboard.
A launchpad enables creators to easily design, launch and trade memecoins without needing extensive technical skills. They automate the token creation process and provide immediate liquidity and visibility for new tokens.
Pump.fun ranks as the leading Solana-native protocol by daily revenue, with $1.8 million generated in the past 24 hours, according to DefiLlama. Last Friday, Pump.fun’s daily revenue was briefly overtaken by trading app Fomo, which combines cryptocurrency trading with social features resembling a social media feed.
Pump.fun accounted for one-third of Solana’s first-quarter revenue in 2026, or $124 million out of the total $342 million, despite cooling memecoin activity.
Related: Nasdaq invests $100M in Kraken parent at $21B valuation: Report
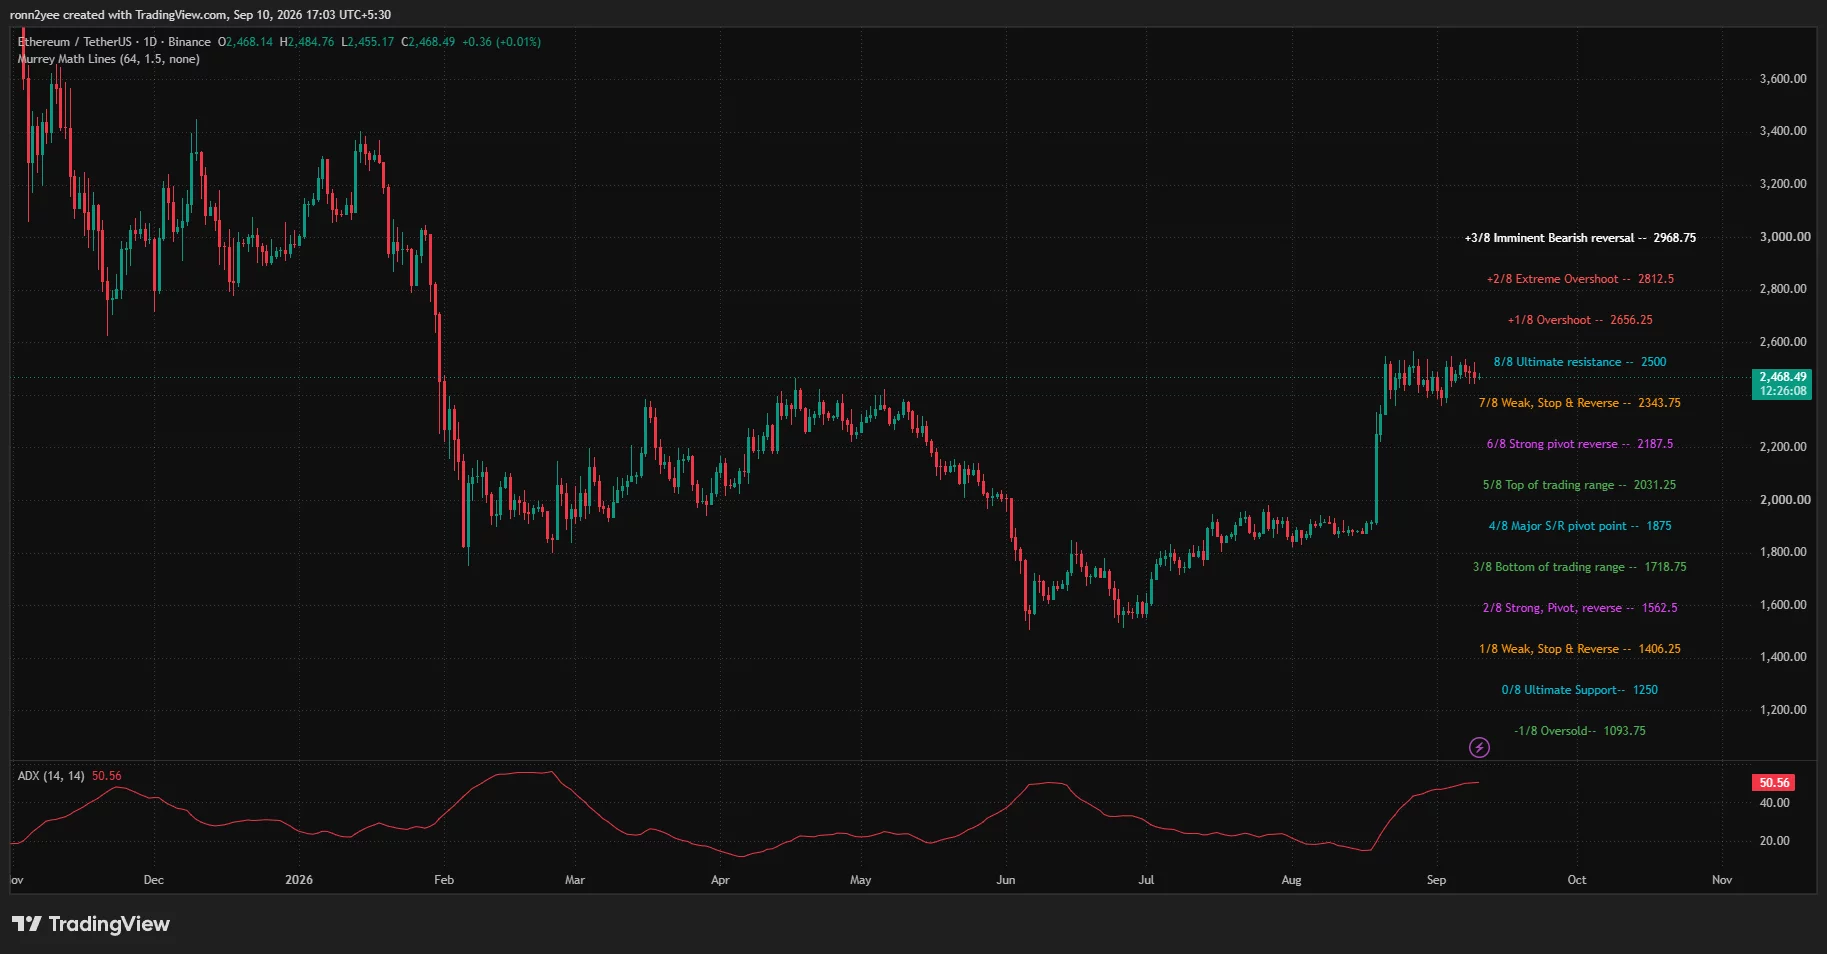
Ethereum price hovered near $2,468 on Sep. 10 as buyers defended the lower end of a multiweek range, while repeated failures above $2,500 kept the short-term outlook uncertain.
Summary
- Ethereum price traded near $2,468 after moving between approximately $2,455 and $2,485 during the session.
- The 4-hour chart places immediate support at $2,460 and resistance between $2,500 and $2,508.
- A weekly close above $2,550 could open the way toward $2,656 and $2,812.
- Liquidation clusters near $2,440 and $2,490 could increase volatility if either level breaks.
Ethereum price action today
According to data from crypto.news, Ethereum (ETH) price traded around $2,468 at the time of writing after briefly falling to approximately $2,455. The token remained below the psychological $2,500 level, which has repeatedly limited recovery attempts since late August.
The daily chart showed ETH holding inside a narrow range after its rapid August advance from below $1,900. Price has since struggled to extend that rally, with sellers appearing each time it approaches the $2,500 area.
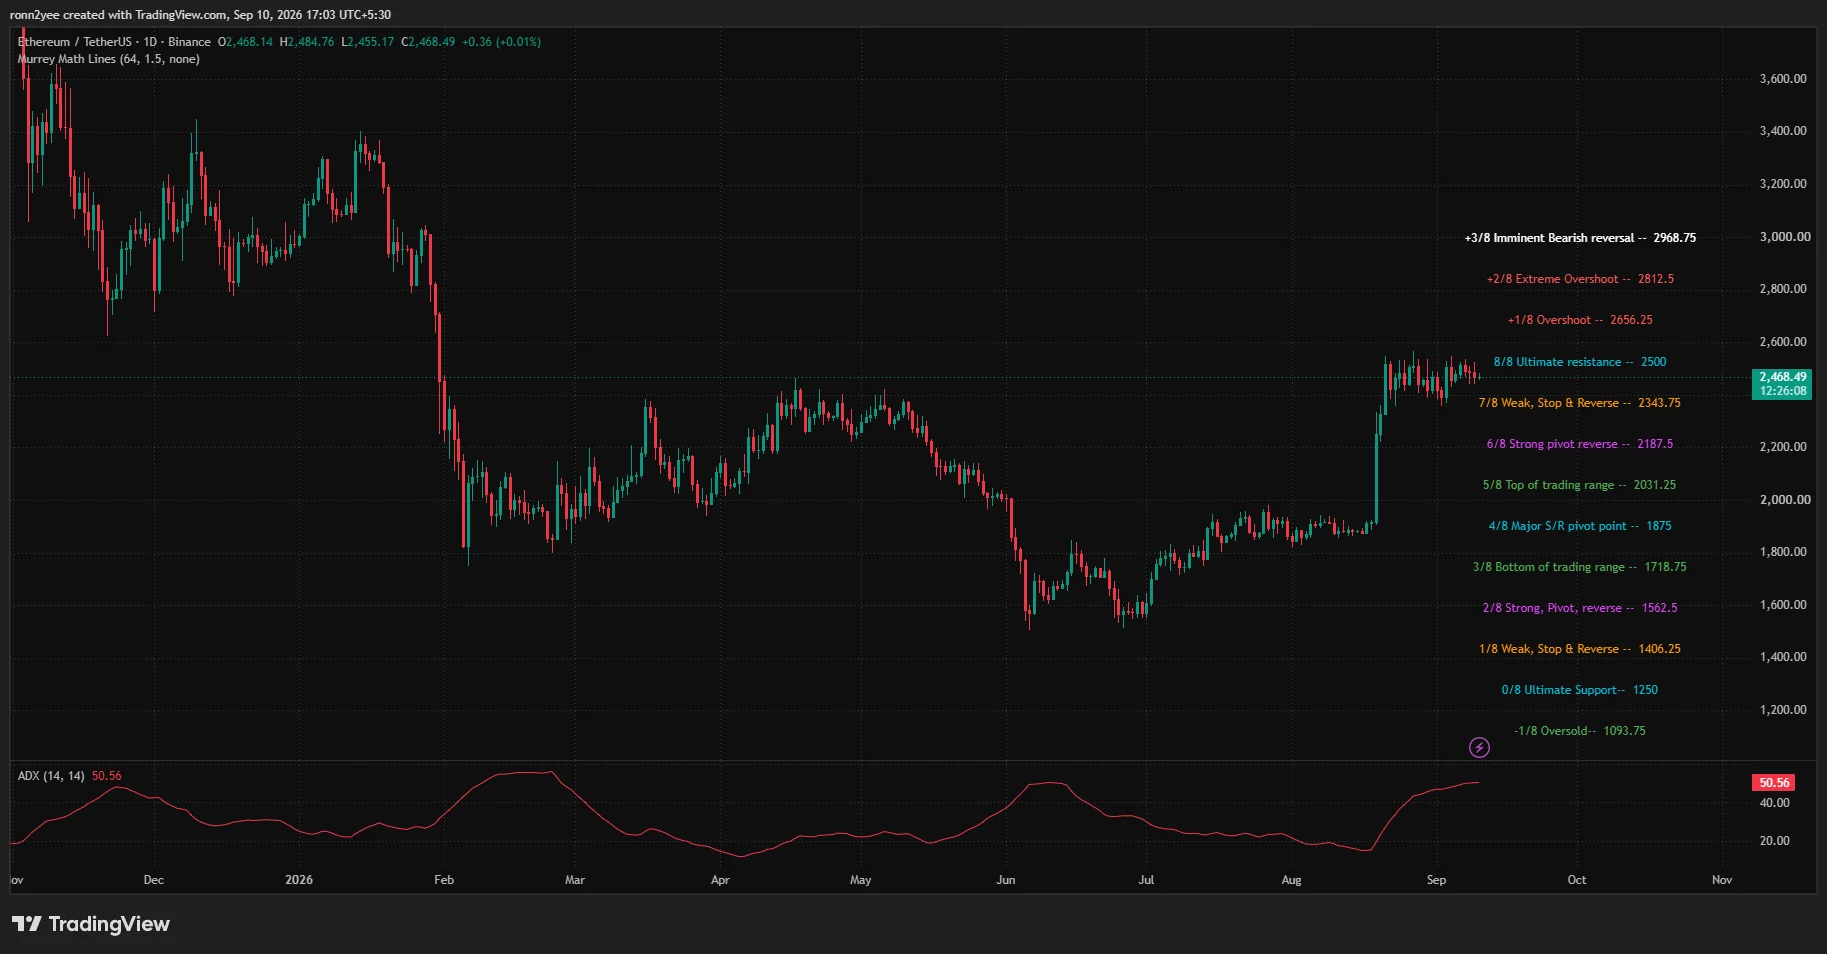
Ethereum’s latest daily candle opened at $2,468.14, reached a high of $2,484.76 and fell as low as $2,455.17. The small trading range showed that neither buyers nor sellers had established firm control during the session.
The broader structure remains stronger than it was before the August breakout. However, ETH is now testing the 8/8 Murray Math resistance at $2,500, making the level an important dividing line between continued consolidation and another upward move.
4-hour indicators show weak buying pressure
On the 4-hour chart, Ethereum traded at $2,469.40, below the Bollinger Bands’ middle line at $2,484.18. The upper band stood at $2,507.87, while the lower band was near $2,460.49.
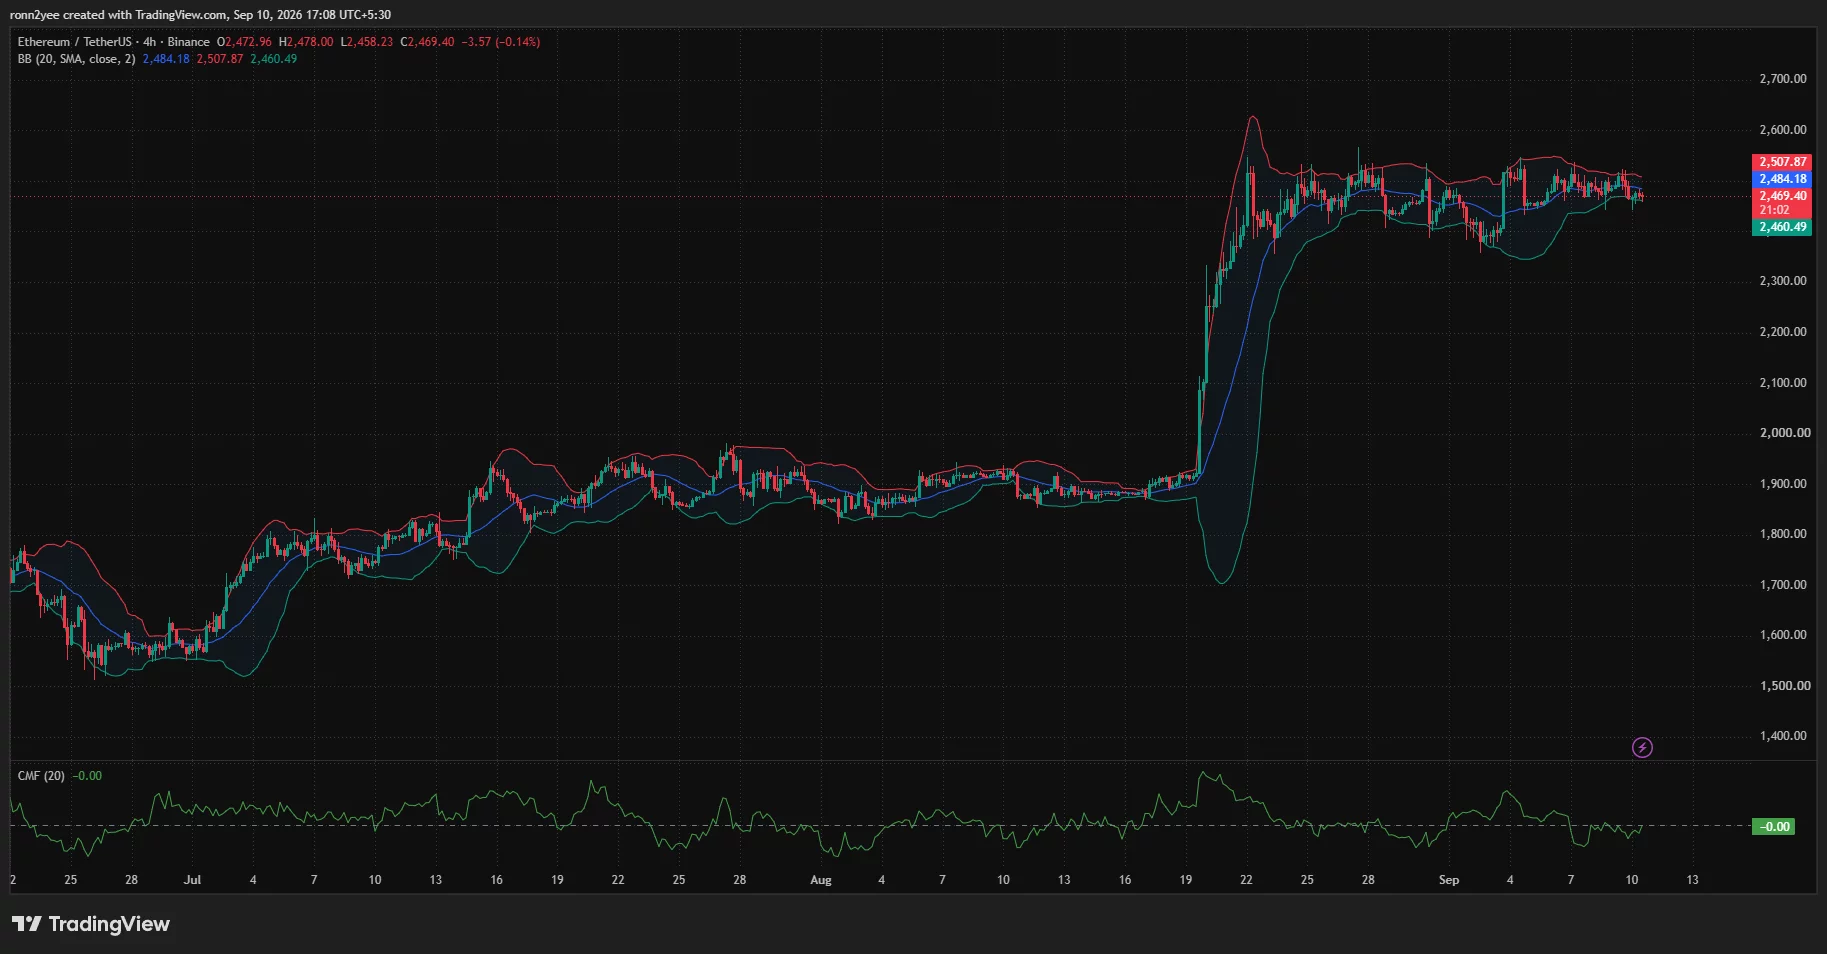
Price sitting close to the lower band showed that short-term selling pressure remained active. A close below $2,460 could push ETH toward the recent intraday low near $2,445, while a recovery above the middle band would return attention to the $2,500–$2,508 resistance zone.
The Chaikin Money Flow reading was near zero, showing no clear net inflow of capital on the 4-hour timeframe. The neutral reading matched the sideways price structure, with ETH moving between support and resistance without strong follow-through.
The daily Average Directional Index stood at 50.56. An ADX reading above 25 usually indicates a strong trend, but the indicator does not determine its direction. In Ethereum’s case, the elevated reading reflects the strength of the larger move that began in August, even as price consolidates beneath resistance.
Liquidation map places ETH between two liquidity zones
CoinGlass’ 24-hour Ethereum liquidation heatmap showed large concentrations of leveraged positions on both sides of the current price.
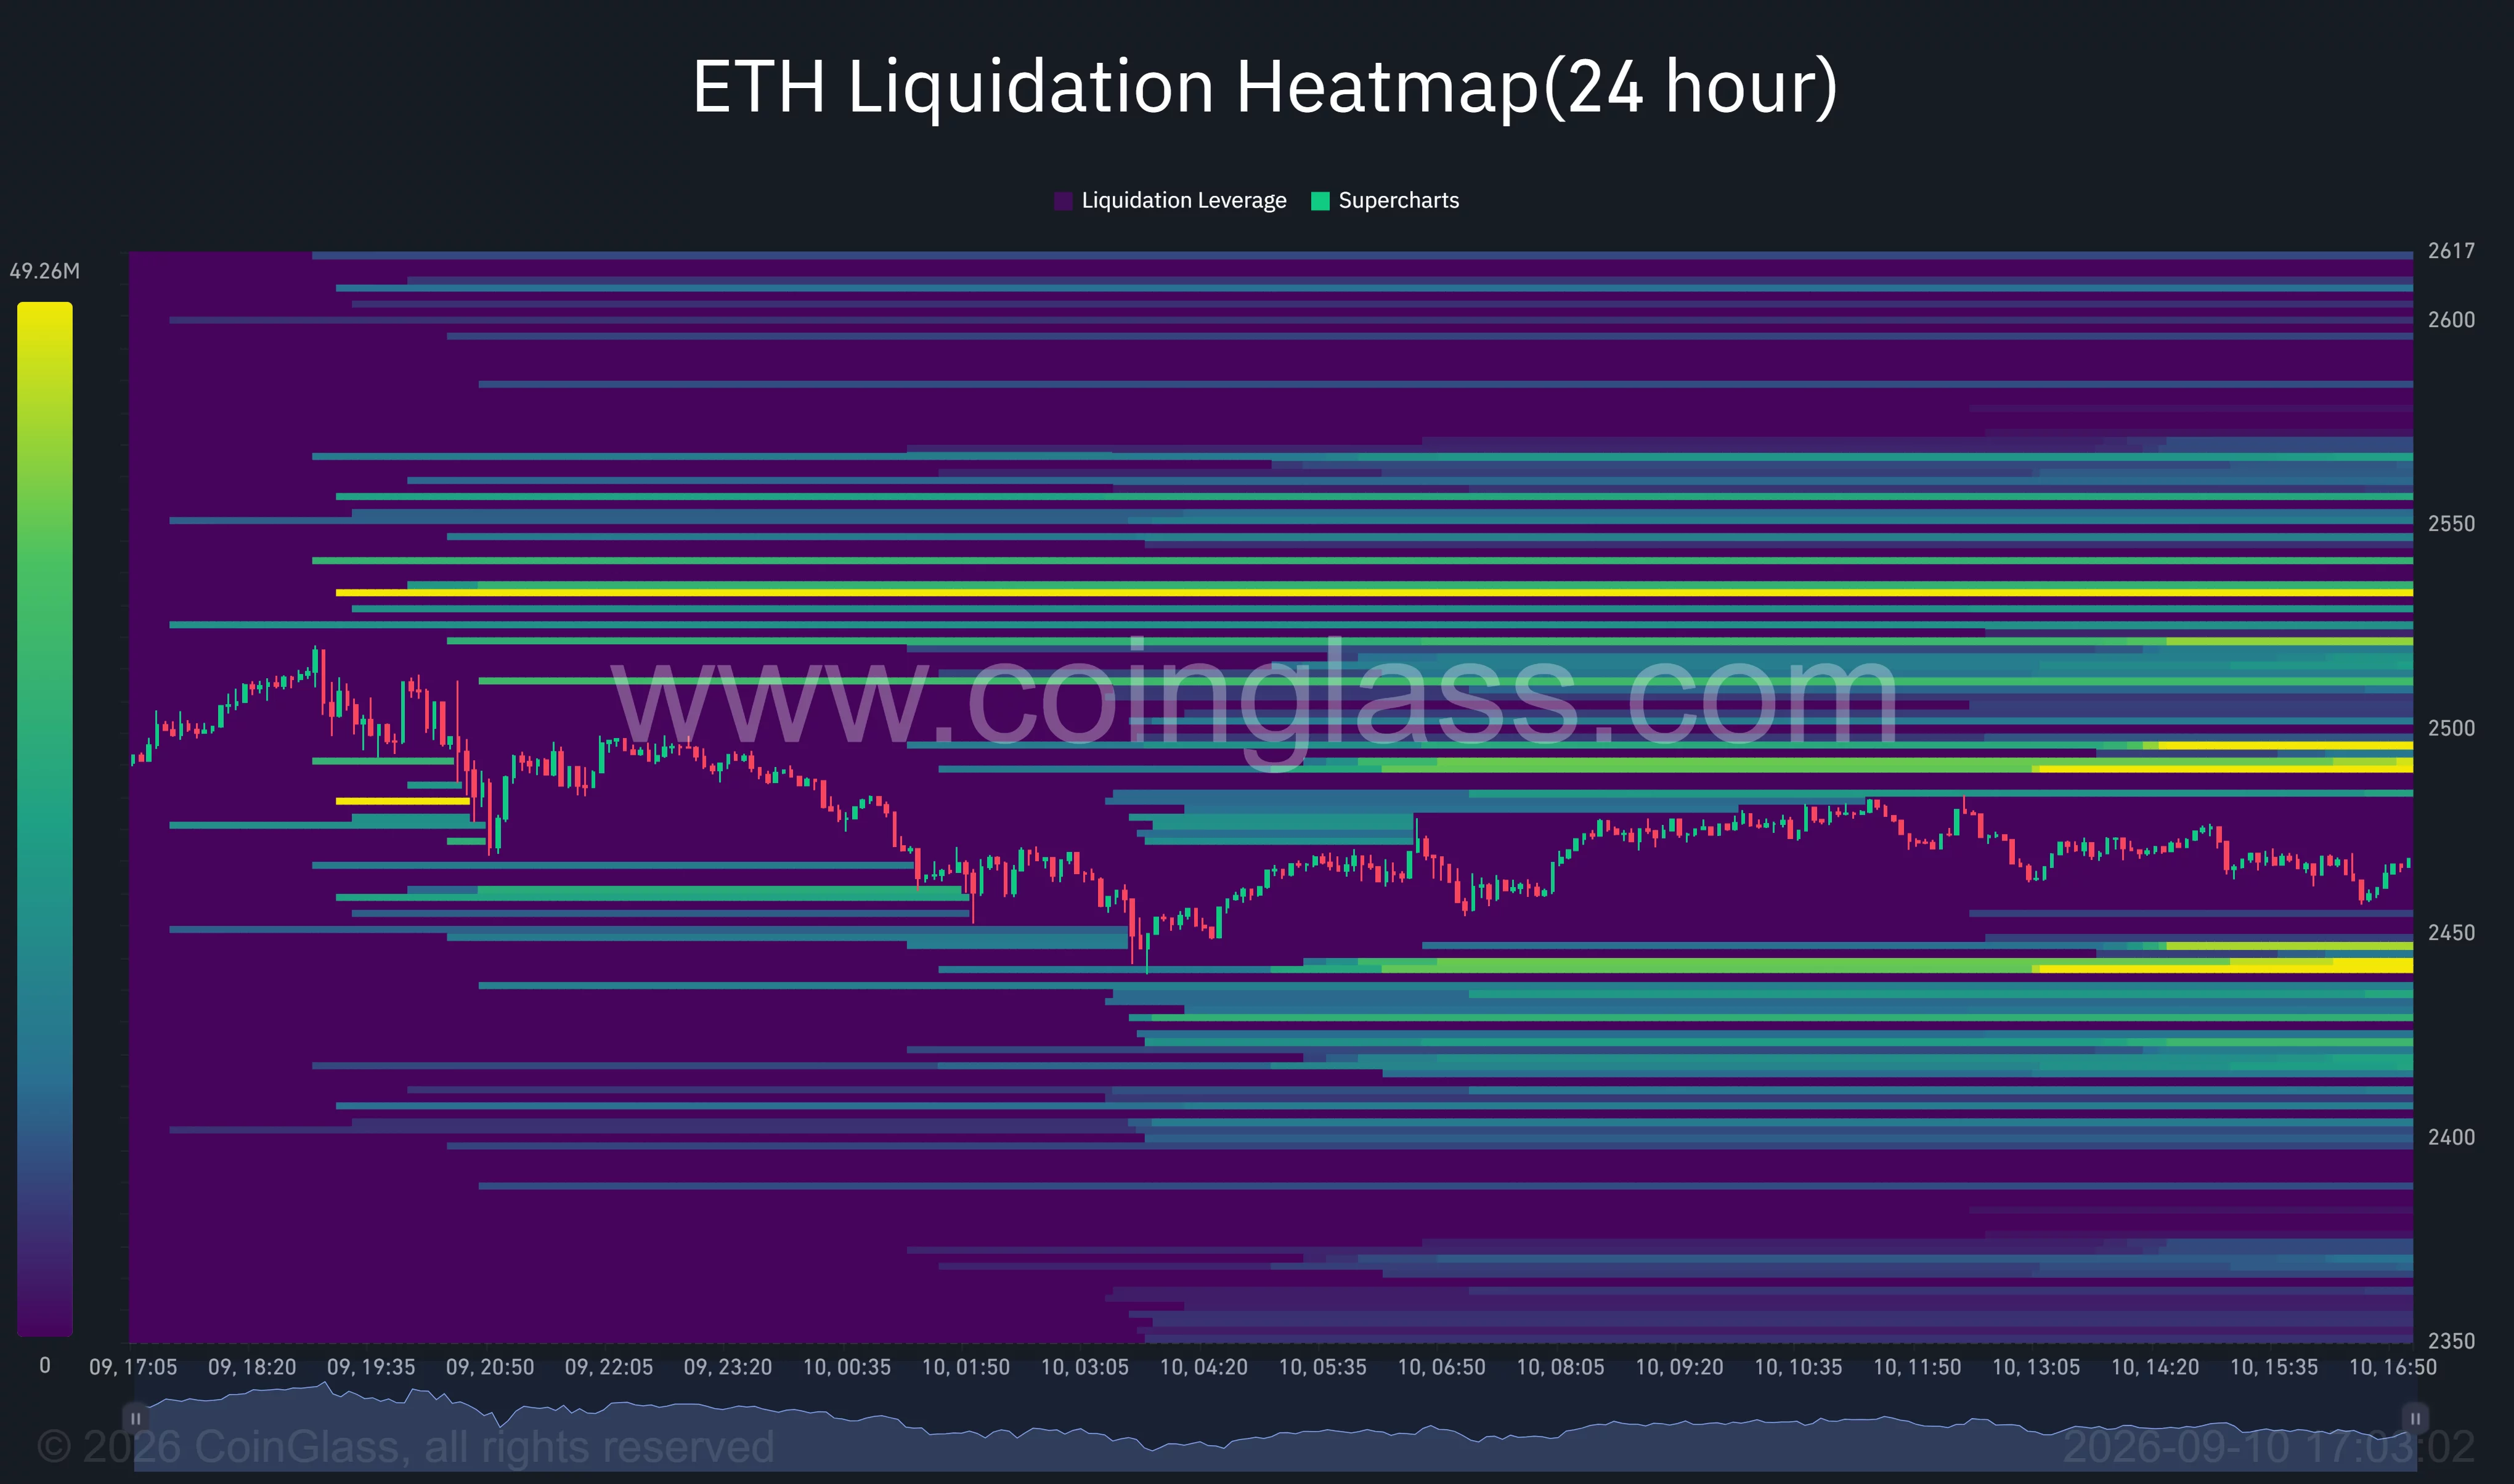
The nearest major liquidity cluster below ETH appeared around $2,440. Additional concentrations were visible between approximately $2,400 and $2,430. A break under $2,440 could force leveraged long positions to close and accelerate a move toward those lower bands.
Above the market, the largest nearby liquidation concentrations appeared around $2,490 and between $2,520 and $2,535. Liquidity was also visible near $2,550.
A rebound through $2,490 could therefore trigger short liquidations and pull Ethereum back toward $2,520. However, the number of liquidity bands on both sides of the price raises the risk of sharp moves within the existing range before ETH establishes a clear direction.
The liquidation heatmap also supports the short-term technical boundaries shown by the 4-hour Bollinger Bands. Both charts place Ethereum between support around $2,440–$2,460 and resistance beginning near $2,490.
Analysts identify $2,550 as the breakout level
Crypto trader Daan Crypto Trades said Ethereum had formed a tighter range than Bitcoin while sitting on support near $2,460. According to the analyst, neither bulls nor bears had strong momentum while both assets remained inside their respective ranges.
Daan added that a range break could lead to heavy liquidations among traders positioned on the wrong side. The heatmap supports that risk, with leveraged positions concentrated directly above and below Ethereum’s current market price.
Analyst Ted Pillows identified a wider range between $2,450 and $2,550. He said Ethereum would need a weekly close above $2,550 to begin another upward leg.
A confirmed move above $2,550 would place the next Murray Math target at $2,656.25. Further gains could expose $2,812.50, while the daily chart marks $2,968.75 as a higher resistance level.
The bearish scenario begins with a sustained break below $2,450. The next major daily level sits at $2,343.75, followed by stronger pivot support around $2,187.50. Ted’s weekly chart similarly identifies support near $2,215 if the current range fails.
US macro conditions could decide the range break
Ethereum’s compressed range comes ahead of the Federal Reserve’s Sep. 15–16 policy meeting. US interest-rate expectations remain important for ETH because higher yields can reduce demand for non-yielding risk assets, while a softer policy outlook can support speculative markets.
Until the Fed decision provides more clarity, Ethereum may remain sensitive to changes in Treasury yields, the US dollar and broader risk appetite. Derivatives positioning could amplify the reaction because large liquidation clusters sit close to both sides of the current price.
The immediate technical decision remains clear. Holding $2,440–$2,460 would preserve the range and allow another test of $2,500. Ethereum needs a weekly close above $2,550 to confirm stronger upside momentum, while a loss of $2,440 would shift attention toward $2,344 and $2,215.
Disclosure: This article does not represent investment advice. The content and materials featured on this page are for educational purposes only.
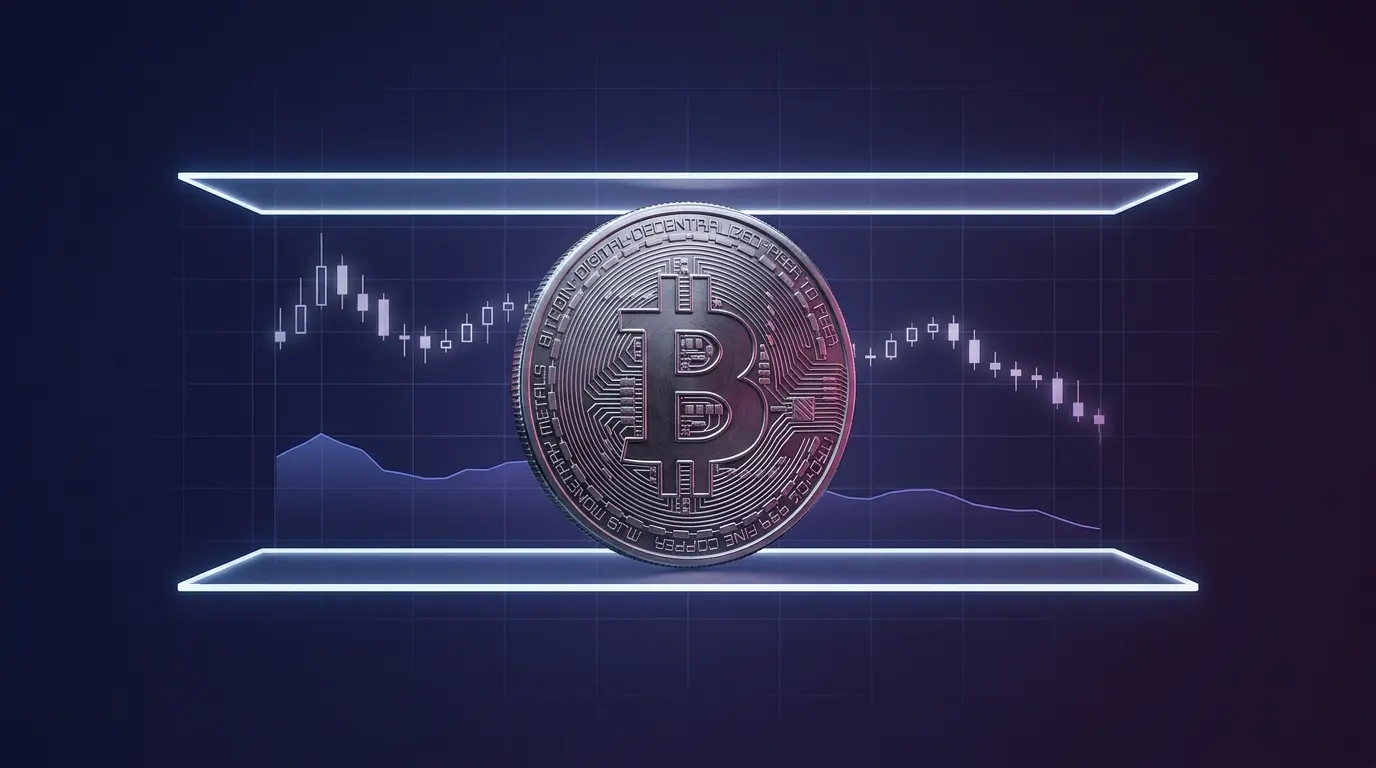

Bitcoin price prediction has BTC sitting at $77,800, down -1.4% over 24 hours, stuck in the same corridor that’s frustrated bulls for weeks. The global crypto market cap slipped to $2.75 trillion, down -1.2% in a day, with $95.24Bn in daily trading volume.
Chart watchers point to a confirmed bearish divergence on the 3-day RSI that emerged after Bitcoin’s recent short squeeze, a signal that’s aged into a genuine consolidation pattern rather than a fakeout. A level below the current price matters more than most traders realize right now, and it’s not the obvious one.
Away from the charts, the US Treasury bought back $12.5Bn in short-term debt and plans up to $6Bn in long-term bond repurchases tomorrow, triple the usual size.
That’s liquidity management aimed at containing yields, and it’s the kind of macro plumbing that quietly shapes risk appetite across every asset class, crypto included.
Trade Bitcoin on Bybit and Get a Chance to Win Our $1,000 USDT Airdrop
Bitcoin Price Prediction: Can BTC Hit $80,000 This Week?
Bitcoin trades at $77.800, pinned below the $80,000-$82,000 resistance band that’s rejected multiple attempts this cycle. Volume at $95.24 billion signals participation without conviction; traders are positioned, not committed.
The 50-week EMA near $77,000 remains the line in the sand; lose it, and the $76,000-$77,000 liquidation cluster becomes the next magnet, according to Reuters’ technical mapping, which flags a “golden retracement” resistance near $82,793.
Bull case: Reclaiming $80,000-$82,000 as support flips the setup, opening a path toward $90,000.
Base case: continued chop between $77,000 and $80,000 as the market digests the RSI divergence.
Bear case: a break below $77,200 triggers liquidations down to $76,100, testing the broader $73,000-$75,000 support shelf. You can read more about levels and ETF flows in this Bitcoin price prediction breakdown. None of this is resolved yet; patience matters more than prediction here.
Earn $50 and Enter $300K Prize Draw on EdgeX
Bitcoin Hyper Targets Early Mover Upside as Bitcoin Tests Key Levels
BTC holders sitting on gains from the monthly rally have a fair question to ask: at a $2.7 trillion combined crypto market cap and Bitcoin’s own $1.5 trillion valuation, how much upside realistically remains before the next leg requires a genuinely new catalyst?
The gold-transfer story is a strong narrative, not a new use case, and Bitcoin’s digital gold thesis has been priced in for years. That’s where earlier-stage infrastructure plays start to pull attention.
Bitcoin Hyper ($HYPER) is positioning itself as the first Bitcoin Layer 2 with full SVM integration, aiming to deliver execution speeds faster than Solana itself while settling back to Bitcoin’s base layer for security.
The project has raised $33M in presale funding at a current token price of just $0.0136859, with staking rewards offered at a high APY. Core features include a decentralized canonical bridge for BTC transfers and low-latency smart contract execution, effectively giving Bitcoin the programmability it’s lacked for 15 years.
Gain Access to New Bitcoin Layer 2 Early Here
Discover: The Best Token Presales
The post Bitcoin Price Prediction: Can BTC Reclaim $80K After Losing $78K Support? appeared first on Cryptonews.
A paper shared with CoinDesk shows humans and AI agents beating Google’s March result on a core calculation used by Shor’s algorithm, adding another variable to crypto’s quantum clock.

Female PE teacher found guilty of having sex with teenage boy, 16, after making him call her ‘Miss’ when alone has admitted sex offences against two schoolgirls aged 13 and 14

almost 12,000 families could curb pay

RSSS Q4 2026 Earnings Call Transcript


-
 Tech2 days ago
Memory prices are slowing because buyers ran out of money
-
 Crypto World2 days ago
Bitcoin price risks $76K drop as $78K support weakens
-

 Business13 hours ago
AMD Stock Climbs After Management Lifts 2027 Data Center Outlook Toward $70 Billion in AI Sales
-
 Crypto World2 days ago
Ethereum price stalls below $2,500 as ADX drops to 11
-

 Business12 hours ago
Micron Stock Climbs Above $1,031 as AI Memory Crunch and a $50 Billion Outlook Fuel the Rally
-

 Crypto World2 days ago
Robinhood Stock: How To Take Advantage With Reduced Risk
-

 NewsBeat2 days ago
What went right this week: an ‘historic’ fall in violent crime, plus more
-
 Crypto World15 hours ago
Bitcoin price risks $70K if $78K neckline breaks
-
 Crypto World1 day ago
Bitcoin price holds near $79K as cycle drawdowns narrow
-
 Sports2 days ago
Phones confiscated, players sent home: Pakistan’s England tour turmoil revives memories of Mohammad Amir, Salman Butt and Mohammad Asif’s 2010 Lord’s spot-fixing scandal | Cricket News
-

 NewsBeat2 days ago
England up in reading, maths and science rankings as Scotland and Wales dip
-

 Business1 day ago
Meta debuts long-awaited personal AI agent, Muse
-
 Crypto World2 days ago
Brent Crude Oil Moves Above $100 for the First Time in 3 Months
-

 Crypto World2 days ago
Pump Fun and Kraken delete Hunter Biden $LAPTOP promotion
-
 Crypto World2 days ago
Intel Stock Jumps 9% on Chip Price Hike Report, US Stake Gains $36 Billion
-

 Crypto World2 days ago
Visa expands stablecoin card network to 160 programs
-

 Business2 days ago
Egyptian TV Presenter Sarah Khalifa, 11 Others Sentenced To Death In Major Drug Trafficking Case In Cairo
-

 Business2 days ago
ServiceTitan, Inc. (TTAN) Q2 2027 Earnings Call Transcript
-
 Tech2 days ago
Strong Password Policy and Password Manager Guide
-
Business2 days ago
Xometry at Goldman Sachs Communacopia + Technology Conference 2026: growth, AI and Siemens
You must be logged in to post a comment Login