

Crypto World
What is open interest in crypto trading?

Open interest counts how many derivative positions are alive right now, not how many changed hands. It is the closest thing crypto has to a leverage gauge, and reading it alongside price tells you whether a move is built on new conviction or on people being forced out.
Summary
- Open interest is the total number of derivative contracts currently open and unsettled. It measures live positions, not activity, which is what separates it from volume.
- A trade only increases open interest when both sides are opening new positions. If either side is closing, the number stays flat or falls.
- Read alongside price, open interest tells you what kind of move you are watching: rising price with rising open interest means new money, while rising price with falling open interest usually means shorts being squeezed out.
- Open interest matters more in crypto than in traditional markets because perpetual futures dominate trading here, and the aggregate figure functions as a rough gauge of how much leverage sits in the system.
- The number has real limits. It is venue-specific, dollar-denominated figures move with price even when positions do not, and a high reading tells you leverage exists without telling you which direction it will break.
Every derivatives trader eventually runs into a number that sounds like it should be obvious and is not. Volume is easy: it counts how much traded. Price is easy: it is what people paid. Open interest is the third figure on every dashboard, quoted constantly in market commentary, and routinely misunderstood, because it measures something neither of the other two does. It counts what is still alive. Not what traded today, not what it cost, but how many bets remain open right now, waiting to be closed or liquidated. In a market where perpetual futures are the most heavily traded instrument in existence, that number is the closest thing available to a measure of how much risk is loaded into the system at any moment. This guide explains what open interest counts, how a single trade moves it, what the four price-and-open-interest combinations mean, and where the signal breaks down.
What open interest actually counts
Open interest is the total number of derivative contracts that have been opened and not yet closed, settled, or liquidated. Each contract represents an agreement between two parties, one long and one short, and it stays in the count until one of them exits. If a thousand Bitcoin perpetual contracts are open across a venue, that means a thousand live agreements are sitting there, each with someone on both sides who has money at stake.
The critical word is outstanding. Open interest is a snapshot of positions that exist at this instant, which makes it a stock measure instead of a flow measure. Your account balance is a stock. Your monthly spending is a flow. Volume is a flow: it counts trades over a period and resets. Open interest is a stock: it carries forward, rising and falling as positions are opened and closed, and it does not reset at the end of the day.
This has a consequence people miss. Open interest is not cumulative. It does not grow forever the way total historical volume does. It can rise for weeks as traders pile into a trend and then collapse in an hour when a price move liquidates thousands of positions at once. Watching it fall by a third in a single session tells you something important happened, and that something is almost always forced.
Open interest gets quoted two ways, and the difference matters. Some venues report it in contracts, meaning a raw count of units. Others report it in notional dollars, meaning the count multiplied by the current price of the underlying asset. The second version is more intuitive and more misleading, for reasons covered later.
Open interest versus volume
The cleanest way to separate the two is to notice that they answer different questions.
Volume asks how busy the market was. Open interest asks how much of that activity left something behind.
Picture a market where two traders spend all day passing the same contract back and forth. Each transfer adds to volume. By the close, volume looks enormous. But no new positions were created, because each trade had one party opening and one party closing. Open interest never moved. Enormous volume, unchanged open interest, and nothing about the market’s underlying risk changed at all.
Now picture the opposite. Ten new traders open long positions and ten new traders take the other side. That is a modest amount of volume and a direct increase in open interest of ten contracts. Small activity, real change in exposure.
Real markets mix both constantly, which is why the two figures move independently and why reading them together is more informative than reading either alone. High volume with flat open interest describes churn: the same positions rotating between hands, common during choppy sideways action. High volume with sharply rising open interest describes new participation: fresh capital committing to a view. High volume with sharply falling open interest describes an exit: people closing, willingly or otherwise, and that last case is what a liquidation cascade looks like on a chart.
How one trade moves the number
The mechanics reward a worked example, because the rule is not intuitive until you see it.
Every derivatives trade has a buyer and a seller. Each of them is doing one of two things: opening a new position, or closing one they already had. That gives four combinations, and the combination determines what happens to open interest.
Start with a market where open interest is 100 contracts.
Case one: both sides open. Alice wants to go long and has no position. Bob wants to go short and has no position. They trade one contract with each other. A new agreement now exists that did not exist before. Open interest rises to 101. Volume for the session records one contract.
Case two: both sides close. Alice already holds a long and wants out. Bob already holds a short and wants out. They trade with each other, and both positions are extinguished at once. The agreement is gone. Open interest falls to 99. Volume still records one contract.
Case three: one opens, one closes. Alice holds a long and wants out. Carol has no position and wants to go long. Carol takes Alice’s position over. The contract still exists; only the name on one side changed. Open interest stays at 100. Volume records one contract.
Case four: the mirror of case three. A short holder exits and a new short takes their place. Same result. Open interest unchanged at 100.
Notice that volume recorded one contract in every case while open interest did three different things. That is the whole distinction in a single table. Volume counts the transaction; open interest counts whether the transaction created or destroyed a live position. And notice that open interest only ever rises when both parties are new to the trade, which means an increase always signals fresh capital entering, never rotation.
One more detail that trips people up: open interest counts contracts, not participants, and it counts each contract once, not twice. A single agreement between one long and one short is one unit of open interest, not two. The long side and the short side of the market are always exactly equal in size, because every contract has both. Anyone claiming that open interest shows more longs than shorts has misunderstood the instrument. What they mean is that positioning or funding leans one way, which is a different measurement entirely.
Reading price and open interest together
On its own, open interest is close to meaningless. A reading of $20 billion tells you nothing without knowing whether it was $10 billion or $30 billion yesterday, and what price did in the meantime. Paired with price direction, it produces four readings that traders use constantly.
Price up, open interest up. New money is opening positions into strength. Fresh longs are entering and someone is willing to take the short side. This is the combination most often read as a healthy trend, because the move is supported by new commitment instead of by people unwinding. It also means leverage is accumulating, which is the setup for a violent reversal later.
Price up, open interest down. Positions are closing while price rises. The usual explanation is short covering: traders who were short are buying to exit, which pushes price up while destroying open interest. The move is real, but it is powered by people leaving instead of by people arriving, and it tends to exhaust when the shorts are done. Rallies with falling open interest have a reputation for disappointing.
Price down, open interest up. New positions are opening into weakness, typically new shorts. Fresh bearish conviction is entering the market. Like the first case, this builds leverage, and a crowded short book is exactly what a squeeze needs.
Price down, open interest down. Positions are closing as price falls. This is the signature of long liquidation: leveraged longs being forced or choosing out, which removes both the position and the price support. In its extreme form it is capitulation, and it is why the sharpest drops often come with the largest single-session collapses in open interest.
Treat these as vocabulary instead of as prophecy. They describe what has already happened in a way price alone cannot. They do not predict the next move, and every one of the four has failed plenty of times.
Why the number matters more in crypto
Open interest exists in every derivatives market. Wheat futures have open interest. It matters differently in crypto for structural reasons.
The first is dominance. In equities, derivatives sit alongside a far larger spot market. In crypto, perpetual futures are the single most heavily traded product in the entire asset class, and perp volume reached roughly $61.8 trillion in 2025 according to CryptoQuant data, up about 29% year on year. Offshore perpetual volume alone grew from around $28 trillion in 2023 to more than $90 trillion in 2025. When the derivative dwarfs the underlying, the derivative’s positioning drives the spot price instead of reflecting it, and open interest is the measure of that positioning.
The second is leverage. Perps offer leverage multiples that traditional venues do not permit, and because they never expire, positions can accumulate indefinitely. There is no quarterly settlement forcing a reset. Open interest can therefore build for months, which means the aggregate figure functions as a rough gauge of how much borrowed exposure is stacked in the system waiting for a catalyst.
The third is the liquidation engine. Because positions are leveraged and margined, a price move against a crowded book does not produce a gentle unwind. It produces automatic, forced closure, which pushes price further, which forces more closure. The October 10, 2025 event, in which roughly $19 billion of positions were liquidated across the market in a single episode, is the reference case. Elevated open interest is the fuel for that. It does not tell you when the match gets struck, but it tells you how much is stacked.
The fourth is that crypto has finally started measuring it onshore. Perps have moved from offshore venues into regulated American markets, with Coinbase cleared for perpetual futures and the CME suing the CFTC over whether a perp is legally a swap. As the product comes onshore, open interest data becomes more reliable and more consequential, because regulated venues report it consistently.
Where to find it and how it is measured
Every derivatives venue publishes its own open interest. Aggregators such as CoinGlass combine figures across exchanges to produce a market-wide number, which is the version quoted in most commentary.
Three practical measurement issues are worth carrying with you.
Aggregation is imperfect. Venues report differently, some in contracts and some in notional, some including inverse contracts and some not. Adding them produces an estimate, not a census. Different aggregators publish different totals for the same moment, and the discrepancy is normal.
Dollar-denominated open interest moves with price. This is the most common misreading in circulation. If open interest is quoted in notional dollars and the price of the asset rises 10% while every position stays exactly as it was, the dollar figure rises 10%. Nothing changed. No new positions opened. The number went up because the multiplier went up. Anyone pointing at rising dollar open interest during a rally as proof of new participation may be describing arithmetic. Contract-denominated open interest, or the ratio of open interest to market capitalization, avoids the trap.
The ratio is often more useful than the level. Open interest divided by market capitalization gives a crude but real sense of how leveraged an asset is relative to its size. A token with open interest approaching a large fraction of its market cap is carrying leverage that a token with a tiny ratio is not, and the first will move far more violently on the same news.
A worked reading of a real cascade
Abstract rules are easier to hold when attached to a sequence, so walk through the shape of a leverage unwind as open interest describes it.
Phase one is the build. Price grinds higher over several weeks. Open interest climbs steadily alongside it, in contract terms and not merely in dollars, which tells you positions are actually being added instead of the multiplier rising. Funding turns positive and stays there, meaning longs are paying shorts to hold the trade, which is the market charging rent for a crowded direction. Nothing is wrong yet. This is what a trend looks like. But each new contract is a position with a liquidation price attached, and those prices cluster, because leverage settings and entry points cluster. The book is getting heavier and the heaviness is concentrated in bands.
Phase two is the stall. Price stops advancing but open interest does not fall. This is the tell worth learning. Traders who entered late are underwater on funding and unwilling to close, so exposure stays on the books while the reason for holding it weakens. Open interest at a high level with price going sideways describes a market where a lot of people are waiting to be proven right, and the longer it persists the more of them are paying to wait.
Phase three is the trigger, and it is usually mundane. A macro print, an exchange outage, a large spot sale. Price drops into the first cluster of liquidation levels. Those positions close automatically, and automatic closure means market sell orders hitting a book that has just widened. That pushes price into the next cluster.
Phase four is the cascade, and this is where open interest earns its reputation. The number does not drift down. It falls off a cliff, because thousands of positions are being extinguished in minutes. Volume spikes to extraordinary levels at the same moment. High volume plus collapsing open interest plus falling price is the unambiguous signature of forced exit, and it is the one combination that admits almost no alternative reading. The October 10, 2025 episode, roughly $19 billion liquidated, is the canonical version.
Phase five is the aftermath, and it is the most useful part for anyone still holding. Open interest is now far lower than it was. The leverage that fueled the drop has been removed from the system, which is why sharp liquidation events are frequently followed by calmer trading: the fuel burned. A market with low open interest after a cascade is structurally different from the same price level reached with high open interest intact, because the second one still has a loaded book underneath it and the first does not. Same price, completely different risk.
Notice what open interest did and did not do across those five phases. It described the build accurately. It flagged the stall, which price alone did not. It confirmed the cascade in real time. It told you afterward that the leverage was gone. What it never did, at any point, was tell you when phase three would arrive or which direction it would run. That is the honest scorecard: a superb descriptive instrument and a poor predictive one, which is worth far more than the reverse if you know which you are holding.
The limits of the signal
Open interest deserves the attention it gets and considerably less certainty than it receives. Its limits are structural, and knowing them separates using the number from being used by it.
It is directionless. High open interest tells you leverage is present. It does not tell you which way that leverage breaks. A crowded book can unwind up or down, and the same reading precedes both. Commentary that treats elevated open interest as inherently bearish, or as inherently a sign of a healthy trend, is adding a conclusion the data does not contain.
It says nothing about position size distribution. Ten thousand contracts might be one enormous institutional hedge or ten thousand retail gamblers at maximum leverage. Those two books behave completely differently under stress: the hedge sits still, the gamblers cascade. Open interest cannot distinguish them.
It ignores what the positions are for. A short is not necessarily a bearish bet. Market makers run shorts as inventory hedges. Basis traders hold spot and short the perp to harvest the spread, with no directional view whatsoever. Miners hedge forward production. A meaningful share of any open interest figure is not speculation at all, and treating the whole number as a sentiment gauge misreads it.
It is venue-fragmented. Open interest on one exchange can rise while it falls on another as positioning migrates, which looks like a signal and is a transfer. Only the aggregate captures the system, and the aggregate is an estimate.
And it lags the thing you actually want. By the time open interest confirms a trend, the trend has been running. By the time it collapses, the liquidation already happened. Open interest is excellent at describing what occurred and poor at telling you what comes next, which is true of most indicators and rarely admitted about this one.
Used properly, it is a context tool. It answers a specific question well: is this price move backed by people arriving or by people leaving? That question is worth answering, and no other single number answers it. Just do not ask it to do more.
Disclaimer: This article is for information and educational purposes only and does not constitute financial, investment, or trading advice. Derivatives carry substantial risk of loss, and leveraged positions can be liquidated rapidly, in some cases exceeding the margin posted. Nothing here is a recommendation to trade any instrument. Always do your own research. Figures are accurate as of July 16, 2026.
Frequently Asked Questions
What is open interest in crypto?
Open interest is the total number of derivative contracts, most often perpetual futures, that are currently open and have not been closed, settled, or liquidated. It measures live positions at a point in time instead of trading activity over a period. Each contract counts once and always has a long and a short on opposite sides, so the two sides of the market are always equal in size.
What is the difference between open interest and volume?
Volume counts how many contracts traded during a period and resets each session. Open interest counts how many positions are still alive and carries forward. A market can post huge volume with no change in open interest if traders are simply passing existing positions between each other. Volume measures activity; open interest measures accumulated exposure.
Does rising open interest mean price will go up?
No. Open interest is directionless. It tells you that new positions are being opened, not which way they will resolve. Rising open interest alongside rising price suggests new money entering a trend. Rising open interest alongside falling price suggests new shorts. The same reading precedes both rallies and crashes, and treating it as a directional forecast misreads what it measures.
What does falling open interest mean?
Positions are being closed, either voluntarily or through liquidation. Falling open interest with falling price is the signature of long liquidation and, in extreme form, capitulation. Falling open interest with rising price usually indicates short covering, where traders buy to exit shorts. Either way, the move is powered by participants leaving instead of arriving, which tends to limit how far it runs.
Why does open interest matter more in crypto?
Because perpetual futures dominate crypto trading to a degree unmatched in other asset classes, with perp volume around $61.8 trillion in 2025, and because perps never expire, so leveraged positions accumulate indefinitely with no settlement date forcing a reset. The aggregate figure therefore works as a rough gauge of how much leverage sits in the system, which is the fuel for liquidation cascades.
Can open interest be higher than the spot market?
Yes, and in crypto it frequently is for individual assets. Derivatives positioning can exceed the size of the underlying market, which is one reason perps often lead spot price instead of following it. The ratio of open interest to market capitalization is a useful gauge here: a high ratio indicates an asset carrying leverage disproportionate to its size, which typically means more violent moves.
Where can I check crypto open interest?
Individual exchanges publish their own figures, and aggregators such as CoinGlass combine them into market-wide estimates. Treat aggregates as approximations, since venues report on different conventions and different aggregators disagree. Check whether the figure is quoted in contracts or in notional dollars, and check the timestamp, because open interest can change dramatically within hours.
Why does dollar open interest rise when price rises?
Because notional open interest is the contract count multiplied by the current price. If price rises 10% and not a single new position opens, the dollar figure still rises roughly 10%. This is arithmetic, not participation, and it is the most common misreading of the metric. To see whether positions are actually being added, look at contract-denominated open interest or the open-interest-to-market-cap ratio.


It was October 2025 when the primary cryptocurrency shot to an all-time high above $126,000. In the months that followed, however, the euphoria faded, and the bears took control. The situation only worsened at the start of the summer, when BTC dropped well below $60K, while in the past few days buyers stepped in and recovered the price to the current $64,000.
There’s a heated debate on X over whether the asset has reached its cycle bottom and is poised for a major bull run, or if the worst is yet to come. On that note, we decided to ask three of the most popular AI-powered chatbots what is more likely to happen this year: a collapse to $30,000 or a pump to $100,000.
ChatGPT’s Take
OpenAI’s platform estimated that a rise to the $100K milestone sometime in 2026 is the more likely scenario, given current price levels and the recent stabilization driven by better-than-expected US CPI data.
Recall that inflation in America dropped to 3.5%, triggering an evident upswing across the entire crypto sector. Such a reaction makes sense, since the lower figure eases the pressure on the Federal Reserve to hike rates and even raises the prospect of cuts in the months ahead – a development that typically favors riskier assets.
At the same time, ChatGPT stated that an explosion to $100,000 will not be easy, since Bitcoin remains highly dependent on geopolitical tensions, monetary policy, and institutional interest. Data show that spot BTC ETFs have been bleeding heavily over the past several months, indicating that conservative investors such as pension funds and hedge funds have reduced their exposure to the asset. In the past, institutional appetite has been crucial for Bitcoin’s performance and often aligned with its rallies.
The chatbot claimed that a plunge to $30,000 later this year is not entirely out of the question, though it is much less likely and would require a black swan event such as the potential meltdown of a crypto giant or a global recession.
In conclusion, it estimated roughly a 45% chance that BTC will climb toward $100,000 before New Year’s Eve, a 15% probability of a crash to $30,000, and a 40% likelihood that neither scenario will unfold.
“My most realistic year-end range would be approximately $70,000–$90,000, with $100,000 becoming realistic if BTC reclaims $75,000–$80,000 and ETF demand strengthens,” it added.
More in Favor
Perplexity shared ChatGPT’s theory, but said neither outcome is the most possible scenario for the remaining months of the year. It stated that the maximum “reasonable” price BTC can reach in 2026 is around $70,000-$80,000. For its part, Google’s Gemini said a jump to $100K is “mathematically and structurally” more likely than a collapse to $30K.
“For Bitcoin to fall to $30,000, it would have to trade roughly 30% below the collective cost basis of almost every investor in the market. This has only happened during brief, systemic black swan events (such as the March 2020 COVID crash),” it explained.
The post Crash to $30K or Jump to $100K: 3 AIs Speculate What Is More Likely for BTC in 2026 appeared first on CryptoPotato.
Japan’s Nikkei 225 sank as much as 4.4% on Friday, July 17, leading a broad Asian tech selloff. Investors dumped chip stocks tied to the artificial intelligence boom. The index fell to 63,896.48, extending losses from earlier in the week.
Chip-equipment maker Advantest and tech investor SoftBank each lost around nine percent. Taiwan’s Taiex shed four percent as TSMC retreated more than three percent, even after posting record quarterly profit. However, the big story for Japanese stocks is Kioxia
Kioxia’s Reversal
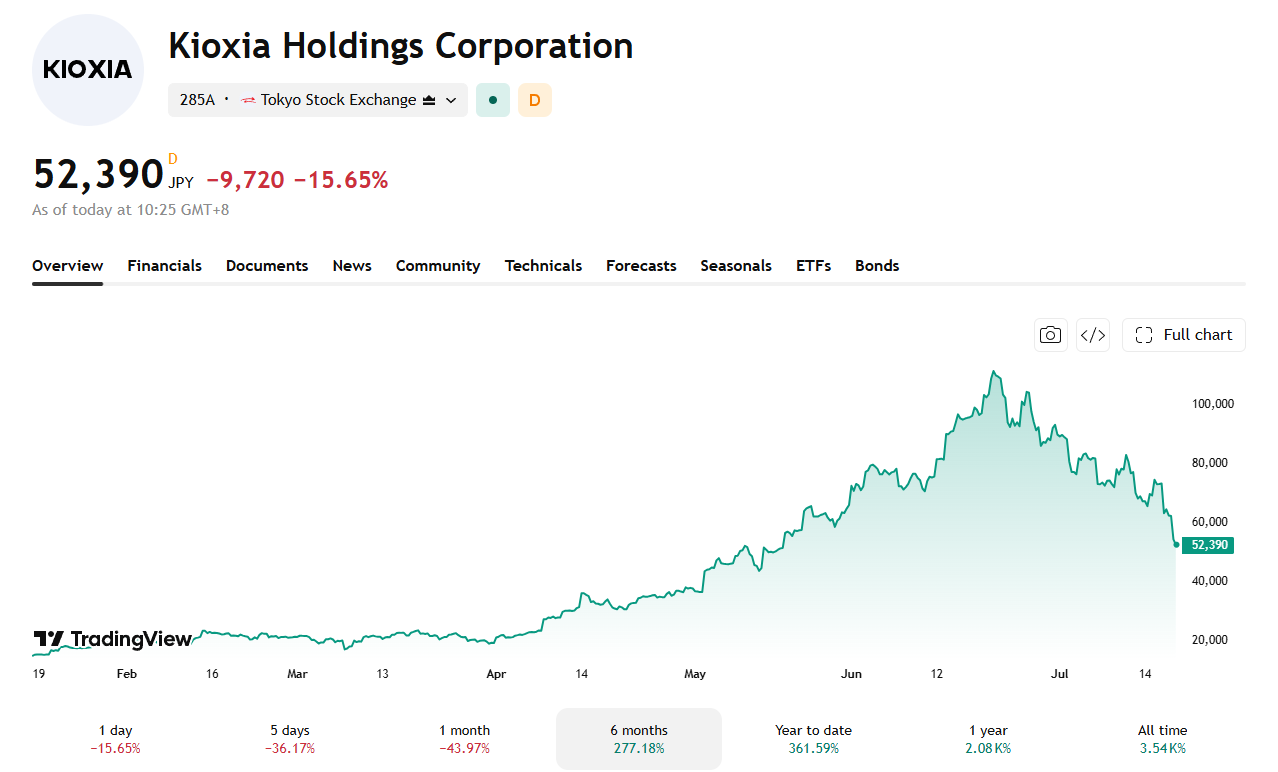
Kioxia, the memory chipmaker plunged near 16% on Friday alone. That extends a slide that has erased 44% of its value in a single month.

A rally of more than 600% since January pushed Kioxia briefly past Toyota to become Japan’s most valuable company in mid-June. It has since dropped to fourth place. The slide has wiped out roughly ¥30 trillion, or $185 billion, in market value.
Daiwa Securities chief strategist Yugo Tsuboi said the chip sector remains prone to boom-bust cycles.
“The chip sector is vulnerable to the silicon cycle, and we’ve seen this pattern many times before.”
Tsuboi pointed to rising scrutiny of Chinese memory chipmakers as one factor. He also noted signs that global memory prices may be stabilizing, which makes further earnings upgrades harder to justify.
Cracks Beneath the Rally
Other factors are adding to the pressure that Kioxia has faced in the relative short term. Last week, Bain Capital exited its entire position in the memory chipmaker. Many investors saw that as a signal that the chip cycle is peaking. Japanese retail traders also hold heavy leveraged positions, which leaves the stock exposed if selling accelerates.
Kioxia only listed in 2024. Since then, its shares became the best performer on the MSCI World Index before this month’s reversal.
Despite the collapse, analysts still forecast roughly a 118% return for Kioxia over the next 12 months. The Topix index’s October reshuffle should also draw fresh passive fund inflows into the stock.
A Warning for the Wider AI Trade
Kioxia’s reversal mirrors a broader repricing across the sector. A Wall Street gauge of chip stocks slumped more than four percent Thursday and concerns over TSMC’s AI spending overshadowed an otherwise solid earnings outlook.
Traders have grown more skeptical of the AI trade in recent months. They are rotating out of richly valued chip names and into sectors that have lagged. The episode follows a similar pattern to Japan’s broader AI selloff earlier this month.
The Nikkei has shed trillions of yen in value over three weeks.
The post As Nikkei Bleeds, Kioxia’s Boom-to-Bust Highlights Dangers of This AI Cycle appeared first on BeInCrypto.
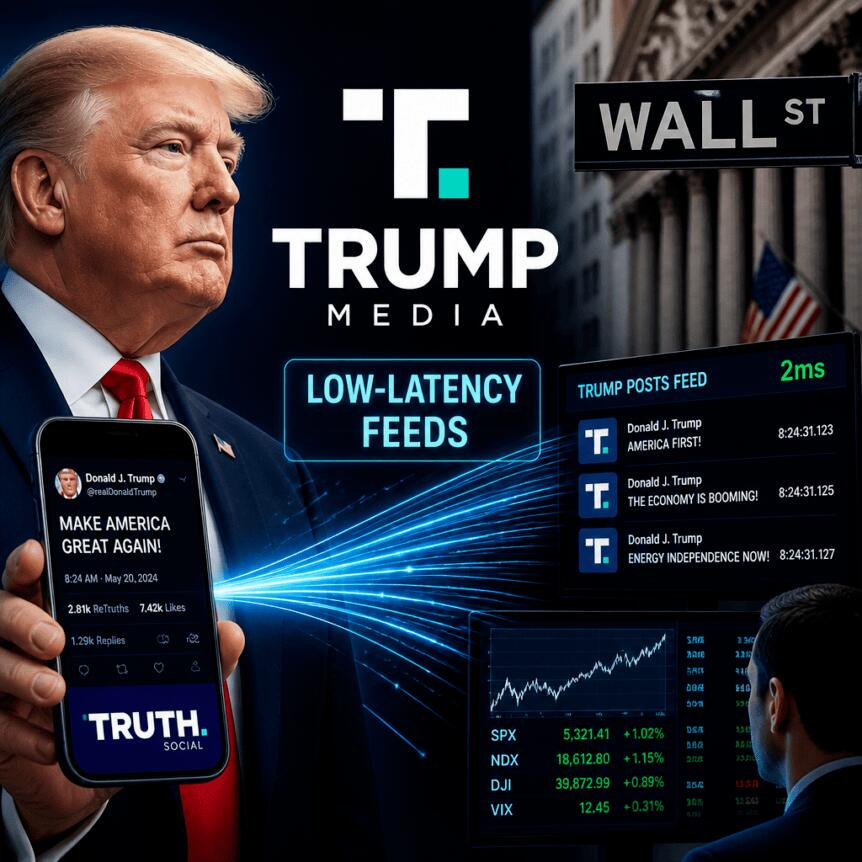
Trump Media & Technology Group (TMTG), the company behind the Truth Social platform, says it is preparing to launch a paid API that will let institutional Wall Street users pull posts from selected high-impact Truth Social accounts in real time.
In a filing with the U.S. Securities and Exchange Commission, TMTG states the “Truth API” is expected to be available to institutional customers starting Aug. 1, 2026. The service is designed for low-latency, machine-readable access—useful for high-frequency and algorithmic trading firms that want faster integration than manual browsing or slower data collection methods.
Key takeaways
- Trump Media is launching a paid Truth Social API aimed at institutional customers and market data workflows.
- Availability is targeted for Aug. 1, 2026, with a focus on real-time, licensed content from influential accounts.
- The API is intended for algorithmic and high-frequency trading that prioritizes low latency and machine readability.
- TMTG says scraping prior approaches violate its terms and that the company wants to increase friction for non-direct data collection.
- Truth Social posts have previously been cited as market-moving, including posts connected to U.S.–Iran developments.
A licensed, real-time feed for institutions
According to TMTG’s SEC filing, the Truth API is positioned as a direct, licensed channel for retrieving posts from Truth Social’s most “market-moving” accounts. The company is explicitly pitching the product to professional trading and market data users that need data in a format that systems can ingest quickly.
The filing emphasizes that the API is meant to deliver a real-time feed, tailored for scenarios where timing matters—especially for automated strategies. That framing matters to investors and market participants because it acknowledges a practical reality: social-media headlines and posts can influence how quickly traders react, and the gap between posting and data availability can affect execution.
Low latency and “friction” for scraping
In comments tied to the rollout, TMTG’s interim CEO Kevin McGurn said that Truth API provides a direct licensed stream of the platform’s “most market-moving Truths,” while also supporting the company’s goal of monetizing proprietary assets through recurring revenue.
The company also drew a line around how data should be obtained. In the filing, McGurn says companies have previously attempted to scrape Truth Social data, which he characterizes as a violation of the platform’s terms of service. He adds that Truth API is expected to “create a lot of friction” for those who do not come to the company directly.
For market participants, this shift is significant. Scraping-based approaches typically come with reliability and compliance risks—such as sudden changes in access patterns, blocking, or disputes over licensing. A formal API, by contrast, signals a more structured data pipeline that may be easier to incorporate into regulated or vendor-driven workflows.
Which accounts are in scope
TMTG’s announcement highlights that the API is intended to deliver posts from influential accounts, including Donald Trump (as President and as the operator of the Truth Social account named in the filing). The SEC documentation also references other major figures on the platform, including Donald Trump Jr, Eric Trump, and FBI Director Kash Patel.
Separately, the company points to prior instances where posts from Trump’s Truth Social account were associated with market attention. The article notes examples tied to the ongoing conflict between Iran and the U.S.—a reminder that Truth Social content is being watched not only as political commentary, but as a potential driver of market narratives.
Even with the API’s focus on “market-moving” accounts, investors should consider a key uncertainty: the SEC filing and the accompanying description do not spell out—within the provided text—exactly how “market-moving” is determined, how frequently the account set could change, or what latency benchmarks will be provided to customers.
Why an API matters for trading workflows
Social-media data has long been used in trading, but the quality of that data pipeline—particularly speed, structure, and licensing—often determines whether it can be reliably used for automation. By targeting low-latency delivery to institutional users, TMTG is effectively positioning Truth Social as a more integration-ready source of information for quantitative systems.
Just as importantly, the company’s approach frames the business model: rather than relying on incidental discovery or indirect data access, TMTG is attempting to convert platform influence into a recurring, licensed data service. The “high-margin, recurring revenue stream” language in McGurn’s statement suggests the API is intended to become a durable line of monetization, not a one-off product experiment.
As Aug. 1, 2026 approaches, market observers will likely watch for more operational details—especially how the API will handle access controls, content eligibility, and real-time performance expectations for institutional customers. Those specifics will determine whether Truth API becomes a practical component of algorithmic strategies or remains largely a compliance-first licensing alternative.
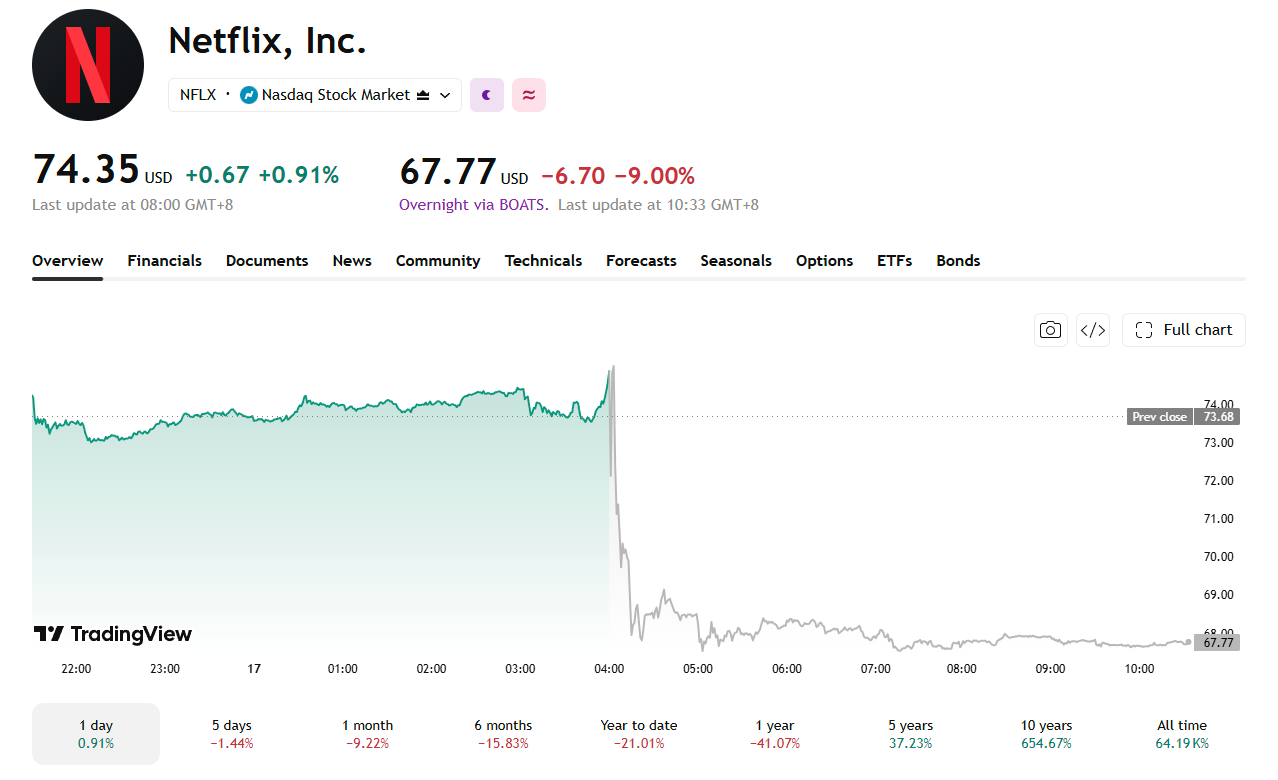
Netflix (NFLX) forecast third-quarter revenue of $12.86 billion, short of Wall Street’s $13 billion estimate. Shares sank nearly 9% in after-hours trading Thursday, July 16.
The guidance overshadowed second-quarter results that beat earnings estimates but fell just short on revenue. Investors are weighing slowing subscriber growth against a maturing streaming business heading into the back half of 2026.
Shares Slide Toward a Two-Year Low
Netflix shares closed Thursday’s regular session at $74.35, up 0.91%. The stock then fell 8.98% to $67.78 in after-hours trading once the guidance landed, per TradingView data.

The stock is down more than 21% year-to-date has fallen 41% over the past twelve months. It sits far from its all time high of around $133 set in June 2025.
The drop lands during a stretch of bank earnings season that has already tested investor patience. Fed Chair testimony on rates added to the volatility this week. The Nasdaq and S&P 500 have swung on similar earnings-driven volatility this cycle.
Analysts See a Maturing Growth Story
PP Foresight analyst Paolo Pescatore described the outlook as “a naturally maturing growth profile.” He said this does not signal deterioration in the business, but added that Netflix now has less room for error given persistently high expectations.
Netflix also said it would cut its viewing-hours report to once a year, starting in January 2027. The company wants to keep the focus on revenue and operating profit.
The company reiterated plans to roughly double annual advertising revenue to $3 billion. Engagement also grew 2% in the first half of 2026.
Netflix reports third-quarter results on October 20. Investors will watch whether the advertising and live-events push can offset slowing subscriber gains.
The post Netflix Stock Sinks After Third-Quarter Revenue Guidance Misses Estimates appeared first on BeInCrypto.


Trump Media, the company that operates the Truth Social network, said Thursday it was launching a new paid-for API that gives Wall Street firms “the fastest” access to posts from the most influential Truth Social accounts, including US President Donald Trump.
The API is targeted to be available to institutional customers from Aug. 1, 2026, and is aimed at high-frequency and algorithmic trading firms that require a low-latency, machine-readable feed, said the company on Thursday.
“Markets already move on Truth Social posts,” said Kevin McGurn, interim CEO of TMTG in a statement. “Truth API delivers a direct, licensed, real-time feed of the platform’s most market-moving Truths while advancing our strategy to monetize proprietary assets through a high-margin, recurring revenue stream.”
Posts from Trump’s Truth Social account have moved markets, with the most recent examples being his posts relating to the ongoing conflict between Iran and the US. Other major accounts on Truth Social include Donald Trump Jr, Eric Trump and FBI Director Kash Patel.
“Companies have previously tried to scrape data from Truth Social, which is in violation of its terms of service,” McGurn said, according to CNN.
“We’re going to create a lot of friction for those folks that aren’t coming to us directly,” he added.
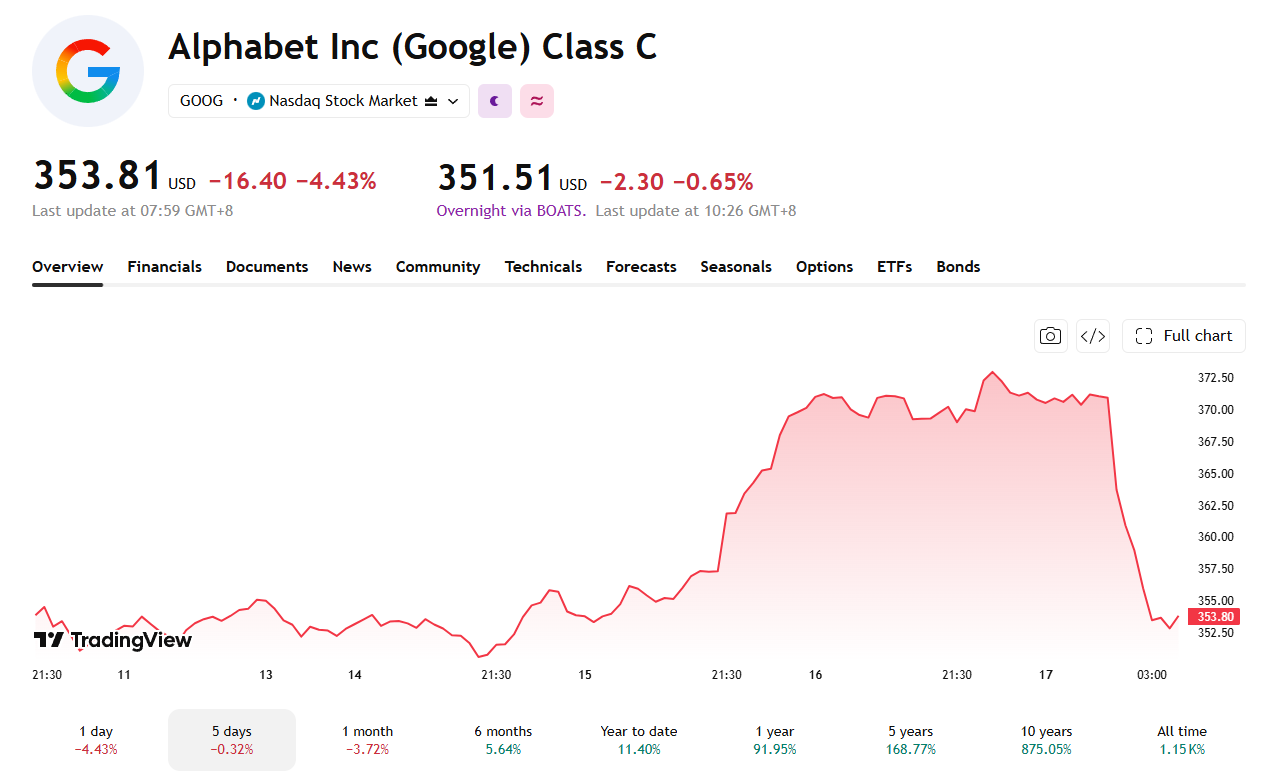
Alphabet stock fell over 4% after the European Union ordered Google to open Search and Android data to rivals. The order adds to concerns over a delayed Gemini 3.5 Pro launch.
The pullback erased most of a rally sparked days earlier by Warren Buffett’s public endorsement of the stock. Shares changed hands near $353 on Thursday, down from above push toward $370 days earlier, per TradingView data.
Gemini Delay Meets a Costly AI Buildout
Alphabet is reportedly facing delays in launching Gemini 3.5 Pro, its next flagship AI model. CEO Sundar Pichai had signaled a June release. Engineers are said to still be working on coding performance and now, some researchers reportedly worry rival models now outperform Gemini on enterprise benchmarks.

The delay lands as Alphabet guides to $180 billion to $190 billion in capital spending this year alone. That buildout already forced the company into reversing its buyback strategy. It also drove an $80 billion equity raise that Berkshire helped anchor.
Wall Street expects Alphabet to post second-quarter earnings per share near $2.86, up nearly 24% year over year when it announces on July 22. Google Cloud grew 63% last quarter to nearly $20 billion. That figure is what investors will watch most closely for evidence AI spending is converting into revenue, after Alphabet’s stronger earnings reaction than rivals last quarter.
Regulators Add to the Pressure
The European Commission ordered Google on Thursday, July 16 to open 11 Android features to rival AI assistants. It also ordered Google to share anonymized Search data with competitors, including OpenAI, under the Digital Markets Act. The Android changes take effect with the next major Android version in July 2027. Search data sharing begins in January 2027.
Google objected to the order in a statement.
“Europeans’ private searches would be exposed to unfamiliar companies, without adequate anonymization of the data and without user knowledge or consent. This would weaken citizens’ privacy, risk business trade secrets, and endanger national security,” he said in a statement.
Separately, The EU could issue Google a fine next week in a related Digital Markets Act investigation. That would mark a second, distinct regulatory action within days. US antitrust litigation over Google’s search dominance is also drawing fresh institutional attention.
Buffett’s Vote of Confidence
Against this backdrop, Buffett’s endorsement stands out. Speaking with CNBC’s Becky Quick, the Berkshire Hathaway chairman confirmed he built the position. Successor Greg Abel did not initiate the trade, he said.
Berkshire’s stake now tops $31 billion, ranking behind only Apple and American Express among its holdings. Buffett tempered the praise, though. He said Alphabet is not among his four or five favorite Berkshire-owned businesses.
He also flagged the same capital intensity worrying the broader market. Buffett called the AI spending race “real money.” His comments in his CNBC interview echoed the same caution about chasing near-term results over real returns.
The post Alphabet Stock Slips on Gemini Delay and EU Order Despite Buffett Bet appeared first on BeInCrypto.

Trump Media & Technology Group has launched a paid data feed called Truth API. It gives banks and trading firms faster access to Donald Trump’s market-moving Truth Social posts.
The service goes live August 1 and already has signed customers, the company said.
Why Speed On Trump’s Posts Matters
Trump’s Truth Social posts have repeatedly jolted global markets. Recent examples include his “Liberation Day” tariff announcements and trade threats against China.
On April 9, 2025, Trump said he would pause many new tariffs for 90 days. US stocks turned sharply higher within minutes of the post.
Truth API will cover the 10 most influential Truth Social accounts and archive posts back to 2022. The platform’s most-followed users include Trump himself, his sons Donald Trump Jr. and Eric Trump, and allies like Dan Bongino and Sean Hannity.
TMTG’s interim CEO, Kevin McGurn, said the feed targets firms with the most to lose from delayed information.
“We’re going to create a lot of friction for those folks that aren’t coming to us directly.”
— Kevin McGurn, Reuters
Conflict Of Interest Questions
The Donald J. Trump Revocable Trust holds roughly 41% of TMTG stock. Trump’s children oversee that trust, which manages his investments. The presidents close ties to the company, and his immense influence, puts him in a position of power to move markets with his social account.
Senator Ron Wyden, the top Democrat on the Senate Finance Committee, criticized the launch. He has also previously criticized the ‘Trump Family Greed‘ in relation to crypto profit disclosures. Wyden said of the new API that it would enrich the Trump family and “make Wall Street traders rich.”
Despite the criticism, and the apprent conflict of interest, Dynamis law firm partner Robert Frenchman said tiering access does not break federal securities law. However, he noted the practice still creates uneven odds for smaller traders.
“It certainly does not seem fair, but yes, a tech platform can tier its distribution of information without violating federal securities laws,” Frenchman said.
TMTG has accused unnamed firms of scraping Truth Social data for months. It calls that a breach of its terms of service. The company has previously batted down other Truth Social monetization rumors, including talk of a meme coin.
The launch adds to a pattern of Trump-linked market moves drawing scrutiny over who profits from information timing. Regulators have not said whether tiered access to a president’s posts raises new disclosure concerns.
The post Trump’s Truth Social Posts Will Hit Wall Street First, Giving a Financial Edge appeared first on BeInCrypto.

Network School founder Balaji Srinivasan says he is seeking a memorandum of understanding with Malaysia after Malaysian authorities probed his Forest City tech community over allegations that it may have hosted Israeli citizens using second passports. Malaysia’s Home Affairs Ministry said it is investigating the start-up community in Johor following claims that Israelis were present in violation of immigration rules.
The situation underscores a challenge for crypto-adjacent “digital utopia” projects: even when communities aim to build their own institutions and economies, they still rely on conventional nation-states for legal certainty. Srinivasan has linked the next phase of his Malaysia expansion plans to getting that assurance.
Key takeaways
- Malaysia’s Home Affairs Ministry is investigating Network School in Johor after allegations of Israeli nationals using second passports.
- Authorities’ initial checks reportedly found that 266 foreign residents held valid documents.
- Srinivasan is asking Malaysia for written assurances—possibly a memorandum of understanding or changes tied to a special economic zone.
- He says further investment in Malaysia, including a $122 million expansion plan, is on hold pending “sufficient assurance” that issues won’t repeat.
Malaysia investigation follows immigration-related claims
Malaysia’s Home Affairs Ministry said Tuesday that it is investigating Network School’s operations in Johor after claims surfaced alleging that the community included Israelis who may have breached immigration laws. In an early review, the ministry said it found no immediate documentary irregularities—reportedly confirming that 266 foreigners under the initiative had valid documents.
According to the ministry’s statement, the probe is tied to specific allegations rather than a blanket rejection of the project. Still, the inquiry puts Network School’s continued ability to attract and house foreign participants under closer scrutiny.
Srinivasan pushes for written legal certainty
Srinivasan said the reason for pursuing an agreement with Malaysia is to provide Network School with “legal certainty” that would allow it to continue investing and operating in the country. Without such a document, he suggested, the community could redirect its capital elsewhere.
In a video addressed to Malaysian Prime Minister Anwar Ibrahim, Srinivasan said he wants more than general statements welcoming tech; he wants personal, written confirmation that Network School will be considered welcome. He also indicated he is open to different legal mechanisms, including a memorandum of understanding or modifications tied to a special economic zone provision.
While Srinivasan did not lay out specific terms publicly, his messaging focused on predictability: investors and community operators need clarity about the legal status of participants, not just broad political signals.
He also said he is pausing any further investment in Malaysia, including a planned $122 million expansion, until he receives “sufficient assurance” that the immigration issues raised during this episode do not recur.
How the allegations surfaced
Claims that Network School was harboring Israeli citizens were traced back to an Instagram post from “Malaysian Protest 4 Palestine,” an activist group that accused the school of becoming a “gathering place for Israeli entrepreneurs.” In its course of action, the post helped spur immigration scrutiny that then moved to the Malaysian Home Affairs Ministry.
Malaysian policy on entry for Israeli passport holders is central to the dispute. The article notes that Israeli passport holders are forbidden from entering Malaysia, a Muslim-majority country, without written permission from the Malaysian Ministry of Home Affairs—reflecting Malaysia’s lack of diplomatic relations with Israel and its stated position of not recognizing Israel.
Importantly, while the investigation is ongoing, the ministry’s initial checks reportedly did not find immediate evidence—at least at the documentation level—that foreign residents lacked valid paperwork. That creates a key uncertainty going forward: authorities may still need to determine whether the allegations relate to residency status, identity verification, the use of alternate travel documents, or other aspects not covered by “valid documents” alone.
Why this matters for crypto-linked community models
Beyond the specifics of one tech community, the episode reflects a recurring tension for crypto-leaning projects that describe themselves as building new social and economic systems. Such initiatives often emphasize borderless or community-driven norms, but they still require host governments to provide stable, enforceable rules—especially when the project involves foreign nationals and long-term operations.
For investors and participants, the difference between informal tolerance and formal assurance can determine where capital goes next. Srinivasan’s decision to pause a large expansion plan suggests Network School is treating immigration uncertainty as a material risk to its business continuity, not a temporary public-relations issue.
If Malaysia provides the kind of written clarity Srinivasan is requesting, the project could regain confidence for future fundraising and staffing. If not, the story hints at a broader pattern: even when “build-first” communities develop successfully, compliance and policy certainty may become the bottleneck.
Readers should watch for what Malaysia’s Home Affairs Ministry concludes in the investigation, and whether any formal agreement—such as a memorandum of understanding or changes tied to existing special economic zone rules—emerges that addresses the specific compliance concerns raised in this case.


Network School founder Balaji Srinivasan is seeking a memorandum of understanding with Malaysia after authorities probed his Forest City tech community over allegations it was hosting Israeli citizens using second passports.
Malaysia’s Home Affairs Ministry said Tuesday it was investigating Srinivasan’s start-up community in Johor following claims it included Israelis in violation of immigration laws. Initial checks found all 266 foreigners held valid documents.
Srinivasan said the agreement would give Network School legal certainty to continue investing in Malaysia. Without it, he said, the community could take its capital to countries that are more welcoming.
“I’d like to have a document which says not just abstractly that tech is welcome … but rather that we’re personally welcome,” Srinivasan said in a video directed at Malaysian Prime Minister Anwar Ibrahim on Thursday.
The episode highlights a tension faced by many crypto utopias, which aspire to build digital-native communities with their own institutions and economies, but still depend on conventional states for legal certainty.
Balaji, the former chief technology officer of Coinbase, launched his Network School in August 2024 in Johor’s Forest City, which is located about an hour from Singapore. It is marketed as a physical community of tech builders, creators and founders.
Srinivasan did not give the specifics of what a deal with Malaysia could include, but suggested it could be a memorandum of understanding or a modification of a special economic zone provision.
Related: Balaji calls for more ‘crypto tools’ for refugees amid Middle East tensions
“If not, then we will readily go somewhere else because I don’t want to be where we’re not welcome,” he said.
Srinivasan also announced that he is putting any further investment in Malaysia, including a $122 million plan to expand its community, on hold until it gets “sufficient assurance” that such issues don’t recur.
Instagram post led to immigration probe
Claims that the Network School was harboring Israeli citizens have been traced back to a social media post on Friday from activist group “Malaysian Protest 4 Palestine,” which accused the school of becoming a “gathering place for Israeli entrepreneurs.”
Israeli passport holders are forbidden from entering Malaysia, a Muslim-majority country, without written permission from the Malaysian Ministry of Home Affairs, as Malaysia does not recognize Israel and does not have any diplomatic relations with the country.
Magazine: Gambling on random Pokémon cards: Onchain gagcha hits record high as crypto sinks


South Korea has raised interest rates for the first time since January 2023, shifting monetary policy toward tighter conditions in one of the world’s most active retail crypto markets.
Summary
- South Korea raised rates to 2.75%, marking its first monetary policy increase since January 2023.
- Tighter borrowing conditions could cool speculative crypto demand as local trading activity has already weakened.
- Strong growth, persistent inflation and won weakness may keep additional Bank of Korea hikes possible.
The Bank of Korea raised its benchmark rate by 25 basis points from 2.50% to 2.75% on July 16. All seven members of the Monetary Policy Board supported the decision. The central bank also said further increases may be needed depending on inflation, growth and financial stability conditions.
Bank of Korea shifts toward tighter monetary policy
The rate increase was widely expected. A Reuters poll found that 36 of 37 economists expected the central bank to raise its policy rate to 2.75%.
The Bank of Korea cited stronger exports and investment, persistent inflation and risks to financial stability. June consumer inflation reached 3.2%, while the central bank expects economic growth to exceed its previous 2.6% forecast by a wide margin.
Governor Hyun Song Shin said developments in growth, inflation and financial stability all supported a rate increase. The bank also said monetary policy may need to remain on a tightening path, with future decisions depending on economic data.
Higher interest rates generally raise borrowing costs and can reduce demand for speculative assets. For crypto markets, the direct effect may depend on whether tighter local financial conditions reduce the amount of won available for trading.
South Korea remains a major retail crypto market
South Korea continues to play an important role in global cryptocurrency trading. Local exchanges such as Upbit and Bithumb regularly generate large volumes in won-denominated markets, especially for altcoins.
As previously reported by crypto.news, XRP briefly became the most traded asset on Upbit in May, recording about $110.9 million in daily volume compared with $88.6 million for Bitcoin and $67 million for Ethereum. That trading pattern showed the continued influence of Korean retail traders on individual crypto markets.
Recent listings also show that crypto exchanges continue to target Korean traders. As reported by crypto.news, Upbit added Derive’s DRV token to its KRW, BTC and USDT markets on July 14, while Bithumb also introduced a won trading pair.
Crypto demand had already weakened before the rate hike
The rate increase comes after local crypto activity had already fallen from earlier peaks. However, cryptocurrency holdings among South Korean investors dropped from about $83.3 billion in January 2025 to $41.4 billion by February 2026.
Daily trading volume across five major domestic exchanges also declined from about $11.6 billion in December 2024 to roughly $3 billion in February. Won deposits held at exchanges fell from 10.7 trillion won to 7.8 trillion won, pointing to weaker cash demand for crypto trading.
Higher rates could add another restraint on speculative activity if households choose deposits, bonds or other yield-bearing assets over cryptocurrencies. However, crypto prices also depend heavily on global monetary policy, institutional flows and broader market conditions.
Further rate hikes could keep liquidity under pressure
The Bank of Korea has left the door open to additional tightening. Reuters reported that many economists expect at least one more increase this year, potentially taking the benchmark rate to 3.00%.
For South Korea’s crypto market, the policy shift comes as local retail participation has already cooled from previous highs. Further increases could keep domestic liquidity tighter, while stronger global institutional demand may become more important in supporting broader crypto risk appetite.

Derry City vs CSKA Sofia European tie suspended amid crowd disorder

Federal cash sought for Neosmelt iron project
Crash to $30K or Jump to $100K: 3 AIs Speculate What Is More Likely for BTC in 2026


-

 Fashion6 days ago
Weekend Open Thread: Nutriplenish Leave-In Conditioner
-
 NewsBeat12 hours ago
London Mayor Sadiq Khan handed a peerage by Keir Starmer alongside 15 other Labour figures… just days before the PM leaves No10
-

 Crypto World1 day ago
CFTC blocks Kalshi from unwinding Michigan trades after court order
-

 Sports7 days ago
Super Eagles star Moses Simon opens up on Liverpool transfer regret
-

 Business1 day ago
Nvidia Stock Slips After Big Tuesday Rally as Huang Confirms Vera Rubin Chip Is Now in Production Today
-

 Politics2 days ago
Young campaigners urge incoming PM to act on outdoor junk food ads
-
 News Videos2 days ago
XRP BOMBSHELL… XRP OMBOARDED FOR TRANSACTIONS!!!
-
 Tech3 days ago
Get Your ESP32 Sunny Side Up With This Solar Dev Board
-
 Entertainment1 day ago
Disney’s Most Ambitious Failed Star Wars Attraction Is Coming to SDCC
-

 Tech2 days ago
Dark Secrets Emerge When Jailbreaking LLMs
-

 Crypto World7 hours ago
Injective Submits SEC Transfer-Agent Registration to Onchain Ownership Records
-
 Sports1 day ago
New Cornerback Enters Vikings Trade Rumor Mill
-

 News Videos4 days ago
how to make coin bank box with cardboard #scienceproject #money #diy #shorts
-
 Tech3 days ago
Cloudflare Precursor Watches Your Mouse and Keyboard To Decide If You Are Human
-

 Business2 hours ago
Banco Bilbao Vizcaya Argentaria, S.A. (BBVA) Discusses Global Macro Environment and Economic Outlook for Core Markets Transcript
-
Crypto World3 days ago
Ripple, Coinbase, Circle Join Linux x402 Foundation to Help Shape AI Payments
-
 Entertainment1 day ago
Vicki Gunvalson Defends Discussing Heather Dubrow’s Money
-
 Crypto World6 hours ago
Claude Fable 5 Slips to Second in AI Coding Leaderboard
-
Business3 hours ago
Nephros, Inc. (NEPH) Discusses Evolving Water Safety Strategies and Expansion Beyond Filtration Transcript
-

 Business2 days ago
ACCC warns AI could lift insurance costs in risk-prone areas
You must be logged in to post a comment Login