

Crypto World
What is realized price? Bitcoin’s on-chain cost basis


Market price tells you what Bitcoin is worth right now. Realized price tells you what the market actually paid for it. When spot falls below that line, the whole market is underwater, and history says that is where bottoms tend to form.
Summary
- Realized price is the average price at which all circulating Bitcoin last moved on-chain, which makes it a measure of the market’s aggregate cost basis rather than its current value.
- It is calculated by dividing realized capitalization, the sum of every coin valued at the price it last moved, by the circulating supply.
- When the market price sits above realized price, holders in aggregate are in profit; when it falls below, the aggregate market is underwater, a condition that has historically appeared near cycle bottoms.
- Realized price is the foundation of a family of on-chain metrics, including MVRV and the MVRV Z-score, that analysts use to judge whether Bitcoin is overvalued or undervalued.
- It is a context tool, not a timing signal: realized price can fall, it relies on assumptions about coin movement, and it works best cross-checked against other data.
Realized price is one of the most useful on-chain metrics for understanding where Bitcoin sits in its market cycle, and it answers a question the ordinary price chart cannot: what did the market actually pay for its coins? While the market price shows what Bitcoin is worth at this moment, realized price shows the average cost basis of every coin in circulation, based on the last time each one moved on the blockchain. That distinction turns realized price into a kind of break-even line for the whole market, and the relationship between spot price and that line has historically marked periods of profit, loss, and, at the extremes, major tops and bottoms. This explainer covers what realized price is, how it is calculated, why it matters, and where its limits lie.
Realized price versus market price
The starting point is the difference between two ways of valuing the same coins. Market price is simple: it is the current trading price of Bitcoin, and market capitalization is that price multiplied by the number of coins in circulation. It reflects the latest sentiment, updated tick by tick, and it swings with every wave of buying and selling. It tells you what the market thinks Bitcoin is worth right now.
Realized price takes a different approach. Instead of valuing every coin at today’s price, it values each coin at the price it held the last time it moved from one wallet to another on-chain. The assumption is that when a coin moves, it is changing hands at roughly the market price of that moment, which approximates the price its current holder paid. Summing all of those individual last-moved values, and dividing by the supply, gives the average on-chain cost basis of the entire market. That is realized price.
The practical effect is that realized price strips out short-term sentiment. A sudden rally or crash changes the market price immediately, but it barely moves realized price, because most coins have not changed hands at the new level. Realized price only shifts as coins actually move at new prices, so it behaves like a slow-moving average of what holders paid. This is why analysts treat it as a measure of the market’s underlying economic reality rather than its momentary mood, and why the gap between the two prices carries so much information.
How realized price is calculated
Realized price is built on a companion metric called realized capitalization, or realized cap. To construct realized cap, you take every unit of Bitcoin and assign it the price it held the last time it moved on-chain, then add all of those values together. For Bitcoin, whose ledger is made of unspent transaction outputs, every output has a recorded last-moved price, which makes this calculation precise. Realized cap is therefore the sum of the whole market’s cost basis, an aggregate of what everyone effectively paid.
Realized price is then simply realized cap divided by the circulating supply. If realized cap represents the total dollars the market has committed to its coins, realized price represents the average dollars per coin. The concept traces back to work by on-chain analysts around 2018, when realized cap and the ratios built on it were introduced to bring cost-basis thinking into Bitcoin cycle analysis.
A simplified worked example makes it concrete. Imagine a tiny network of just four coins that last moved at prices of $20,000, $40,000, $60,000, and $80,000. The realized cap is the sum, $200,000, and the realized price is that divided by four coins, or $50,000. Now suppose the current market price is $45,000. The market price sits below the realized price of $50,000, which means that, on average, holders paid more than the coins are currently worth. In aggregate, the market is underwater. Scale that logic up to Bitcoin’s millions of coins and years of transaction history, and you have a single number that tells you whether the average holder is sitting on a gain or a loss.
Why realized price matters: the market’s cost basis
The value of realized price comes from what the gap between it and the market price reveals. When the market price is above realized price, the average holder is in profit, because coins are worth more than they last moved for. When the market price is below realized price, the average holder is at a loss, sitting on unrealized losses across the market. Realized price therefore acts as an aggregate break-even line, and crossing it in either direction is a meaningful event.
That break-even framing has real behavioral consequences. When the market trades below realized price, a large share of holders are underwater, and history shows this dampens natural selling: many people are reluctant to sell at a loss, so supply from ordinary holders tends to dry up. At the same time, the holders who do capitulate and sell at a loss during these periods are often selling to longer-term, value-oriented buyers near cycle lows. This is the emotional churn of a bottom, where weak hands give way to strong ones, and realized price is the line that defines who is above water and who is not.
On the other side, when the market price runs far above realized price, most of the supply sits on large paper gains, which makes the market more sensitive to profit-taking. A market where nearly everyone is deeply in profit has more potential sellers waiting, which is one reason extreme readings of the gap have historically aligned with cycle tops. Realized price, in other words, does not just tell you the market’s cost basis; it tells you something about the pressure of latent buying and selling built into the current price.
Realized price at cycle bottoms
The most watched use of realized price is as a bottoming indicator. Historically, the periods when Bitcoin’s market price fell below its realized price have been rare and have tended to cluster around major cycle lows. Because falling below realized price means the aggregate market is underwater, it usually coincides with deep bear-market sentiment, capitulation, and negative news, exactly the conditions that have, in past cycles, preceded strong recoveries. Buying Bitcoin during these below-cost-basis stretches has, in hindsight, produced some of the best long-term returns in its history.
The mechanism behind this is the churn of holders described above. As the market grinds below realized price, holders who cannot tolerate losses sell to value investors who are willing to accumulate at prices below the market’s average cost. That transfer of coins from weaker to stronger hands is a hallmark of a maturing bottom. Eventually, selling pressure exhausts, and as the market recovers, the price climbs back above realized price into the next expansion phase. Realized price thus behaves like a floor that the market probes during capitulation and reclaims during recovery.
It is important to be precise about what this does and does not promise. A drop below realized price has historically marked value zones, but it is not a guarantee of an immediate bottom, and the market can trade below its cost basis for an extended period during a deep bear market. Realized price identifies when the average holder is underwater, which is a necessary feature of past bottoms, but not a precise timing tool for the exact low. It tells you the market is in a historically significant zone, not the day it will turn.
The metric family: MVRV and the MVRV Z-score
Realized price and realized cap are the foundation for a broader set of on-chain valuation tools, and understanding the family helps you use any one of them. The most common is MVRV, the market-value-to-realized-value ratio, which divides market cap by realized cap. MVRV expresses the same information as the realized-price gap in ratio form: an MVRV above one means the market trades above its cost basis, and below one means it trades below it. Historically, MVRV readings below one have marked some of the best buying opportunities, while very high readings have marked cycle tops.
A refinement is the MVRV Z-score, which takes the difference between market cap and realized cap and normalizes it by the historical volatility of market cap. This adjustment makes it easier to compare extremes across different cycles, because it measures how unusual the current deviation is relative to Bitcoin’s own history instead of in raw dollar terms. The Z-score has been notably effective at flagging cycle tops, historically identifying major highs within a couple of weeks, and its lower band has marked deep-value bottoms.
Analysts also split these metrics by holder cohort. Short-term and long-term realized prices separate coins by age, often at a threshold around 155 days, to compare the cost basis of recent buyers against seasoned holders. When the short-term holder cost basis breaks below the long-term one, or when the market trades between them, it signals stress or transition. Related metrics such as the spent output profit ratio, which tracks whether coins are moving at a profit or loss, and measures of supply in profit or loss, round out the toolkit. The lesson is that realized price is rarely used alone; it is the anchor for a system of cost-basis metrics.
Reading realized price today
Realized price is most talked about during downturns, and a deep drawdown is exactly when it becomes most relevant. When Bitcoin falls far from a prior all-time high, the market price approaches and can breach the realized price, pushing the aggregate market toward or below its cost basis. That is the moment analysts start citing realized price heavily, because it frames the central question of a bear market: is the market simply underwater in a historically normal way that has preceded recoveries, or is something more structural at work?
Reading it well means treating realized price as context rather than a trigger. If the market is trading near or below realized price, the metric tells you the average holder is close to break-even or underwater, which historically has been a zone of value and reduced selling pressure. It does not tell you the exact bottom, and it must be weighed against the wider environment, including liquidity conditions, demand from buyers such as funds and treasuries, and the behavior of long-term holders. A market below realized price with returning demand is a very different picture from one below realized price with demand still fleeing.
The most useful habit is to watch realized price alongside its relatives and the flows around it. Is spot above or below realized price, and by how much? What is MVRV or the Z-score saying about how extreme the deviation is? Are long-term holders accumulating or distributing? Combining realized price with those cross-checks turns a single line into a genuine read on the market’s cost-basis health, which is far more informative than the spot chart alone during the fear and noise of a downturn.
The limits of realized price
Realized price is powerful, but it comes with important caveats that separate careful analysts from those who misread it. The first is that it is not a timing tool. A market can trade below realized price for months during a severe bear market, so the metric identifies a value zone, not a turning date. Treating a single break below realized price as a signal to expect an immediate bottom has caught out many people who underestimated how long capitulation can last.
The second caveat is that realized price can fall, which surprises people who assume cost basis only rises. When holders sell heavily at a loss, those coins move at the new lower prices, which drags the aggregate cost basis, and therefore realized price, downward. In a deep enough decline, realized price itself declines, so a level that looked like firm support can drift lower. Realized price is a moving line shaped by holder behavior, not a fixed floor. There are also structural quirks: the metric assumes a coin moving between wallets represents a change of ownership at market price, which is not always true, since exchange transfers and internal shuffles can move coins without a real sale. Lost coins that can never move again also sit in the calculation at old prices, gently distorting it.
The final and most important caveat is that realized price should never be read in isolation. Its creators and the analysts who use it consistently pair it with other data: the spent output profit ratio, supply in profit or loss, exchange inflows and outflows, and the derivatives structure that can make the spot picture misleading. Different chains need different adjustments, and even for Bitcoin the metric works best as one input among several. Used that way, as a cost-basis thermometer read alongside its family and the surrounding flows, realized price is one of the most reliable tools in on-chain analysis. Used alone as a precise buy or sell signal, it will disappoint.
Realized price across holder cohorts and other assets
The aggregate realized price is the headline number, but the concept becomes more powerful when it is broken down, and understanding that adds real depth. Analysts often split realized price by holder cohort, most commonly separating short-term holders from long-term holders using a coin-age threshold around 155 days. Short-term holder realized price tracks the cost basis of recent buyers, who tend to be more reactive, while long-term holder realized price tracks the cost basis of seasoned holders, who tend to hold through volatility. The short-term line usually sits closer to the market price and often acts as nearer-term support or resistance, while the long-term line moves slowly and marks a deeper floor.
Reading the two cohorts together tells a story the aggregate hides. In a healthy uptrend, the market price sits above both cohorts’ cost bases, so almost everyone is in profit. When the market falls below the short-term holder cost basis, recent buyers move underwater first, which historically pressures the group most likely to panic-sell. When it falls all the way below the long-term holder cost basis, even seasoned holders are underwater, a condition seen only in the depths of bear markets and often near major bottoms. Watching which cohort’s line the price is testing gives a finer read than the single aggregate number.
The concept also extends beyond Bitcoin, though with adjustments. For Ethereum, which uses an account-based ledger instead of Bitcoin’s unspent-output model, data providers approximate address-level cost bases and aggregate them, preserving the spirit of cost-basis valuation. Ethereum also requires care around its supply: the fee burn introduced by its network upgrades reduces effective supply over time, and staking flows change what counts as circulating, so realized price and its ratios need burn-adjusted and staking-aware supply figures to be accurate. The same idea applies to other large assets, always with chain-specific quirks.
The takeaway is that realized price is not a single rigid number but a lens that can be focused. Aggregate realized price gives the market-wide cost basis; cohort realized prices reveal which groups of holders are in profit or pain; and adapting the metric to other chains extends its usefulness across the market. Used at these finer resolutions, and always with awareness of each chain’s supply mechanics, realized price becomes a far richer tool than the single line most people first encounter.
Frequently Asked Questions
What is realized price in simple terms?
Realized price is the average price at which all Bitcoin in circulation last moved on-chain, which makes it a measure of the market’s aggregate cost basis, or what holders effectively paid. Unlike the market price, which reflects the latest trading value, realized price only changes as coins actually move at new prices, so it behaves like a slow-moving average of the market’s break-even level.
How is realized price calculated?
Realized price is realized capitalization divided by the circulating supply. Realized cap is found by valuing every coin at the price it held the last time it moved on-chain and summing those values. So if four coins last moved at $20,000, $40,000, $60,000, and $80,000, realized cap is $200,000 and realized price is $50,000, the average on-chain cost basis.
What does it mean when Bitcoin trades below realized price?
It means the aggregate market is underwater, with the average holder sitting on an unrealized loss because coins are worth less than they last moved for. Historically, these periods have been rare and clustered near cycle bottoms, coinciding with capitulation and deep bearish sentiment. They have often marked strong long-term value zones, though not a precise date for the low.
Is realized price a reliable bottom signal?
It is a useful context tool, not a precise timing signal. Falling below realized price has historically marked value zones near cycle lows, but the market can trade below its cost basis for an extended period in a deep bear market. Realized price tells you the average holder is underwater, a common feature of past bottoms, but it should be combined with other data before drawing conclusions.
How is realized price related to MVRV?
They express the same idea in different forms. MVRV, the market-value-to-realized-value ratio, divides market cap by realized cap, so an MVRV below one means the market trades below its cost basis, the same message as spot falling below realized price. The MVRV Z-score refines this by normalizing the gap for volatility, making it easier to spot extreme highs and lows across different cycles.
Can realized price go down?
Yes. Realized price rises as coins move at higher prices, but it can also fall. When holders sell heavily at a loss, those coins move at lower prices and drag the aggregate cost basis, and therefore realized price, downward. This means realized price is a moving line shaped by holder behavior, not a fixed floor, and a level that looked like support can drift lower in a deep decline.
What is the difference between realized price and realized cap?
Realized cap is the total, and realized price is the per-coin average. Realized cap sums the value of every coin at the price it last moved, giving the market’s aggregate cost basis in dollars. Realized price divides that total by the circulating supply to give the average cost basis per coin. Realized cap is compared with market cap; realized price is compared with the market price.
What are the main limitations of realized price?
It is not a timing tool, since markets can stay below it for months. It can fall when holders sell at a loss, so it is not a fixed floor. It assumes coins moving between wallets represent real ownership changes at market price, which is not always true, and lost coins distort it. Because of these quirks, it works best alongside other metrics like SOPR, supply in profit or loss, and exchange flows.
Disclaimer: This article is for information and educational purposes only and does not constitute financial, investment, or trading advice. On-chain metrics describe historical patterns that may not repeat, and cryptocurrency prices are highly volatile. Nothing here is a recommendation to buy or sell any asset. Always do your own research and consider consulting a qualified professional before making financial decisions. Information is accurate as of July 2, 2026, and may change.


Strategy’s long streak as one of Bitcoin’s most consistent institutional buyers may be ending, according to Bitwise chief investment officer Matt Hougan. Speaking Thursday, Hougan suggested the company’s dominance as a “one-way” source of demand is likely to shrink in the next market cycle, after volatility around Strategy’s principal perpetual preferred stock product, Stretch (STRC).
The reassessment comes after STRC broke sharply from its $100 par value to below $75 late last month, a move that undermined investor confidence in the sustainability of Strategy’s dividend-style model. The timing also overlapped with broader market stress, when Bitcoin fell to a 21-month low of $58,190 on June 25.
Key takeaways
- Bitwise CIO Matt Hougan said Strategy’s era as Bitcoin’s dominant buyer may be over, with other institutional allocators expected to play a larger role next cycle.
- STRC’s move away from $100 par value below $75 fueled concerns about whether Strategy’s yield structure can hold up through “end-of-cycle” dynamics.
- Despite the STRC shock, Hougan argued Strategy is not facing near-term liquidity risk based on liquid asset coverage.
- Strive CEO Matt Cole pushed back, calling the STRC episode overblown and noting Strategy’s Bitcoin holdings are about 4% of total supply.
Strategy’s buyer dominance questioned after STRC turmoil
For years, Strategy has been widely viewed as a steady, high-conviction buyer of Bitcoin—helping provide consistent demand even when broader sentiment weakened. Hougan framed Thursday’s comments around a shift in what investors should expect from that demand profile.
“For years, Strategy has been the most dominant Bitcoin buyer in the world and a one-way source of Bitcoin demand. Those days are likely over,” Hougan said in a CIO memo, adding that he expects the company to be “less important” than it was in the previous cycle. In his view, banks, asset managers, pensions, endowments, and sovereign wealth funds may replace Strategy as Bitcoin’s primary demand engine as the next upcycle develops.
Hougan’s concern centers on how STRC behaved during a period when markets were already under pressure. The STRC incident raised fears that the structure underpinning dividend payments could be strained when conditions tighten—particularly in late-cycle environments where risk appetite falls and funding costs rise.
Why Hougan sees STRC as “end-of-cycle dynamics”
Hougan characterized the STRC drop as a pattern he associates with late-cycle stress. He compared the situation to a prior example in 2021: the collapse of Grayscale’s GBTC premium.
His argument is essentially about fit. According to Hougan, “money searching for high yields and low volatility was used to buy Bitcoin, which offers neither.” In that framing, the market eventually needs to “clear out” capital that was attracted by yield characteristics that Bitcoin itself does not reliably provide, before a more durable bottom can form.
This perspective matters for traders and longer-term investors because it reframes Strategy’s recent volatility away from a single-company solvency story and toward a broader liquidity-and-demand composition story—one where the source of marginal demand changes as the cycle matures.
Strategy responds: funding dividends and increasing reserves
In the aftermath of the STRC disruption, Strategy said it would sell Bitcoin when necessary to fund dividends, according to coverage earlier published by Cointelegraph. The company also expanded its US dollar reserve to $2.55 billion, easing some immediate concerns about operational coverage.
Even with those steps, Hougan said Strategy’s role as an aggressive buyer has weakened. The implication for market participants is that reserve moves and occasional Bitcoin sales can stabilize the dividend narrative in the short term, but may also reduce the consistency of net buying during turbulent periods.
Hougan nonetheless said he still expects Strategy to be a “net buyer” in the next bull run—suggesting the firm’s long-term posture may persist, even if its influence on price dynamics is likely to be less dominant than in the last cycle.
Debate over materiality and liquidity risk
While STRC became the focal point, Strategy leadership pushed back on how much attention the incident deserves. Strive CEO Matt Cole argued that the episode has been overemphasized by media and that Bitcoin’s selloff may have been driven more by the broader market than by any single factor.
Speaking with NovaDius Wealth Management president Nate Geraci, Cole noted that Strategy’s 847,363 Bitcoin represents about 4% of total supply. He also referenced US Securities and Exchange Commission standards for materiality, stating that a 4% stake would not be considered material under SEC thresholds, which he described as starting at 5%.
“If one person owned 4%, you don’t even have to report that publicly to the SEC because the SEC deems 4% to be immaterial. They start to view a position to be material at 5%.”
Hougan, meanwhile, addressed liquidity in a more quantitative way. He said Strategy has $52 billion worth of liquid assets marked against $7 billion of debt. In his assessment, Bitcoin would need to fall another 70%—to roughly $18,500—for Strategy to face risk. He also added that if the company began selling Bitcoin immediately, it could cover dividends from STRC and other perpetual preferred stock offerings for the next 28 years.
Taken together, the two positions highlight a tension that investors should watch: one view suggests the STRC mechanism is a late-cycle stress test that affects demand composition and price, while the other emphasizes reserve coverage and argues that the company’s balance sheet prevents an immediate liquidity threat.
For now, the key question is not whether Strategy can operate through the current strain, but whether the market’s next wave of Bitcoin buying will be driven by the same yield-seeking, vehicle-based demand—or by a broader set of long-term allocators that Hougan expects to take a bigger share.
As conditions evolve, investors should monitor whether STRC stabilizes relative to par and whether Strategy’s net buying pace remains consistent enough to reassert influence—while also tracking if incremental demand truly shifts from Strategy-style products to the wider institutional categories Hougan cited.


Riot Platforms transferred another 500 BTC to NYDIG Custody, according to Arkham data cited by onchain trackers.
Summary
- Riot Platforms moved another 500 BTC to NYDIG Custody, raising fresh sale speculation among traders.
- The miner already sold 3,778 BTC in Q1 while producing only 1,473 BTC total.
- Public Bitcoin miners continue selling reserves as mining costs rise and margins remain under pressure.
The transfer was worth about $30.72 million at the time of the report and was shared through an Onchain Lens post.
The move may signal that Riot is preparing to sell part of its Bitcoin holdings. Transfers to custody or execution partners do not always confirm a sale, but similar Riot transfers this year have often come before reported selling activity.
Another move in a longer sale pattern
The latest transfer follows earlier Riot activity involving NYDIG. As crypto.news reported in April, Riot sent 500 BTC to an NYDIG deposit address in a move worth about $39 million at the time. That report said the transfer added to a series of Bitcoin moves from Riot over the same period.
Riot had also disclosed large Bitcoin sales in its first-quarter 2026 operations update. The company sold 3,778 BTC in Q1 for about $289.5 million. It sold those coins at an average net price of $76,626 per BTC.
Riot produced 1,473 BTC in the first quarter, down 4% from 1,530 BTC in the same period a year earlier. Its BTC holdings fell to 15,680 at quarter-end, down 18% from 19,223 in Q1 2025. The company said 5,802 BTC were restricted at the end of the quarter.
Riot’s Q1 results also showed pressure in its mining business. Bitcoin mining revenue fell to $111.9 million from $142.9 million a year earlier. Riot linked the decline to lower average Bitcoin prices and higher network hash rate.
Miner selling pressure continues
Riot’s latest BTC movement comes as public miners face tighter economics after the Bitcoin halving. Higher mining difficulty, lower hashprice, energy costs, and capital needs have pushed several listed miners to sell reserves.
As crypto.news reported, publicly traded Bitcoin miners sold more than 32,000 BTC in the first quarter of 2026. That was a record quarterly figure and topped the amount sold by the same firms across all of 2025. Riot, MARA, CleanSpark, Cango, Core Scientific, and Bitdeer were among the miners named in that wider trend.
Riot also continues to expand beyond Bitcoin mining. The company has been building a data center business while using its power assets and infrastructure to serve high-performance computing customers. That shift gives the miner another capital need at a time when mining margins remain tight.
The 500 BTC transfer does not confirm an immediate sale on its own. Still, the timing adds to the market’s focus on Riot’s treasury strategy.


Ether and solana led crypto higher on Friday as a squeeze on bearish traders pushed bitcoin toward $62,000, capping the market’s first genuinely strong week since mid June.
Bitcoin traded around $61,360, up 2.5% over seven days, per CoinDesk data. Ether rose 4.2% in 24 hours to about $1,702 and is up 9.7% on the week, while solana held near $80 with a weekly gain of 18.6%, the strongest among the majors. XRP added 5.7% over the week to $1.09 and Hyperliquid’s HYPE rose 5.1% on the day.
Traders betting against crypto lost $281 million to liquidations over the past 24 hours, against $159 million in longs, out of $440 million in total forced closures across 95,690 traders, according to Coinglass data.
When shorts are forced to close, they buy back the asset, and that buying pushes prices into the next tranche of shorts, the loop that turns a modest bounce into a squeeze.
The largest single liquidation was an $18.2 million ether position on Hyperliquid, fitting a day when ether led the damage to bears at $157 million in wiped positions against bitcoin’s $103 million in an unusual flip.


The U.S.-listed bitcoin ETFs pulled in $221.7 million on Thursday, their largest inflow in two months, according to SoSoValue.
Fidelity’s FBTC led the charge with a hefty $165.96 million inflow, followed by ARKB at $91.84 million and HODL at $4.35 million. BlackRock’s IBIT, the world’s largest Bitcoin ETF, was the outlier with a $40.43 million outflow.
The cumulative inflow ends a painful 10-day outflow streak that saw investors pull $2.73 billion from the funds. Even so, the year-to-date picture remains ugly, with net outflows still sitting at a hefty $5.4 billion.
Thursday’s bounce is therefore a drop in the ocean compared to the selling we’ve seen this year. Still, it’s a welcome sigh of relief for the bulls. At the very least, it helps validate bitcoin’s rebound to around $61,700 after hitting 21-month lows under $58,000 earlier this week.
For a real recovery, though, these inflows need to turn into a consistent trend. Historically, steady money flowing into Bitcoin ETFs has been a hallmark of bull runs.


Binance is reportedly set to lead a new funding round for Mesh, a crypto payments and settlement company, at a valuation of up to $2 billion.
Summary
- Binance’s planned lead role could double Mesh’s valuation from $1B to as much as $2B.
- Mesh’s payments network targets digital asset transfers across wallets, exchanges, stablecoins, and fiat rails globally.
- Growing stablecoin rules and tokenization demand are pushing investors toward crypto settlement infrastructure providers.
The deal was reported by Axios, citing people familiar with the matter. The report said demand for digital asset-to-fiat transfer tools, payment systems, and settlement infrastructure is rising.
Meanwhile, that demand comes as stablecoin rules become clearer and tokenization moves deeper into financial markets. The round has not been formally announced by Binance or Mesh.
Mesh valuation could double
The reported round would mark a sharp rise in Mesh’s valuation. As crypto.news reported, Mesh raised a $75 million Series C in January at a $1 billion valuation. That round was led by Dragonfly Capital, with backing from Paradigm, Moderne Ventures, Coinbase Ventures, SBI Investment, and Liberty City Ventures.
Mesh was formerly known as Front Finance. The company builds payment infrastructure that connects wallets, exchanges, digital assets, and fiat rails. It aims to make crypto payments easier for users while letting merchants receive stablecoins or fiat without handling complex blockchain steps.
Stablecoin rules lift demand
Stablecoins have become a major focus for payment companies, exchanges, and banks. Banking Circle launched regulated stablecoin settlement services after receiving approval in Luxembourg. The bank now supports USDC, USDG, and its own EURI for institutional fiat and crypto conversion.
The market is also moving toward tokenized bank deposits. As crypto.news reported, major U.S. banks are backing a tokenized deposit network through the Clearing House, with a launch targeted for early 2027. That system would let banks settle tokenized deposits around the clock while keeping customer deposits inside regulated banking channels.
Funding race turns to settlement
Mesh sits in the middle of this shift because it focuses on the movement of value between assets, wallets, and payment systems. Its model addresses a common issue in crypto payments: users may hold one asset, while merchants or platforms may want settlement in another asset or in fiat currency.
The company has also worked to expand access through partnerships. Moreover, Mesh partnered with Italy’s crypto wallet Conio in 2024, giving Conio users access to several crypto exchanges and withdrawal options through Mesh’s connection layer.
A Binance-led round would show that large exchanges still see payment and settlement infrastructure as a core growth area. It would also place Mesh closer to the center of the stablecoin and tokenization race, where firms are trying to connect crypto rails with everyday payments, institutional transfers, and fiat settlement.
The reported valuation also reflects a wider shift in crypto funding. Investors have moved beyond trading apps and tokens toward systems that can support regulated payments, cross-border transfers, and asset settlement.
If the round closes near the reported level, Mesh would have doubled its valuation in about six months, showing continued demand for infrastructure that links digital assets with traditional money.

TLDR:
- Ironwood testnet activates with two independent consensus implementations built by separate teams.
- Zcash reduced ten-note wallet migration times from around 15 minutes to about 2.5 minutes.
- Multi-transaction signing now supports more than 11 transactions through a single QR code.
- Mainnet activation could occur around July 21 as audits and ZIP specifications near completion.
Zcash is moving forward with its Ironwood network upgrade after confirming a scheduled testnet activation. The update introduces new consensus changes and major wallet performance improvements ahead of a planned mainnet deployment.
Development teams have also completed two independent consensus implementations for the upgrade. The work marks one of the most advanced testnet preparations recorded for a Zcash network upgrade.
Zcash Ironwood Testnet Upgrade Brings Dual Consensus Implementations
Zcash developer Dev announced that the Ironwood testnet upgrade would activate on July 4. The release includes two independently developed consensus implementations.
One implementation came from Valar Group, while the other was built by the Zcash Foundation. According to Dev, the Valar Group version has already entered the audit process.
The teams also released a desktop wallet fork that supports migration testing on the testnet. Users with Keystone development devices can update firmware and test migration functions before the mainnet launch.
The upgrade introduces multi-transaction signing through a single QR code. Dev said the feature required extensive work behind the scenes and represented a major technical milestone for the testnet.
Contributors from zodl also participated in the process. The group worked on technical specifications, wallet libraries, circuit updates, and application programming interfaces supporting Ironwood.
Zcash Wallet Performance Improves Ahead of Mainnet Activation
Development updates shared by Dev showed major gains in wallet migration performance. The time needed to complete a ten-note migration fell from around 15 minutes to approximately two and a half minutes.
Inbound QR scanning dropped from three minutes to one minute. Loading and transaction review declined from two minutes to 45 seconds.
The signing process posted the largest improvement. Signing time fell from roughly nine minutes to about 37 seconds.
Outbound QR scanning also became faster. The process now takes about 10 seconds compared with roughly one minute previously.
In a separate update, Zcash developer Sean Bowe said all Ironwood consensus rule changes had been implemented and were undergoing audits.
He added that the specifications and Zcash Improvement Proposals, known as ZIPs, were approaching their final state.
Bowe also said developers expected readiness for a mainnet activation around July 21. He confirmed that the official testnet activation was scheduled for the following day and noted that the Zebra release supporting Ironwood should become available around the same time.
According to Bowe, sufficient mining hash rate already signals technical readiness for the mainnet upgrade. He noted that some wallets may not support Ironwood immediately, although alternative options and testnet preparation time remain available before activation.

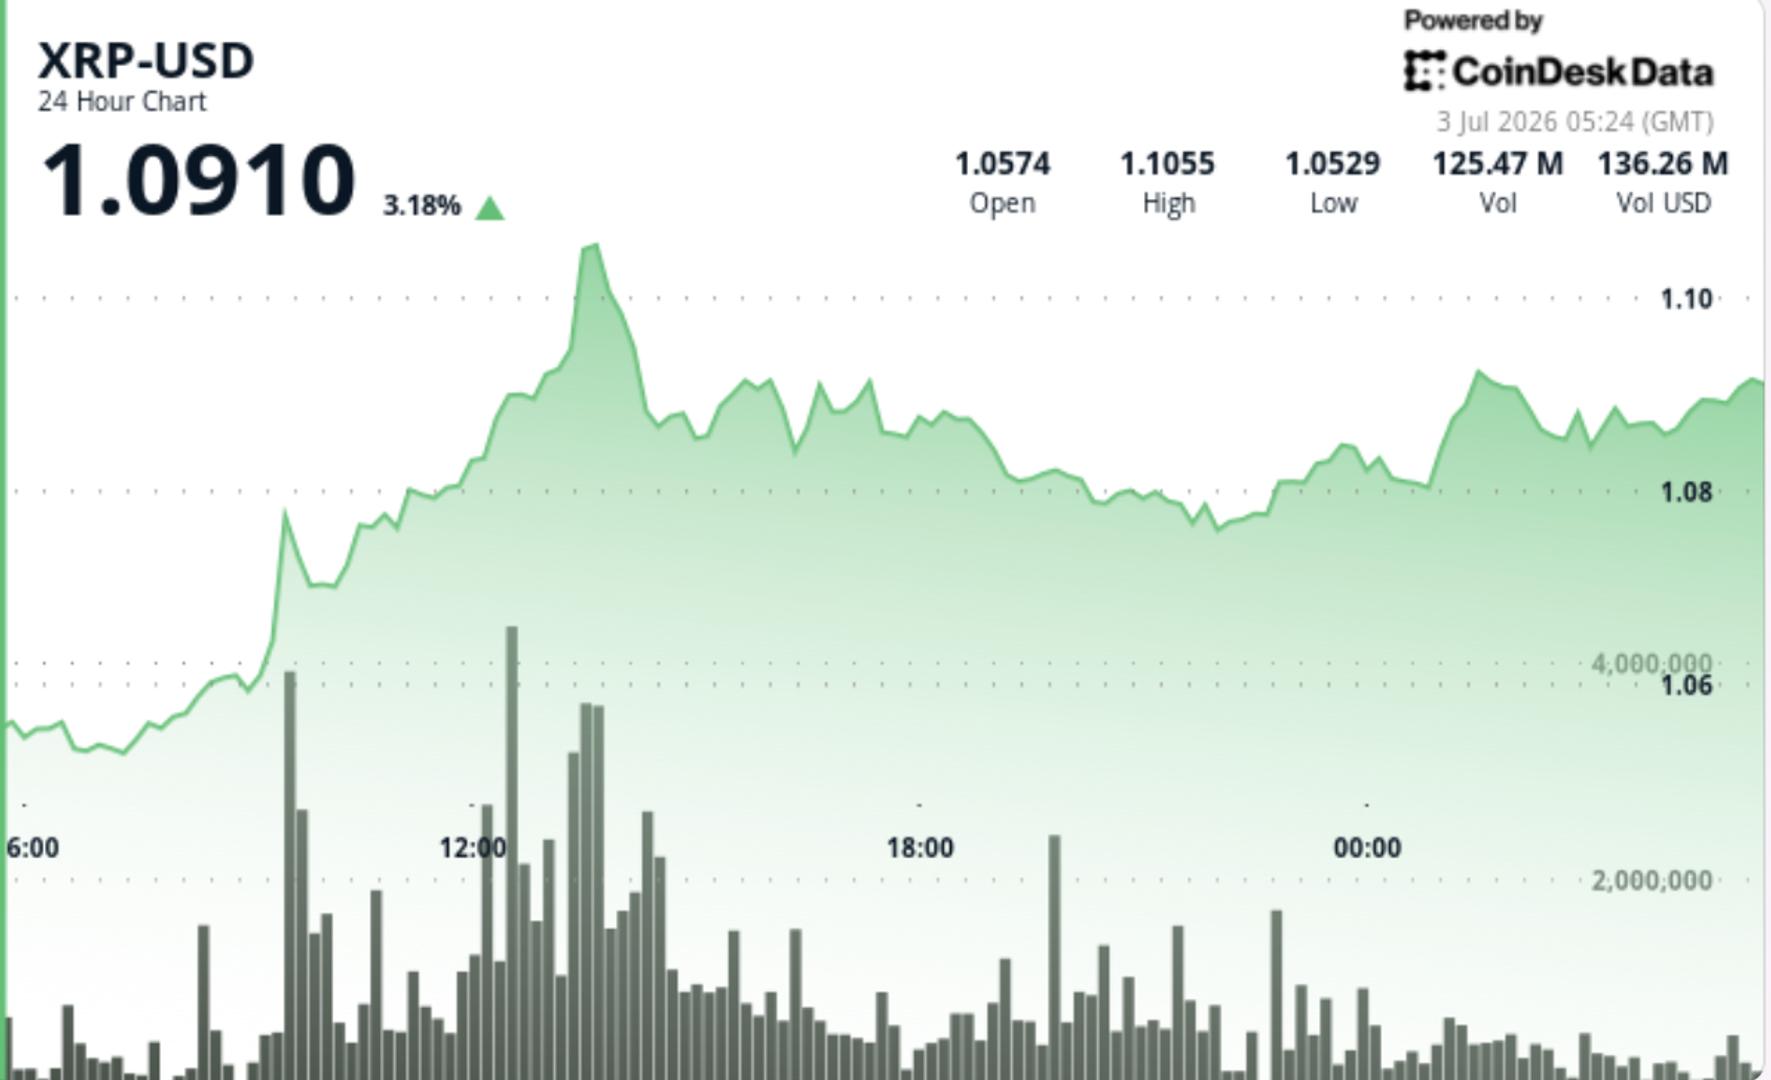

XRP is starting to build a higher base above $1 following last week’s sell-off. The token edged higher through the U.S. session, held $1.08 on repeated tests and pushed toward $1.10 before sellers slowed the move. That keeps the setup constructive, but still unfinished, with traders watching whether the latest accumulation turns into a clean breakout.
News Background
• XRP wallet creation rose to 4,941 daily addresses, the strongest single-day growth in 14 weeks.
• Bullish social sentiment reached a three-month high, with positive comments outnumbering bearish ones by 3.7 to 1.
• Ripple completed its scheduled 1 billion XRP escrow unlock without a meaningful price shock.
• XRP’s move tracked the broader crypto market closely, with idiosyncratic variance against CD5 staying well below the level that would suggest a major asset-specific catalyst.
Price Action Summary
• XRP rose from $1.0611 to $1.0894 during the 24-hour session, gaining 0.62%.
• The token established higher lows at $1.0552, $1.0589 and $1.0799, showing buyers stepped in at progressively higher levels.
• Volume rose 26.92% above the seven-day average, pointing to steady participation around the move.
• The strongest push came at 13:00 UTC, when volume reached 117.5 million XRP, about 142% above the 24-hour average.
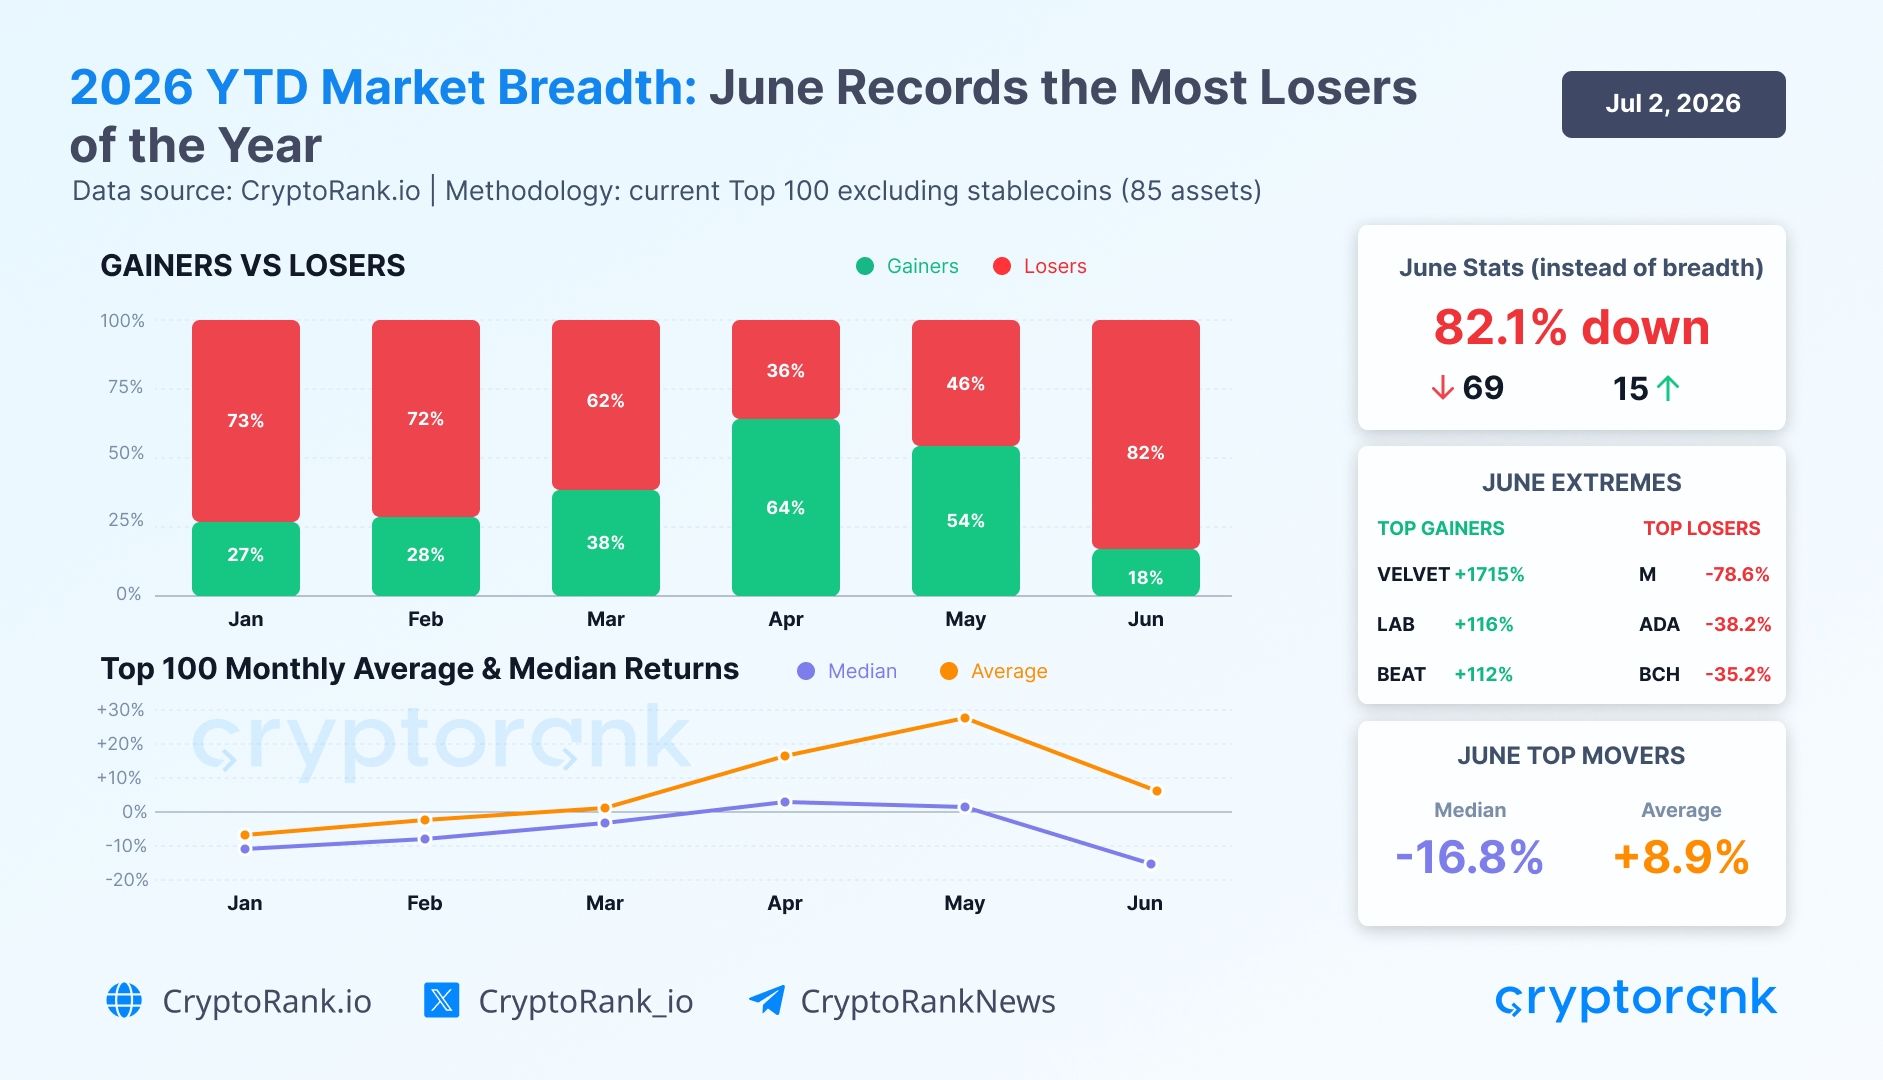
Roughly 82.1% of the top-100 crypto assets declined in June, the worst market breadth of 2026, even as the group’s average return stayed positive.
That split defined the month. A single outlier lifted the average into positive territory while the median return dropped 16.8%, according to a second-quarter recap from CryptoRank.
A Headline Average That Hid the Damage
Across the current top-100 assets excluding stablecoins, CryptoRank recorded a positive average return of 8.9% for June. That figure reflected a single outlier rather than the broader market.
“The market breadth data shows a clear deterioration in participation across the current non-stablecoin Top 100 assets. In June, breadth weakened to its worst level of 2026 so far,” the report read.
Follow us on X to get the latest news as it happens

The report noted that the average was affected by Velvet (VELVET), which surged 1,715% during the month, lifting the aggregate. The 25-point gap between the positive average and the negative 16.8% median showed how few tokens carried the upside.
Besides VELVET, other top gainers included LAB (LAB) at 116% and Audiera (BEAT) at 112%. June also reversed a stronger start to the quarter.
April saw 64% of top-100 assets gain, the best month of 2026. Meanwhile, May showed a more fragile structure, and the June breakdown confirmed the reversal.
Weakness Reached Major Crypto Narratives in June
The decline was not limited to the largest assets. Across all traded tokens with 24-hour volume of more than $1 million, every one of the eight tracked narratives posted a negative median return.
Layer 2 chains led the losses at -24.9%, followed by Decentralized Physical Infrastructure Networks (DePIN) at -24.8% and Layer 1 chains at -22.8%.
“All 8 tracked narratives posted negative median returns, with losers outnumbered gainers in nearly every category, confirming that the market remained defensive and narrow through Q2 without a broad recovery in breadth,” CryptoRank said.

The gainers-versus-losers split showed how narrow the market became. Decentralized Finance (DeFi) recorded 42 gainers against 117 losers, while Artificial Intelligence (AI) posted 21 gainers against 35 losers.
The pattern pointed to a defensive market. Bitcoin (BTC) dominance held near 56% at quarter-end as capital rotated away from weaker altcoins.
Whether June marks a base or another leg lower depends on breadth recovering in the second half.
Subscribe to our YouTube channel to watch leaders and journalists provide expert insights
The post Crypto’s Positive June Average Masked an 82% Decline Across Top Assets appeared first on BeInCrypto.


Russia’s central bank says the digital ruble is ready for a Sept. 1 rollout, keeping the country’s central bank digital currency plan on schedule.
Summary
- Russia’s Sept. 1 digital ruble rollout moves ahead despite EU sanctions targeting related financial infrastructure.
- Bank rules require major lenders and large retailers to support digital ruble payments in stages.
- U.S. lawmakers are moving toward a temporary CBDC ban while Russia expands state digital money.
Governor Elvira Nabiullina said “everyone is ready” for the launch, according to a July 2 report by RIA Novosti.
The digital ruble will circulate alongside cash and non-cash rubles, not replace them. The Bank of Russia has said people will be able to open digital wallets through banking apps connected to its platform. It has also said individuals will not pay fees on digital ruble transactions.
The rollout begins with banks and large merchants
The Bank of Russia’s timeline requires major banks to offer digital ruble services from Sept. 1, 2026. Large retailers with annual revenue above 120 million rubles must also accept digital ruble payments from that date.
The rules will expand in stages. Banks with universal licenses and retailers with annual revenue above 30 million rubles must join from Sept. 1, 2027. Other banks and smaller retailers will follow from Sept. 1, 2028, while very small merchants will remain exempt.
Sanctions pressure frames the rollout
The launch comes as the European Union has already moved against Russia-linked digital finance. In its 20th sanctions package, the EU Council banned transactions involving RUBx and all EU support for the development of the digital ruble. It linked the measures to Russia’s war against Ukraine and wider concerns over sanctions evasion.
In addition, the EU also proposed broader restrictions on foreign crypto services tied to Russian sanctions evasion. That plan followed growing scrutiny of ruble-linked crypto rails, including platforms and tokens that authorities say may support cross-border payments outside Western controls.
Russia has tested digital ruble use cases for more than a year. As previously reported, the Central Bank of Russia piloted digital ruble smart contracts in Tatarstan, including tests on conditional spending for public funds. The latest timeline shows that Moscow now wants to move the project from testing into broader payment use.
U.S. policy moves in the opposite direction
Russia’s CBDC push contrasts with U.S. policy, where lawmakers have moved toward a temporary ban on a Federal Reserve digital dollar. As crypto.news reported, the 21st Century ROAD to Housing Act would block the Fed from creating a CBDC or similar asset through 2030 if it becomes law.
The U.S. debate reflects concerns over privacy, state control, and the role of private stablecoins. The Russian approach is different. Moscow is building a state-run digital currency while also testing other digital asset rules for trade and financial access under sanctions.
A February report by Jack Jarmon for the Australian Institute of International Affairs said Russia could face limits if it relies on Bitcoin or other proof-of-work assets to bypass sanctions. The report pointed to old power infrastructure and limited access to foreign technology. Those limits may explain why the digital ruble remains central to Moscow’s state-led payment strategy.
The Sept. 1 launch will test whether Russia can drive adoption among banks, merchants, and users. Nabiullina said the central bank wants the digital ruble to be “in demand by people and businesses” and “convenient.”
For now, the rollout places Russia among the countries pushing CBDCs forward while sanctions and U.S. policy debates keep digital state money under close review.


eToro has led a $12.5 million strategic funding round in Extended, an onchain exchange for perpetual futures.
Summary
- eToro’s Extended investment links Zengo self-custody tools with onchain perpetual futures trading access for users.
- Jump Crypto joined the round as brokerages move deeper into decentralized derivatives and market infrastructure.
- Perp DEX growth is pulling trading platforms toward self-custody, tokenized assets, and onchain execution.
Extended announced the round in a July 2 post on X, saying eToro led the investment and Jump Crypto also joined the deal.
Meanwhile, the funding is tied to a partnership between Extended and Zengo, the self-custody wallet eToro acquired earlier this year. The companies plan to work on access to global financial markets through onchain infrastructure. eToro said the partnership will explore ways to connect traditional financial assets with decentralized trading venues.
Self-custody becomes part of the plan
Zengo gives eToro a direct route into self-custody products. The wallet uses multi-party computation technology, which removes the need for seed phrases while still giving users control over assets. It also supports swaps, staking, and access to decentralized applications.
eToro completed its Zengo acquisition on April 30 while reporting a sharp drop in crypto trading profit. The company said at the time that Zengo would support its plan to connect traditional financial products with onchain systems. The Extended deal now gives that plan a derivatives-focused path.
Extended builds onchain perps market
Extended was founded by former Revolut employees and opened trading to all users in late 2024. In its public launch announcement, the company said it planned to add unified margin with technical support from StarkWare.
The exchange is built on StarkWare’s StarkEx scaling engine. It focuses on perpetual futures, a type of derivative contract that has no expiry date. Extended says its model supports self-custody trading while aiming to keep execution fast enough for active traders. That structure places it between centralized crypto futures venues and fully decentralized trading platforms.
Perps growth draws larger firms
Perpetual futures remain one of the largest crypto trading markets. As crypto.news reported, CoinGecko’s 2026 Crypto Perpetuals Report found that perp DEX open interest share rose from 3.6% in early 2025 to 13.5% in 2026. The same report showed Binance and OKX still leading centralized perps trading, even as decentralized venues gained share.
That growth has drawn more attention from brokers and trading apps. Previously, crypto.news reported that Robinhood launchedperpetual futures tied to commodities, ETFs, and currencies for eligible European users. The rollout showed how crypto-style trading tools are moving into traditional markets.
Deal follows weaker crypto trading income
The investment comes after eToro reported lower crypto-related trading profit in the first quarter of 2026. As reported by crypto.news, crypto generated $13 million in profit during the quarter, or about 5% of eToro’s total net trading profit of $258 million. That was down from $46 million in the same period in 2025.
The Extended round shows that eToro is still building around digital assets despite weaker short-term crypto revenue. The company is using Zengo to strengthen its self-custody stack and Extended to enter onchain derivatives more directly.
Moreover, the move also places eToro closer to a market where trading apps, crypto exchanges, and decentralized platforms are competing for users who want faster access, direct asset control, and broader exposure to global markets.

Bitwise Says Bitcoin Strategy Will Matter Less After STRC Incident

Bayelsa State Government Appoints Committee to Manage Bayelsa United

Inside Taylor Swift and Travis Kelce’s ultimate love story as wedding preparations ramp up

No Jackpot Winner as $257 Million Prize Rolls Over to $269 Million Monday Draw

Renter of Home in Anne Heche Crash Denies Settlement With Son

Weekend Open Thread: Staud – Corporette.com

The lots made strong money at the farm sale today….what did Michael buy?

99.99% Pure Gold Bitcoin Mass Production Process #allprocessofworld

PayItMonthly Celebrates Financial Times Top 1000 Fastest Growing Companies in Europe ranking!
-
 Fashion7 days ago
Weekend Open Thread: Staud – Corporette.com
-

 Crypto World3 days ago
Strategy authorizes up to $1.25B in Bitcoin sales under new capital plan
-

 Business7 days ago
Asia stock markets slide as tech shares slump
-

 News Videos4 days ago
MAJOR BITCOIN & MARKET UPDATE!!!! (MUST WATCH ASAP!!!)
-

 Tech3 days ago
Anonymous researcher drops 0-day ‘exploitarium’ repo
-

 Crypto World6 days ago
Coinbase, Circle Deepen Crypto Stock Losses Despite Resilient S&P 500
-

 Business3 days ago
Australia treasurer says alleged access of prime minister’s bank data ’incredibly concerning’
-

 Crypto World6 days ago
Kraken's xStocks Opens Bending Spoons IPO Registration to EEA Retail
-

 Sports6 days ago
FIH Pro League: India defeat Pakistan 7-1, register biggest win of campaign | Other Sports News
-

 Tech5 days ago
Bluekit phishing kit adopts browser-in-the-middle for login theft
-

 Tech6 days ago
Russian hackers now target Signal backup recovery keys
-

 Crypto World7 days ago
Tether (USDT) Passes Ether in Market Cap as ETH Drops Toward $1.5K
-
Crypto World7 days ago
Hyperliquid Named on Singapore MAS Investor Alert Register
-

 Crypto World7 days ago
RTX holders must register wallets before token distribution begins
-

 Sports2 days ago
Broncos roster: OL Ben Powers (No. 74) entering final year of contract
-
 Business4 days ago
The AI boom won’t burst all at once. It will pop in ‘rolling bubbles’: Macquarie
-

 Tech5 days ago
Claude Code turned every engineer into three. Now companies need more product thinkers
-
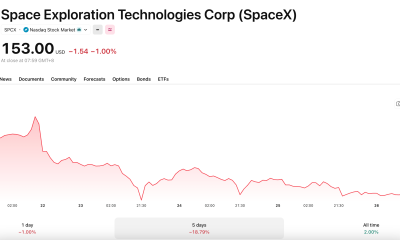
 Crypto World7 days ago
SpaceX Called a Market Top Signal Just 2 Weeks After Its $86 Billion IPO
-

 Tech6 days ago
Silicon Valley paid to kill AI regulation, now it wants the rules back
-

 NewsBeat2 days ago
Presenter Caroline Flack’s brother Paul Flack dies aged 55
You must be logged in to post a comment Login