

Crypto World
What is the ETH/BTC ratio? How to read Ethereum’s performance against Bitcoin


The ETH/BTC ratio prices Ethereum in Bitcoin instead of dollars, stripping out the market-wide move so you can see which of the two is actually winning. Here is what the ratio measures, how to read it, what drives it, and why it has fallen to multi-year lows.
Summary
- The ETH/BTC ratio is the price of one ether expressed in bitcoin, a single number that shows whether Ethereum is outperforming or underperforming Bitcoin regardless of what the dollar price of either is doing.
- A rising ratio means ether is gaining on bitcoin, often a sign of risk appetite and a healthier environment for altcoins; a falling ratio means bitcoin is winning, usually a sign of caution and bitcoin dominance.
- As of mid-2026, the ratio sits near multi-year lows around 0.026, reflecting Ethereum’s deep underperformance against Bitcoin, down sharply from levels near 0.08 in 2021 and 0.15 in 2017.
- The ratio is driven by the tug-of-war between Ethereum-specific forces (ETF flows, staking, layer-2 activity, supply dynamics, competition from other chains) and Bitcoin-specific forces (halving cycles, ETF and treasury demand).
- It is a relative-strength gauge and a regime signal, not a price target, and it can stay depressed or elevated for years, so it should inform context rather than dictate trades.
The ETH/BTC ratio is the price of one ether (ETH) measured in bitcoin (BTC) rather than in dollars, and it is one of the most useful single numbers in crypto for understanding which of the two largest assets is actually winning. When you look at Ethereum’s price in dollars, you are seeing two things mixed together: how Ethereum is doing, and how the entire crypto market is doing, because almost everything in crypto moves loosely with Bitcoin and with the broad risk environment.
The ETH/BTC ratio removes the second factor. By pricing Ethereum directly in Bitcoin, it cancels out the market-wide move that both assets share and isolates Ethereum’s performance relative to Bitcoin alone. If both assets rise 20% in dollars, the ratio does not move, because neither outperformed the other. If Ethereum rises while Bitcoin is flat, the ratio rises, and you learn something the dollar chart obscured: capital is favoring Ethereum over Bitcoin right now.
That makes the ratio a lens, not just a number, and learning to read it changes how you see the market. This guide explains what the ETH/BTC ratio is and how it is calculated, why traders watch it, how to interpret a rising or falling ratio, what the ratio has done historically and where it sits now, the forces on each side that push it up or down, a worked example you can follow step by step, and how to use it sensibly without overreading it.
The aim is to give you a durable mental model rather than a snapshot, because the specific level will change, but the way the ratio works will not. None of this is trading advice; the ratio is an analytical tool, and like any tool, it can mislead if used in isolation. Used well, though, it is one of the clearest windows into the single most important relationship in the asset class, the one between its two dominant coins.
What the ratio actually measures
Start with the mechanics, because they are simple and the simplicity is the point. The ETH/BTC ratio is calculated by dividing the price of ether by the price of bitcoin, using the same currency for both, so the units cancel and you are left with a pure ratio. If ether trades at $1,550 and bitcoin trades at $60,000, the ratio is 1,550 divided by 60,000, which is about 0.0258, usually written as 0.026. That number tells you that one ether is currently worth about 2.6% of one bitcoin. You can read it directly: at a ratio of 0.026, it takes roughly 38 ether to equal one bitcoin in value.
Most charting platforms quote the pair as ETHBTC or ETH/BTC, and many crypto exchanges let you trade the pair directly, buying ether with bitcoin or the reverse, which is part of why the ratio is so closely watched, it is a live, tradable market, not just a derived statistic.
What the ratio measures, conceptually, is relative strength. It answers a question the dollar price cannot: between the two largest assets in crypto, which is the market choosing right now? Because Bitcoin and Ethereum share most of the same macro drivers, interest rates, risk appetite, regulatory news, dollar liquidity, comparing them to each other holds those shared factors roughly constant and exposes the difference that is specific to each asset. A dollar chart of Ethereum during a broad sell-off shows Ethereum falling, but it cannot tell you whether Ethereum fell more or less than Bitcoin.
The ratio can. If Ethereum fell harder than Bitcoin, the ratio dropped even as both went down, revealing that within the decline, capital preferred the relative safety of Bitcoin. That is the core value of the metric: it separates Ethereum’s own story from the market’s story, and in doing so it often reveals the direction of capital rotation that the dollar price hides.
Why traders watch it
The ratio matters because it functions as a regime indicator for the broader market, not just for Ethereum. In crypto, there is a long-observed pattern in which capital rotates in a rough sequence: money flows into Bitcoin first during the early, cautious phase of a rally, then rotates into Ethereum as confidence grows, and then spreads out into smaller altcoins as risk appetite peaks.
Because Ethereum sits in the middle of that sequence, the largest and most established asset after Bitcoin, the ETH/BTC ratio often acts as a barometer for where the market is in that cycle. A rising ratio, with Ethereum gaining on Bitcoin, frequently signals that risk appetite is building and that the environment is turning favorable for altcoins broadly, since Ethereum tends to lead the alt market. A falling ratio, with Bitcoin winning, usually signals the opposite: caution, a flight toward the relative safety of Bitcoin, and a harder environment for smaller tokens.
This is why traders treat the ratio as a piece of market-structure information instead of just a fact about two coins. When the ratio is trending up, many interpret it as confirmation of an “altcoin season” or “ETH season,” a period when capital is willing to move out the risk curve and non-Bitcoin assets outperform. When it is trending down, the read is “Bitcoin season” or rising “Bitcoin dominance,” a period when Bitcoin absorbs the market’s attention and capital while alts bleed against it. Portfolio decisions follow from this framing: a trader who believes the ratio is turning up might tilt toward Ethereum and altcoins, while one who sees it falling might rotate toward Bitcoin or cash.
The ratio also serves as a sanity check on narratives. If commentators are loudly predicting an Ethereum breakout but the ETH/BTC ratio keeps falling, the market is voting against the narrative in the most direct way available, by pricing Ethereum lower against Bitcoin quarter after quarter. Watching the ratio keeps a trader honest about what is actually happening versus what is being talked about.
How to read a rising or falling ratio
Reading the ratio is mostly about direction and context instead of any single absolute level. A rising ETH/BTC ratio means ether is appreciating relative to bitcoin, whether because ether is rising faster than bitcoin, falling more slowly, or rising while bitcoin falls. In all of those cases the message is the same: on a relative basis, the market is favoring Ethereum.
Sustained increases in the ratio tend to coincide with periods of broad risk appetite, strong Ethereum-specific catalysts, and outperformance across the altcoin complex, since Ethereum often pulls the alts along with it. A falling ratio carries the opposite message: bitcoin is winning the relative contest, the market is leaning toward caution and Bitcoin dominance, and altcoins are generally struggling against bitcoin even if they are flat or rising in dollar terms.
The crucial discipline is to read the ratio in context instead of as a standalone buy or sell signal. The same ratio level can mean very different things depending on the trend and the backdrop. A ratio of 0.026 reached on the way down, after months of Ethereum underperformance, signals weakness and momentum against Ethereum. The same 0.026 reached on the way up, after a period of Ethereum gaining, would signal the opposite, recovering relative strength.
Direction and trend matter more than the absolute figure. It also helps to watch the ratio across multiple timeframes: a short-term bounce in the ratio within a long-term downtrend is a different and weaker signal than a multi-month trend change. And because the ratio is relative, it is silent about absolute price. The ratio can rise while both assets fall in dollars, if Ethereum falls less, which is relative outperformance during an absolute loss, useful to know but not the same as a gain. Reading the ratio well means always holding two questions at once: which asset is winning the relative contest, and what is the absolute market doing underneath that contest.
A worked example
Make it concrete with numbers you can follow. Suppose ether is trading at $1,550 and bitcoin at $60,000. Divide 1,550 by 60,000 and you get 0.0258, so the ETH/BTC ratio is about 0.026, and one ether is worth roughly 2.6% of one bitcoin, or equivalently it takes about 38 ether to equal one bitcoin. Now run three scenarios from that starting point to see how the ratio responds to relative moves.
In the first scenario, both assets rise 25% in dollars: ether to about $1,938 and bitcoin to $75,000. The ratio is 1,938 divided by 75,000, which is still about 0.0258. Despite a large dollar gain in both, the ratio did not move, because neither outperformed the other, exactly the information the dollar chart would have hidden.
In the second scenario, ether outperforms: ether doubles to $3,100 while bitcoin stays at $60,000. The ratio becomes 3,100 divided by 60,000, or about 0.052, a doubling of the ratio. This is the signature of Ethereum outperformance, and a trader watching only the ratio would see it climb from 0.026 to 0.052 and read a strong shift of capital toward Ethereum, the kind of move associated with an ETH-led alt rally. In the third scenario, the market falls but Ethereum falls harder: bitcoin drops to $48,000 (down 20%) while ether drops to $1,085 (down 30%).
The ratio is 1,085 divided by 48,000, or about 0.0226, a decline from 0.026. Here both assets lost money in dollars, but the ratio fell, telling you that within the sell-off, capital preferred bitcoin and Ethereum bore more of the damage. These three cases show the ratio’s whole purpose in miniature: it ignores the shared move and reports only the relative winner, which is the piece of information that dollar prices alone cannot give you.
Where the ratio has been, and where it is now
History gives the current level its meaning, and the history of ETH/BTC is a story of a long round trip. In Ethereum’s earlier years the ratio climbed dramatically as Ethereum established itself as the clear number-two asset and the home of smart contracts, decentralized finance, and much of crypto’s developer activity. It reached its highest levels around mid-2017, near 0.15, when one ether was worth about 15% of a bitcoin, a peak of Ethereum’s relative strength driven by the initial-coin-offering boom that ran on Ethereum.
The ratio then fell sharply, recovered into the 2021 cycle to peak around 0.08 as decentralized finance and non-fungible tokens drove enormous activity on Ethereum, and has since entered a prolonged decline. As of mid-2026, the ratio sits near multi-year lows around 0.026, with ether near $1,550 against bitcoin near $60,000, a level that reflects a sustained stretch of Ethereum underperforming Bitcoin.
The reasons for the long decline are worth understanding because they explain why the ratio is where it is instead of simply that it is low. Several forces have weighed on Ethereum’s relative strength. Bitcoin has captured an enormous wave of institutional demand through spot ETFs and corporate-treasury adoption, a clean, simple “digital gold” narrative that has pulled capital toward Bitcoin specifically. Ethereum, meanwhile, has faced intensifying competition from faster, cheaper chains, with much of the speculative and developer energy that once flowed to Ethereum moving to rivals, which has diluted the “Ethereum is the only smart-contract platform that matters” thesis that powered its earlier outperformance.
Ethereum’s own narrative has also been harder to summarize than Bitcoin’s, shifting across staking, scaling through layer-2 networks, and supply dynamics in ways that are powerful but complex, and complexity is a disadvantage in a market that rewards simple stories. The result is a ratio that has spent a long time grinding lower, which is the context any reader should hold when they see the current figure: it is not a momentary dip but the late stage of a multi-year trend, which is exactly why it is so closely watched for signs of a turn.
What drives the ratio up and down
To anticipate the ratio instead of just observe it, you have to understand the forces on each side, because the ratio is a tug-of-war between Ethereum-specific and Bitcoin-specific drivers. On the Ethereum side, the factors that tend to push the ratio up include strong inflows into Ethereum ETFs, which signal institutional demand specifically for ether; growth in staking, which locks up supply and can tighten the available float; rising activity on Ethereum and its layer-2 networks, which supports the case that the network is being used; and periods when Ethereum’s supply dynamics turn deflationary, reducing net issuance. Broadly, anything that strengthens Ethereum’s relative narrative or tightens its supply relative to Bitcoin tends to lift the ratio. When these forces are strong and Bitcoin lacks an equally strong catalyst, capital rotates toward Ethereum and the ratio climbs.
On the Bitcoin side, the factors that push the ratio down include the four-year halving cycle and its associated demand narratives, large institutional inflows into Bitcoin ETFs, corporate-treasury accumulation of Bitcoin, and any environment in which the market wants the relative safety and simplicity of Bitcoin over the complexity of Ethereum and altcoins. Risk-off conditions generally favor Bitcoin and pull the ratio down, because in a cautious market capital concentrates in the most established, most liquid, most narratively simple asset, which is Bitcoin.
The overall risk environment is the backdrop to both sides: in risk-on periods, capital is willing to move out the curve toward Ethereum and the ratio tends to rise, while in risk-off periods it retreats toward Bitcoin and the ratio tends to fall. This framework explains why the ratio has been weak: Bitcoin has enjoyed powerful, simple, institution-friendly catalysts in ETFs and treasuries, while Ethereum’s catalysts have been real but more diffuse, and much of the market has been in a cautious, Bitcoin-favoring posture. A durable turn in the ratio would require Ethereum-specific demand to outweigh Bitcoin’s, which is exactly what traders watch the ratio to detect.
How to use the ratio without overreading it
For all its usefulness, the ratio is easy to misuse, and using it well means respecting its limits. The most important discipline is to remember that the ratio is a relative-strength gauge, not a price target or a guaranteed mean-reverting signal. A common error is to look at a depressed ratio and assume it must bounce back toward old levels, treating the multi-year average as a magnet.
There is no rule that forces the ratio to revert. It can stay depressed for years if Ethereum continues to underperform, just as it can stay elevated during a strong Ethereum cycle, and betting on reversion simply because the ratio looks low has cost many traders dearly through long stretches of continued underperformance. The ratio describes the current balance of relative strength; it does not promise that the balance will swing back on any particular schedule.
The second discipline is to never trade the ratio in isolation. It is one input among many, most powerful when combined with an understanding of the absolute market environment, the specific catalysts on each side, and your own time horizon. The ratio tells you which asset is winning the relative contest, but it says nothing about whether the whole market is heading up or down in dollars, which is what actually determines whether you make or lose money in absolute terms.
A rising ratio in a collapsing market still means losses; a falling ratio in a soaring market can still mean gains. The ratio is best used to inform allocation tilts and to read market structure, for example to judge whether the environment favors Ethereum and alts or Bitcoin, instead of as a standalone entry or exit trigger. Treat it as a compass that shows direction of relative capital flow, not a clock that tells you when to act, and it becomes one of the more reliable instruments in a crypto analyst’s toolkit. Misread as a precise timing signal or a guaranteed reversion bet, it becomes a trap. The metric is honest; the overreading is the danger.
Frequently Asked Questions
What is a good ETH/BTC ratio?
There is no single “good” level, because the ratio is a relative measure whose meaning depends on trend and context instead of any fixed number. Historically the ratio has ranged from highs near 0.15 in 2017 and 0.08 in 2021 down to multi-year lows around 0.026 in 2026. A higher ratio reflects stronger Ethereum performance against Bitcoin, and a lower one reflects Bitcoin dominance, but neither is inherently “good” or “bad,” it depends on which asset you favor and where you are in the cycle. What matters more than the absolute level is the direction: a rising ratio signals Ethereum gaining, a falling ratio signals Bitcoin winning. Read the trend and the backdrop, not a target number.
How do you calculate the ETH/BTC ratio?
Divide the price of ether by the price of bitcoin, using the same currency for both so the units cancel. For example, if ether is $1,550 and bitcoin is $60,000, the ratio is 1,550 divided by 60,000, which equals about 0.0258, usually written as 0.026. That means one ether is worth roughly 2.6% of one bitcoin, or that it takes about 38 ether to equal one bitcoin. Most charting platforms display the pair directly as ETHBTC or ETH/BTC, so you rarely need to calculate it by hand, and many exchanges let you trade the pair directly, which is why it behaves as a live market instead of just a derived statistic.
What does a rising ETH/BTC ratio mean?
A rising ratio means ether is appreciating relative to bitcoin, whether because ether is rising faster, falling more slowly, or rising while bitcoin is flat or falling. The shared message is that the market is favoring Ethereum over Bitcoin on a relative basis. Sustained increases often coincide with broad risk appetite and outperformance across altcoins, since Ethereum tends to lead the alt market, which is why a rising ratio is frequently read as a signal of “ETH season” or a building altcoin rally. The key caveat is that a rising ratio describes relative strength only; it says nothing about whether the overall market is going up or down in dollar terms.
Why has the ETH/BTC ratio been falling?
The long decline reflects a tug-of-war that Bitcoin has been winning. Bitcoin has captured a powerful wave of institutional demand through spot ETFs and corporate treasuries, supported by a simple “digital gold” narrative. Ethereum has faced intensifying competition from faster, cheaper chains that drew away speculative and developer activity, while its own narrative, spanning staking, layer-2 scaling, and supply dynamics, has been harder to summarize than Bitcoin’s. A generally cautious, risk-off market has also favored Bitcoin’s relative safety. The combination pushed the ratio to multi-year lows near 0.026 by mid-2026. A durable turn would require Ethereum-specific demand to outweigh Bitcoin’s catalysts.
Can the ETH/BTC ratio predict altcoin season?
It is one of the more useful indicators for it, but not a precise predictor. Because Ethereum sits between Bitcoin and smaller altcoins in the typical rotation of capital, the ETH/BTC ratio often acts as a barometer: a rising ratio suggests capital is moving out the risk curve toward Ethereum and, by extension, toward altcoins, while a falling ratio suggests retreat toward Bitcoin. Many traders treat a sustained uptrend in the ratio as confirmation that an altcoin season is building. However, it is a relative-strength gauge, not a guarantee, and it should be combined with other signals and an understanding of the absolute market, instead of treated as a standalone forecast of when alts will run.
Should I trade based on the ETH/BTC ratio?
The ratio is best used as an analytical and allocation tool instead of a standalone trading trigger, and this is not trading advice. It is most valuable for understanding market structure, judging whether the environment favors Ethereum and altcoins or Bitcoin, and informing how you tilt a portfolio, instead of as a precise entry or exit signal. Two cautions matter most: do not assume a low ratio must revert to old highs, because it can stay depressed for years, and never read it in isolation, because it says nothing about whether the overall market is rising or falling in dollars. A rising ratio in a falling market still means losses. Use it as a compass for relative strength, combined with other analyses.
This article is educational information, not financial or investment advice. Price levels and ratio figures reflect approximate values as of June 2026 and change continuously. Cryptocurrency is volatile, and you can lose money. Do your own research and consult a qualified financial professional before making any investment decision.


SpaceX may put other mega-cap IPOs on the fast track.
According to Kathmere Capital Management’s chief investment officer, it could emerge as the ultimate blueprint for Silicon Valley — especially when it comes to the expected Anthropic and OpenAI public debuts.
“It would not surprise me at all to see a similar dynamic play out with some of these [IPOs] set to come in the months ahead,” Nick Ryder told CNBC’s “ETF Edge” this week.
Ryder, whose firm provides financial advice to individuals and businesses, contends market conditions will determine whether upcoming mega-cap IPOs will rip a page from SpaceX’s playbook.
“We’ve been in… a pretty historic two- [or] three-month rally for the equity market [which] was feeding into [SpaceX],” added Ryder. “When these other mega IPOs eventually come to market the environment might be different, and so it’s really hard to predict how it will be.”

SpaceX since public debut
SpaceX, which went public on June 12 with a historic $2 trillion-plus market cap, soared 53% above its $150 opening price in just three trading days. But the big gain didn’t last. As of Wednesday’s close, shares of the aerospace and satellite company are up nearly 17% since the debut.
Index inclusion
Also notable: SpaceX is one of the fastest stocks to get added to major indexes. It’s already in the Russell 1000. Now, it’s set to be added to the Nasdaq-100 on July 6 after the market close.
Arne Noack is the FTSE Russell head of equity & multi-asset indices for the Americas. He sees the indexes themselves, rather than SpaceX, as the true blueprint for upcoming IPOs.
“As index providers, [we] have put in place a blueprint that is clearly visible for anyone… meaning there is a fast-track eligibility. If you meet certain thresholds, you’re potentially eligible for index inclusion,” Noack said.

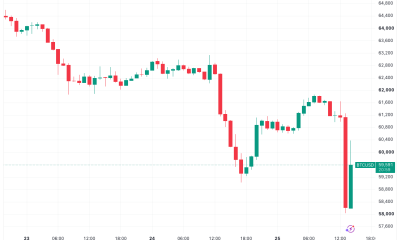
Bitcoin price is attempting a recovery, with it trading around $61,000 after bouncing from recent lows near $58,000 and breaking the bearish prediction. However, macro headwinds remain significant. Central banks continue signaling tighter policy, which has historically reduced liquidity available for risk assets, including Bitcoin.
Analyst targets remain sharply divided, highlighting the market’s uncertainty. Bernstein still projects Bitcoin could reach $150,000 in 2026, while Galaxy Digital’s Alex Thorn recently lowered his target to $120,000 from $185,000. That gap reflects very different expectations for growth, liquidity, and investor demand.
A strategist, Matt Weller, argues that the key issue is monetary policy. As central banks lean hawkish, money supply growth slows, reducing support for Bitcoin’s store-of-value narrative. Because institutional participation has grown, BTC now reacts more closely to interest-rate expectations than in earlier cycles.
Institutional buying and ETF flows still provide support, but they may not be enough on their own. Earlier macro-driven outflows already weakened momentum during this cycle. As a result, Bitcoin’s next major move will likely depend more on global liquidity conditions than on crypto-specific demand.
Discover: The Best Token Presales
Bitcoin Price Prediction: Reclaim $75,000 Before Rate Expectations Shift?
Bitcoin trades around $58,600 after losing momentum from earlier highs. The decline has turned $72,000 from a breakout target into a major resistance level. For now, bulls must first reclaim $70,000 before any sustained recovery can develop.
A bullish outcome depends on stronger liquidity, rising accumulation, and clearer expectations for interest rate cuts. If those factors align, Bitcoin could regain $70,000 and eventually challenge higher resistance. A move beyond $100,000 would require sustained buying pressure and improving market conditions.

Don’t Miss Out on Our $1,000 USDT Airdrop on ByBit
Meanwhile, the base case favors consolidation between $58,000 and $70,000 as investors wait for clearer signals from the Federal Reserve. ETF inflows and corporate purchases continue supporting demand, although they have not been strong enough to trigger a lasting breakout.
On the downside, prolonged tight monetary policy and weak liquidity could send Bitcoin back toward recent lows. That would reinforce the cautious outlook adopted by several market analysts. Likewise, ARK Invest’s lower 2030 bull-case target suggests even long-term optimists are adjusting expectations. Patience remains essential until macro conditions improve.
Discover: The Best Crypto to Diversify Your Portfolio
Bitcoin Hyper Positions for Early-Stage Upside While BTC Consolidates
BTC at the current level isn’t the entry point of the cycle; the window has closed. Spot upside toward $115,000–$150,000 exists, but from current levels, the risk/reward has compressed considerably compared to where institutional accumulation was building. That compression is exactly what pushes active traders to look earlier in the capital stack, because $100,000 BTC will only growth your $1,000 to less than $2,000.
Bitcoin Hyper ($HYPER) is a Bitcoin Layer 2 built on the Solana Virtual Machine, positioning it as the first BTC L2 to deliver SVM-powered smart contract execution, targeting performance that matches or exceeds Solana’s throughput while preserving Bitcoin’s security.
The project has raised close to $33 million at a current presale price of $0.01368, with staking live for presale participants. Core infrastructure includes a Decentralized Canonical Bridge for BTC transfers and low-latency execution designed to address Bitcoin’s programmability gap directly.
For us, watching BTC consolidate while central bank policy stays restrictive, early-stage infrastructure with a direct Bitcoin ecosystem thesis offers a different risk profile.
Research Bitcoin Hyper before the next stage price increase closes that entry gap.
Don’t Miss Out on Our $1,000 USDT Airdrop on ByBit
The post Bitcoin Price Prediction: Price Recovering as Central Banks Tighten Liquidity appeared first on Cryptonews.

TLDR
- Micron shares declined an additional 2.18% in Thursday’s premarket session to $1,009.76, after plummeting 10.6% Wednesday to settle at $1,032.28.
- Global contagion sent South Korea’s KOSPI benchmark tumbling 7.9%, with memory chip competitors SK Hynix and Samsung plunging 14.6% and 9.1% respectively.
- Year-to-date gains through Wednesday still show Micron ahead by 262%, trading approximately 128% above its 200-day moving average.
- Critical support zone identified near $991; falling through this level may trigger additional downside pressure.
- Wall Street maintains optimistic outlook with consensus price target of $1,542.05, while Cantor Fitzgerald and Barclays project $2,000.
Micron Technology (MU) shares experienced significant turbulence this week, collapsing 10.6% during Wednesday’s session to settle at $1,032.28, then extending losses with a 2.18% decline in Thursday’s premarket trading to approximately $1,009.76. This two-session retreat represents part of a wider semiconductor sector downturn that triggered volatility across domestic and international markets.
The selling pressure transcended American markets. South Korea’s KOSPI benchmark — which has been among 2026’s strongest-performing global indices — closed Thursday’s session down 7.9%. With heavy concentration in memory chip manufacturers, the index bore the brunt of sector-specific weakness. SK Hynix plummeted 14.6% while Samsung retreated 9.1%. These companies compete directly with Micron in DRAM and NAND memory segments.
Despite recent volatility, Micron‘s broader performance trajectory remains impressive. Through Wednesday’s close, shares have surged 262% year-to-date — performance that eclipses most Wall Street benchmarks. The KOSPI maintains an 81% gain for 2026 despite Thursday’s pullback. Meanwhile, the S&P 500 has advanced a modest 9.3% during the same period.
However, short-term technical indicators reveal emerging weakness. Micron currently trades approximately 4.1% beneath its 20-day simple moving average of $1,048.47, suggesting the immediate trend is undergoing consolidation following the stock’s June peak. The relative strength index registers at 51.95 — neutral territory — indicating the shares are pausing rather than experiencing fundamental breakdown.
Key Levels to Watch
Market participants are monitoring two critical price thresholds. Overhead resistance exists around $1,089.50, representing the level Micron must reclaim to reestablish bullish momentum. Conversely, downside support emerges near $991. Breaching this floor could trigger additional selling pressure.
For perspective, Micron continues trading roughly 19.5% above its 50-day moving average of $841.56 and approximately 128.4% above its 200-day moving average of $440.26. These metrics suggest the long-term uptrend remains fundamentally sound.
Micron maintains substantial ETF representation. The stock commands an 8.39% allocation in the Invesco S&P 500 Momentum ETF (SPMO), a 9.78% weighting in the Invesco PHLX Semiconductor ETF (SOXQ), and a 9.46% position in the Global X DAX Germany ETF (DAX). Such concentrated ETF exposure means institutional fund flows can magnify price movements in either direction.
Earnings and Analyst Targets
Micron’s upcoming quarterly earnings release is scheduled for September 22, 2026. Wall Street consensus anticipates earnings of $31.24 per share — a substantial increase from $3.03 reported in the prior-year period. Revenue projections stand at $50.72 billion, dramatically exceeding last year’s $11.31 billion. These forecasts illustrate extraordinary growth momentum.
The stock currently trades at a price-to-earnings multiple of 23.3, which analysts view as reasonable compared to semiconductor industry peers.
Analyst sentiment remains decidedly bullish. Consensus price target for MU sits at $1,542.05. Cantor Fitzgerald elevated its target to $2,000 on June 29, while Barclays established an identical target on June 25. Cantor’s previous target stood at $1,500.
Micron’s Benzinga Edge metrics support the optimistic thesis: momentum score of 99.62, quality score of 97.83, and growth score of 85.15. The lone weakness appears in valuation, scoring just 24.83 — reflecting concerns about how rapidly shares have appreciated.
As of Thursday’s premarket session, MU traded at $1,009.76, down 2.18%.


Ethereum layer-2 scaling network Taiko’s cross-chain bridge is back online, just 10 days after the June 22 hack.
The protocol halted operations after the attack, which stemmed from a compromised SGX signing key mistakenly exposed on GitHub. The flaw enabled an attacker to forge withdrawal proofs, draining roughly $1.7 million from the bridge and ERC20 Vault contracts.
Bridge exploits involving exposed keys remain a persistent challenge in crypto, with hundreds of millions lost industry-wide in 2026. However, Taiko’s quick recovery stands out, with every user made whole in less than two weeks.
“The bridge is open,” Taiko announced on X on Thursday. “You can move funds to and from Taiko again. Our response is complete: the network is fully restored and every user is whole. Any limits in place won’t affect normal use. A reminder: we’ll never DM you first, and there’s no claim site. Only trust this account,” it added, promising to publish a full post-mortem of the incident soon.
Taiko’s restoration of the bridge is the result of a multi-stage recovery that involved patching the vulnerability, replenishing bridge reserves to full 1:1 backing, restoring layer-2 network activity, and subjecting the fix to an independent security review.

Key Takeaways
- Shares of Nebius Group (NBIS) plummeted 17% during Wednesday’s session, hitting an intraday low of $228.17 with trading volume spiking 85% above typical levels
- A Bloomberg article revealing Meta’s plans to launch a cloud infrastructure service competing with neocloud companies sparked the massive sell-off
- The decline came despite impressive quarterly results showing $399 million in revenue — a 684% year-over-year increase — and an EPS beat of $0.54
- Analyst sentiment remains cautiously optimistic with a “Moderate Buy” rating across 15 analysts; Bank of America maintains a $280 price objective
- Company executives have offloaded more than $124 million in shares over the last three months, raising questions about confidence
Meta’s Cloud Ambitions Trigger Sharp Decline in Nebius Group (NBIS) Stock
Shares of Nebius Group (NBIS) experienced a dramatic 17% decline on Wednesday, touching a session low of $228.17 before settling near $229.18. The stock had closed at $276.17 the previous day. Trading activity exploded, with more than 30 million shares changing hands — approximately 85% higher than normal daily volume.
The catalyst for this sharp downturn was a Bloomberg article detailing Meta Platforms’ intention to commercialize AI computing resources and models — including direct GPU capacity sales. This business model places Meta in direct competition with neocloud specialists such as Nebius and CoreWeave.
CoreWeave similarly experienced a decline exceeding 6% following the same disclosure.
The market reaction extends beyond simple competitive concerns. Meta currently ranks among the world’s largest purchasers of GPU computing power. A strategic pivot toward selling excess capacity rather than solely consuming it could fundamentally reshape supply dynamics across the entire industry.
Neocloud companies including Nebius have benefited tremendously from surging AI infrastructure requirements. Wednesday’s market action demonstrated how rapidly investor confidence can evaporate when threatened by well-capitalized competitors.
Robust Growth Metrics Clash With Valuation Concerns
The stock decline contrasts sharply with Nebius’s operational performance. The company delivered $399 million in quarterly revenue — representing an extraordinary 684% year-over-year expansion. Management exceeded earnings projections by $0.54 per share, posting a loss of just $0.23 compared to the consensus estimate of a $0.77 loss.
The organization’s customer acquisition pipeline has reached unprecedented levels, and underlying demand for AI infrastructure capabilities continues accelerating. However, several Wall Street analysts had previously cautioned that the stock’s valuation appeared overextended following its remarkable pre-earnings rally.
NBIS currently trades above its 50-day moving average of $215.92 and significantly above its 200-day moving average of $142.48. Even after Wednesday’s correction, the stock maintains considerable premium to these technical benchmarks.
With a price-to-earnings multiple of 73.93 and a market capitalization approaching $58 billion, valuation remains elevated. The stock’s beta coefficient of 4.03 underscores its extreme volatility — a characteristic vividly illustrated by Wednesday’s price action.
Wall Street Perspectives and Executive Stock Sales
The analyst community maintains a generally favorable outlook despite divided opinions. Fifteen analysts currently cover the stock, with nine recommending Buy and six maintaining Hold ratings, resulting in a “Moderate Buy” consensus. The mean price target stands at $203.25.
Bank of America established a $280 price objective with a Buy recommendation in early June. BNP Paribas Exane initiated research coverage in June with a Neutral stance and $255 target. Morgan Stanley maintains an Equal Weight rating alongside a $144 price target.
Insider transaction patterns present a more cautious narrative. The Chief Technology Officer divested approximately $3.7 million in stock on June 4th, representing a 5.1% reduction in personal holdings. The Chief Revenue Officer sold roughly $3 million on June 2nd, trimming his stake by 28.6%.
Collectively, company insiders have liquidated more than $124 million in stock value during the past 90 days.
Nevertheless, institutional investors have demonstrated confidence by expanding positions. Orbis Allan Gray, Fred Alger Management, and Morgan Stanley have all increased their shareholdings in recent reporting periods.
Wall Street analysts project Nebius will report a full-year loss of $1.91 per share on average.

Key Highlights
-
CRCL shares advance following Standard Chartered’s institutional USDC launch.
-
Global bank introduces direct USDC creation and redemption services.
-
Development reinforces Circle’s position in regulated digital currency markets.
-
Initial deployment begins in DIFC with expansion plans underway.
-
Partnership expands Circle’s footprint among institutional investors.
Shares of Circle Internet Group (CRCL) climbed 3.81% to reach $64.38 during pre-market hours following Standard Chartered’s introduction of institutional-grade USDC services. This advance came after CRCL closed the prior session at $61.95, representing a 1.09% decline. The development establishes a connection between a leading international financial institution and Circle’s regulated digital dollar platform.
Pre-Market Rally Follows USDC Service Announcement
Circle Internet Group equity experienced upward momentum ahead of market open after Standard Chartered unveiled its USDC creation and redemption platform. This offering leverages Circle’s existing framework while focusing on corporate and institutional participants. The partnership enhances Circle’s standing within the regulated digital currency ecosystem.
This new functionality enables organizations to obtain USDC via Standard Chartered’s established client onboarding and servicing infrastructure. Consequently, institutional participants can bypass the need for direct Circle relationships. This arrangement introduces a banking intermediary between traditional currency systems and distributed ledger settlement mechanisms.
Circle produces USDC through licensed operating entities, maintaining its status as a leading dollar-backed digital currency. Applications include cross-border transactions, financial settlement, corporate treasury operations, and capital management. Banking collaborations of this nature can accelerate mainstream institutional adoption.
Major Bank Pioneers Institutional Stablecoin Infrastructure
Standard Chartered achieved a milestone as the inaugural licensed Global Systemically Important Bank offering this type of USDC service architecture. Operations will commence through the bank’s Dubai International Financial Centre presence. This deployment reinforces the United Arab Emirates’ commitment to regulated cryptocurrency infrastructure.
The platform integrates traditional banking capabilities with custody solutions, digital asset technology, and public blockchain networks. Organizations gain unified access for moving between fiat currency and stablecoins. This arrangement enables businesses to coordinate blockchain-based settlement and treasury functions with enhanced oversight.
Standard Chartered intends to broaden this service across additional jurisdictions following regulatory clearance and operational preparation. Bank executives positioned this deployment as an initial step within a comprehensive stablecoin strategy. Such moves reflect increasing appetite for compliant digital asset infrastructure.
Institutional Appetite Drives CRCL Momentum
Circle stands to gain from growing corporate and institutional interest in stablecoins and blockchain settlement systems. USDC availability through an established international bank may unlock additional enterprise applications. This integration embeds Circle more firmly within conventional financial architecture.
The announcement arrives as financial institutions and corporations evaluate stablecoins for payment processing and treasury optimization. Organizations seek operational efficiency and transaction transparency while maintaining regulatory compliance and risk management protocols. Standard Chartered’s approach satisfies these requirements through its supervised banking structure.
CRCL’s pre-market appreciation underscored this enhanced institutional positioning. Shares recovered from the previous session’s weakness and early trading pressure. Nevertheless, the fundamental narrative centers on Circle’s deepening integration with regulated banking infrastructure.
Crypto World
Metaplanet (3350) buys another $170 million of bitcoin expanding treasury to 43,000 BTC


Metaplanet (3350) announced the purchase of an additional 2,823 BTC ($170.7 million), bringing its total treasury to 43,000 BTC ($2.6 billion).
The acquisition cements the Tokyo listed firm as the third largest publicly traded company holding bitcoin, trailing only Strategy MSTR) and Twenty One Capital (XXI), according to data tracked by Bitcoin Treasuries.
Metaplanet closed 3.5% higher at 207 yen ($1.28) on Thursday following the announcement.
Alongside the bitcoin purchase, the company released its second quarter FY2026 results for its Bitcoin Income Generation business. The division generated approximately 1.75 billion yen ($10.85 million) in operating revenue during the quarter, taking first half revenue to approximately 4.72 billion yen.
Metaplanet uses bitcoin options to generate recurring income while expanding the company’s bitcoin holdings. On a trailing 12-month basis, revenue reached approximately 11.4 billion yen.
The latest results reinforce Metaplanet’s dual strategy of aggressively accumulating bitcoin while generating recurring cash flow from its Bitcoin Income Generation business.
XRP has rebounded toward the stubborn $1.07 resistance after Ripple’s latest XRP Ledger lending plans and rising network activity revived buying interest, but another breakout attempt now faces a level that repeatedly rejected bulls throughout June.
Summary
- XRP has rallied back to the stubborn $1.07 resistance after Ripple’s lending roadmap and stronger on-chain activity revived buying interest.
- Technical indicators show improving short-term momentum, but major moving averages and a descending trendline continue to cap the uptrend.
- A breakout above $1.07-$1.09 could trigger a short squeeze toward $1.15, while rejection risks another test of the $1.03-$1.00 support zone.
According to data from crypto.news, XRP (XRP) climbed nearly 5% from around $1.03 to an intraday high near $1.08 on July 2 before stalling at the same resistance level that repeatedly rejected buyers throughout late June.
The recovery followed Ripple’s announcement of an institutional-focused XRPL Lending Protocol alongside its monthly escrow release, where 300 million XRP entered circulation while 700 million tokens remained locked. Because only a fraction of Ripple’s holdings reached the market, dilution concerns eased, and buyers stepped back in.
On-chain activity strengthened alongside the price recovery. Daily active addresses on the XRP Ledger jumped more than 72%, while new wallet creation reached its highest level in roughly three months as investors accumulated after XRP’s June decline.
Exchange balances also continued falling as coins moved into self-custody, reducing immediately available supply during the latest rally.
Historical seasonality has also added support. July has consistently ranked among XRP’s strongest months over recent years, encouraging systematic traders to rebuild long exposure after the second quarter ended. The move also came as Bitcoin stabilized above $60,000, allowing capital to rotate back into several large-cap altcoins.
XRP remains trapped below long-term resistance despite improving momentum
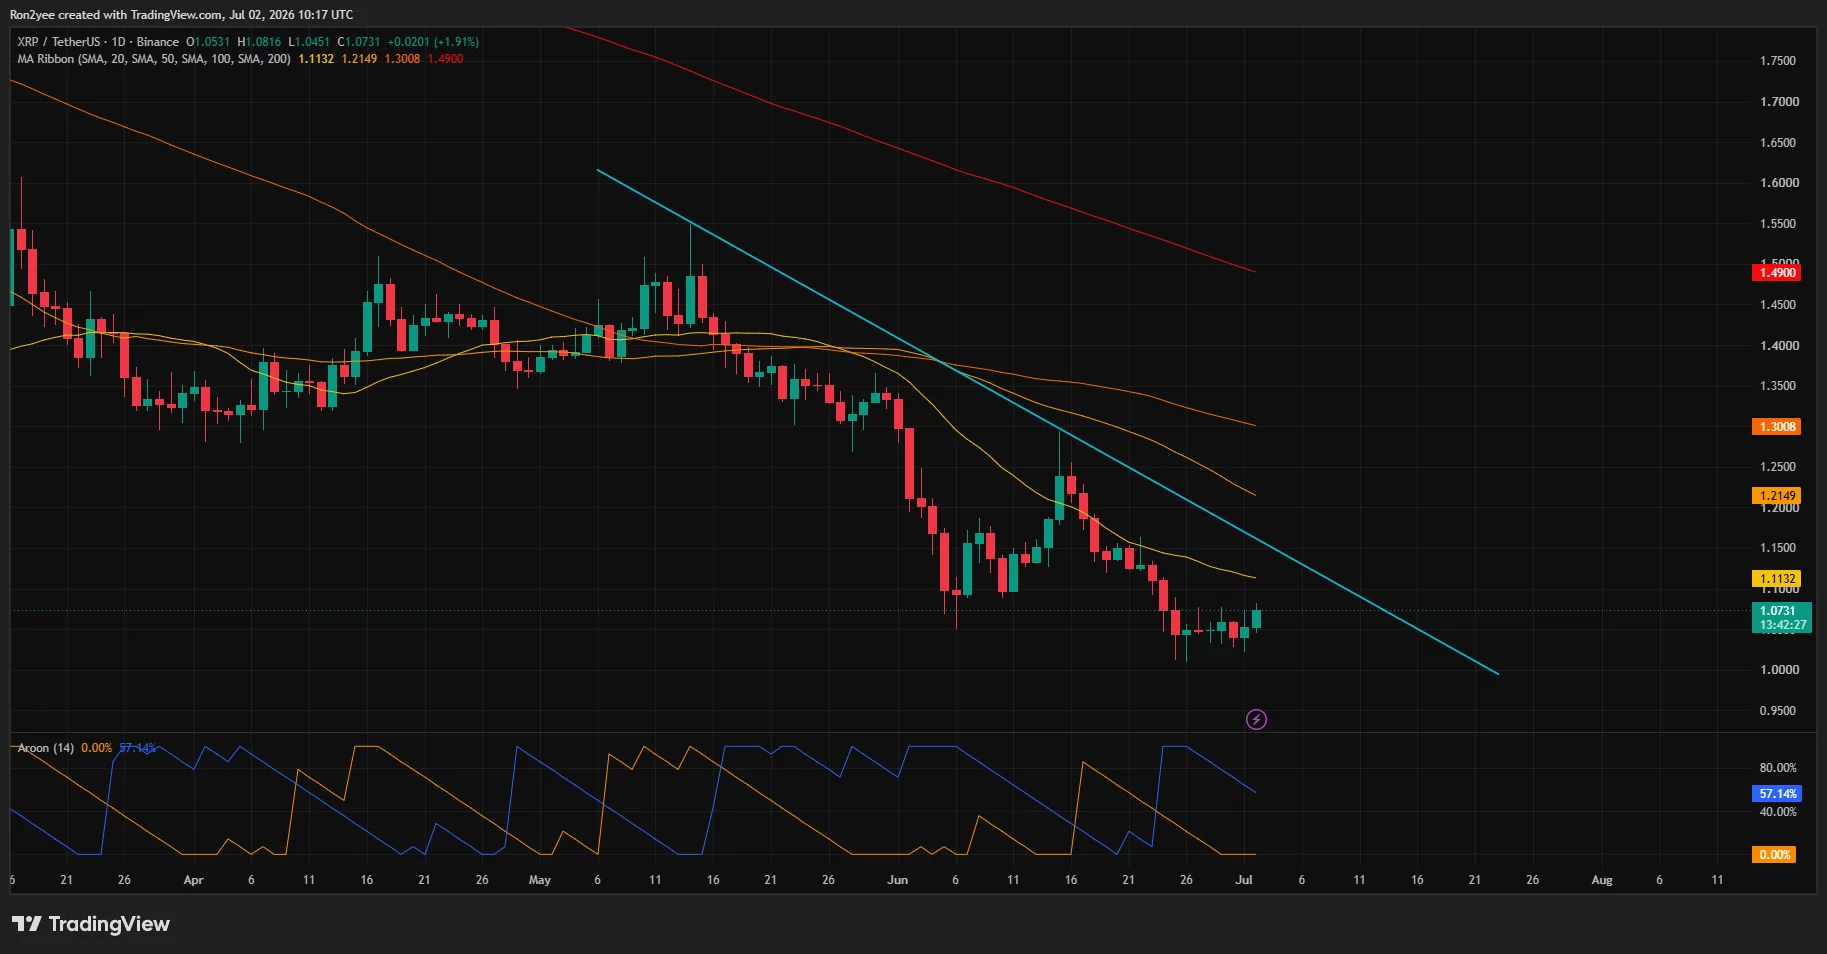
The 1-day chart shows XRP still trading beneath every major moving average despite the latest bounce. The 20-day moving average sits near $1.11, followed by the 50-day around $1.21, the 100-day near $1.30, and the 200-day close to $1.49. A descending trendline connecting lower highs since May continues to cap every recovery attempt, leaving the primary trend bearish until those barriers are reclaimed.

On the 4-hour chart, however, buyers have regained short-term momentum. XRP has pushed back above recent consolidation lows and is once again testing the $1.075-$1.08 resistance zone that rejected advances several times during June.
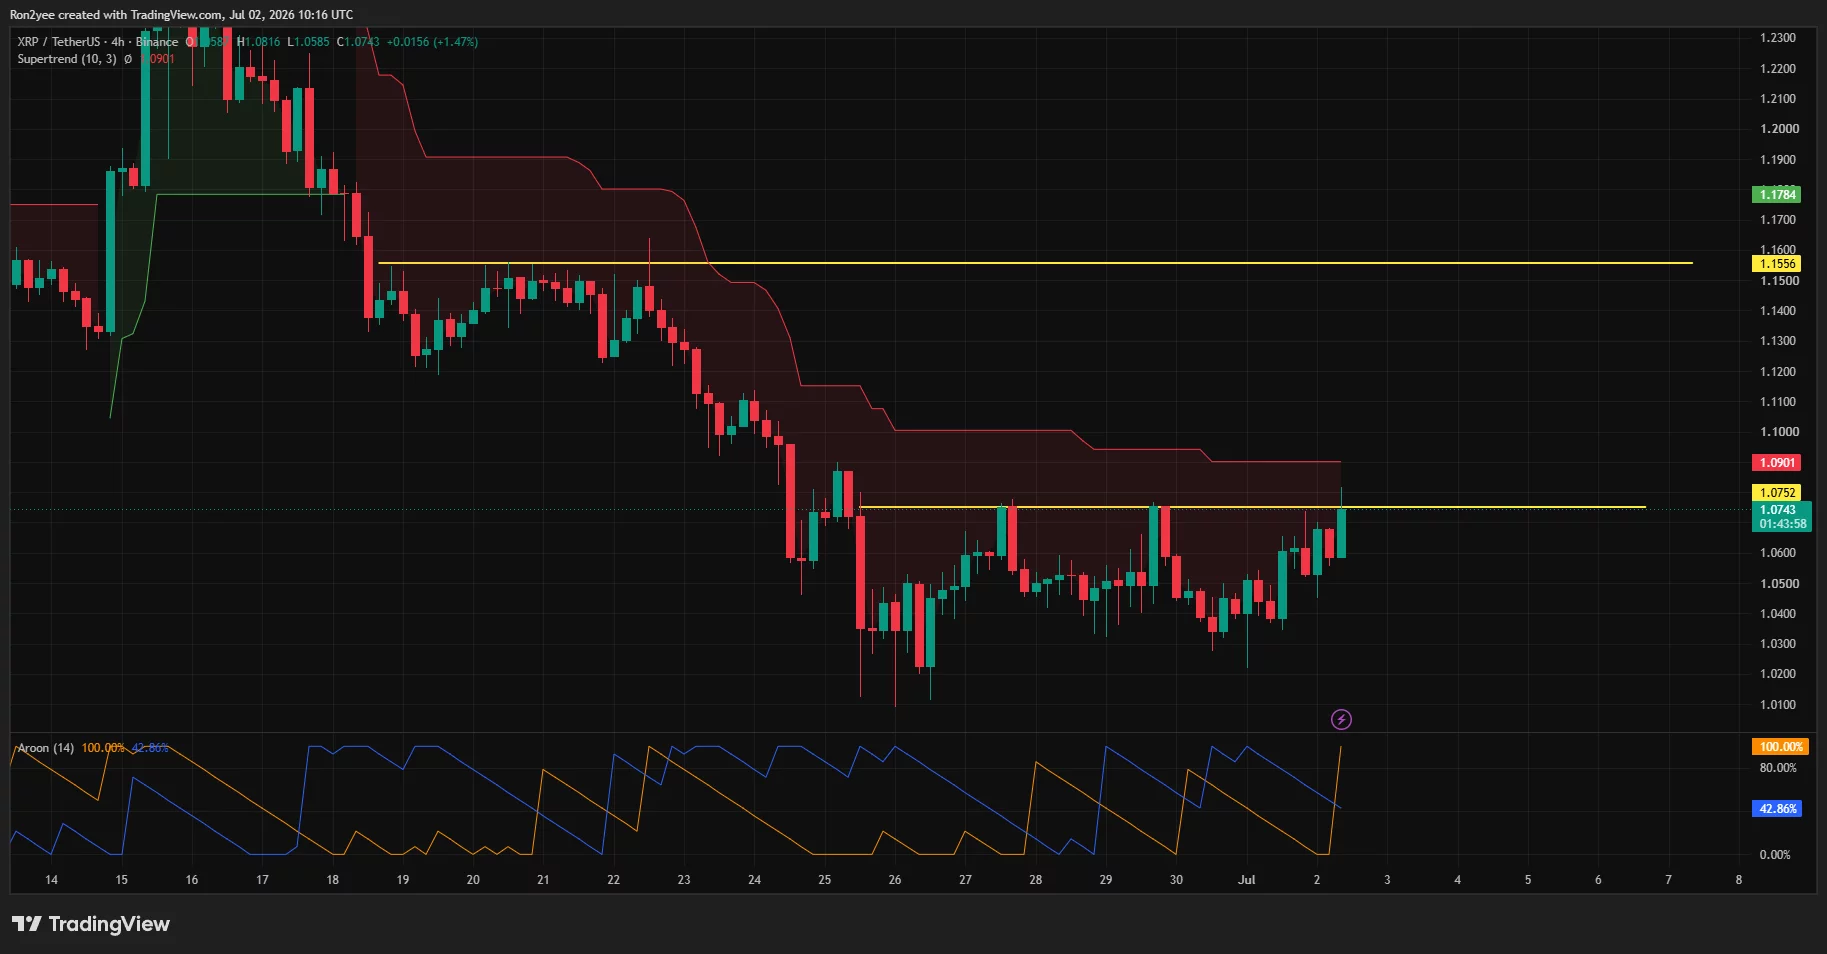
The Supertrend indicator still remains bearish near $1.09, making that level the first confirmation hurdle before bulls can target the next resistance around $1.15. A successful break there could expose the declining 20-day average near $1.11 first before opening room toward $1.21.
Meanwhile, the Aroon indicator presents a mixed picture across timeframes. The daily chart still favors sellers, while the four-hour reading has shifted decisively toward buyers after Aroon Up surged to 100%, suggesting short-term momentum has strengthened even though the larger trend has yet to reverse.
Derivatives positioning also supports the importance of the current price zone. CoinGlass liquidation data shows one of the largest short liquidation clusters sitting between $1.08 and $1.10.
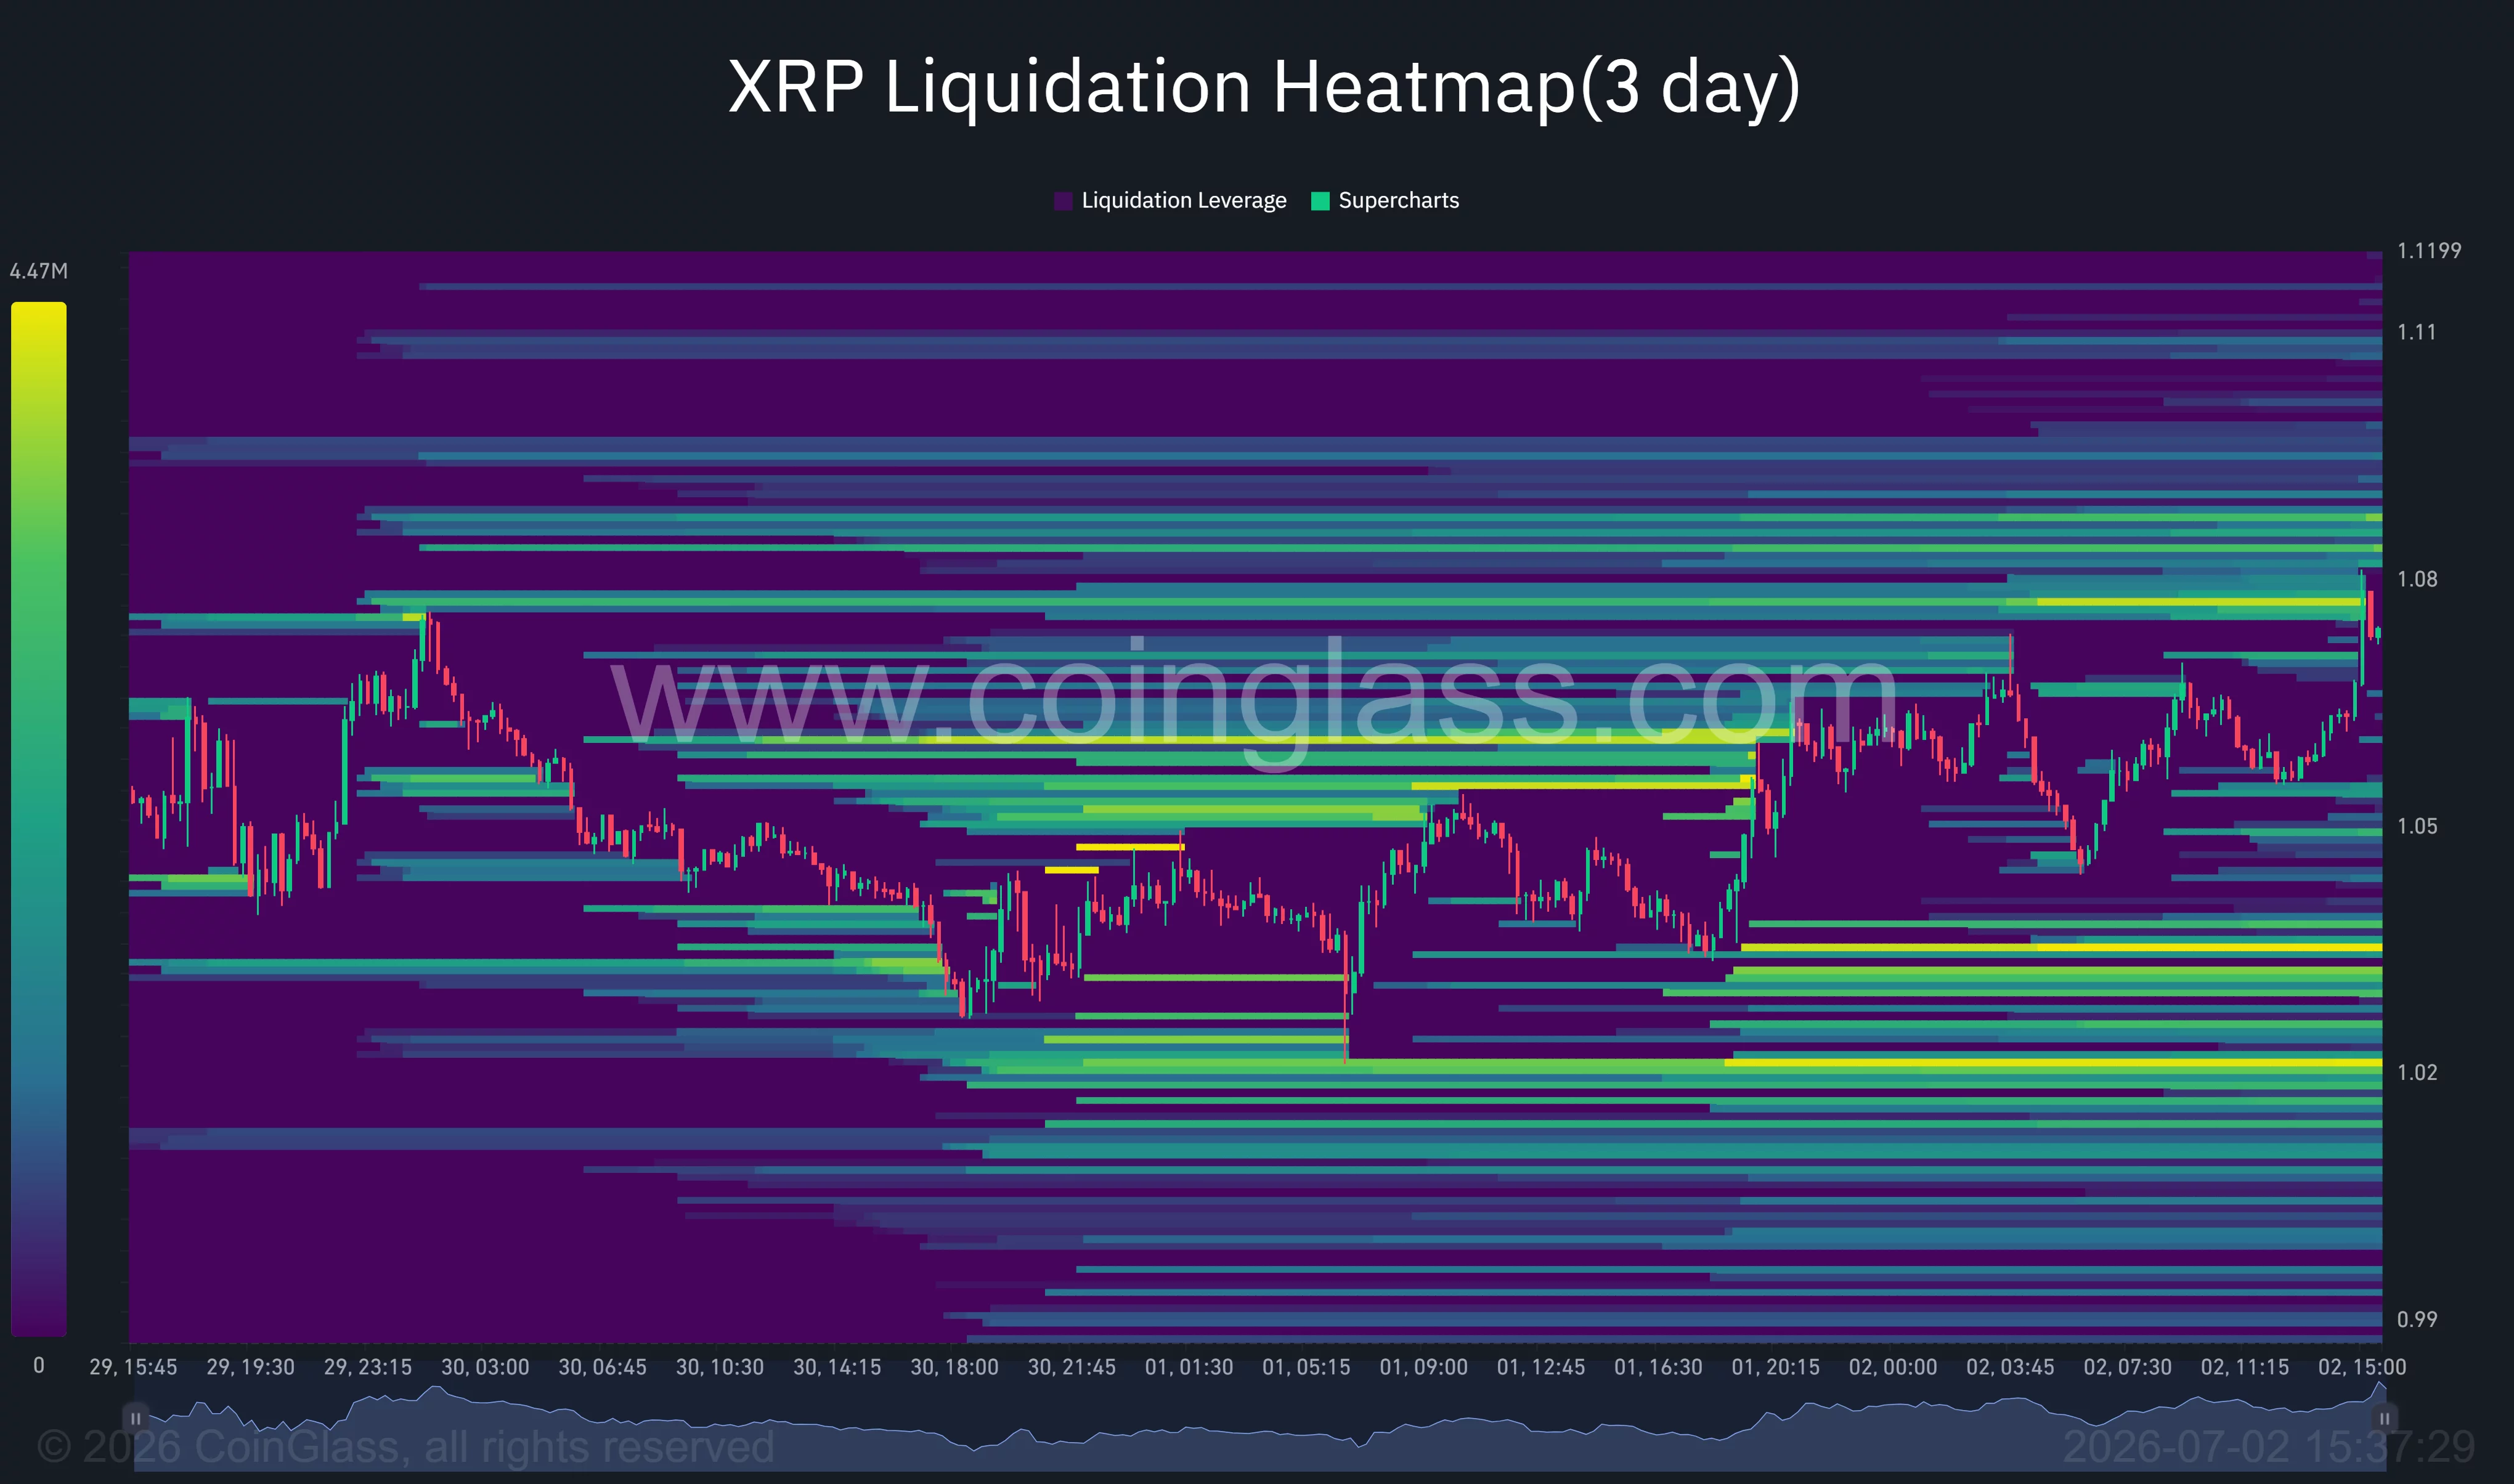
A decisive move through that range could trigger forced buying from leveraged short positions and accelerate a squeeze toward $1.11 and potentially $1.15. On the downside, sizeable long liquidation pools remain concentrated around $1.03 and $1.02, making those levels important support if the breakout attempt fails.
Commenting on the current structure, analyst ChartNerd wrote in a July 2 X post:
“Relief is possible from this $1.00 low but the overall trend remains down for now.”
The analyst also noted that XRP has historically remained under pressure after losing its 20-week exponential moving average and argued that reclaiming roughly $1.35 would be needed to restore a higher-timeframe bullish trend.
Failure at $1.07 would keep sellers in control
Several risks continue to challenge the recovery despite improving sentiment. XRP remains roughly 70% below its July 2025 peak near $3.66 after months of restrictive monetary policy, weaker crypto market liquidity, and delayed regulatory progress in the U.S.
The postponement of the U.S. CLARITY Act removed one of the largest anticipated policy catalysts, while elevated Treasury yields have continued limiting capital flows into higher-risk assets.
Technically, another rejection near $1.07-$1.09 would reinforce the descending trendline that has controlled price action for nearly two months. A drop below $1.03 would expose the psychological $1.00 support once again, and losing that level could send XRP toward the next demand zone around $0.98.
Conversely, a clean close above the Supertrend and repeated June highs would invalidate the immediate bearish structure and give buyers their strongest opportunity in weeks to extend the recovery toward $1.15 and then the cluster of moving averages above $1.20.
Disclosure: This article does not represent investment advice. The content and materials featured on this page are for educational purposes only.

Ethereum has a “wall of worry” where negative sentiment is meeting staking absorption, reported CryptoQuant on Tuesday.
The Coinbase Premium, a measure of institutional interest, is 230% below its three-month average, while Binance funding rates are deeply negative, signaling caution from US institutions and leveraged traders, it added.
Despite this wall of negativity, ETH’s price has stayed stable over the past week rather than breaking down.
ETH Staking Hits Record 40M
Meanwhile, the Ether supply is tightening as stablecoin balances on Binance are draining while staking inflows have surged 65%, “suggesting long-term holders are locking up supply even as short-term traders de-risk,” it stated.
“While traders are shorting or de-risking on Binance, long-term holders are actively locking supply into the staking contract.”
This combination of deep pessimism and a shrinking liquid/exchange supply is a classic pattern, which historically creates fragile conditions for short traders if selling pressure exhausts.
The analysts concluded that monitoring the reversal of the Coinbase Premium will be the primary signal for a shift in this regime.
Ethereum’s Wall of Worry: Negative Sentiment Meets Staking Absorption
“Historically, when speculative sentiment is this depressed while organic supply is being absorbed by staking, it creates a fragile environment for short-sellers.” – By @CryptoOnchain pic.twitter.com/C8XO4Omlmp
— CryptoQuant.com (@cryptoquant_com) June 30, 2026
The staking figures speak for themselves, with a record amount of ETH off the table and locked up.
ETH staking has hit an all-time high of 40 million, which equates to 33% of the entire supply, according to Ultrasound.Money.
Additionally, the validator exit queue is just 9,248 ETH, while more than 2.9 million ETH are in the entry queue.
Bitmine chair Tom Lee said that crypto is a hyper-volatile asset, and some macro headwinds are weighing on ETH, such as markets seeing a Fed hike, Clarity Act purgatory, AI FOMO, and private credit hurting flows.
However, there are also some tailwinds, including the tokenization megatrend, crypto downstream of AI, money becoming digital/software, and peak pain, he said in a recent interview.
ETH Price Outlook
Despite these tailwinds, ETH prices remain depressed, with the asset dipping to an intraday low of $1,550 on Tuesday.
There was little momentum during Wednesday morning Asian trading, with ETH lifting to $1,585. The longer it stays at current levels, the greater the chances of another leg down, especially if Bitcoin loses support at $58,000.
The post Staking Surge Tightens Supply, But Negative Sentiment Still Dominates Ethereum appeared first on CryptoPotato.
Crypto World
Standard Chartered Launches USDC Minting and Redemption Service for Institutional Clients
TL;DR
- Standard Chartered has become the first G-SIB to offer institutional clients direct USDC minting and redemption services.
- The new solution allows eligible clients to access USDC without opening a separate account with Circle.
- Initially launching through the bank’s DIFC operations, the service supports settlement, treasury, and liquidity management.
- The partnership underscores growing institutional demand for regulated stablecoin infrastructure despite rising competition in the sector.
Standard Chartered, currently at the fore front of the stablecoin adoption campaign, has introduced a new service that enables institutional clients to mint and redeem USDC directly through the bank, marking a significant step in the integration of traditional banking with digital assets.
Developed in partnership with Circle Internet Group, the issuer of USDC, the offering makes Standard Chartered the first Global Systemically Important Bank (G-SIB) to provide institutional access to USDC minting and redemption through a single banking relationship.
Unlike existing arrangements, eligible clients will not need to open separate accounts with Circle. Instead, they can access USDC minting and redemption through Standard Chartered’s institutional platform, allowing them to move between fiat currencies and blockchain-based assets within a unified banking environment.
The service will initially be available through the bank’s Dubai International Financial Centre (DIFC) operations, with plans to expand into additional markets as regulatory approvals are secured.
New Service Aims to Bridge Traditional Banking and Digital Assets
Standard Chartered said the new capability is designed to simplify how institutions interact with regulated stablecoins by combining banking services, custody, and digital asset infrastructure into a single offering.
The bank expects the solution to support a wide range of institutional activities, including on-chain settlement, treasury operations, and liquidity management, while also laying the foundation for future payment-related use cases. By embedding USDC access into its existing institutional banking platform, Standard Chartered aims to provide clients with the governance, compliance, and risk management standards associated with a global financial institution.
The launch also reflects growing demand among corporations and financial institutions for regulated stablecoin infrastructure capable of supporting cross-border transactions and digital asset operations. Starting in the UAE further reinforces the country’s position as an emerging hub for regulated blockchain and digital asset innovation.
Partnership Highlights Stablecoin Adoption Despite Growing Competition
The partnership, just barely a month after another one with CoinMENA, represents another milestone for Circle as it continues expanding the reach of USDC through established financial institutions. Bringing a global systemically important bank into its ecosystem could strengthen USDC’s position among institutional users seeking regulated access to stablecoins.
The announcement also comes just hours after renewed attention on Circle’s competitive position in the stablecoin market. As earlier reported, Circle’s shares recovered modestly after a sharp selloff triggered by the launch of the OpenUSD consortium, an initiative backed by more than 140 organizations, including major financial and technology companies such as Stripe, Coinbase, Visa, Mastercard, and BlackRock.
While some analysts have warned that increasing competition could pressure USDC’s market position over time, Standard Chartered’s decision to integrate USDC into its institutional banking services signals that demand for regulated stablecoin infrastructure continues to grow.

Rochdale grooming gang leader released from prison

USMCA: Why the expected fight over the North American trade deal never kicked off

SpaceX as ultimate blueprint for new wave of mega-cap IPOs


-

 Fashion6 days ago
Weekend Open Thread: Staud – Corporette.com
-

 Politics6 days ago
The House | Manchesterism won’t survive the painful trade-offs unless it gets citizens on board
-

 Crypto World2 days ago
Strategy authorizes up to $1.25B in Bitcoin sales under new capital plan
-

 Politics6 days ago
Potential 2028er World Cup attendee leaderboard
-

 Business6 days ago
Asia stock markets slide as tech shares slump
-

 News Videos4 days ago
MAJOR BITCOIN & MARKET UPDATE!!!! (MUST WATCH ASAP!!!)
-

 Tech7 days ago
A Look At A Gaggle Of Transputer Boards
-
 Crypto World7 days ago
Dell (DELL) Shares Tumble Over 5% Following Analyst Downgrade to Hold
-

 Crypto World5 days ago
Coinbase, Circle Deepen Crypto Stock Losses Despite Resilient S&P 500
-

 Business2 days ago
Australia treasurer says alleged access of prime minister’s bank data ’incredibly concerning’
-

 Crypto World5 days ago
Kraken's xStocks Opens Bending Spoons IPO Registration to EEA Retail
-

 Sports6 days ago
FIH Pro League: India defeat Pakistan 7-1, register biggest win of campaign | Other Sports News
-
 Crypto World6 days ago
Bitcoin Sparks $600M Hourly Liquidations With $65,000 Set To Become Resistance
-

 Tech2 days ago
Anonymous researcher drops 0-day ‘exploitarium’ repo
-

 Tech4 days ago
Bluekit phishing kit adopts browser-in-the-middle for login theft
-

 Tech5 days ago
Russian hackers now target Signal backup recovery keys
-
Crypto World6 days ago
Hyperliquid Named on Singapore MAS Investor Alert Register
-

 Crypto World6 days ago
RTX holders must register wallets before token distribution begins
-

 Sports23 hours ago
Broncos roster: OL Ben Powers (No. 74) entering final year of contract
-
 Business3 days ago
The AI boom won’t burst all at once. It will pop in ‘rolling bubbles’: Macquarie
You must be logged in to post a comment Login