
Crypto World
What It Means for Ether Price

Ether traded back above the $2,000 level on Friday, extending gains after the US consumer price index print came in cooler than expected. The relief rally adds to a nascent recovery narrative that could open the door to a test of higher targets if momentum sustains. Market participants are parsing a mix of on-chain signals, leverage data, and institutional demand as they gauge whether this move can translate into a durable bottom or simply a short-lived bounce. With weekly closes in focus, traders are watching for follow-through in the days ahead, while crypto derivatives data continues to feed the debate over whether risk appetite is finally pivoting in Ethereum’s favor.
Key takeaways
- Ether futures’ open interest across major exchanges has fallen by about 80 million ETH in the past 30 days, signaling a broad reduction in leveraged exposure rather than new long bets.
- Binance, the largest venue by volume, led the decline with roughly 40 million ETH pulled from futures positions (about half of the total drop), underscoring a widespread de-risking trend across top platforms.
- Across Gate, Bybit and OKX, combined declines pushed the total among the four major platforms toward a cumulative drop of roughly 75 million ETH, suggesting the trend is not isolated to a single exchange.
- Funding rates on Binance slipped into deep negative territory (around -0.006), the lowest seen in about three years, implying extreme bearish positioning that could set the stage for a short squeeze if buyers re-emerge.
- Technically, Ether has carved out a bullish setup, breaking from a falling wedge and hovering near $2,050; a measured move could target around $2,150, with potential tests of the 100-period SMA near $2,260 and a path toward $2,500 if demand accelerates.
- On-chain activity and rising institutional demand have persisted as tailwinds, with cost-basis accumulation identified around the $1,880–$1,900 zone helping form a potential price base for further upside.
Tickers mentioned: $ETH
Sentiment: Bullish
Price impact: Positive. The cooler CPI print contributed to a rebound from the $2,000 area and increased odds of an extended bounce toward higher targets.
Trading idea (Not Financial Advice): Hold. The setup points to potential upside on continued demand signals, but traders should remain mindful of macro surprises and the possibility of renewed volatility if liquidity conditions shift.
Market context: The latest inflation data appears to have nudged investors back toward risk assets, helping to ease some of the near-term macro headwinds that had weighed on crypto markets. Although liquidity remains uneven across venues, the combination of weaker-than-expected inflation readings and supportive on-chain dynamics has contributed to a more constructive backdrop for Ethereum in the near term.
Why it matters
From a market perspective, Ethereum’s price action this week matters not only for holders but for the broader crypto ecosystem. The confluence of falling open interest and negative funding rates suggests many participants were trimming risk rather than chasing new bets, which can reduce the likelihood of rapid, force-driven liquidations in a downside scenario. In such environments, a cleaner backdrop often arises where a new rally can take hold more easily if buyers step in decisively, creating a more stable price base. The sustained improvement in network activity and inflows from institutional actors adds another layer of fundamental support that could help underpin a more durable recovery beyond short-term speculative moves.
On the on-chain front, the observed accumulation at sub-$2,000 levels signals a cadre of investors is building a longer-term stance, a factor that matters because the health of Ether’s network—usage, validator activity, and transaction throughput—has historically fed into price resilience. This dynamic aligns with discussions in the space about Ether’s role not just as a trading instrument but as a network with ongoing growth potential, particularly if demand from institutions and developers continues to accrete.
For market participants, the critical question is whether the $2,000 threshold can function as a genuine floor in the current cycle. If price can hold that level and push higher, momentum could attract fresh buyers and sequentially lift Ether toward the $2,150–$2,260 range in the near term, with a longer arc toward the $2,500 zone if fundamental and technical signals align. Conversely, a break below that level could accelerate downside risk, especially if systemic liquidity tightens or macro headlines shift sentiment once again. In either case, the latest data suggest that the market is closer to a base-building phase than a continuation of the prior downtrend.
What to watch next
- Monitor whether ETH holds the $2,000 support on continued trading sessions and whether buyers emerge at the next test of resistance around $2,150.
- Track open interest and funding rates across major exchanges for signs of capitulation ending or renewed leverage entering the market.
- Watch for a potential challenge to the 100-period simple moving average near $2,260 and any subsequent move toward $2,500 if momentum remains constructive.
- Observe on-chain signals, including ongoing accumulation patterns and institutional flow indicators, for signs of sustained demand beyond short-term price action.
Sources & verification
- CryptoQuant Quicktake: Ethereum open interest across major exchanges declines by over 80 million ETH in 30 days.
- CryptoQuant analysis on funding rates hitting -0.006, the lowest level since December 2022, signaling extreme bearish positioning.
- Glassnode heatmap data showing a cost-basis distribution with substantial support between $1,880 and $1,900 and roughly 1.3 million ETH accumulated there.
- On-chain signals and institutional inflows discussed in related coverage, including notes on network activity tailwinds for Ether.
Ether price action and outlook
Ether broke out of a descending wedge on the four-hour chart and traded around $2,050 at the time of observation. The measured move from the breakout points toward $2,150 highlights a near-term upside trajectory, with the potential to test higher resistance if the rally gains traction. The same chart framework points to possible retests of the 100-period simple moving average near $2,260, followed by a pathway toward the $2,500 horizon should momentum accelerate beyond the immediate levels.
On the downside, a firm hold above the psychological $2,000 level remains a critical anchor, reinforced by the 50-period moving average that has acted as interim support in recent sessions. The cost-basis distribution heatmap from Glassnode emphasizes a populated zone beneath the current price, where long-term holders have previously shown willingness to accumulate, which could provide a stabilizing force if price action turns choppy in the near term.
Historically, periods of negative funding rates at strong price floors have preceded short squeezes that sparked sharper moves to the upside. If the current dynamic persists—declining open interest, controlled leverage, and improving macro sentiment—ETH could establish a more durable base rather than form a brief rally followed by renewed volatility. As market attention shifts toward macro cues and ETF developments, investors will be watching how ETH behaves around key support levels and whether on-chain demand sustains the current trajectory.

Crypto World
Audit admin keys, not just code, expert says after $200 million Drift exploit: Crypto Daybook Americas
By Omkar Godbole (All times ET unless indicated otherwise)
Programmable blockchain Solana’s SOL token has hit five-week lows after an exploit at one of its largest perpetual decentralized exchange, Drift, underscored that security risks go beyond just smart contracts.
“If you’re building in DeFi, audit the surface area of your admin key. Not only the smart contracts,” Omer Goldberg, founder of Chaos Labs, said, explaining what went wrong.
Goldberg explained in his X thread that the attacker compromised Drift’s admin key. This single key gave the attacker god-like control — like handing someone the master password to the entire bank vault with no limits or alarms.
Using this power, the attacker created a fake collateral market for a worthless token called CVT. They maxed out the risk parameters so the system treated hundreds of millions of this junk token as safe, high-value collateral. In the same transaction, they switched the CVT price oracle to one they fully controlled, artificially pumped its value to sky-high levels, lifted the circuit breakers on major assets (removing withdrawal limits) such as USDC, eETH and others, and drained over $250 million worth of tokens.
This also worked because Drift features a single shared liquidity pool that holds everyone’s collateral and trading funds, providing a seamless trading experience. (Imagine putting all your money in a single bank account and losing everything in a signature hack).
The real issue wasn’t a bug in the code. It was the enormous “surface area” of that admin key, or the massive damage one compromised signer could cause by rewriting protocol-wide risk rules, assigning oracles, and disabling safety guards.
This isn’t the first time a compromised privileged key has led to big losses. Just 10 days earlier, Resolv was drained for $25 million in tokens after attackers compromised a SERVICE_ROLE key.
So, the message is clear: protocol safety now depends as much on strong governance and key controls as it does on smart contract audits.
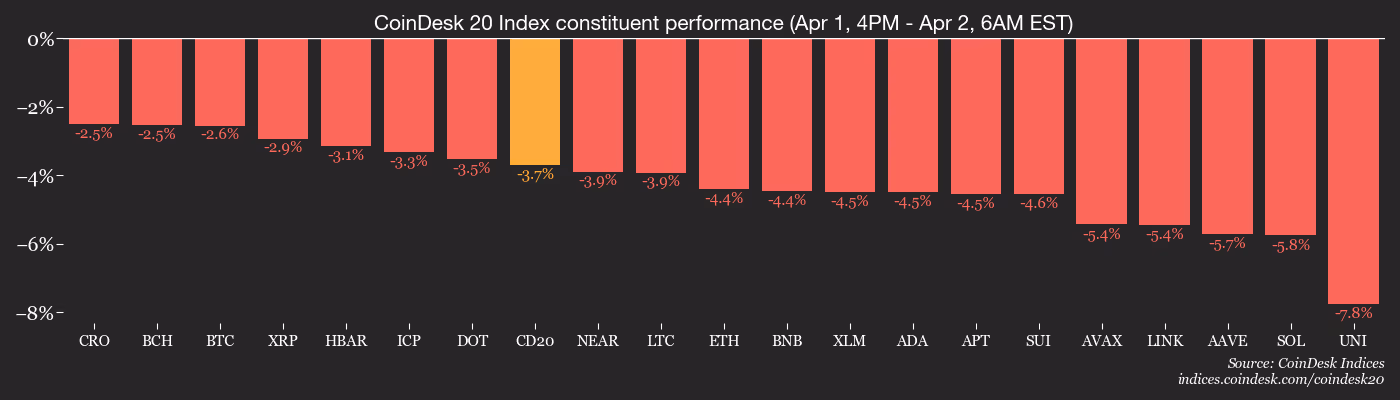
As for markets, SOL’s near 3% drop to $78.30, the lowest since late February, is consistent with the weakness in bitcoin , ether (ETH), XRP (XRP) and the wider market, as represented by the CoinDesk 20 Index.
The culprit once again is President Donald Trump’s renewed threat to Iran, which has sent oil prices higher. In the short term, these headlines could continue to lead movements in both traditional and crypto markets. Stay alert!
Read more: For analysis of today’s activity in altcoins and derivatives, see Crypto Markets Today
What to Watch
For a more comprehensive list of events this week, see CoinDesk’s “Crypto Week Ahead“.
- Crypto
- Macro
- April 2, 8:30 a.m.: U.S. Initial Jobless Claims for week ending March 28 (Prev. 210K)
- Earnings (Estimates based on FactSet data)
Token Events
For a more comprehensive list of events this week, see CoinDesk’s “Crypto Week Ahead“.
- Governance votes & calls
- Unlock DAO is voting to transfer 3 ETH to its Base multisig to swap for USDC to cover current and future operational expenses. Voting ends April 2.
- Aavegotchi DAO is voting to elect nine multi-sig signers, maintain a 5-of-9 signature threshold, and set their quarterly compensation at $1,000 paid in GHST. Voting ends April 2.
- Arbitrum DAO is voting across two proposals to transition its Code of Conduct and Procedures into living documents managed by OpCo, and to upgrade to ArbOS 60 Elara. Voting ends April 2.
- Unlocks
- April 2: Ethena (ENA) to unlock 2.18% of its circulating supply worth $16.05 million.
- Token Launches
Conferences
For a more comprehensive list of events this week, see CoinDesk’s “Crypto Week Ahead“.
Market Movements
- BTC is down 2.53% from 4 p.m. ET Wednesday at $66,459.24 (24hrs: -3.1%)
- ETH is down 4.66% at $2,043.77 (24hrs: -4.16%)
- CoinDesk 20 is down 3.59% at 1,891.30 (24hrs: -3.81%)
- Ether CESR Composite Staking Rate is up 1 bp at 2.77%
- BTC funding rate is at 0.0001% (0.0635% annualized) on Binance

- DXY is up 0.51% at 100.16
- Gold futures are down 3.56% at $4,641.60
- Silver futures are down 6.47% at $71.15
- Nikkei 225 closed down 2.38% at 52,463.27
- Hang Seng closed down 0.7% at 25,116.53
- FTSE is down 0.08% at 10,356.15
- Euro Stoxx 50 is down 1.61% at 5,640.26
- DJIA closed on Wednesday up 0.48% at 46,565.74
- S&P 500 closed up 0.72% at 6,575.32
- Nasdaq Composite closed up 1.16% at 21,840.95
- S&P/TSX Composite closed up 0.58% at 32,957.95
- S&P 40 Latin America closed up 0.95% at 3,658.43
- U.S. 10-Year Treasury rate is up 5.1 bps at 4.372%
- E-mini S&P 500 futures are down 1.17% at 6,540.50
- E-mini Nasdaq-100 futures are down 1.51% at 23,830.00
- E-mini Dow Jones Industrial Average Index futures are down 0.97% at 46,353.00
Bitcoin Stats
- BTC Dominance: 58.58% (+0.04%)
- Ether-bitcoin ratio: 0.03079 (-2.02%)
- Hashrate (seven-day moving average): 1,016 EH/s
- Hashprice (spot): $31.48
- Total fees: 2.55 BTC / $174,507
- CME Futures Open Interest: 107,610 BTC
- BTC priced in gold: 14.4 oz.
- BTC vs gold market cap: 4.44%
Technical Analysis

- The chart shows solana’s daily price swings in candlestick format with the Ichimoku cloud, a trend indicator, identified by the shaded area between green and red lines.
- The token’s price has crossed back below the cloud, indicating continuation of the broader decline. The pattern is similar to what we saw in mid-January, following which prices dropped sharply.
- Ichimoku cloud, invented by a Japanese journalist, is widely used to spot trend changes. Crossovers above and below the cloud are said to represent bullish and bearish shifts in trends.
Crypto Equities
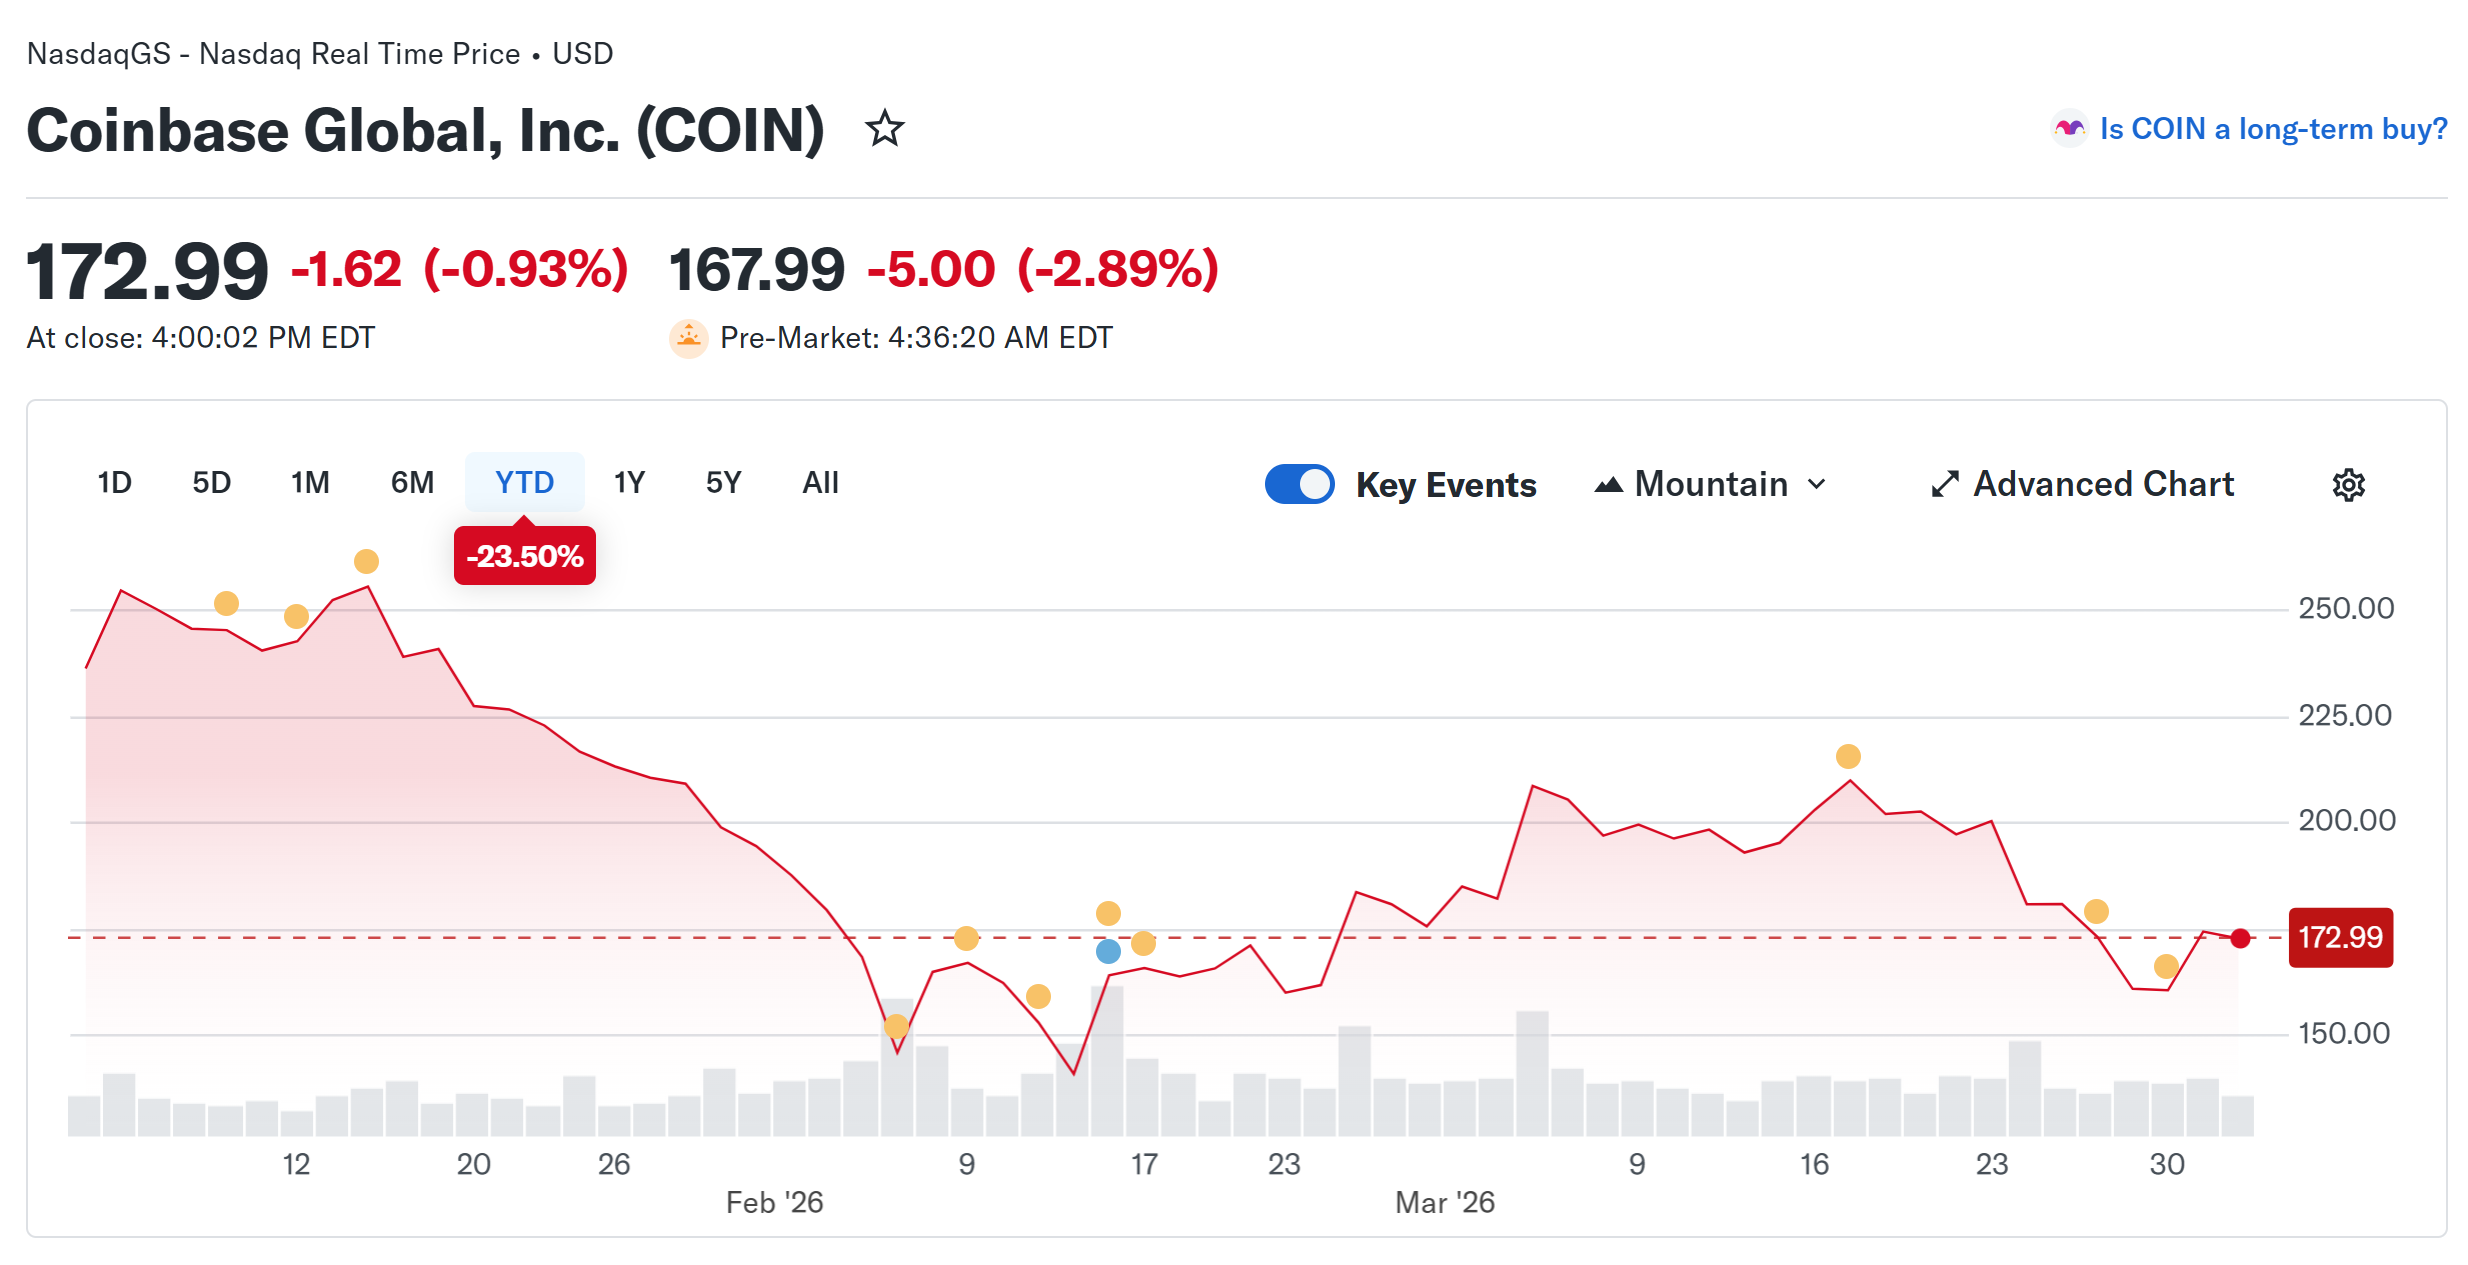
- Coinbase Global (COIN): closed on Monday at $172.99 (-0.93%), -3.17% at $167.50 in pre-market
- Circle Internet (CRCL): closed at $90.74 (-4.89%), -1.59% at $89.30
- Galaxy Digital (GLXY): closed at $17.37 (-5.85%), -2.42% at $16.95
- Bullish (BLSH): closed at $35.07 (-1.85%), -2.79% at $34.09
- MARA Holdings (MARA): closed at $8.04 (-1.47%), -2.74% at $7.82
- Riot Platforms (RIOT): closed at $12.55 (+1.54%), -4.94% at $11.93
- Core Scientific (CORZ): closed at $15.30 (+2.27%), -3.66% at $14.74
- CleanSpark (CLSK): closed at $8.62 (+1.29%), -3.38% at $8.33
- CoinShares Valkyrie Bitcoin Miners ETF (WGMI): closed at $34.86 (+0.11%)
- Exodus Movement (EXOD): closed at $6.68 (+2.77%)
Crypto Treasury Companies
- Strategy (MSTR): closed at $122.78 (-1.62%), -2.09% at $120.21
- Strive (ASST): closed at $10.16 (+1.40%), -3.44% at $9.81
- SharpLink Gaming (SBET): closed at $6.46 (+0.16%), -3.72% at $6.22
- Upexi (UPXI): closed at $0.99 (+0.20%), -5.16% at $0.94
- Lite Strategy (LITS): closed at $1.13 (-2.59%), -5.31% at $1.07
ETF Flows
Spot BTC ETFs
- Daily net flow: -$173.7 million
- Cumulative net flows: $55.92 billion
- Total BTC holdings ~ 1.29 million
Spot ETH ETFs
- Daily net flow: -$7.1 million
- Cumulative net flows: $11.58 billion
- Total ETH holdings ~ 5.71 million
Source: Farside Investors
While You Were Sleeping
Trump stirs market, political angst with vague timeline for Iran (Bloomberg): The $31 trillion U.S. Treasuries market notched its worst monthly performance since late 2024 in March, with bond investors concerned that the war-driven surge in oil prices would ignite inflation.
‘We are going to hit them hard’: Markets disappointed, oil up again after Trump speech (euronews): Oil rose sharply and European stocks fell after Trump said in his first national address since the Iran war began that the U.S. would continue its attacks on Iran.
Gold, silver fall as investors doubt Trump’s exit plan (The Wall Street Journal): Gold and silver prices swung into the red, alongside industrial metals and equities. Spot gold prices were down 3%, at roughly $4,670 a troy ounce. Spot silver fell more than 5%.
The bitcoin treasury boom is unwinding as some companies and governments sell holdings (CoinDesk): Those who rushed into bitcoin over the past two years are now heading for the exits and it’s not a great sign for the market.


United States President Donald Trump has vowed to continue military operations as the country’s Middle East war with Iran enters the third week of intensified hostilities.
Summary
- Trump says U.S. will intensify strikes on Iran’s critical infrastructure over the next two to three weeks as military operations expand.
- Iran warns of “crushing” retaliation and rejects ceasefire talks, claiming US and Israeli strikes have hit only limited targets so far.
- Major cryptocurrencies have fallen in response to the recent escalation.
“We are going to hit them extremely hard over the next two to three weeks. We’re going to bring them back to the Stone Ages, where they belong,” Trump said, adding that the United States would no longer tolerate “state-sponsored provocation” against American assets.
Further, Trump noted that Iran has repeatedly violated the terms of every previous diplomatic deal and confirmed that U.S. forces are going to aggressively target critical infrastructure across the country.
“We are going to hit each and every one of their electric generating plants very hard and probably simultaneously […] We have not hit their oil, even though that’s the easiest target of all, because it would not give them even a small chance of survival or rebuilding,” he added.
The ongoing war in the Persian Gulf has rattled both traditional and emerging markets, and the escalation has led to a massive spike in oil prices immediately after Iran threatened to permanently blockade the Strait of Hormuz.
Since the war began, Bitcoin has dropped nearly 12%; meanwhile, despite its reputation as a safe haven, Gold has also slumped sharply as a surging U.S. Dollar and rising bond yields outweigh geopolitical fears.
Trump says the oil situation will improve
Trump acknowledged concerns over surging gas prices but downplayed the economic impact, saying it was a temporary ”short-term” situation and that he expects global supply routes to open up once Tehran surrenders.
“When this conflict is over, the strait will open up naturally. It’ll just open up naturally. They’re going to want to be able to sell oil because that’s all they have to try and rebuild. It will resume the flowing and the gas prices will rapidly come back down,” he said.
He went on to add that the U.S. Economy is “strong and improving” and the domestic energy sector will be “roaring back like never before.”
“Thanks to the progress we’ve made. I can say tonight that we are on track to complete all of America’s military objectives shortly. Very shortly,” Trump said.
Iran threatens retaliation
Even though Trump said that back-channel discussions for a ceasefire were ongoing, Iranian leaders have vehemently denied that there are any serious talks underway.
After the latest speech, the Iranian Revolutionary Guard has vowed a “devastating” retaliation, adding that so far, the U.S. and Israel have been striking “insignificant” targets.
A spokesperson to the Supreme Leader said the two countries have “incomplete” information about the nation’s underground military capabilities and warned that any further strikes would be met with “crushing, broader and destructive” attacks.
He added that the bulk of Iran’s missile production takes place in ”places that you do not know at all.”
On Wednesday, reports suggested that Iran has blacklisted 18 tech companies, including Silicon Valley giants like Microsoft and Google, stating they would be considered as “legitimate targets” in response to cyber strikes on Iran.
“From now on, for every assassination, an American company will be destroyed,” The Guard, which the U.S. designates as a terrorist organization, warned on Tuesday.
Crypto markets under pressure
Major cryptocurrencies besides Bitcoin—including Ethereum, XRP, and BNB—have started to drop sharply and have losses between 3-5% as of last check.
If the macro situation continues to deteriorate, it could spell trouble for the liquidity of these volatile high-beta assets, especially as Bitcoin is hovering very close to a major support area around $65,000.
If this support breaks, it could trigger a massive wave of liquidations, potentially sending the broader market into a prolonged crypto winter fueled by geopolitical instability.
Bitcoin (BTC) price slipped below $67,000 on April 2, falling roughly 2.8% in 24 hours and extending a year-to-date decline that now sits near 23%.
The drop aligns with a pattern forming across on-chain data, chart structure, and derivatives positioning. One cohort of buyers has been steadily exiting since January, and the technical picture now threatens a 14% correction if a key level fails.
The Buyers Who Bought the Dip Are Walking Away
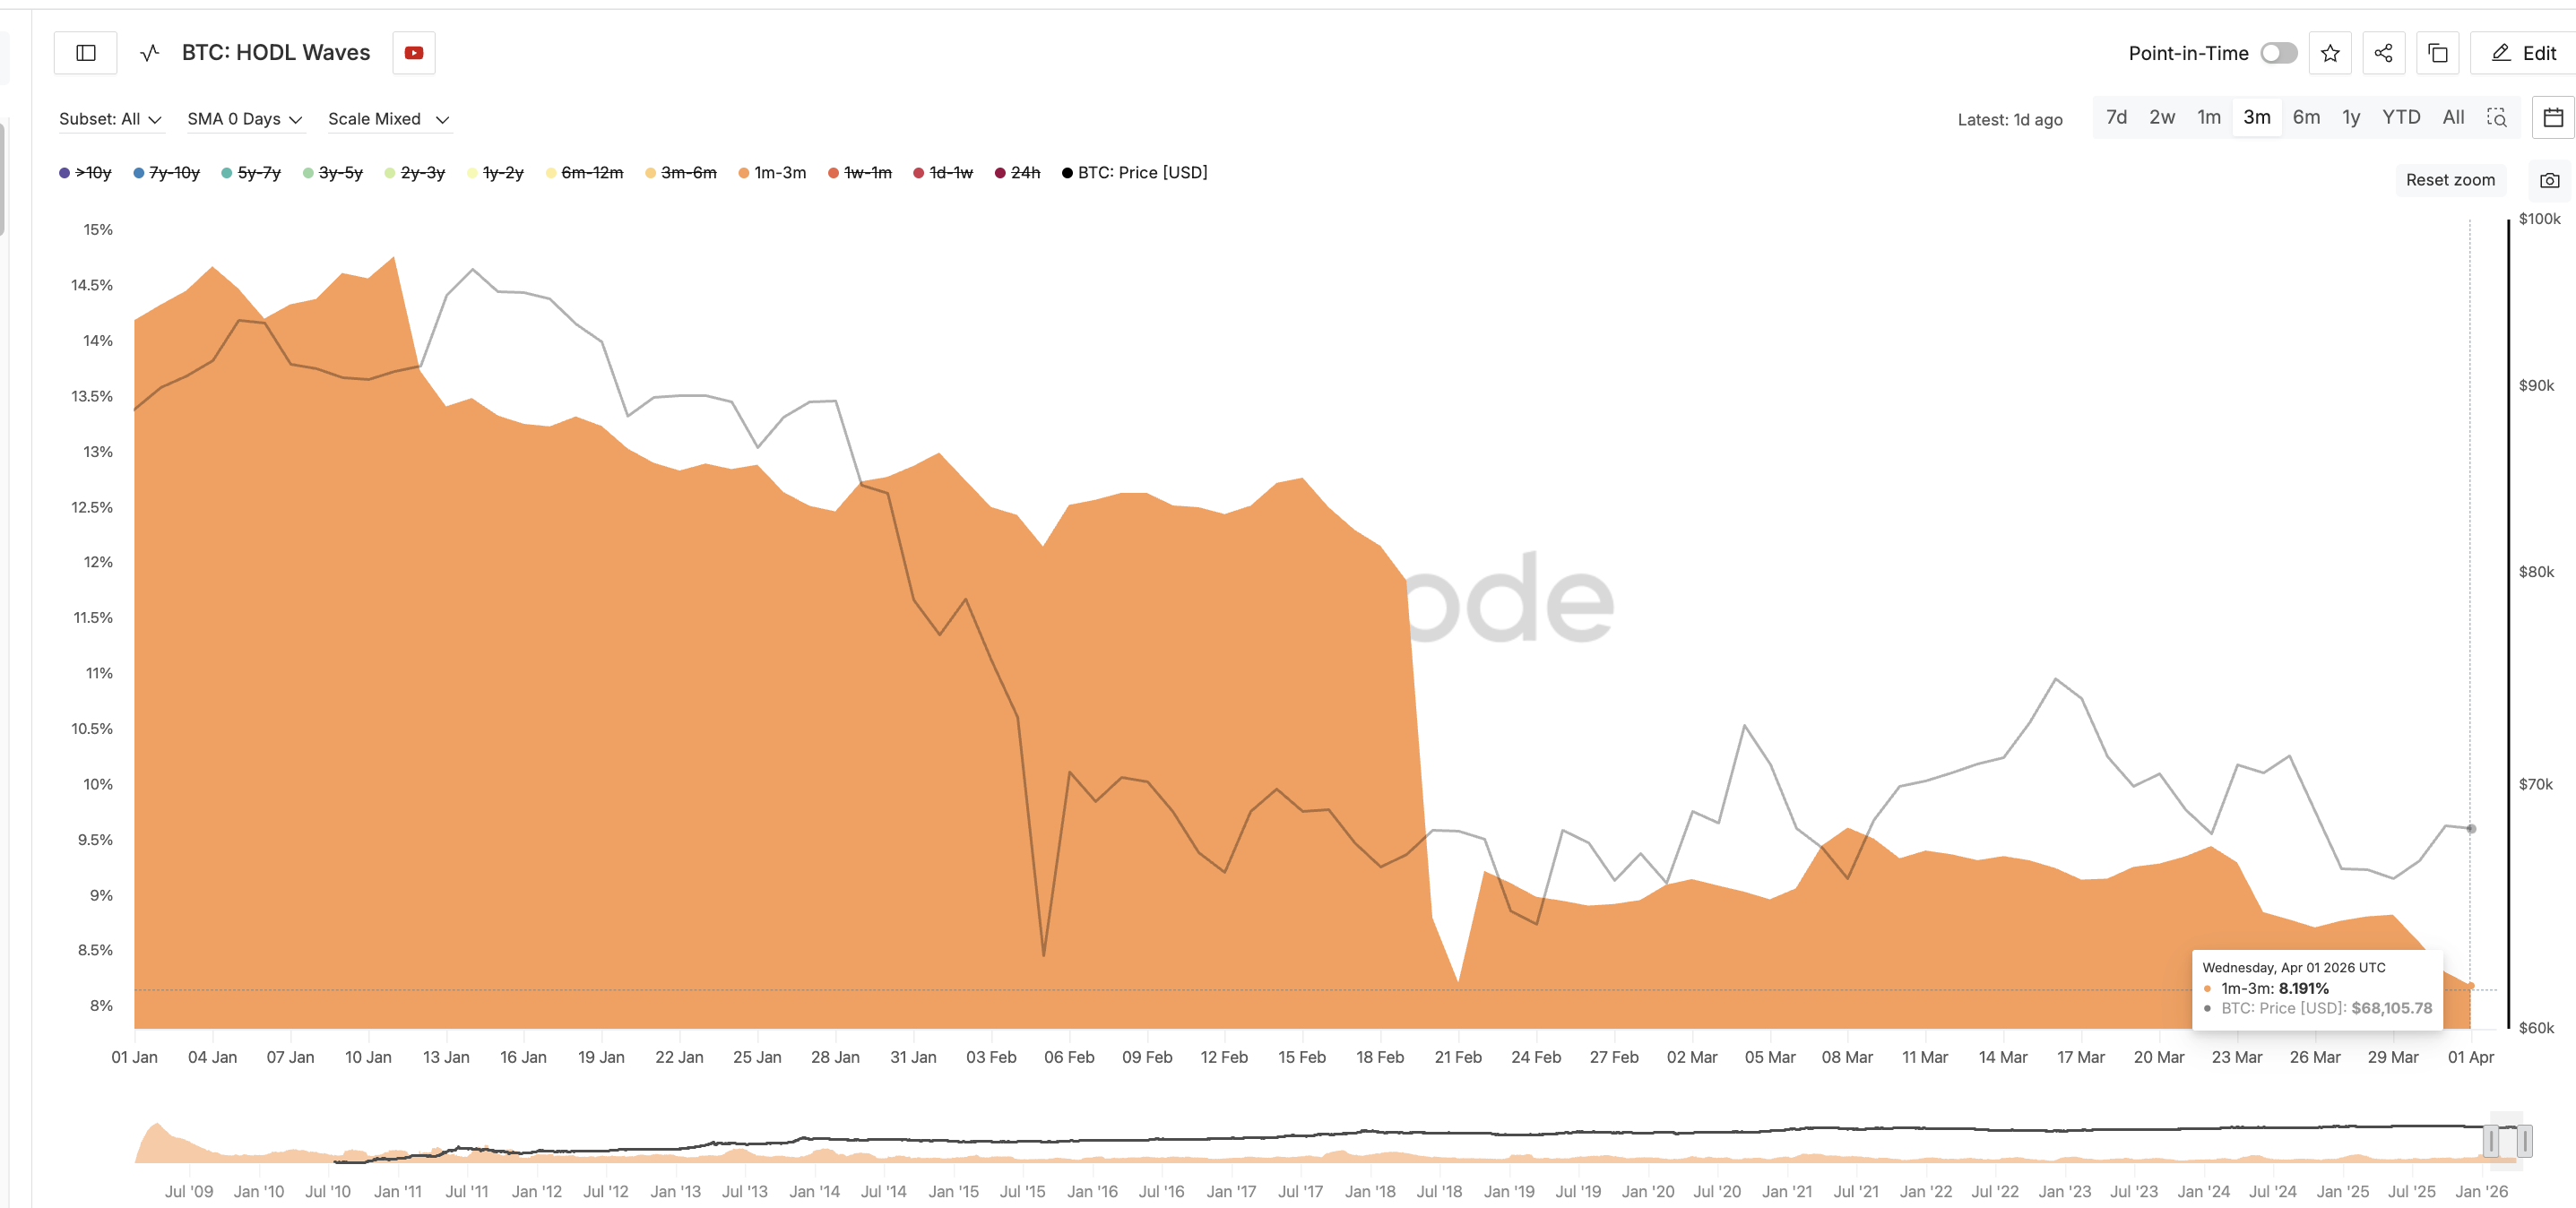
BTC HODL waves, an on-chain metric that tracks the percentage of supply held by different age groups, show a dramatic exit from the 1-month to 3-month cohort. On January 14, this group controlled 14.67% of the total Bitcoin supply. By April 1, that figure had fallen to 8.19%, its lowest reading of the year.
The decline accelerated in two distinct waves. The first came post mid-February, when the cohort’s share dropped from 12.72% on February 15 to single digits by February 22. A second aggressive leg down arrived around March 22, when the reading slipped from 9.44% and continued falling without recovery.
Want more token insights like this? Sign up for Editor Harsh Notariya’s Daily Crypto Newsletter here.
This group represents participants who accumulated during the Q1 drawdown, expecting a bounce. Their persistent selling over nearly three months signals that short-term conviction has evaporated. When recent buyers distribute at a loss rather than averaging down, it typically reflects capitulation rather than healthy rotation.
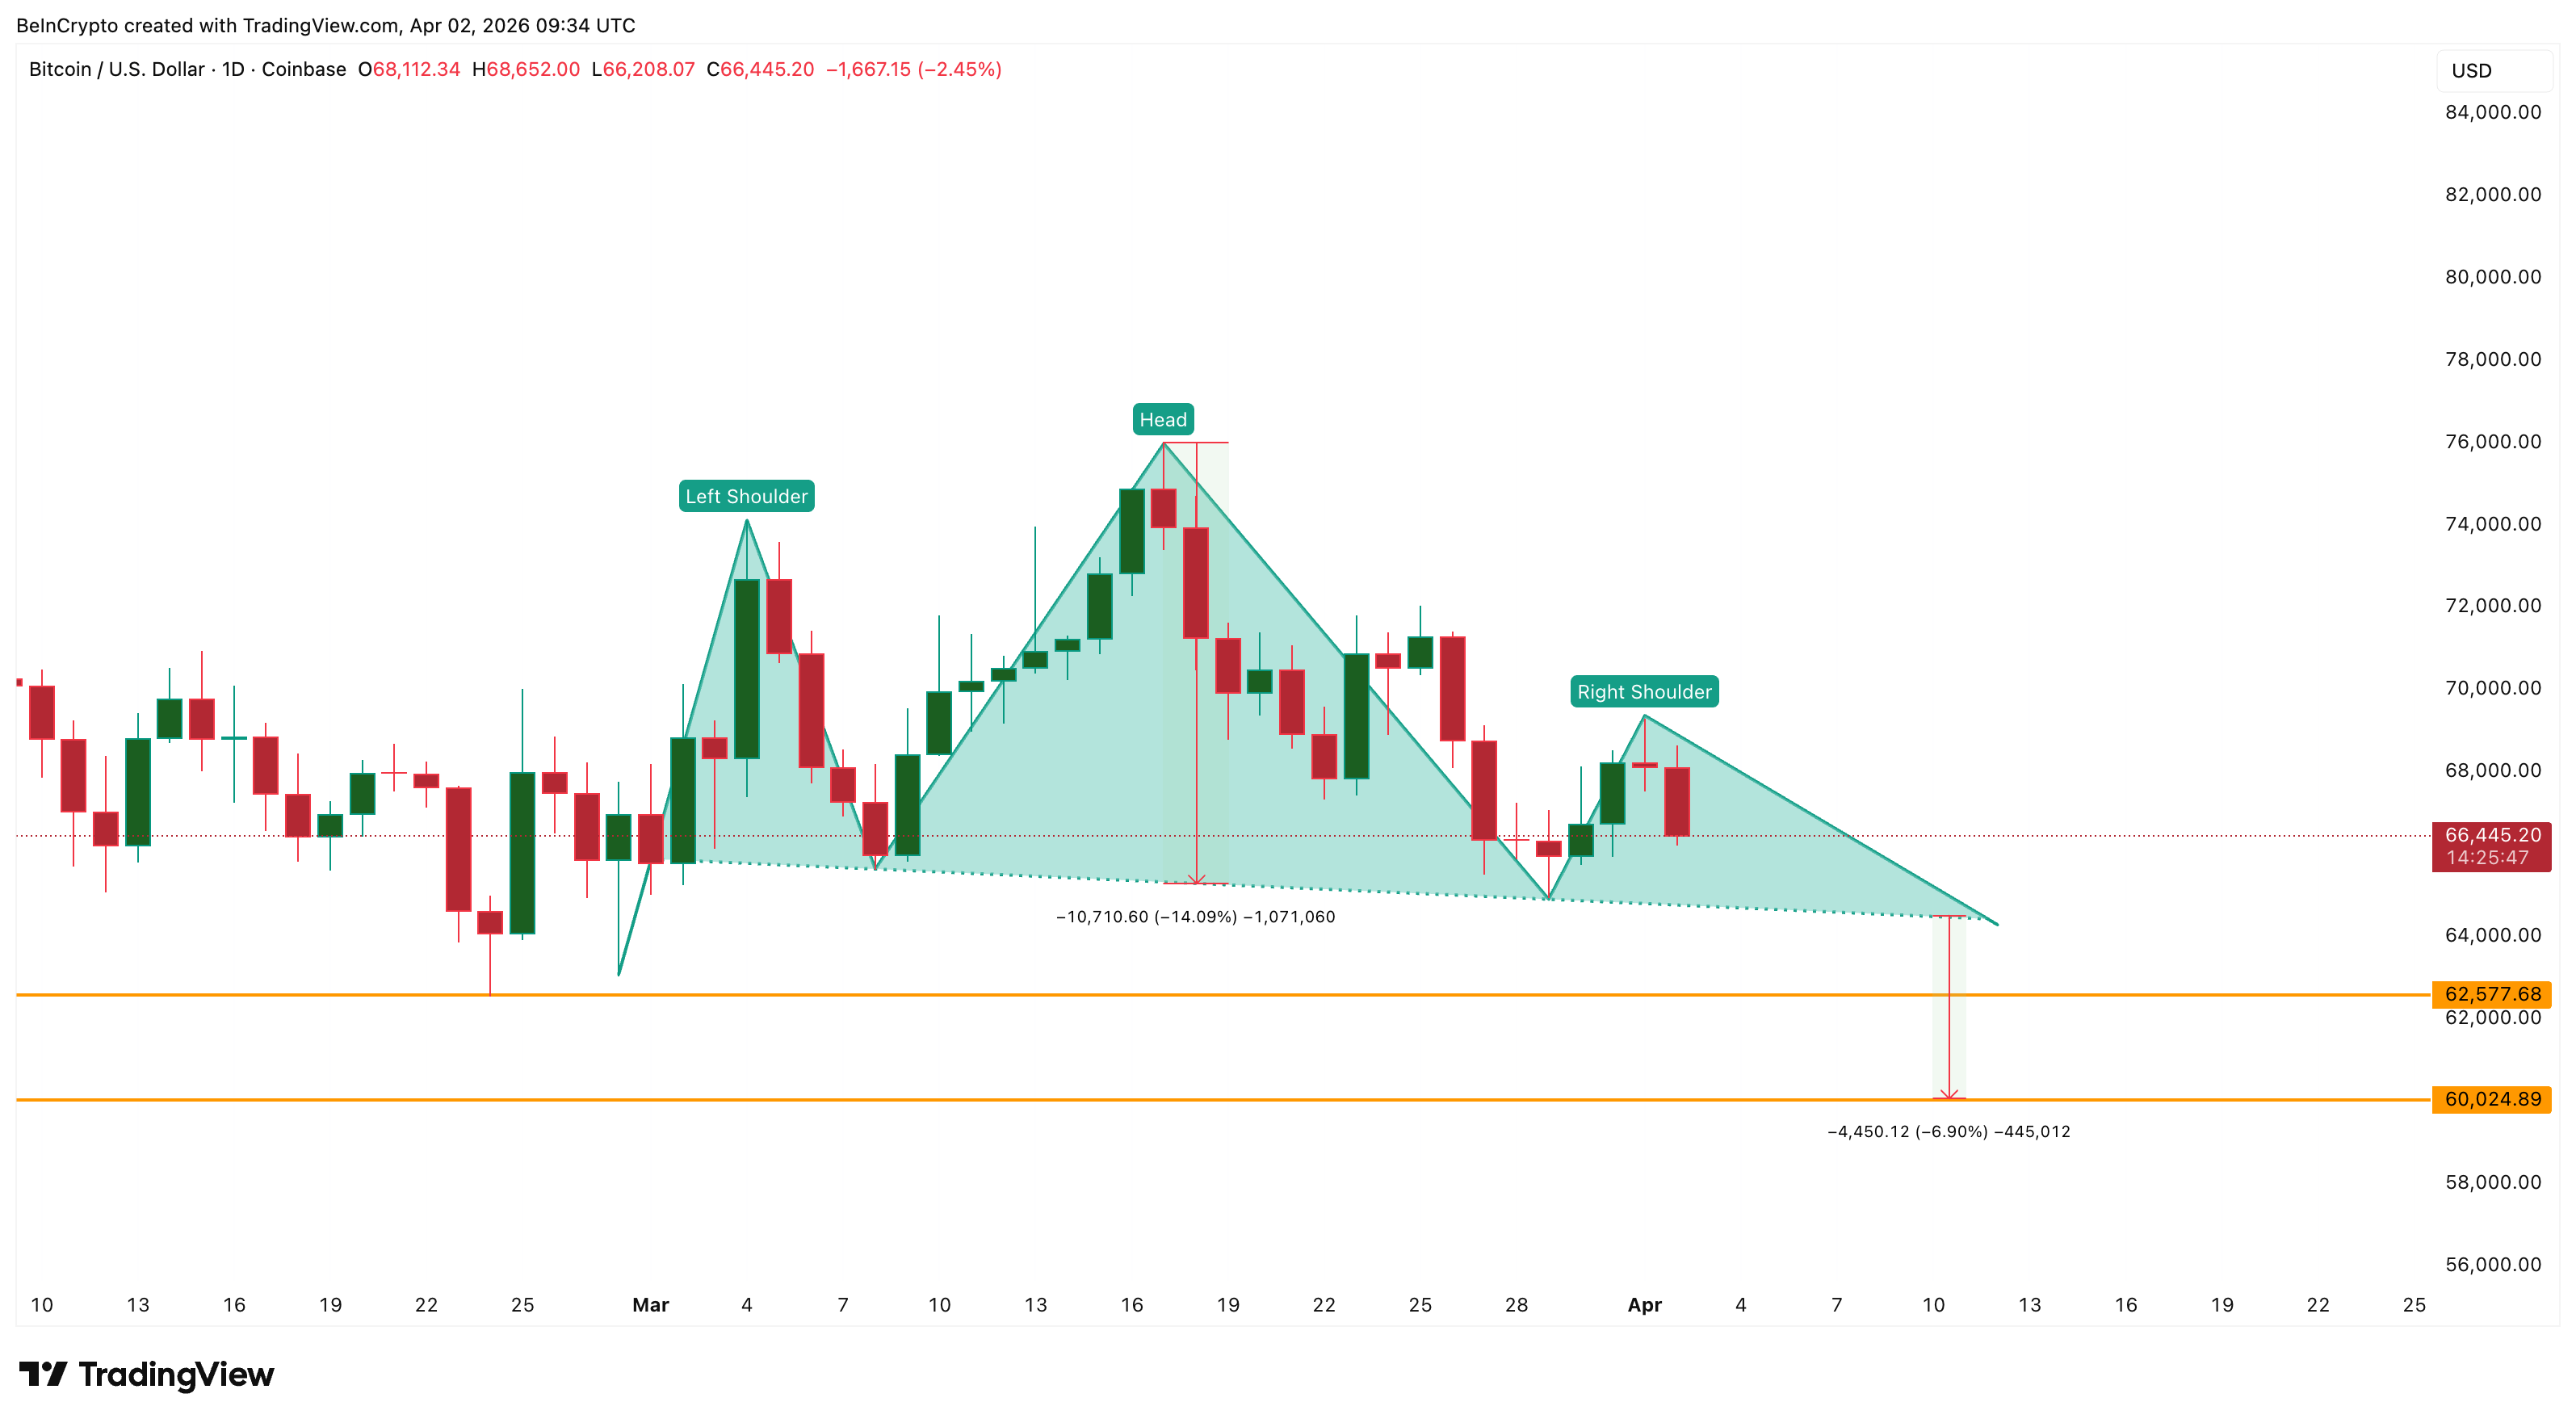
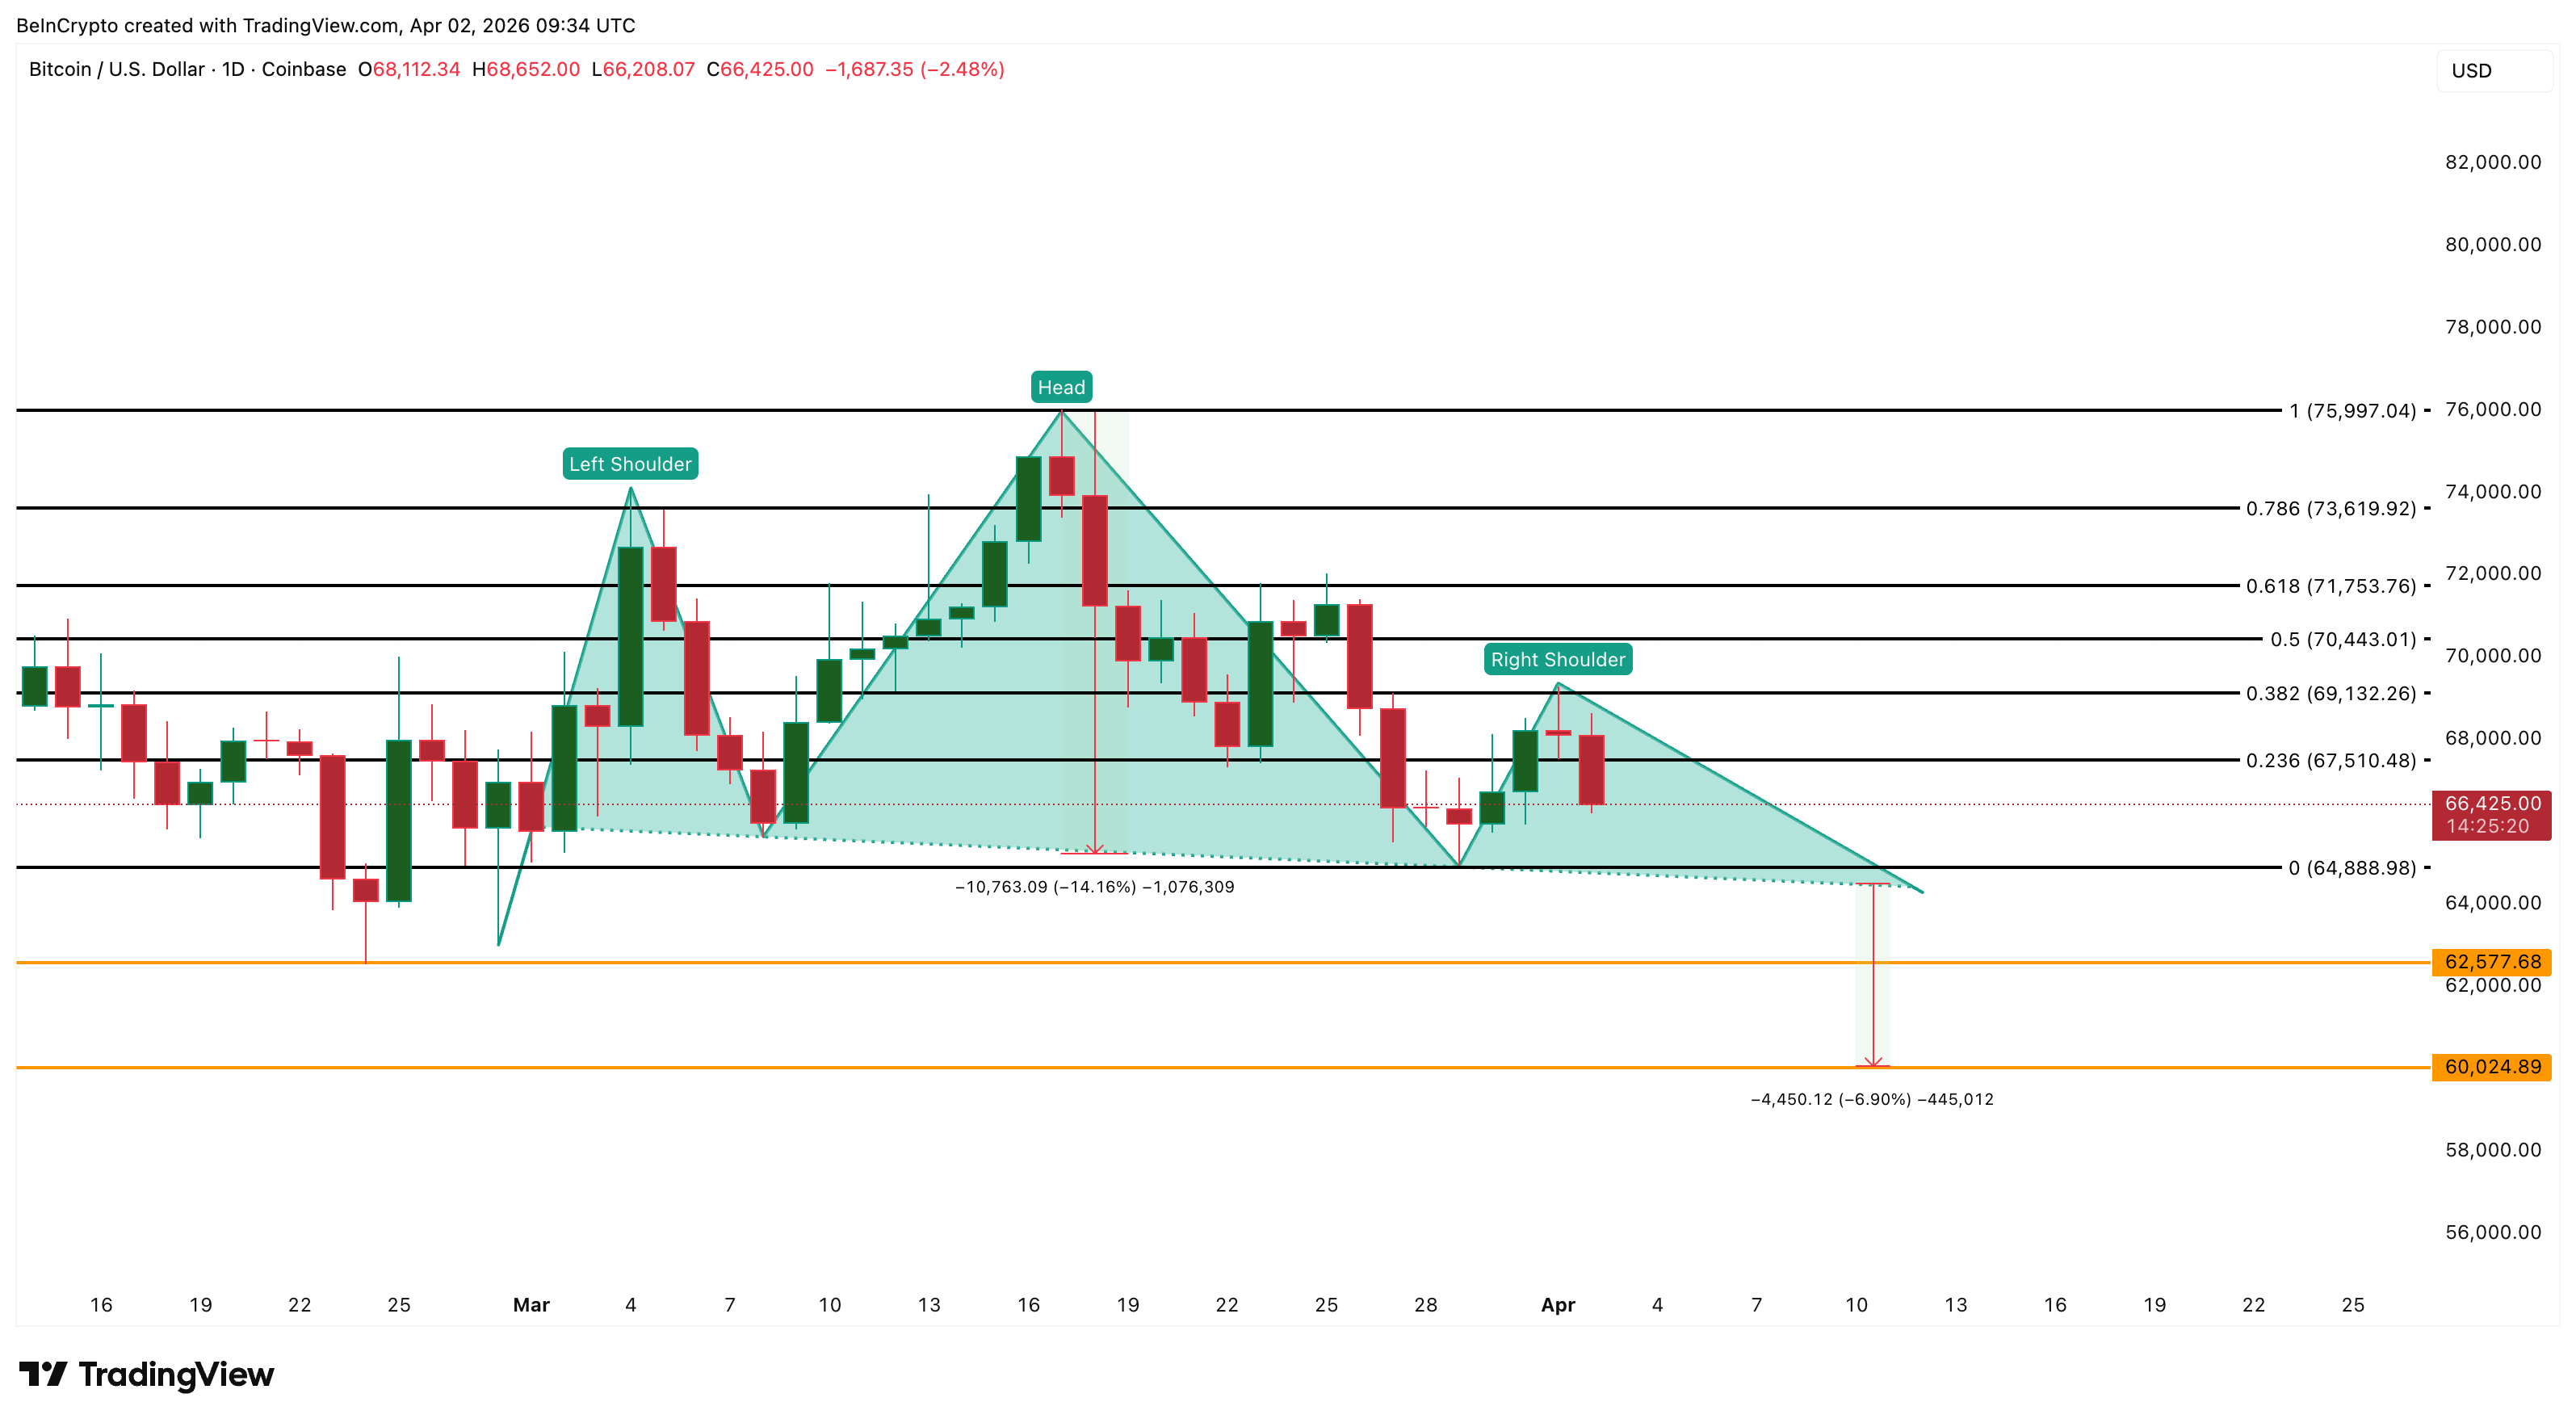
That behavioral shift is visible on the Bitcoin price chart as well. Since late February, the daily timeframe has been forming a head and shoulders pattern. The pattern validates the weakness that the HODL wave data already flagged.
However, whether the pattern triggers depends on how the derivatives market is positioned around the breakdown zone.
Leverage Leans the Wrong Way
Despite bearish signals from both on-chain behavior and chart structure, the BTC derivatives market has not adjusted defensively. Over the past seven days on the Binance BTC/USDT perpetual pair, cumulative long liquidation leverage totals $1.44 billion in active positions.
Short liquidation leverage sits at $1.03 billion. The roughly 40% skew toward longs means the market remains positioned for upside while the technical picture deteriorates.
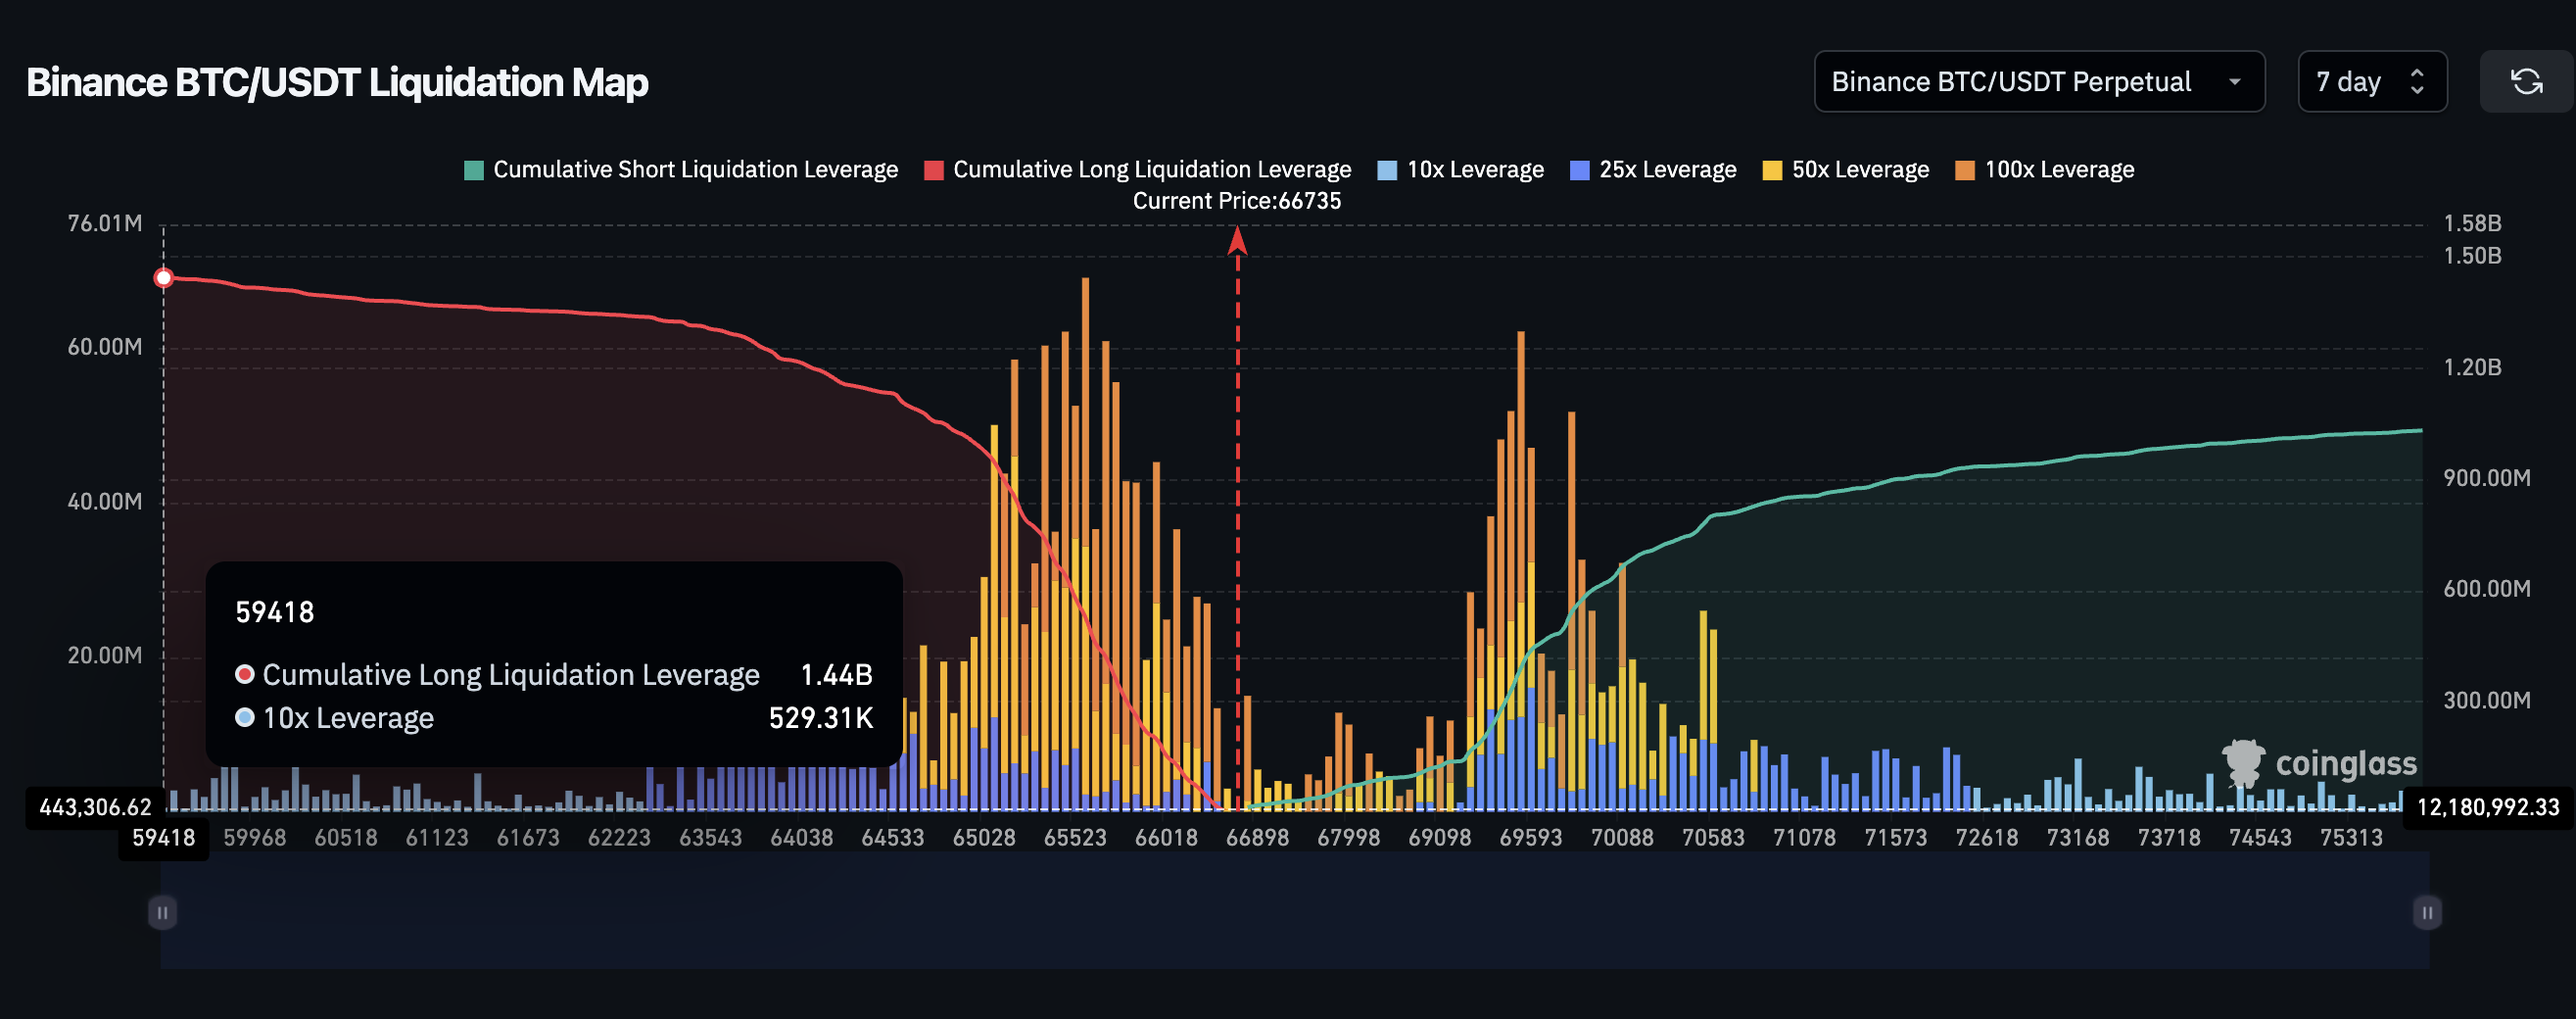
The Binance BTC liquidation map sharpens the risk further. Of the $1.44 billion in total long exposure, approximately $1.13 billion clusters at a single level near $64,533. That concentration means nearly 80% of all long positions opened over the past week would be forcibly closed if price reaches that zone.
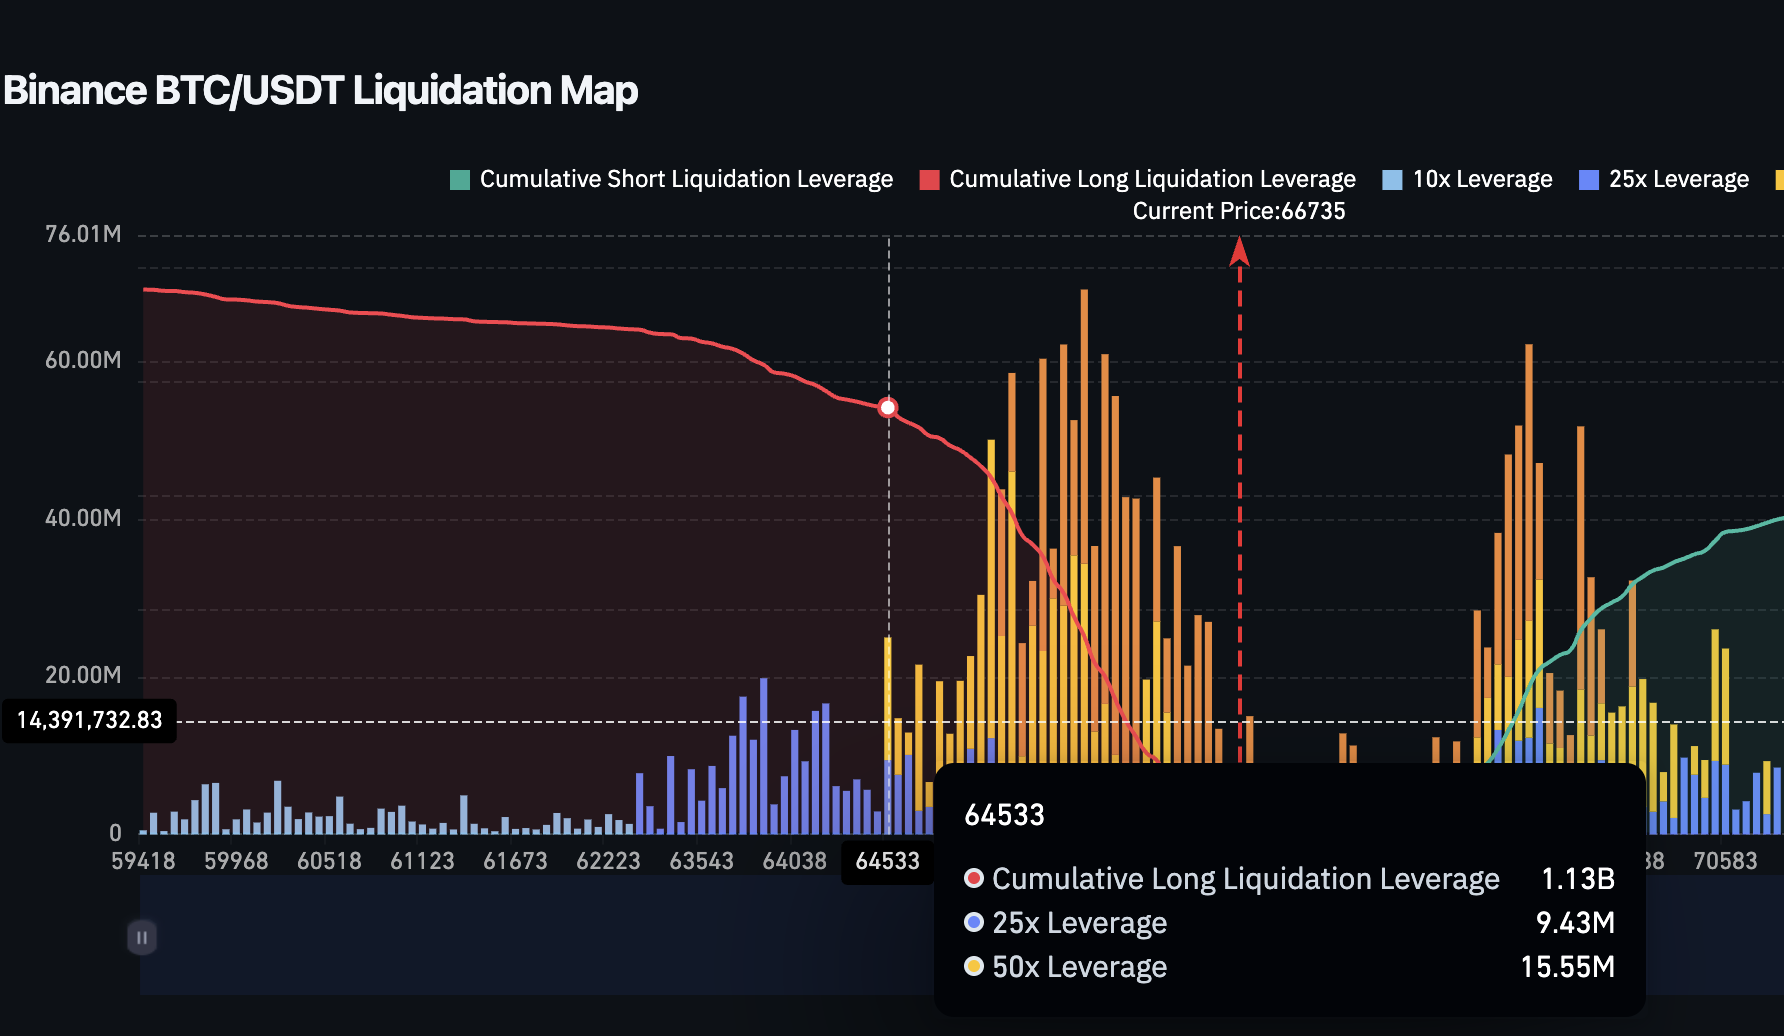
High-leverage positions using 25x and 50x multipliers dominate the cluster.
Even a modest push into that range could trigger cascading forced selling, turning a controlled decline into a liquidation-driven flush. The mismatch between bearish structure and bullish leverage is where the greatest Bitcoin price risk builds. The BTC price chart now becomes the final arbiter of whether that risk materializes.
Bitcoin Price Prediction and One Critical Line
The daily chart confirms the head and shoulders pattern with Fibonacci (Fib) levels mapping every critical zone. The Fib levels are drawn from the head of the pattern to the completed swing low.
Bitcoin currently trades near $66,425, having already lost the 0.236 Fib level at $67,510.
The measured move from the pattern projects a 14.16% decline, targeting approximately $60,024 on the way down. However, the path runs through $64,888, a level that is slightly above the neckline area for the pattern.
Losing $64,888 would place price directly into the $1.13 billion long liquidation cluster at $64,533 identified in the derivatives section. That overlap transforms the neckline break from a technical event into a leverage-driven cascade. From there the full 14% target, under $60,000 becomes realistic.
For the bearish thesis to fail, Bitcoin price needs a daily close above $69,132 to begin neutralizing the right shoulder. Strength only returns above $71,750, the 0.618 level, and a move past $75,997 would invalidate the head and shoulders entirely.
Head and shoulders patterns do not always resolve in the expected direction. A sudden demand surge or macro catalyst could reverse the structure before the neckline is tested. However, the convergence of capitulating short-term buyers, long-heavy leverage, and declining price structure lowers the probability of that outcome.
A daily close below $64,888 separates a measured pullback from a leveraged flush toward the $60,000 zone, while reclaiming $69,132 would be the first signal that sellers are running out of momentum.
The post One Selling Pattern Reveals the Next Major Bitcoin Price Risk of 2026 appeared first on BeInCrypto.
Key Insights
- GENIUS Act defines state-regulated stablecoin compliance, allowing smaller issuers to operate locally while meeting federal oversight standards.
- OCC guidance establishes federal benchmarks, guiding stablecoin issuers transitioning from state to federal supervision after $10 billion circulation.
- Monthly reserve disclosures and uniform branding rules ensure consistent transparency and regulatory alignment across state and federal stablecoin frameworks.
The U.S. Department of the Treasury has released an 87-page proposal implementing the GENIUS Act. The notice opens a 60-day public comment period and outlines how stablecoin oversight will function across both state and federal systems.
The proposal details how the Treasury will determine whether state-level regulatory frameworks are “substantially similar” to federal standards. Smaller issuers can remain under state supervision if their systems meet the defined benchmarks.
State Stablecoin Oversight Must Meet Federal Standards
Issuers with less than ten billion dollars in circulation may opt for state-level regulation, provided their frameworks align with federal rules. The proposal separates requirements into two categories: uniform rules covering reserves and anti-money laundering and state-calibrated rules where local regulators control supervision, licensing, and risk management.
This approach allows states to maintain flexibility while ensuring all systems comply with the federal baseline, preventing gaps in regulation.
OCC Guidance Shapes Federal Stablecoin Compliance
The Treasury relies on the Office of the Comptroller of the Currency to define the federal benchmark. Nonbank issuers that exceed the $10 billion threshold will transition toward federal supervision guided by OCC standards.
The rule also clarifies that state frameworks may exceed federal requirements, but they cannot conflict with federal law or reduce regulatory comparability.
Stablecoin Disclosure and Branding Rules Enforced
Issuers must publish monthly reserve composition reports to maintain transparency across state and federal systems. This ensures that disclosure practices remain consistent for all regulated stablecoins.
In addition, naming restrictions apply uniformly to prevent misleading branding. These rules align compliance across jurisdictions and maintain public confidence in dollar-backed stablecoins.
GENIUS Act Implementation Drives Regulatory Alignment
The rulemaking represents a key step in turning the GENIUS Act into an operational framework. Passed in July 2025, the law introduced mandatory reserve backing, regular disclosures, and anti-money laundering compliance for payment stablecoins.
Meanwhile, Congress continues advancing complementary measures, including the Clarity Act, to define SEC and CFTC oversight, although disputes over stablecoin yield have slowed broader market reforms.
Crypto World
Crypto’s wash trading problem is ‘far more common’ than investors think, DOJ sting shows

![]()
A U.S. enforcement case against alleged crypto market manipulation is once again putting the spotlight on wash trading and the blurry line between market makers and market manipulators.
Federal prosecutors in California this week charged 10 individuals tied to firms including Gotbit, Vortex, Antier and Contrarian, accusing them of coordinating trades to inflate token prices and volumes before selling into the artificial demand. The case stemmed from an undercover FBI operation in which agents created their own token to identify firms offering manipulation services.
Defendants marketed strategies to boost trading activity that in reality amounted to pump-and-dump schemes and wash trading, leaving evidence that is far more common than expected, crypto experts Jason Fernandes from AdLunam and Stefan Muehlbauer from Certik told CoinDesk via Telegram interviews..
“Yes, despite increased enforcement, wash trading continues to be a pervasive issue, particularly among lower-cap tokens and on unregulated exchanges,” Muehlbauer said, while Fernandes stated, iIt’s far more common than most investors realize,”. They both agreed the scale remains high.
Gotbit Founder Aleksei Andriunin, included in the recent Department of Justice indictments, pleaded guilty to two counts of wire fraud and conspiracy to commit market manipulation last year, and agreed to forfeit $23 million. U.S. prosecutors described his crimes as a “wide-ranging conspiracy” to manipulate token prices for paying clients.
Inflating volumes becomes a shortcut
The details of market manipulation exposed by the DOJ are impactful, but the underlying behavior is not.
“Wash trading exists because in crypto, liquidity is perception,” said Jason Fernandes, co-founder of AdLunam. “Volume attracts attention, listings and capital, so inflating it becomes a shortcut to relevance.”
The mechanics are straightforward: coordinated accounts trade back and forth to simulate demand, often outsourced to market makers paid to create the illusion of organic flow.
It is far more common than investors believe or expect, particularly in long-tail tokens and on smaller exchanges where oversight is limited, Fernandes added.
“In many cases, it’s not just rogue actors. It’s projects, market-making firms and even venues themselves, all benefiting from higher reported volume.”
The DOJ said the firms included in their indictment used coordinated trading to inflate volumes and prices, ultimately selling tokens at artificially high levels to unsuspecting investors.
Recent research has repeatedly pointed to inflated activity across crypto markets. A Columbia University analysis of Polymarket found roughly 25% of historical volume showed signs of wash trading, while earlier Dune Analytics data suggested tens of billions in NFT volume on Ethereum stemmed from similar activity.
Wash trading still a ‘pervasive issue’: Certik
“The recent actions by the U.S. Department of Justice send a clear signal,” said Stefan Muehlbauer, head of U.S. government affairs at CertiK. “The ‘wild west’ era of crypto market manipulation is facing a coordinated, global crackdown. While these indictments represent a major victory for market integrity, wash trading remains a significant concern.”
Despite years of scrutiny, the incentives behind the practice remain intact, he said. Token issuers often face pressure to meet exchange listing requirements tied to trading volume, leading some to turn to market makers to simulate activity or deploy bots that trade against themselves.
“The ‘why’ is simple: illusion of value,” Muehlbauer said. “That illusion has real consequences,” particularly because artificial volume distorts price discovery, masks weak liquidity and can funnel capital based on signals that are not real. “High volume signals to investors and exchanges that a token is hot and liquid.”
“Victims are investors relying on that liquidity and high volume data,” Fernandes said. “Wash trading distorts markets, leading to “mispriced risk and capital flowing based on signals that aren’t real.”
Enforcement will benefit the market
The latest DOJ case stands out may bring a glimmer of hope to the industry.
“What’s notable isn’t just the charge but the method,” Fernandes said. “When the FBI is creating tokens to catch market manipulation, you’re no longer in a grey area. This is the U.S. signaling that crypto market structure is now firmly in enforcement territory.”
For market participants, the line between legitimate liquidity provision and manipulation is coming under sharper scrutiny, said the AdLunam co-founder.
Efforts to detect and reduce wash trading are improving. Regulated exchanges are deploying more sophisticated surveillance tools, while analysts are increasingly looking beyond headline volume to metrics such as order book depth, slippage and counterparty diversity.
Enforcement may ultimately push the market forward, although for now, the DOJ case shone a light on just how pervasive wash trading continues to be, undermining trust in crypto markets.
“Crypto is moving from a loosely policed frontier market to something that has to withstand institutional scrutiny. An irony is that enforcement like this may ultimately strengthen the asset class,” Fernandes said.
In Muehlbauer’s words, “the message to the industry is clear: what was once brushed off as ‘market making’ is now being prosecuted as wire fraud and market manipulation.”

Coinbase Chief Legal Officer Paul Grewal has signaled that FIT21 – the Financial Innovation and Technology for the 21st Century Act – is set to see meaningful legislative movement within 48 hours, a claim that lands at precisely the moment Senate negotiations over crypto market structure are reaching a critical inflection point.
The immediate market implication is not abstract: jurisdictional clarity between the SEC and CFTC is the single largest regulatory risk premium embedded in institutional crypto pricing right now, and a credible path to resolution moves that premium.
For institutional market makers, RIAs, and hedge funds that have been sidelined from altcoin exposure by unresolved ‘unregistered security’ risk, Grewal’s timing signal is the most direct legislative catalyst in months.
Crypto regulation has been inching forward since the GENIUS Act established a stablecoin framework in 2025 – but broader market structure has remained in limbo, and that limbo has a measurable cost in market liquidity and asset pricing spreads.
Grewal stated plainly that ‘clarity is coming,’ framing the current moment as the industry’s transition out of regulation-by-enforcement and into a structured legislative era. That framing is deliberate – Coinbase has been the most aggressive corporate actor pushing for FIT21 passage, and Grewal’s public confidence signal is a strategic move as much as a factual one. When a company’s CLO goes on record with a 48-hour window, the message to Senate negotiators is as loud as the message to markets.
Key Takeaways:
- Grewal’s signal: Coinbase CLO Paul Grewal publicly stated FIT21 would see legislative progress within 48 hours, the most direct timing claim from a major industry actor in the current cycle.
- What FIT21 defines: A decentralization test that determines whether digital assets fall under SEC (securities) or CFTC (commodities) jurisdiction – the central unresolved question in U.S. crypto regulation.
- The SEC vs CFTC boundary: Post-passage, sufficiently decentralized tokens become CFTC-regulated digital commodities; centralized issuances remain SEC-regulated securities.
- Market liquidity implication: Institutional market makers, RIAs, and hedge funds currently avoiding altcoins due to enforcement risk get a codified compliance standard – unlocking capital that has been on the sideline.
- What to watch: Senate Banking Committee markup targeted for April 2026; stablecoin yield compromise must resolve by end of week to keep the floor vote timeline intact.
Discover: The best crypto to diversify your portfolio with
What FIT21 Actually Does – and Why the SEC vs CFTC Question Is the Only One That Matters
FIT21’s core mechanism is a decentralization test – a ‘Howey-style’ framework applied specifically to digital assets to determine whether a token is an investment contract under SEC jurisdiction or a digital commodity under CFTC authority.
The bill passed the House 279-136 in May 2024 with meaningful bipartisan support, stalling in the Senate as stablecoin yield provisions became the primary friction point.
In practice, the bill draws the regulatory boundary this way: assets issued by sufficiently decentralized networks – where no single issuer controls 20% or more of the supply or development roadmap – qualify as digital commodities and fall under CFTC oversight.
BREAKING: $60 BILLION COINBASE JUST SAID LIVE ON FOX:#BITCOIN AND CRYPTO MARKET STRUCTURE DEAL WILL BE ANNOUNCED "IN THE NEXT 48 HOURS" — The Bitcoin Historian (@pete_rizzo_) April 1, 2026
MARKUP WILL TAKE PLACE "WITHIN WEEKS"
CLARITY IS HAPPENING  pic.twitter.com/kkUpZpbbLi
Assets that fail that test remain securities under SEC jurisdiction. Section 202 of the bill would also exempt qualifying digital commodity offerings from securities registration, provided issuers meet disclosure requirements covering source code, transaction history, and token economics – effectively enabling U.S.-based token fundraising that currently routes offshore.
For exchanges like Coinbase, the practical unlock is immediate: a definitive decentralization test means listing decisions on top-20 altcoins no longer carry open-ended SEC enforcement risk.
For institutional participants navigating ongoing regulatory framework debates around crypto oversight, FIT21 passage shifts compliance from a judgment call to a codified standard. That difference in kind – not degree – is what reprices institutional participation.
Explore: Best Crypto Projects With High Growth Potential in 2026
The post Coinbase CLO Predicts FIT21 Breakthrough: What It Means for Markets appeared first on Cryptonews.
Crypto World
BitGo launches unified crypto financing platform for institutional lending and borrowing


BitGo has rolled out a new financing platform that allows institutions to borrow and lend against a range of crypto holdings.
Summary
- BitGo has introduced a financing platform that enables institutions to borrow and lend against liquid, staked, and locked assets from a single custody account.
- The platform replaces fragmented lending workflows with a portfolio-based model, allowing clients to access liquidity against a combined pool of assets without moving collateral.
According to the announcement, the platform brings together features like borrowing, lending, and collateral management to eliminate the need for multiple counterparties and fragmented workflows.
Instead of setting aside collateral for each individual loan, the platform uses a portfolio-based structure that allows clients to access liquidity from a combined pool of assets held in custody.
“We’ve built this offering to pair responsive, high-touch support from our team with an on-platform experience that makes financing easy to manage. That combination of flexibility, service, and control is what institutions have been missing in digital asset markets,” Adam Sporn, the firm’s head of prime brokerage and institutional sales, said in an accompanying statement.
Support for staked and locked tokens adds another layer, allowing borrowers to access liquidity without exiting positions tied to staking or vesting schedules, while still maintaining oversight of assets held in custody. Clients can also lend assets from the same account, either to generate yield or to free up capital for trading and treasury operations.
All activity takes place within BitGo’s custody framework, where collateral is held in segregated wallets, and credit is extended against assets such as Bitcoin, Ether, Solana, and stablecoins. Funds can be routed into trading via the firm’s brokerage services or used for broader liquidity needs.
Demand for credit against crypto holdings has risen over the past year, and this has led exchanges, institutional providers, and DeFi platforms to expand lending offerings tied to digital assets.
Some of the leading players include firms like Anchorage Digital, which, alongside Mezo, has introduced Bitcoin-backed stablecoin loans and short-term yield strategies, allowing institutions to borrow against BTC held in custody while earning returns on locked positions.
Meanwhile, in the exchange segment, platforms like Kraken have rolled out products such as Flexline, offering fixed-term crypto-backed loans, while Coinbase has reintroduced Bitcoin-backed borrowing in the United States, enabling users to access USDC liquidity against BTC collateral.


Zcash has patched a major vulnerability that would have allowed bad actors to drain funds from the protocol’s deprecated Sprout shielded pool.
Summary
- Zcash patched a critical flaw in zcashd nodes that skipped proof verification in the legacy Sprout pool, a bug that could have exposed more than 25,000 ZEC to potential draining.
- The vulnerability remained present from July 2020 until the release of v6.12.0, with no exploitation detected and all user funds confirmed safe.
A disclosure report from security researcher Alex “Scalar” Sol, published on Tuesday, claims that a critical flaw was discovered in zcashd nodes that resulted in skipping proof verification for transactions involving the legacy Sprout pool.
Zcash’s Sprout pool is the original “shielded pool” that launched with the network in 2016. It was the first implementation of zero-knowledge proofs (zk-SNARKs) in a production cryptocurrency, allowing users to send and receive ZEC privately.
Although the pool was closed to new deposits in November 2020, it still holds approximately 25,424 ZEC, which are yet to be migrated to newer shielded pool versions.
According to the disclosure, the vulnerability spanned releases from July 2020 onward but was fixed through v6.12.0, which was released on Tuesday. So far, the flaw has not been exploited, and user funds remain safe.
Major mining pools, including Luxor, F2Pool, ViaBTC, and AntPool, have already deployed the fix by March 26, the report added.
The report added that the Zebra full node implementation was not affected. In the event of an attempted exploit, it would have resulted in a chain fork, acting as an additional safeguard.
Despite the severity of the issue, the Zcash Open Development Team has clarified that the network’s “turnstile” mechanism, which enforces that any coins exiting the Sprout pool must have previously entered it, would have prevented broader supply inflation.
For the Zcash network, this marks the second time a critical, systemic vulnerability has been uncovered within its shielded pools. In 2019, the Zcash team disclosed a “counterfeiting” bug, a flaw in the underlying cryptography that could have allowed an attacker to create an infinite amount of ZEC without detection.


Bitcoin gave back a large portion of its recent gains on Thursday, now trading at $66,700 having lost 2.4% of its value since midnight UTC.
Ether (ETH) performed even worse, tumbling by 4.4% as the broader crypto market struggles to deal with continued risk-off sentiment.
The latest plunge was spurred by U.S. president Donald Trump, who said on Wednesday evening that the war in Iran would continue with extensive strikes on Iran.
“Over the next two to three weeks, we’re going to bring them back to the stone ages where they belong,” he said.
The comments led to an immediate spike in oil prices, with brent crude rising by around 10% to $108 per barrel as U.S. equities diverged.
Nasdaq 100 and S&P 500 futures lost 1.5% and 1.1% respectively while the U.S. dollar increased by 0.5% to above 100 points.
Derivatives positioning
- BTC’s price has dropped over 2% since midnight UTC hours alongside a slightly uptick in open interest in major USD- and USDT-denominated futures. Plus, perpetual funding rates have dropped to their most negative since March 12. This combination suggests that traders are bearish and shorting the falling market.
- In ether’s case, funding rates are most negative since October last year, a sign of strong bias for bearish bets. Meanwhile, bearishness in solana (SOL) is surprisingly more measured despite the overnight hack.
- Privacy-focused zcash (ZEC) and have seen a notable decline in open interest (OI) in 24 hours, a sign of capital outflows.
- Nearly $400 million in futures positions have been liquidated due to margin shortfalls. That’s a 17% increase in losses compared to the previous day.
- Despite renewed risk-off tone, bitcoin and ether’s 30-day implied volatility indices remain flat in recent ranges. It points to orderly selling in the spot market rather than panic.
- There is little scope for panic because traders are already positioned for market swoon. They have been consistently chasing bitcoin and ether put options (downside hedges) since the start of the year. As of writing, bitcoin and ether puts remained pricier than calls across all tenors on Deribit.
- Block flows featured demand for ether straddles, a volatility strategy, and put spreads and bitcoin call spreads.
Token talk
- The worst performing benchmark on Thursday was CoinDesk’s DeFi Select Index (DFX), which lost 5.9% since midnight UTC, closely followed by the CoinDesk Computing Select Index (CPUS) that tumbled by 5%.
- Ethena (ENA) led the downside move as it fell by more than 10% on Thursday, there was also a heavy drawdown among DeFi tokens UNI, LDO, SKY and AAVE – all shedding between 4.2% and 6.5% during Asian and European hours on Thursday.
- Algorand (ALGO) bucked the bearish market trend, rising by around 0.8% on Thursday as it continues its rich vein of form having rallied by 22% in the past week.
- CoinMarketCap’s “altcoin season” index is down from 50/100 to 42/100 since March 30, highlighting relative weakness across the sector.
Coinbase chief legal officer Paul Grewal said the US Digital Asset Market Clarity Act is “moving toward” a markup hearing in the US Senate Banking Committee and could eventually move to a floor vote if senators resolve the stablecoin yield dispute and schedule a markup.
Speaking in a Wednesday interview on Fox Business, Grewal said lawmakers are nearing agreement on core elements of the crypto market structure bill, even as debate continues over stablecoin yield. “I think we’re very close to a deal,” he said.
The remarks point to possible movement on one of the last major sticking points in Senate talks over crypto market structure legislation: whether stablecoin issuers or platforms should be allowed to offer yield or similar rewards. The dispute has helped delay a Senate Banking Committee markup, leaving the broader effort to set federal rules for digital asset oversight still unresolved.
US banks have pushed for restrictions, arguing that such incentives could draw deposits away from traditional institutions and disrupt the banking system. Grewal pushed back on that claim, saying there is no evidence to support fears of deposit flight.
The US House of Representatives passed the CLARITY Act on July 17, 2025. In January, Senate Banking Committee Chair Tim Scott delayed a planned markup, which has yet to be rescheduled.
Related: Crypto investor sentiment will rise once CLARITY Act is passed: Bessent
Trump blames banks for stalling crypto bill
Last month, US President Donald Trump accused banks of undermining efforts to pass crypto market structure legislation, saying they are blocking progress over disagreements on stablecoin yield payments. “The Banks should not be trying to undercut The Genius Act, or hold The Clarity Act hostage,” he wrote.
It was later reported that Trump met privately with Coinbase CEO Brian Armstrong just hours before issuing the statement.

In January, Armstrong said Coinbase could not back the market structure bill “as written,” pointing to draft amendments that would eliminate stablecoin rewards and let banks restrict competition.
Related: CLARITY Act 2026 odds ‘extremely low’ if not passed before April: Exec
CLARITY delay could expose crypto to crackdowns
Last week, Coin Center executive director Peter Van Valkenburgh warned that failure to pass the CLARITY Act could leave the crypto industry vulnerable to a future US administration taking a tougher stance. He argued that rejecting developer protections in favor of short-term business interests risks creating a system shaped by political shifts rather than clear law.
“The point of passing CLARITY is not to trust this administration. It is to bind the next one,” he said.
Magazine: Bitcoin may take 7 years to upgrade to post-quantum — BIP-360 co-author

Omniscient raises $4.1M to replace 150 fragmented intelligence tools

Texas Smoker street food vendor joins Stack Seaburn

Thousands Report Service Disruption Across US


-

 Business7 days ago
Instagram, YouTube Found Responsible for Teen’s Mental Health Struggle in Historic Ruling
-

 NewsBeat6 days ago
The Story hosts event on Durham’s historic registers
-
 Tech7 days ago
Intercom’s new post-trained Fin Apex 1.0 beats GPT-5.4 and Claude Sonnet 4.6 at customer service resolutions
-

 Sports6 days ago
Sweet Sixteen Game Thread: Tide vs Michigan
-
Entertainment3 days ago
Fans slam 'heartbreaking' Barbie Dream Fest convention debacle with 'cardboard cutout' experience
-
 Entertainment5 days ago
Lana Del Rey Celebrates Her Husband’s 51st Birthday In New Post
-
Crypto World2 days ago
Dems press CFTC, ethics board on prediction-market insider trades
-

 Crypto World15 hours ago
Gold Price Prediction: Worst Month in 17 Years fo Save Haven Rock
-

 Tech3 days ago
The Pixel 10a doesn’t have a camera bump, and it’s great
-

 Sports2 days ago
Tallest college basketball player ever, standing at 7-foot-9, entering transfer portal
-

 Tech2 days ago
EE TV is using AI to help you find something to watch
-

 Fashion4 days ago
Amazon Sundays: Soft Spring Layers
-

 Tech3 days ago
Apple will hide your email address from apps and websites, but not cops
-

 Tech2 days ago
How to back up your iPhone & iPad to your Mac before something goes wrong
-

 Crypto World3 days ago
U.S. rule change may open trillions in 401(k) funds to crypto
-

 Tech2 days ago
Flipsnack and the shift toward motion-first business content with living visuals
-

 Fashion7 days ago
En Vogue in Brown Leather and Tailored Neutrals by Atelier Savoir, Styled by J Bolin
-

 Politics3 days ago
Should Trump Be Scared Strait?
-

 Fashion7 days ago
What Are Your Favorite T-Shirts for the Weekend?
-

 Business6 days ago
Chinese universities with military links bought Super Micro servers with restricted AI chips
You must be logged in to post a comment Login