

Crypto World
White House reviews CFTC prediction-market rule as Trump backs federal control



The White House’s regulatory review office is examining a proposed Commodity Futures Trading Commission (CFTC) rule on prediction markets, according to a federal filing that could shape how platforms such as Kalshi and Polymarket operate across the U.S.
A RegInfo.gov entry shows that the proposal was received by the Office of Information and Regulatory Affairs on May 26 under Executive Order 12866, triggering a review of what the CFTC describes as a proposed rule on “Prediction Markets.” The filing does not include the text of the proposed rule.
The move marks one of the clearest signs yet that the CFTC is preparing a broader federal framework for event contracts, following months of legal and political battles over sports and election markets.
Illinois, New Jersey and other states have argued that sports-linked event contracts effectively function as online betting markets. Kalshi and the CFTC have countered that designated contract markets regulated under federal commodities law fall under the agency’s exclusive authority.
The executive order governs how major federal regulations are vetted before publication, requiring agencies to submit significant rules for economic and policy analysis. OIRA, a division within the Office of Management and Budget, oversees the process.
The timing comes days after President Donald Trump publicly backed the CFTC’s authority over prediction markets, as CoinDesk previously reported, calling it “critically important” that the agency retain “exclusive authority” over the sector in a Truth Social post.
The proposal follows a March advance notice of proposed rulemaking in which the CFTC sought public comment on which prediction market contracts may be prohibited as “contrary to the public interest,” including contracts tied to elections, gaming, and sports.



Morgan Stanley filled in the blanks on its two single-asset crypto trusts last Thursday, filing amended S-1 registration statements for a spot Solana Trust and a spot Ethereum Trust that now identify the custodians, sponsor fee and tickers left open in the original January filings. The Solana… Read the full story at The Defiant

Ethereum trades at $1,733.20 after a 0.10% daily decline, with analysts now watching the $1,060 level if support at $1,731 fails. The drop coincides with $180 million in Bitcoin long liquidations hitting leveraged traders as BTC slides to $63,952, down 0.44% over 24 hours. In this environment of spot-market stress, the Gruntle ($GRUNTLE) presale has quietly accumulated $106,570 at a fixed entry price of $0.000637, positioning itself as an alternative for buyers seeking asymmetric upside without the volatility of open-market positions.
Next 100x Crypto 2026: ETH Tests $1,731 Support as Analysts Eye $1,060 Level
Ethereum’s 18% decline over the past 30 days has brought the second-largest crypto to a critical technical zone. RSI sits at 42.7, indicating neither oversold nor overbought conditions, but the price remains below both the 50-day SMA at $1,979 and the 200-day SMA at $2,357. CoinCentral’s analysis of ETH’s $1,700 support level notes that a sustained break below this zone could accelerate selling toward the $1,060 area, a level not seen since the 2023 bear market bottom.
The technical picture contrasts sharply with Gruntle’s presale mechanics. While ETH holders absorb mark-to-market losses, $GRUNTLE buyers lock in a fixed $0.000637 entry that does not fluctuate with spot volatility. The current round has raised $106,570 of its $125,664 target at 84.8% filled, with the price scheduled to rise to $0.000639 when Round 12 opens.
BTC Longs Liquidated for $180M as Traders Debate $60K Sweep
Bitcoin’s slide to $63,952 triggered $180 million in long liquidations over the past 24 hours, according to aggregated derivatives data. The wipeout hit leveraged bulls who had positioned for a breakout above $67,000, with BTC now trading 5.2% below its 20-day high of $67,420. RSI at 40.8 suggests weakening momentum, though the price remains above the recent 20-day low of $59,070.
The liquidation cascade underscores the risk embedded in leveraged spot and derivatives trading. Gruntle’s presale model, by contrast, offers no leverage and no liquidation risk. Buyers receive a fixed token allocation at the current round price, with settlement occurring at the Phase 3 DEX listing. The presale has attracted $106,570 in raised capital without the volatility that erased $180 million from overextended BTC positions.
XRP Briefly Lost $1.14 Support Before Buyers Drive Rebound
XRP dropped to $1.13 after briefly losing the $1.14 support level, marking a 1.30% decline on the day before buyers stepped in to reclaim the zone. CoinDesk’s report on XRP’s sharp rebound highlights the volatility inherent in mid-cap altcoins, where support breaks can trigger cascading stops before dip buyers emerge. XRP now sits 12.6% below its 20-day high of $1.29, with RSI at 39.9 indicating continued selling pressure.
The XRP price action illustrates the binary risk of spot trading: support either holds or it fails, and the outcome determines whether buyers profit or absorb losses. Gruntle’s presale eliminates that binary during the intake period. The $0.000637 entry holds until Round 11 closes, regardless of what XRP, ETH, or BTC do in the interim.
$GRUNTLE Presale Crosses $106,570 With Anti-Hype Positioning
Gruntle has raised $106,570 in its presale at a current price of $0.000637, with Round 11 now 84.8% filled toward its $125,664 target. The project differentiates itself through deliberate anti-hype positioning: no influencer shilling, no manufactured FOMO, and no promises of guaranteed returns. In a market saturated with meme coins promising moonshots, Gruntle’s deadpan capybara mascot and government-terminal aesthetic offer a different kind of credibility.
The project has been audited by CredShields on May 13, 2026, with the full report available via Gruntle’s CredShields audit. The ERC-20 token contract at 0x959583858090bba7e0311e4bD944311DCD827038 has been verified, and the multi-sig treasury is live. These infrastructure pieces are in place before the Phase 3 DEX listing, not after.
A $1,000 entry at the current presale price of $0.000637 acquires approximately 1,570,000 $GRUNTLE tokens. At a conservative 10x from the presale entry, that position could be worth around $10,000. The math is asymmetric: a small allocation buys a large token count while the price remains at presale entry, not post-listing market price.
Hibernation Staking Pays 5,445% APY (Variable) for Early Entrants
Hibernation Staking currently pays 5,445% APY, computed as each staker’s share of a fixed 250-million-token rewards pool. The APY is variable: it drops as more tokens stake, rewarding early entrants with a larger slice of the pool. As of the latest on-chain data, 4,591,680 tokens are already staked, and the live APY reflects that pool depth.
The staking contract at 0x780dbcbcf0eef53d03248e1561450fe87cfbd561 allows buyers to stake immediately after purchase, compounding yield while waiting for the Phase 3 DEX listing. The mechanism favors early participation: every new staker dilutes the APY for existing positions, creating a genuine incentive to enter before the pool grows larger.
Round 11 at 85% Filled With Hard Cap Mechanics
Round 11 has raised $106,570 of its $125,664 target, reaching 84.8% capacity. The round closes when the cap fills or when the round timer expires, whichever comes first. Once Round 11 closes, the price increases to $0.000639 in Round 12, a 0.3% jump that compounds across the full presale ladder. The listing price is set at $0.000713, representing an 11.9% premium to the current entry.
Check Out the Gruntle Website to Join the Presale
The presale operates alongside active peers in the current cycle. Bitcoin Hyper has raised $32.87 million from 113,462 participants at $0.013682 per token, while Pepeto has accumulated $10.30 million from 36,353 buyers at $0.00000019. Gruntle’s $106,570 raise positions it as a smaller-cap entry point in the same presale cohort, with the fixed-price mechanics and audited infrastructure already in place.
Secure your allocation before Round 11 closes.
FAQ
What is the next 100x crypto 2026 for early-stage returns?
The next 100x crypto 2026 for early-stage returns could emerge from presale-stage entries where buyers lock in fixed prices before public listings. $GRUNTLE offers a $0.000637 entry, Hibernation Staking at 5,445% APY (variable), and a CredShields audit dated May 13, 2026, with $106,570 already raised. Early presale positions may capture asymmetric upside if the token lists at a premium, though all forward-looking returns remain speculative. Details at gruntle.io.
What makes a presale a candidate for the next crypto to explode?
A presale could become a candidate for the next crypto to explode when it combines audited infrastructure, transparent tokenomics, and a clear listing roadmap. $GRUNTLE meets these markers with a verified ERC-20 contract, a 250-million-token staking pool paying 5,445% APY (variable), and Phase 3 DEX listing plans. The current $0.000637 entry holds until Round 11 closes at $125,664 raised.
What makes $GRUNTLE different from other meme coin presales?
$GRUNTLE differentiates through anti-hype positioning: no influencer shilling, no manufactured FOMO, and honest communication about what the token is. The project was audited by CredShields on May 13, 2026, and the presale has raised $106,570 at $0.000637 with Hibernation Staking paying 5,445% APY (variable, decays as more stake). The deadpan capybara mascot reflects the brand’s deliberately unbothered identity.
This article is for informational purposes only and does not constitute financial advice. $GRUNTLE is a meme coin. Cryptocurrency investments carry significant risk. Always conduct your own research before investing.
Disclaimer: This is a Press Release provided by a third party who is responsible for the content. Please conduct your own research before taking any action based on the content.



“Overall this points to a stabilizing but still fragile ETF demand backdrop, where investors are no longer accelerating exits but are gradually repositioning capital, providing a potential floor to downside,” the firm said.
The other notable dynamic is the decoupling of the U.S. two-year Treasury yield, which is sensitive to Fed interest rate expectations, and WTI crude oil futures. While oil prices have collapsed, the two-year yield has strengthened, hovering at 4.21% as of this writing, the highest since February 2025. (Check the Daily Signal.)
The decoupling indicates that oil and geopolitical headwinds for risk assets have been replaced by Fed rate-hike expectations. It’s possible markets expect the second-order effects of the March oil-price spike to keep inflation higher in the near term, raising the likelihood of interest-rate increases.
The Fed’s preferred inflation gauge, the core PCE, is expected to confirm the trend. According to FactSet, it is forecast to have increased 0.37% on the month, lifting the 12-month rate to 3.4%, which would be the highest since May 2024.
Overall, the slower, yet still bleeding ETFs and hawkish hints from bond yields suggest lower odds of a convincing BTC price recovery in the short term.
And there’s also what Strategy, the largest publicly listed BTC holder, does to address concerns about the price volatility of its STRC preferred stock. Stay alert!
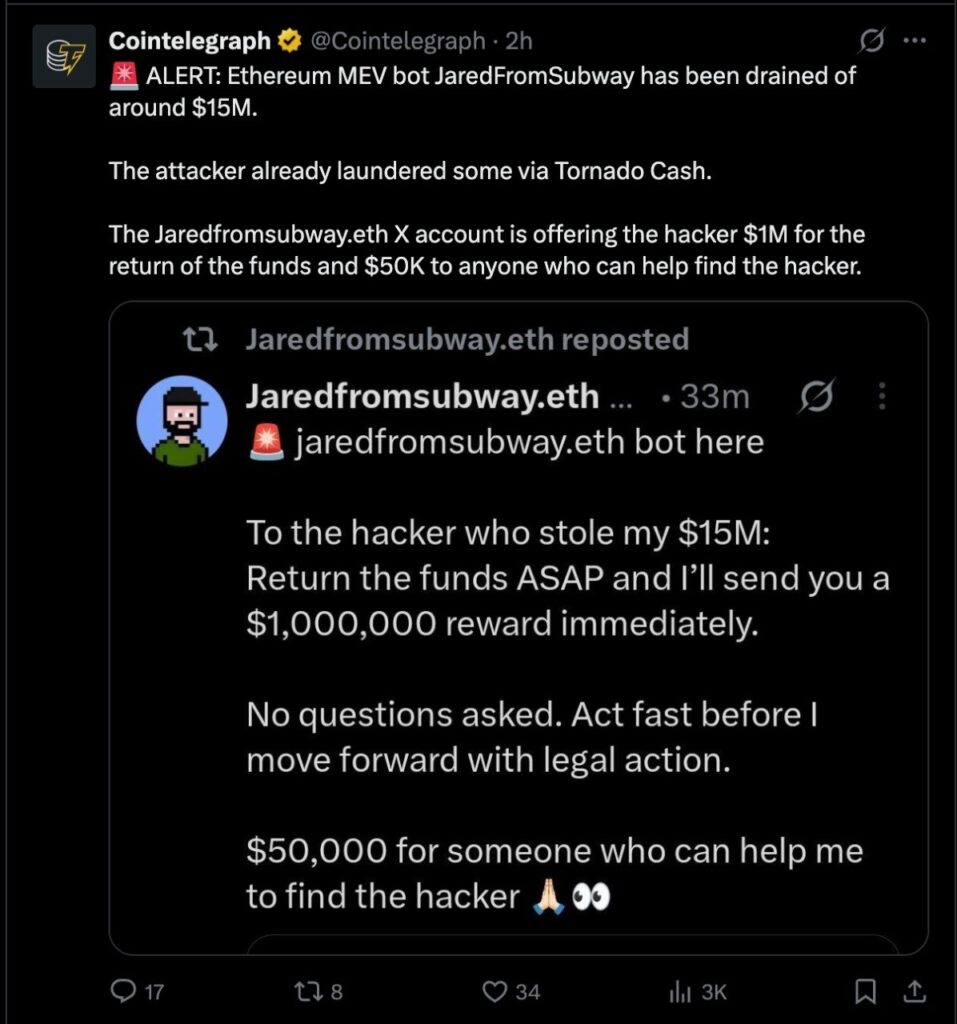
Prolific MEV “sandwich” bot JaredFromSubway.eth lost a total of $7.5 million worth of crypto over the weekend after being lured into a trap over almost one hundred blocks.
In a dramatic case of on-chain karma, the plot to relieve the bot of what many see as its ill-gotten gains involved fake tokens, small wins and an equally dramatic sting.
Blockchain investigator Specter flagged the suspicious transaction, which saw approximately 1,475 WETH ($2.6 million), $2.9 million USDC, and $2 million USDT drained from JaredFromSubway.eth’s bot.
Read more: JaredFromSubway.eth sandwich attacked Vitalik Buterin
The ‘victim’
The victim address, labelled “jaredfromsubway: MEV Bot 2” on block explorer Etherscan, has been active since August 2024 and is the operator’s second iteration.
Between the two bots, and 6.4 million transactions, the operator has made millions of dollars by “sandwiching” on-chain trades.
This process involves scanning the network’s mempool of pending transactions before front-running and back-running user trades. The front-run manipulates swap prices, while the back-run makes a profit off the difference, paying block builders a tip to be included at the right position in the block.
As transaction fees on Ethereum have dropped, sandwichers often target increasingly small wins, such as JaredFromSubway’s attack on Ethereum co-founder Vitalik Buterin last month.
The bot operator’s choice of name is a dark nod to the popular sandwich shop’s erstwhile mascot Jared Fogle, who was later discovered to be a sex offender.
Read more: Explained: How JaredFromSubway.eth still sandwich attacks victims
The campaign
The attacker specifically targeted JaredFromSubway’s bot, luring it in with small, profitable sandwich attacks on fake attacker-created token pairs.
A report from Yearn developer Banteg describes how, over the course of 97 blocks, the bot was offered “small real-token profits,” on “profitable fake-DEX arbitrage” opportunities.
However, during the transactions, the bot contract inadvertently “approved attacker-controlled child contracts to spend real WETH, USDC, and USDT,” which were not consumed during the sandwiches, nor revoked afterwards.
The attacker was then able to harvest the pre-approved tokens in the final drain transaction.
Read more: Aztec Network hit by second hack this week as escapeHatch drained of $2M
The aftermath
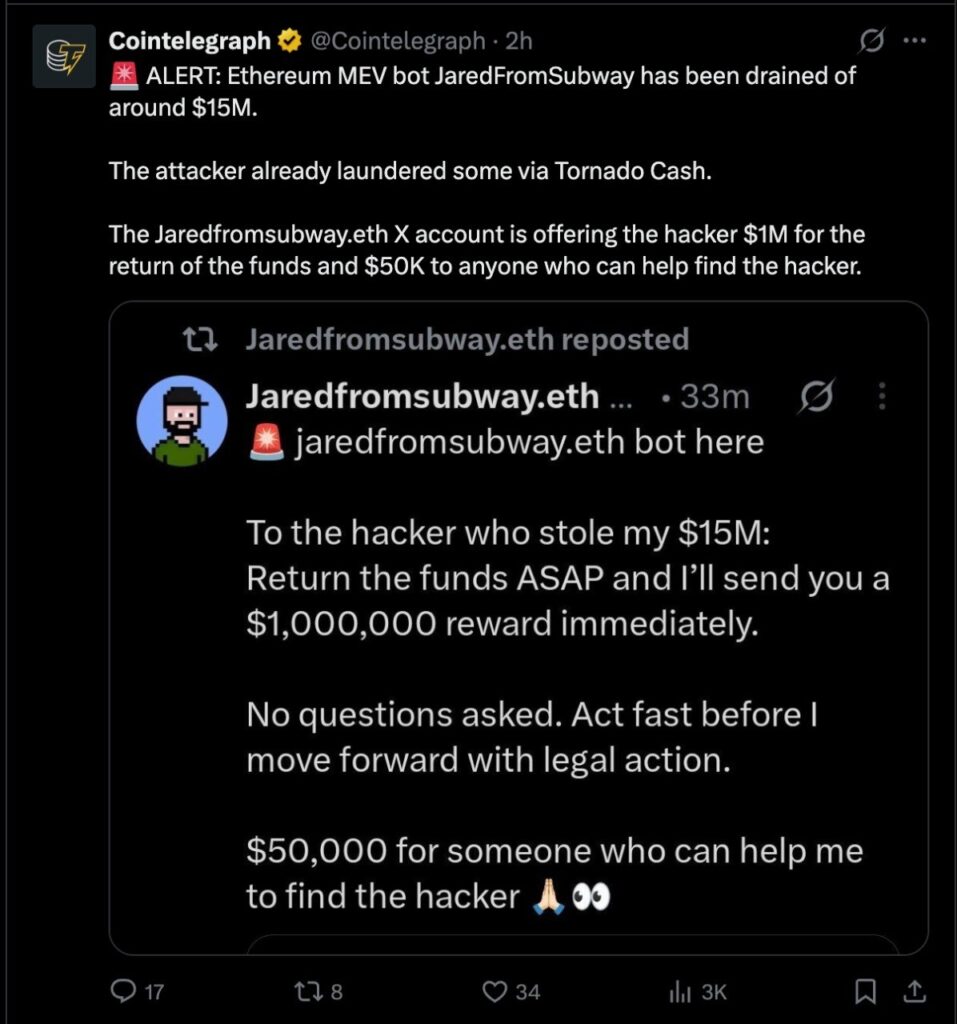
Taking advantage of the news, recently-renamed X handle “jaredsmev” made various scam bounty offers of $1 million to $7.5 million, citing the erroneous, but widely reported total loss of $15 million.
Cointelegraph even reposted one of the scammer’s offers to its 2.9 million X followers, before deleting.
Read more: Cointelegraph says Bitcoin ETF approved despite no proof
In an on-chain transaction from JaredFromSubway.eth, the bot’s real operator sent an input data message to the attacker, with a seemingly genuine bounty offer.
“Well played,” begins the message, before requesting the return of 2150 ETH, equivalent to approximately 50% of the stolen funds, in the next 48 hours.
“Otherwise we will pursue all available legal and law-enforcement remedies,” it threatens.
Other users have reached out to the attacker on-chain, claiming to be victims of JaredFromSubway’s MEV operations, and requesting reimbursement of their supposed losses.
One called the attacker “our Robin Hood in a White Hat.” Others were less subtle.
Got a tip? Send us an email securely via Protos Leaks. For more informed news and investigations, follow us on X, Bluesky, and Google News, or subscribe to our YouTube channel.


Perpetual futures, or perps, are the most traded instrument in crypto. They let you bet on price with leverage and never expire, held in line with the spot market by a clever fee called the funding rate. They are powerful, they are dangerous, and in 2026 they are finally arriving onshore in the United States.
Summary
- Perpetual futures let traders take leveraged long or short positions without an expiry date, using funding rates to keep prices aligned with the spot market.
- Funding payments flow between longs and shorts, while leverage and margin determine how quickly a position can be liquidated during adverse price moves.
- Crypto perps have begun entering regulated U.S. markets in 2026, bringing the industry’s most traded derivative product into a new regulatory framework.
A perpetual future, usually shortened to perp, is a derivative contract that lets a trader bet on the price of an asset with leverage and hold that bet open indefinitely, because unlike a traditional futures contract it has no expiration date. The price of a perp is kept tethered to the real spot price of the underlying asset by a recurring payment between traders called the funding rate, which nudges the contract back toward the market whenever it drifts.
Perps let you go long if you think the price will rise or short if you think it will fall, control a position far larger than the cash you put down, and never worry about a contract expiring out from under you. That combination has made perpetual futures the single most heavily traded product in all of crypto, and also one of the fastest ways to lose money in it.
This guide explains perpetual futures in plain English, with no derivatives background assumed. It covers what a perp actually is, the traditional futures contract it evolved from, the funding-rate mechanism that makes the whole thing work, how leverage and margin lead to liquidation, the difference between mark price and index price that decides when you get liquidated, where perps are traded and the major shift happening in the United States in 2026, the real risks that blow up accounts, and why this instrument came to dominate crypto trading.
By the end, you will understand not just how to read a perp but why it behaves the way it does, and why even regulators who now permit it call it a product to treat with respect.
What a perpetual future actually is
The name packs two ideas together. “Future” means it is a contract whose value is derived from the price of something else, a derivative, where you agree to gain or lose money based on how that price moves without necessarily owning the asset. “Perpetual” means the contract never expires, so you can hold the position open for as long as you like and your margin allows.
That second word is the whole innovation. A perp lets you take a leveraged bet on, say, Bitcoin, and simply keep it open, adjusting or closing whenever you choose, with no expiry forcing your hand. You can go long, profiting if the price rises, or short, profiting if it falls, and because the contract is leveraged, you can put down a fraction of the position’s value as collateral, called margin, and control the full size.
If you post one thousand dollars at ten times leverage, you control a ten-thousand-dollar position, so a ten percent move in your favor doubles your collateral, and a ten percent move against you wipes it out. The perp itself is settled in cash or a stablecoin, so you never have to take delivery of the underlying asset; you are trading the price, not the coin.
The product was invented by the crypto exchange BitMEX in 2016, and it spread because it fit crypto perfectly: traders wanted leverage, they wanted to bet in both directions, and they did not want the friction of contracts that expire and have to be rolled over. The perp gave them a single instrument that did all of that, and the rest of the market followed.
Futures first: the contract perps evolved from
To see what makes a perp special, it helps to understand the ordinary futures contract it grew out of, because the perp is essentially a futures contract with its biggest inconvenience removed.
A traditional futures contract is an agreement to buy or sell an asset at a set price on a specific future date. If you buy a Bitcoin futures contract expiring in three months, you are locking in a price now for settlement then, and when that date arrives, the contract expires and settles.
This is useful, and it is how commodities and financial futures have worked for a very long time, but it has an awkward feature for someone who simply wants ongoing leveraged exposure: the contract ends. If you want to keep your position past the expiry, you have to “roll” it, closing the expiring contract and opening a new one further out, paying costs and friction each time. Traditional futures also have a “basis,” a gap between the futures price and the spot price that opens and closes as expiry approaches, which adds complexity.
The perpetual future strips out the expiry entirely. There is no settlement date, so there is nothing to roll and no countdown forcing you to act. But removing the expiry creates a new problem. In a normal future, the looming settlement date is what drags the contract price toward the real spot price, because at expiry they must converge.
Take away the expiry, and you remove the very thing that keeps the contract honest. So the designers of the perp had to invent a replacement, a mechanism that would keep a never-expiring contract anchored to the spot price using market forces instead of a deadline. That mechanism is the funding rate, and it is the beating heart of every perp.
The funding rate: the mechanism that keeps perps honest
The funding rate is the single most important concept in perpetual trading, and it is the part beginners most often miss until it quietly costs them money.
Because a perp never expires, nothing automatically forces its price to match the spot price of the underlying asset. Left alone, a perp could drift well above or below the real market. The funding rate fixes this by creating a recurring payment, typically every eight hours, between the two sides of the market.
When the perp trades above the spot price, meaning demand to be long is too strong, the funding rate is positive, and longs pay shorts. When the perp trades below the spot price, meaning shorts are crowded, the funding rate is negative, and shorts pay longs. The payment is a small percentage of position value, and it flows directly between traders, not to the exchange.
The effect is elegant. If too many people are long and the perp price runs above spot, longs must keep paying a fee to shorts, which makes holding a long more expensive and encourages traders to close longs or open shorts, pushing the price back down toward spot. The mechanism is self-correcting: whichever side is crowded pays the other, and that cost pulls the contract back in line with the real market.
This is why a perp tracks spot closely without ever expiring. It also turns the funding rate into a live sentiment gauge, because a strongly positive rate tells you the market is aggressively long and paying for the privilege, while a negative rate tells you shorts dominate. Traders watch funding both as a cost they must pay or earn and as a signal of how the crowd is positioned. Even regulators who have studied perps note that funding rates, far from being a trick, perform roughly the same economic job as the costs of repeatedly rolling expiring futures, just packaged differently.
Leverage, margin, and the liquidation that follows
Leverage is what makes perps thrilling and what makes them lethal, so it is worth being precise about how it actually works and where it ends.
When you open a perp position, you post collateral, called margin, and the exchange lets you control a position several times larger. The multiple is your leverage. At five times leverage, a thousand dollars of margin controls five thousand dollars of exposure; at twenty times, it controls twenty thousand. Leverage magnifies both directions equally. A favorable move multiplies your gains against your small margin, and an unfavorable move multiplies your losses just as fast. The crucial consequence is that with leverage you do not need the price to go to zero to lose everything. You only need it to move against you by a fraction equal to your margin.
That is where liquidation comes in. Every leveraged position has a liquidation price, the level at which your losses have eaten through your posted margin. If the market reaches that price, the exchange automatically closes your position to prevent your losses from exceeding your collateral, and your margin is gone. At ten times leverage, a roughly ten percent move against you is enough to trigger liquidation; at twenty-five times, about four percent will do it; at one hundred times, a one percent flicker can end the trade.
Offshore venues have historically offered enormous leverage, and the extreme figures sometimes quoted, fifty, one hundred, even more, are a hallmark of those unregulated platforms. Regulated perpetual products in the United States are subject to the same leverage limits as other regulated futures, which are far lower. High leverage does not make you more likely to be right; it only makes you more likely to be liquidated before you are proven right, and that distinction has emptied more accounts than any single price crash.
Mark price versus index price: why you actually get liquidated
A detail that confuses many new perp traders, and burns some of them, is that the price used to decide your liquidation is not always the last traded price on the exchange. Understanding this can be the difference between a survivable trade and an avoidable wipeout.
Exchanges track two prices. The index price is an average of the spot price across several major markets, a clean reading of what the asset is really worth right now. The mark price is a smoothed, fair value derived largely from that index, and it is the price the exchange uses to calculate your unrealized profit, your losses, and your liquidation.
Why not just use the last traded price on the perp itself? Because the last traded price on a single venue can spike or crash briefly during a moment of thin liquidity or a manipulation attempt, and if liquidations were based on that, a momentary wick could liquidate thousands of traders unfairly. By marking positions to a broad index-based fair value instead, the exchange protects traders from being liquidated by a fleeting, unrepresentative blip on one order book.
The practical lesson is that you are liquidated when the mark price, not necessarily the screaming candle on the chart, reaches your liquidation level. Most of the time, mark and last price are nearly identical, but in violent moments they can diverge, and knowing which one governs your position is part of trading perps without nasty surprises. It is also why checking your exact liquidation price before entering a trade, and giving yourself a wide margin of safety, matters far more than guessing where the price “should” go.
Where perps are traded, and the 2026 shift onshore
For most of their history, perps lived offshore, outside the reach of United States regulators, and that map is being redrawn right now in a way every trader should understand.
On centralized exchanges, perps are a flagship product, with venues such as Binance, Bybit, OKX, Deribit, and the original inventor BitMEX offering deep perpetual markets in hundreds of assets. A newer wave runs perps fully on-chain through decentralized exchanges, where trades settle on a blockchain, and users keep custody of their funds.
Hyperliquid has risen to dominate on-chain perpetual trading, alongside established names like dYdX and GMX, proving that a decentralized venue can match the speed and depth traders once thought only centralized platforms could provide. For years, United States traders were largely walled off from regulated crypto perps, pushing demand offshore.
That wall is now coming down. In May 2026, the Commodity Futures Trading Commission approved a Bitcoin perpetual futures contract from the prediction-market exchange Kalshi, the first regulated crypto perp cleared for United States traders, and Kalshi quickly expanded into perps tied to Ethereum, XRP, and others, reporting more than five billion dollars in trading volume within weeks. Coinbase secured its own regulated route to offer perpetual products domestically.
The arrival has not been smooth. The CME Group, the giant traditional derivatives exchange, sued the CFTC, arguing that perpetual futures should be regulated as swaps under the Dodd-Frank Act rather than as ordinary futures, and that the regulator bypassed proper procedure.
The CFTC’s chair has pushed back publicly, arguing that nothing in the law requires a futures contract to have a fixed expiration date, that regulated perps face the same leverage limits as other United States futures rather than the extreme offshore multiples, and that funding rates are a legitimate pricing mechanism. However that legal fight resolves, the direction is clear: the most popular instrument in crypto trading is moving from the offshore shadows into regulated American markets, and the rules for it are being written in real time.
The risks: why perps blow up accounts
Perps deserve their fearsome reputation, and an honest guide has to be blunt about why so many traders lose, because the dangers are structural, not just a matter of bad luck.
The first and largest risk is leverage itself. The same multiplication that makes a winning perp trade so satisfying makes a losing one fatal, and at high leverage a small, ordinary price move is enough to liquidate you entirely, which is why most accounts that chase big leverage do not last. The second is liquidation cascades.
When prices move sharply, waves of leveraged positions hit their liquidation prices at once, and the forced selling or buying pushes the price further in the same direction, triggering still more liquidations, a self-reinforcing spiral that can turn a modest move into a violent one and catch even careful traders. The third is funding cost. Holding a position on the crowded side of the market means paying funding every few hours, and over time that steady drain can quietly erode or erase a position that the price action alone would have left profitable.
The fourth is the psychological trap: perps are available around the clock, they encourage constant action, and the leverage makes every move feel urgent, which pushes traders toward overtrading, revenge trading after a loss, and holding losers too long. The fifth, on offshore venues especially, is platform and counterparty risk, because you are trusting the exchange’s solvency, its liquidation engine, and its honesty with your collateral.
The uncomfortable summary is that perps are a professional’s instrument that retail traders can access with one tap, and the gap between those two facts is where the damage happens. The product is not a scam, and the mechanics are sound, but the combination of high leverage, constant availability, and human emotion is genuinely hazardous, and that is true no matter how confident any individual trade feels.
A worked example: one long trade, from open to liquidation
Numbers make the danger concrete in a way definitions cannot, so walk through a single leveraged trade step by step, because every concept in this guide shows up in the life of one position.
You have one thousand dollars, and you are convinced Bitcoin is about to rise. You open a long perp at ten times leverage, so your one thousand dollars of margin now controls a ten thousand dollar position.
The exchange shows you a liquidation price roughly ten percent below where you entered, because a ten percent move against a ten-times position consumes your entire margin. You are also told the funding rate is positive, meaning longs are crowded, and you will pay a small fee to shorts every eight hours for as long as you hold. The trade is on.
Suppose Bitcoin rises five percent. Your position gained five percent of ten thousand dollars, or five hundred dollars, which is a fifty percent return on your one thousand dollar margin. This is the seduction of leverage: a modest move produced an outsized gain. Now suppose instead that Bitcoin falls.
At a four percent drop, you are down four hundred dollars and nervous. At a move near ten percent against you, the mark price reaches your liquidation level, the exchange automatically closes the position, and your one thousand dollars is gone. Notice what did not happen: Bitcoin did not crash, it did not go to zero, it simply moved ten percent, an ordinary day in crypto, and your account was wiped out.
Had you used two times leverage instead of ten, the same ten percent drop would have cost you two hundred dollars, painful but survivable. Had you used one hundred times leverage, a one percent flicker would have ended you.
Layer in the funding cost and the picture sharpens further. If you held that crowded long for several days, you paid funding every eight hours the whole time, a steady drain that eats into gains and deepens losses. And if the market dropped sharply, your liquidation might have been one of thousands firing at once, the forced selling pushing the price down faster and triggering still more liquidations around you. One trade, and you have lived through leverage, margin, the liquidation price, the mark price, funding cost, and a liquidation cascade. That is why experienced traders obsess over position size and liquidation distance before they ever think about where the price is going.
Why perps took over crypto trading
For all the danger, perps did not come to dominate by accident, and understanding why explains a great deal about how crypto markets actually function. A perp gives a trader almost everything they could want in a single instrument: leverage to amplify a view, the ability to profit in both rising and falling markets, no expiry to manage, a price kept honest by funding, and deep liquidity that makes entering and exiting easy. For speculators, it is the sharpest tool available. For sophisticated participants it is also a hedging instrument, a way to offset the risk of a spot holding or to manage exposure without buying or selling the underlying coin. That versatility is why perpetual futures now account for the large majority of all crypto trading volume, dwarfing the spot market most newcomers assume is the main event.
The instrument that BitMEX dreamed up in 2016 has become the center of gravity of crypto markets, and in 2026 it is crossing from the unregulated fringe into the regulated mainstream, with traditional exchanges fighting over how it should be classified. That trajectory tells you something important: perps are not a passing fad but a durable financial innovation that traditional finance is now scrambling to adopt and contain. The right way to approach them is with respect. Understand the funding rate, know your liquidation price, treat leverage as the dangerous tool it is, and never confuse the thrill of a leveraged win with skill. The traders who survive perps are the ones who understand the machinery before they ever pull the lever.
Frequently Asked Questions
What is a perpetual future in simple terms?
A perpetual future, or perp, is a contract that lets you bet on the price of an asset with leverage and hold the bet open with no expiration date. You can go long if you think the price will rise or short if you think it will fall, and you post a fraction of the position’s value as collateral, called margin, to control a much larger position. The perp’s price is kept close to the real spot price by a recurring payment between traders called the funding rate. It settles in cash, so you never own the underlying asset.
How does the funding rate work?
Because a perp never expires, nothing automatically keeps its price matched to the spot market, so the funding rate does that job. Roughly every eight hours, a payment flows between longs and shorts. When the perp trades above spot, longs pay shorts, which makes being long costlier and pushes the price back down. When it trades below spot, shorts pay longs. The payment goes between traders, not to the exchange, and it both keeps the perp anchored to spot and signals which side of the market is crowded.
What is liquidation in perpetual trading?
Liquidation is when the exchange automatically closes your leveraged position because your losses have consumed your posted margin. Every leveraged position has a liquidation price, and if the market reaches it, your collateral is gone. The higher your leverage, the smaller the move needed to liquidate you: at ten times leverage about a ten percent move against you is enough, and at one hundred times around one percent will do it. Liquidations are usually triggered by the mark price, a fair value based on a broad index, not the last traded price on a single venue.
Why are perps so risky?
The core risk is leverage, which multiplies losses as fast as gains, so a small price move can wipe out a highly leveraged account. Liquidation cascades can make sharp moves worse, as forced closures push the price further and trigger more liquidations. Funding costs can quietly erode a position held on the crowded side of the market. Perps are also available around the clock and encourage emotional overtrading, and on offshore venues you take on the platform’s solvency and honesty as additional risks.
Where can you trade perpetual futures?
Perps trade on centralized exchanges such as Binance, Bybit, OKX, Deribit, and BitMEX, and increasingly on decentralized exchanges that settle on-chain, where Hyperliquid, dYdX, and GMX are leading venues. For years, United States traders were largely excluded from regulated crypto perps, but that changed in 2026 when the CFTC approved a Bitcoin perpetual contract from Kalshi, and Coinbase gained a regulated route, bringing perps onshore even as exchanges like CME dispute how they should be classified.
Who invented perpetual futures?
The perpetual swap was created by the crypto exchange BitMEX in 2016. It caught on quickly because it suited crypto traders perfectly: it offered leverage, allowed betting in both directions, and removed the expiry and rollover hassle of traditional futures, all in a single instrument anchored to spot by the funding rate. The design spread across the industry, and perpetual futures now account for the majority of all crypto trading volume.
This article is educational and does not constitute financial or investment advice. Perpetual futures are high-risk leveraged products, and the rules governing them, especially in the United States, are changing quickly. As of June 22, 2026, verify current product details, leverage limits, and regulatory status with official sources, and never trade with money you cannot afford to lose.


MoneyGram has joined the Solana ecosystem as a network validator and participant in the Solana Developer Platform, expanding the payments company’s blockchain infrastructure strategy beyond stablecoins and payment services.
Summary
- MoneyGram has become a validator on the Solana blockchain and joined the Solana Developer Platform as it expands its blockchain payments strategy.
- The company now operates official validator nodes on Solana, Tempo and Midnight while continuing to build stablecoin based payment services.
- The move follows MoneyGram’s recent launch of its MGUSD stablecoin and broader efforts to integrate blockchain infrastructure into global money transfers.
According to a June 22 announcement from MoneyGram, it now operates an active validator on the Solana blockchain, where it stakes SOL, processes transaction blocks, and contributes to network security and performance. The company also joined the Solana Developer Platform, a development environment designed for institutions building financial products on Solana.
The company described the move as the next stage of a blockchain strategy that has become part of its treasury, product development and payments operations over the past five years.
MoneyGram expands blockchain infrastructure role
Luke Tuttle, Chief Product and Technology Officer at MoneyGram, said operating a validator places the company directly within Solana’s consensus process and allows it to help secure the network at the protocol level.
“We help run the rails we move money on,” Tuttle said, adding that MoneyGram is also developing products intended to support money movement across different forms of value.
Sheraz Shere, General Manager of Payments and Commerce at the Solana Foundation, said MoneyGram’s participation demonstrates how organizations involved in global payments are becoming active members of blockchain networks as more payment activity moves onchain.
MoneyGram said it joined the Solana Developer Platform alongside institutions that include Mastercard. The company said the platform provides tools to build and scale compliant financial products on Solana.
Anthony Soohoo, Chairman and CEO of MoneyGram, said blockchain infrastructure has become a core component of the company’s payment systems and that future development efforts will build on that foundation.
“We believe the future of global money movement will be built on open, interoperable stablecoin rails that anyone, anywhere can access,” Soohoo said.
The company did not announce any new payment products tied to Solana but said its participation in the network forms part of a long-term effort to support open blockchain infrastructure for global money transfers.
Follows stablecoin and validator expansion
The Solana announcement comes weeks after MoneyGram launched MGUSD, its own U.S. dollar stablecoin, on the Stellar blockchain.
MoneyGram introduced the stablecoin on June 2 through a partnership with Bridge, a Stripe-owned company that serves as the issuer. M0 provides the infrastructure used to mint and burn the token, while Fireblocks supplies custody services.
MGUSD became the latest addition to a blockchain payments strategy that has expanded through partnerships with Stellar, Crossmint, Fireblocks and Kraken. MoneyGram has also introduced stablecoin-based remittance services, crypto-to-cash withdrawals and digital dollar products across multiple markets.
The company previously became an anchor remittance validator on the Tempo blockchain and was named a validator for Midnight, Cardano’s privacy-focused sidechain. Solana now becomes the third blockchain network where MoneyGram operates an official validator.
MoneyGram also worked with Ripple between 2019 and 2021, using RippleNet and XRP-based On-Demand Liquidity products before the partnership ended following the U.S. Securities and Exchange Commission’s lawsuit against Ripple.
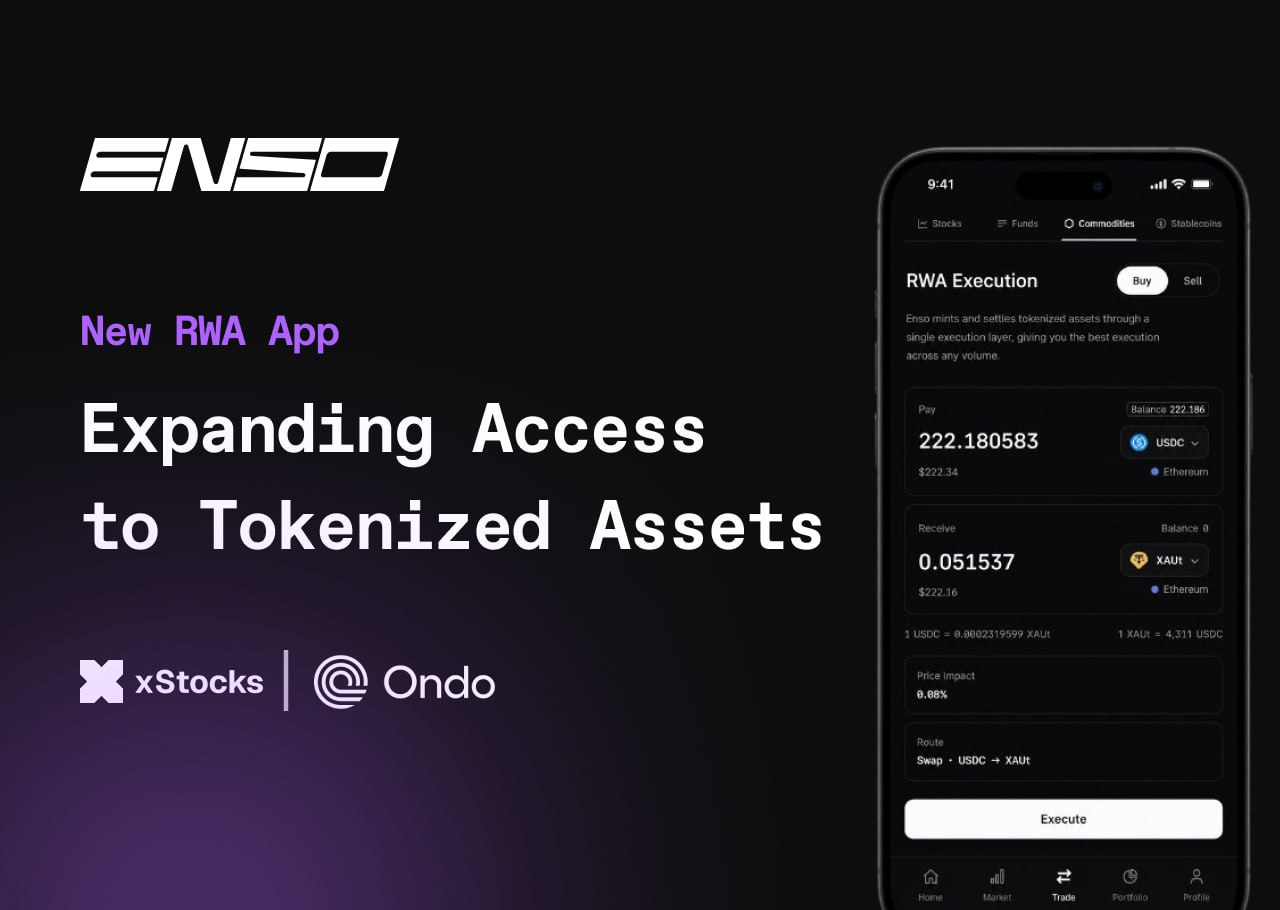
Switzerland-based Web3 development platform Enso has launched a real-world asset (RWA) application offering access to more than 500 tokenized assets through integrations with xStocks, Ondo Finance and Anchorage Digital’s Porto.
Through Enso’s execution layer, users can access tokenized stocks, ETFs, Treasurys, commodities and stablecoins. Ondo will provide tokenized equities, treasury products and capital markets infrastructure, while xStocks will enable access to tokenized equities and ETFs, according to a Monday announcement shared with Cointelegraph.
Available assets include major US companies such as Apple, Microsoft, Nvidia, Amazon, Alphabet, Meta, Tesla and SpaceX.
Enso said bringing these assets under a unified distribution and execution layer would simplify access to tokenized assets across multiple venues and improve the user experience.
The launch adds Enso to a growing field of European crypto firms expanding into tokenized traditional assets. Earlier this year, Austria-based Bitpanda expanded its offering to roughly 10,000 stocks and ETFs, while a number of European digital asset firms have moved to capitalize on growing demand for tokenized securities.
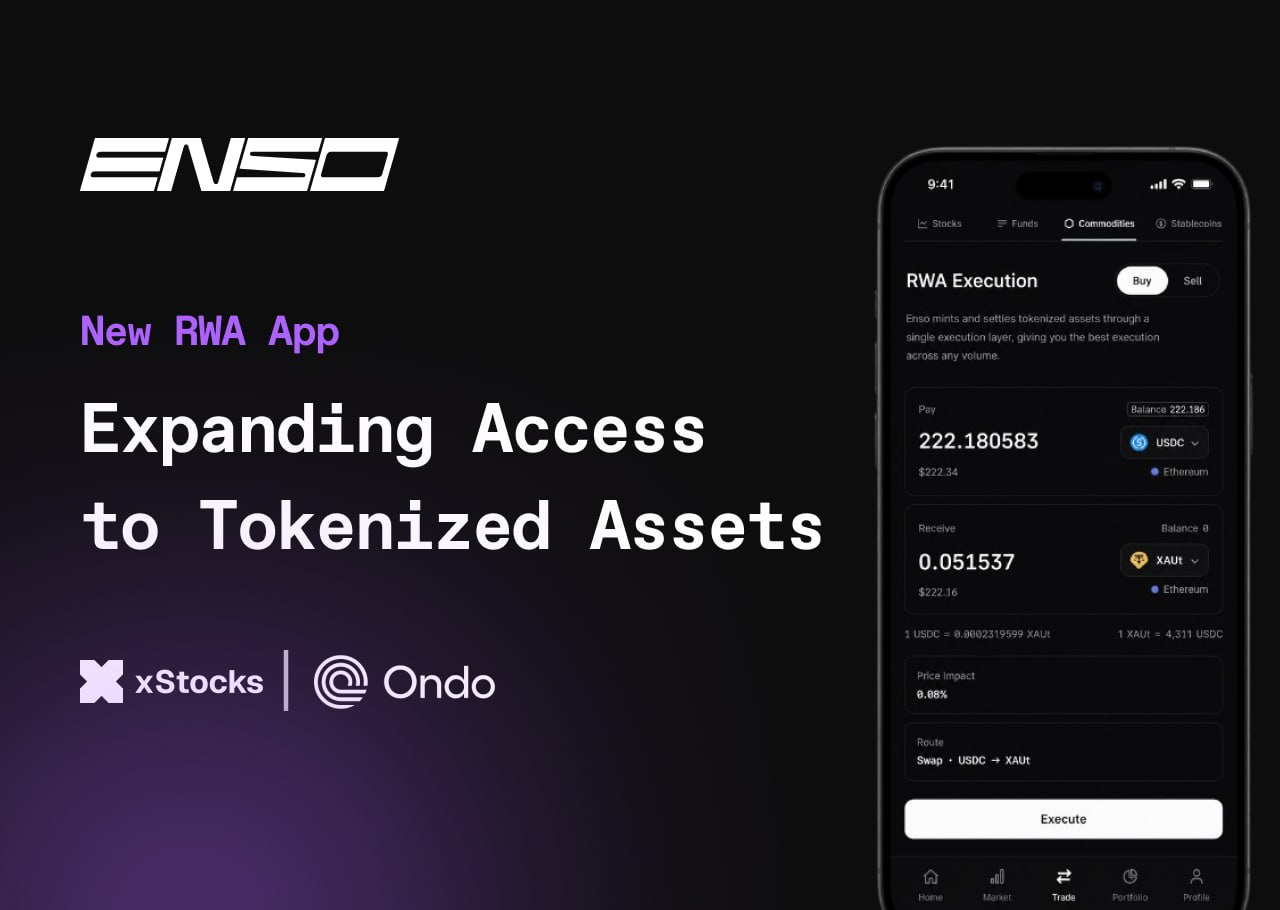
Enso expands access to tokenized assets. Source: Enso
Tokenized US equities have attracted significant demand from investors outside the US, particularly in Europe, Enso co-founder and CEO Connor Howe told Cointelegraph:
The demand concentrates in two places: tokenized access to US markets, with the around-the-clock trading traditional venues can’t match, and yield-bearing dollar assets.”
Tokenized asset holders rise 13% amid growing demand
The launch comes amid growing demand for tokenized assets. The number of tokenized asset holders rose 13.4% over the past 30 days to 930,612, according to data from RWA.xyz. The total value of tokenized assets, however, fell 0.9% during the same period.
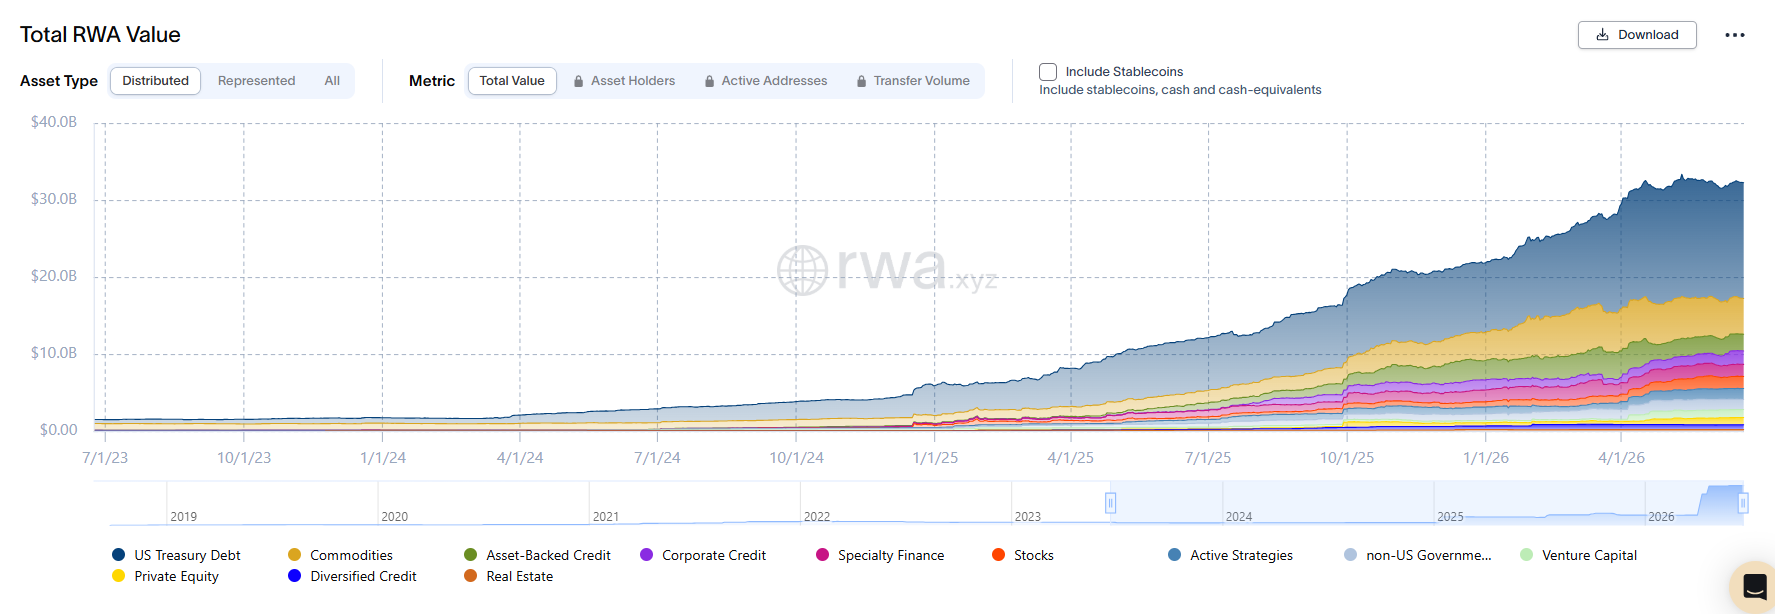
Total RWA value onchain, all-time chart. Source: RWA.xyz
US Treasury debt was the largest tokenized asset category with $15 billion in onchain value, followed by tokenized commodities at $4.6 billion and asset-backed credit at $2.2 billion. Tokenized stocks accounted for $1.6 billion in total onchain value, ranking fifth among tokenized asset categories.
Related: Franklin Templeton, BNP Paribas see tokenization boosting EU’s capital efficiency
Tokenized stocks first crossed $1 billion in total onchain value on March 10, when Ondo accounted for about 58% of the market and xStocks about 24%.
Magazine: Can Robinhood or Kraken’s tokenized stocks ever be truly decentralized?
Crypto World
TradFi fund manager Baillie Gifford introduces Solana, Ethereum tokenized fund with BNY


Baillie Gifford, a 118-year-old investment firm based in the Scottish capital of Edinburgh, unveiled a fixed-income tokenized fund in association with global custody giant BNY, the companies said on Monday.
Baillie Gifford Enhanced Yield Fund (BAGEY) is denominated in dollars, and gives eligible investors access to an actively managed, short-duration portfolio of public corporate bonds using the Ethereum and Solana public blockchains, according to a press release.
The fund is operated through a U.K.-regulated Open-Ended Investment Company (OEIC), a type of collective investment fund structured as a limited liability company that spreads capital from multiple investors across equities or bonds.
The fund, which currently offers a yield of around 7%, will be available to eligible investors in the U.K., Switzerland and Cayman Islands, subject to applicable laws, regulations and distribution restrictions.
Tokenization of real-world assets (RWAs) has taken the traditional finance world by storm, but merely wrapping legacy infrastructure in a digital layer will not fundamentally improve finance, said Theo Golden, head of digital assets and tokenization at Baillie Gifford.

- Solana (SOL) is stuck between $72 support and $76 resistance.
- Solana’s price action shows a tight range with possible short-term rejection risk.
- $90 remains the key breakout level for a stronger bullish move.
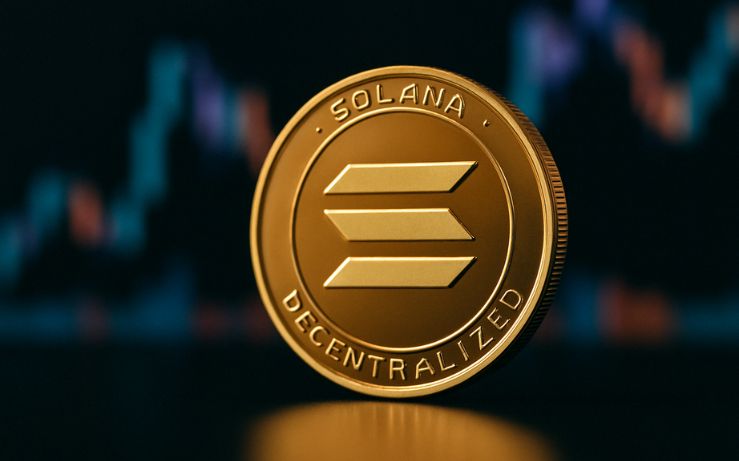
Solana has moved back above the $74 level after a period of sideways trading, putting the asset close to a key technical zone that traders have been watching for several days.
The latest gains come after a gradual recovery from the lower $70 range, where price repeatedly found support before pushing higher.
Is this a correction within a larger bearish trend?
Recent price action shows Solana compressing inside a well-defined range between $62.08 and $76.00.
This range has become the main battleground for buyers and sellers, with repeated reactions near both ends.
On the lower side, support has been consistently observed around $69.50 and $62.08, where buying interest has prevented deeper declines.
On the upper side, resistance is clustered between $76.00 and $83.00, a zone that has rejected multiple upward attempts in recent sessions.

Some short-term technical analysis, however, suggests that the current upward move may still be part of a broader corrective phase within a larger bearish structure.
Market analysis highlights the possibility of a short squeeze toward the $76 region, followed by a rejection if bulls fail to maintain momentum above resistance.
If price is rejected from this zone, downside pressure could return quickly, with initial support at $69.50, followed by the lower boundary near $62.08.
The $76–$90 range is now the key decision area
While short-term resistance sits near $76, higher timeframe analysis places a more important threshold at the $90 level.
This zone has been highlighted as a structural breakout point that could determine whether Solana transitions into a stronger upward trend or remains in consolidation.
A move above $90 could open room toward the $100 to $114 range, which has been identified as the next liquidity zone on higher timeframes.
However, failure to break this level would likely keep price action trapped in a broader corrective environment.
At the same time, one technical interpretation suggests that the current movement is still part of a countertrend rally within a wider bearish cycle in the crypto market.
Under this scenario, upward moves into resistance zones are viewed as temporary expansions designed to capture liquidity before potential reversals.
This conflict between breakout potential and bearish continuation has created a split in analyst expectations.
The $90 level now acts as the line between the continuation of the recovery and renewed consolidation.
Morgan Stanley’s Solana ETF adds a layer of optimism
Beyond technical levels, institutional developments are also shaping sentiment around Solana.
Morgan Stanley has reportedly advanced filings for proposed spot Solana and Ethereum exchange-traded funds (ETFs, with a proposed management fee of 0.14%, which would place them among the lowest-cost crypto ETF proposals currently under consideration.
The structure of these proposed products includes staking mechanisms, in which a large portion of staking rewards would be returned to investors after operational costs are covered.
Although these ETFs are not yet approved, the filings signal increasing institutional interest in structured Solana exposure through regulated financial instruments.


MoneyGram said Monday it has become a validator on the Solana (SOL) blockchain, the latest step in the remittance firm’s ongoing push into crypto infrastructure as it builds payment services around stablecoins.
By operating a validator, MoneyGram will help process transactions and secure Solana’s proof-of-stake network, becoming a key part of the infrastructure that keeps the network running.
The company also joined Solana Developer Platform, an initiative aimed at helping institutions build financial products on the blockchain.
The move comes weeks after MoneyGram unveiled its MGUSD stablecoin on the Stellar blockchain, a sign of the company’s growing commitment to blockchain-based payments infrastructure. After spending several years integrating crypto into remittances and settlement, MoneyGram is now taking a more active role in the networks that support those services.
“MoneyGram has spent the past several years integrating blockchain into our payment infrastructure, and everything we are building now leverages this foundation,” CEO Anthony Soohoo said in a statement. “We believe the future of global money movement will be built on open, interoperable stablecoin rails that anyone, anywhere can access.”
Form 4 AT&T Inc DRC For: 22 June

Morgan Stanley Files Amended S-1s for Spot Solana and Ethereum Trusts
“The View”'s Ana Navarro addresses 'tense moment' of Whoopi Goldberg snapping at her during JD Vance interview


-

 Fashion3 days ago
Weekend Open Thread: Miami – Corporette.com
-
 Tech6 days ago
The Adder At The Heart Of Intel’s 8087 FPU
-

 Entertainment2 days ago
Renter of Home in Anne Heche Crash Denies Settlement With Son
-

 Business2 days ago
Soccer-U.S. defends Iran World Cup travel restrictions, says discussions ongoing
-
 Business2 days ago
Wall Street Week Ahead: Investors see Micron earnings as pulse check of AI rally momentum
-
 Politics4 days ago
BBC Reporter Discusses Cross Party Criticism Of Trumps Iran Deal
-

 Crypto World3 days ago
HIVE shares jump as $220M AI deal speeds Bitcoin mining pivot
-

 Crypto World2 days ago
Jake Chervinsky accuses CME of protecting derivatives monopoly
-
 Crypto World2 days ago
Can Charles Hoskinson Really Rescue Cardano?
-

 Sports4 days ago
FIFA World Cup 2026: Canada beat 9-men Qatar 6-0 to register first ever win | FIFA World Cup 2026
-

 Business2 days ago
MHP SE 2026 Q1 – Results – Earnings Call Presentation (OTCMKTS:MHPSY) 2026-06-20
-

 Business4 days ago
Brexit cost 6% of UK economy, Bank of England company data suggests
-

 Crypto World4 days ago
Anthropic’s Dario Amodei Urged AI Unity at G7, Even as US Banned His Models
-

 Crypto World7 days ago
Robinhood opens AI-powered trading to all users, sending HOOD stock past $100
-

 Tech3 hours ago
Microsoft accidentally kills epic Outlook email threads
-

 Tech5 days ago
Weeks Of In-The-Field Testing And A Verdict
-

 Politics2 days ago
Andy Burnham and the meaning of Makerfield
-

 Tech4 days ago
Adobe adds its AI assistant to Premiere, Illustrator and InDesign
-
 Crypto World4 days ago
Iren (IREN) Stock Surges on Jefferies Buy Rating: AI Infrastructure Play Gains Momentum
-
 Tech1 day ago
Signal’s Meredith Whittaker says AI chatbots ‘are not your friends’ and calls Copilot agents a backdoor
You must be logged in to post a comment Login