
Crypto World
Why Is the US Stock Market Down Today?
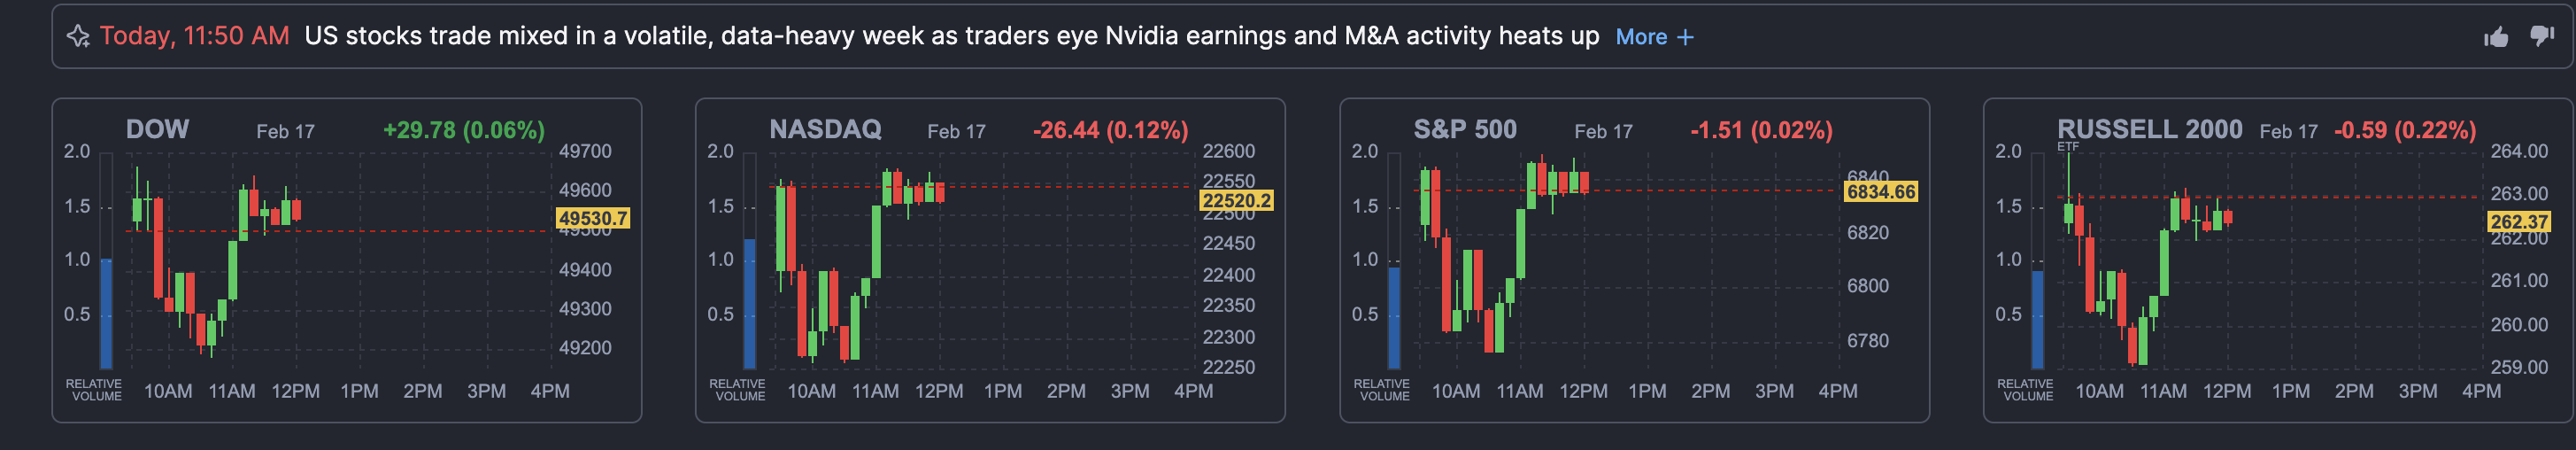
The US stock market opened lower on February 17, 2026. It is the first session after Presidents’ Day, with the S&P 500 trading around 6,840 at press time. The Index is down approximately 0.65% (around 44 points) from Friday’s high, but up almost 0.58% since today’s open. This hints at buyers stepping in across sectors.
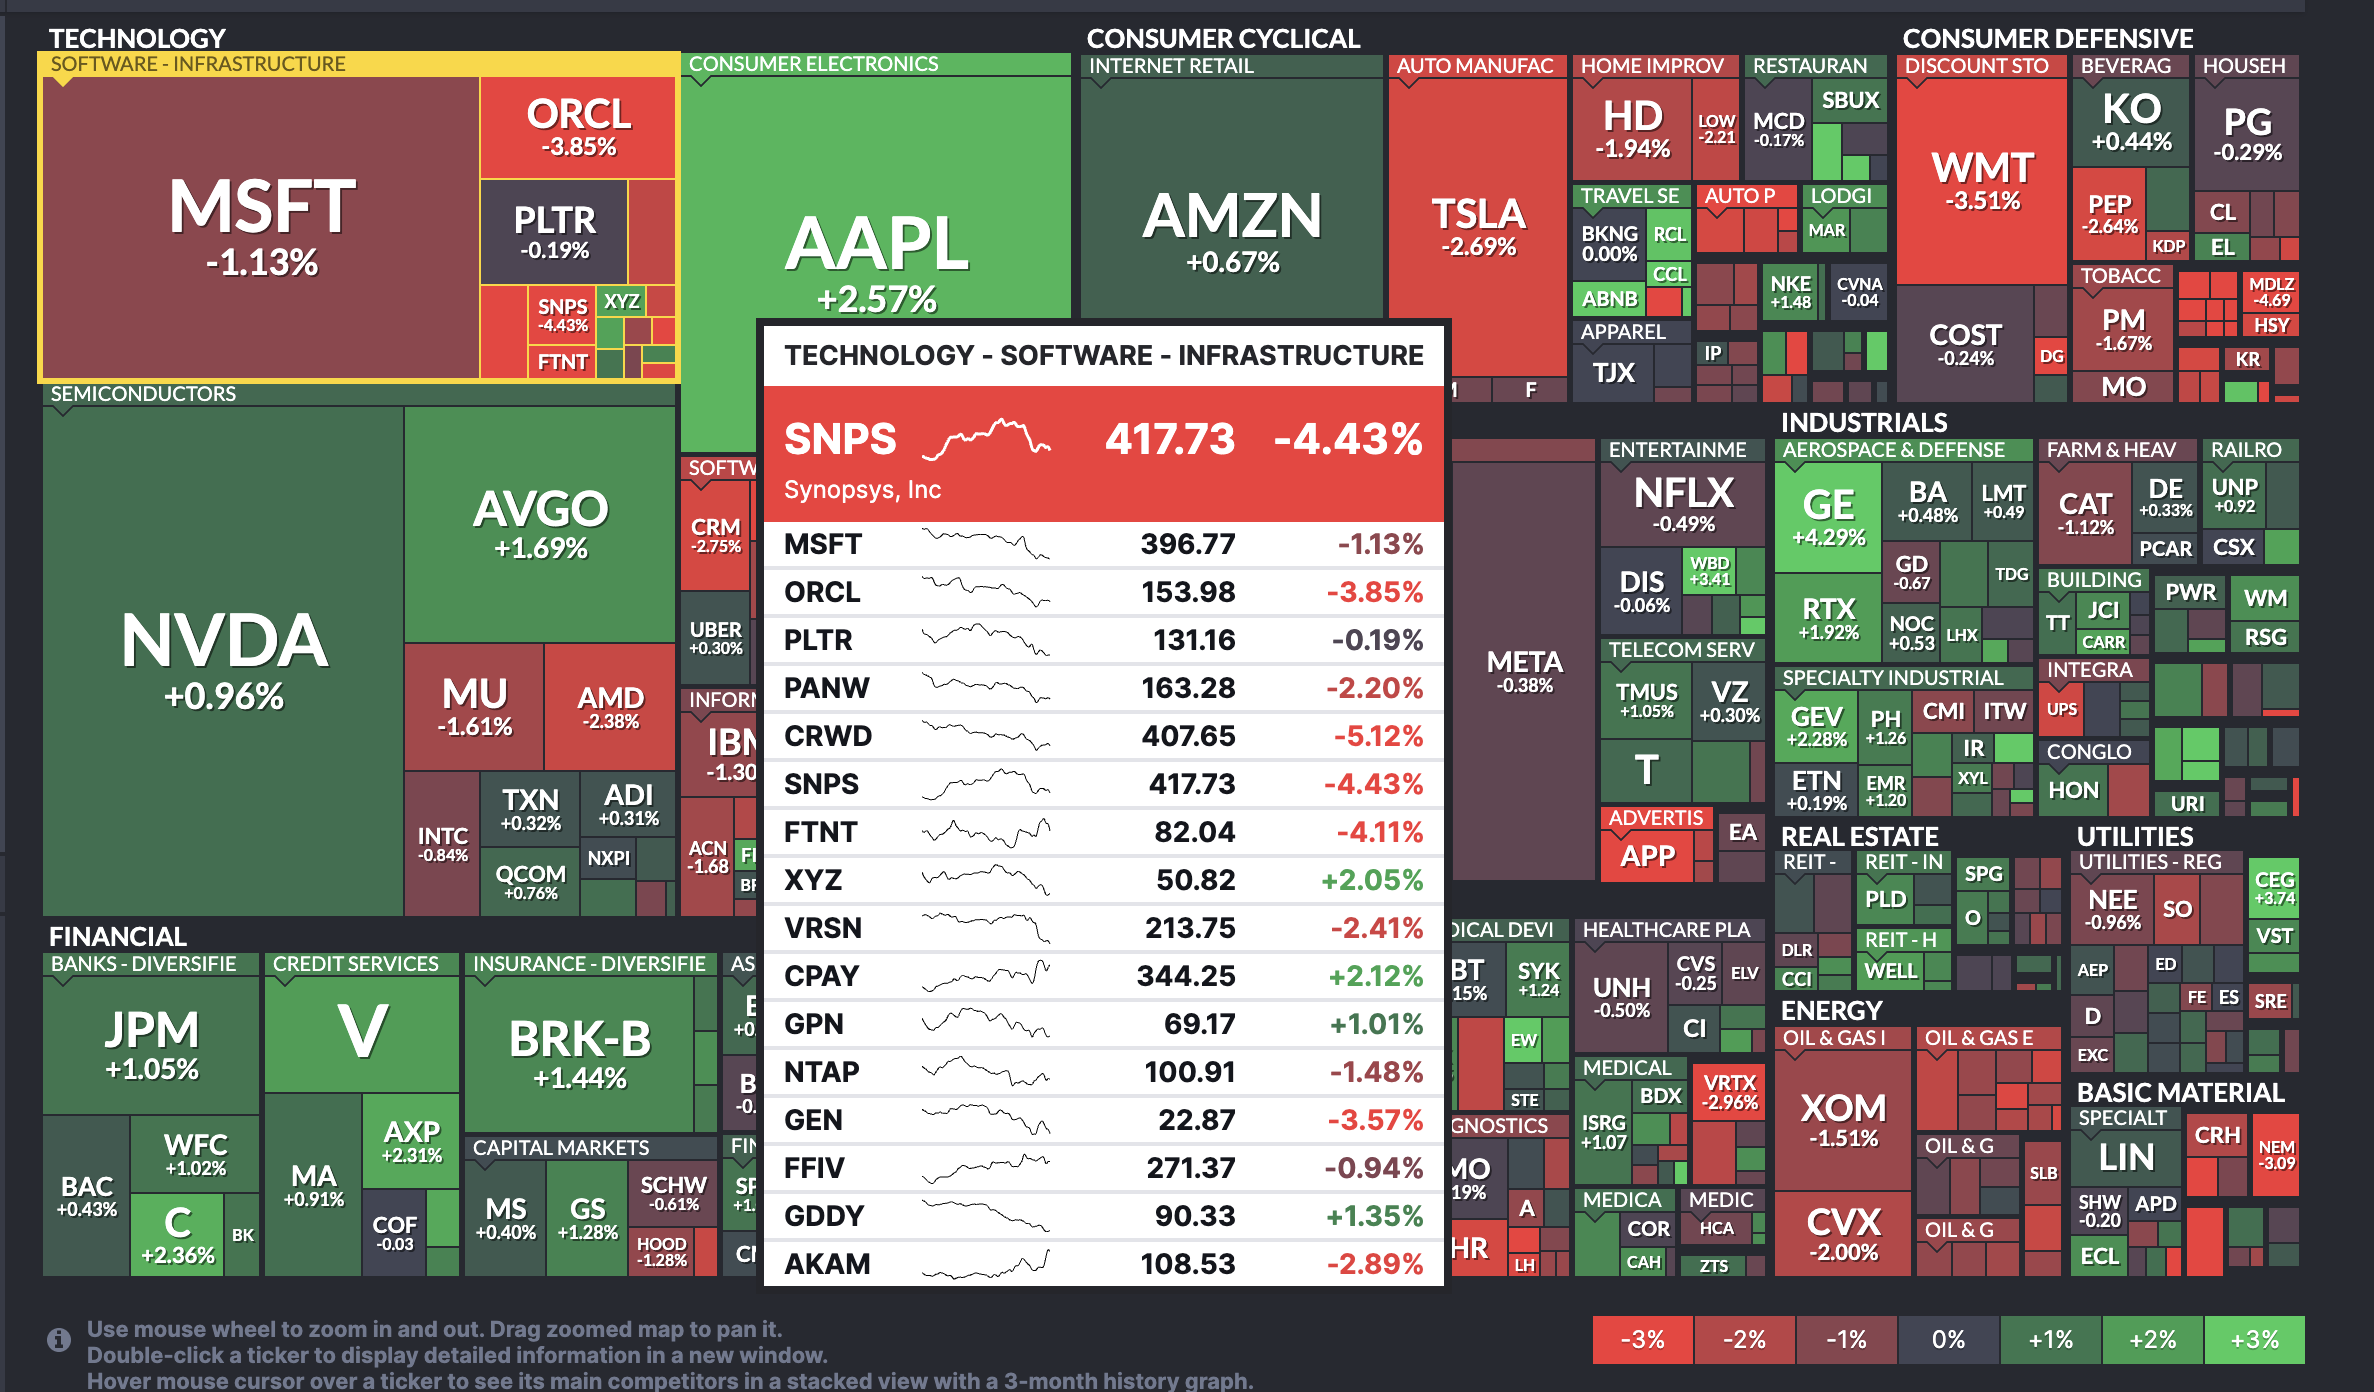
Persistent “SaaSpocalypse” fears that AI will disrupt traditional software and tech models continue to pressure the market. This makes Information Technology the weakest sector, down 1.5% intraday. Synopsys, Inc. (SNPS) leads the top laggards, falling 1.6% amid broader AI anxiety.
Top US Stock Market News:
• Empire State Manufacturing Index: The New York Fed’s survey showed modest regional expansion in February at +7.1. It is slightly below January’s +7.7 but above forecasts. This leading gauge for US factory activity offers some reassurance against slowdown fears.
• Canadian CPI Cools: January headline inflation eased to 2.3% YoY (from 2.4%), driven by lower gasoline prices. The softer print strengthens the disinflation narrative and could preview similar trends in US data, supporting Fed rate-cut hopes.
Sponsored
Sponsored
• US-Iran Indirect Talks Resume: Discussions in Geneva today focused on nuclear issues and de-escalation. Progress could help stabilize oil markets and reduce volatility in the energy and global trade sectors.
S&P 500 Tests Key Level As AI Disruption Fears Weigh on Wall Street
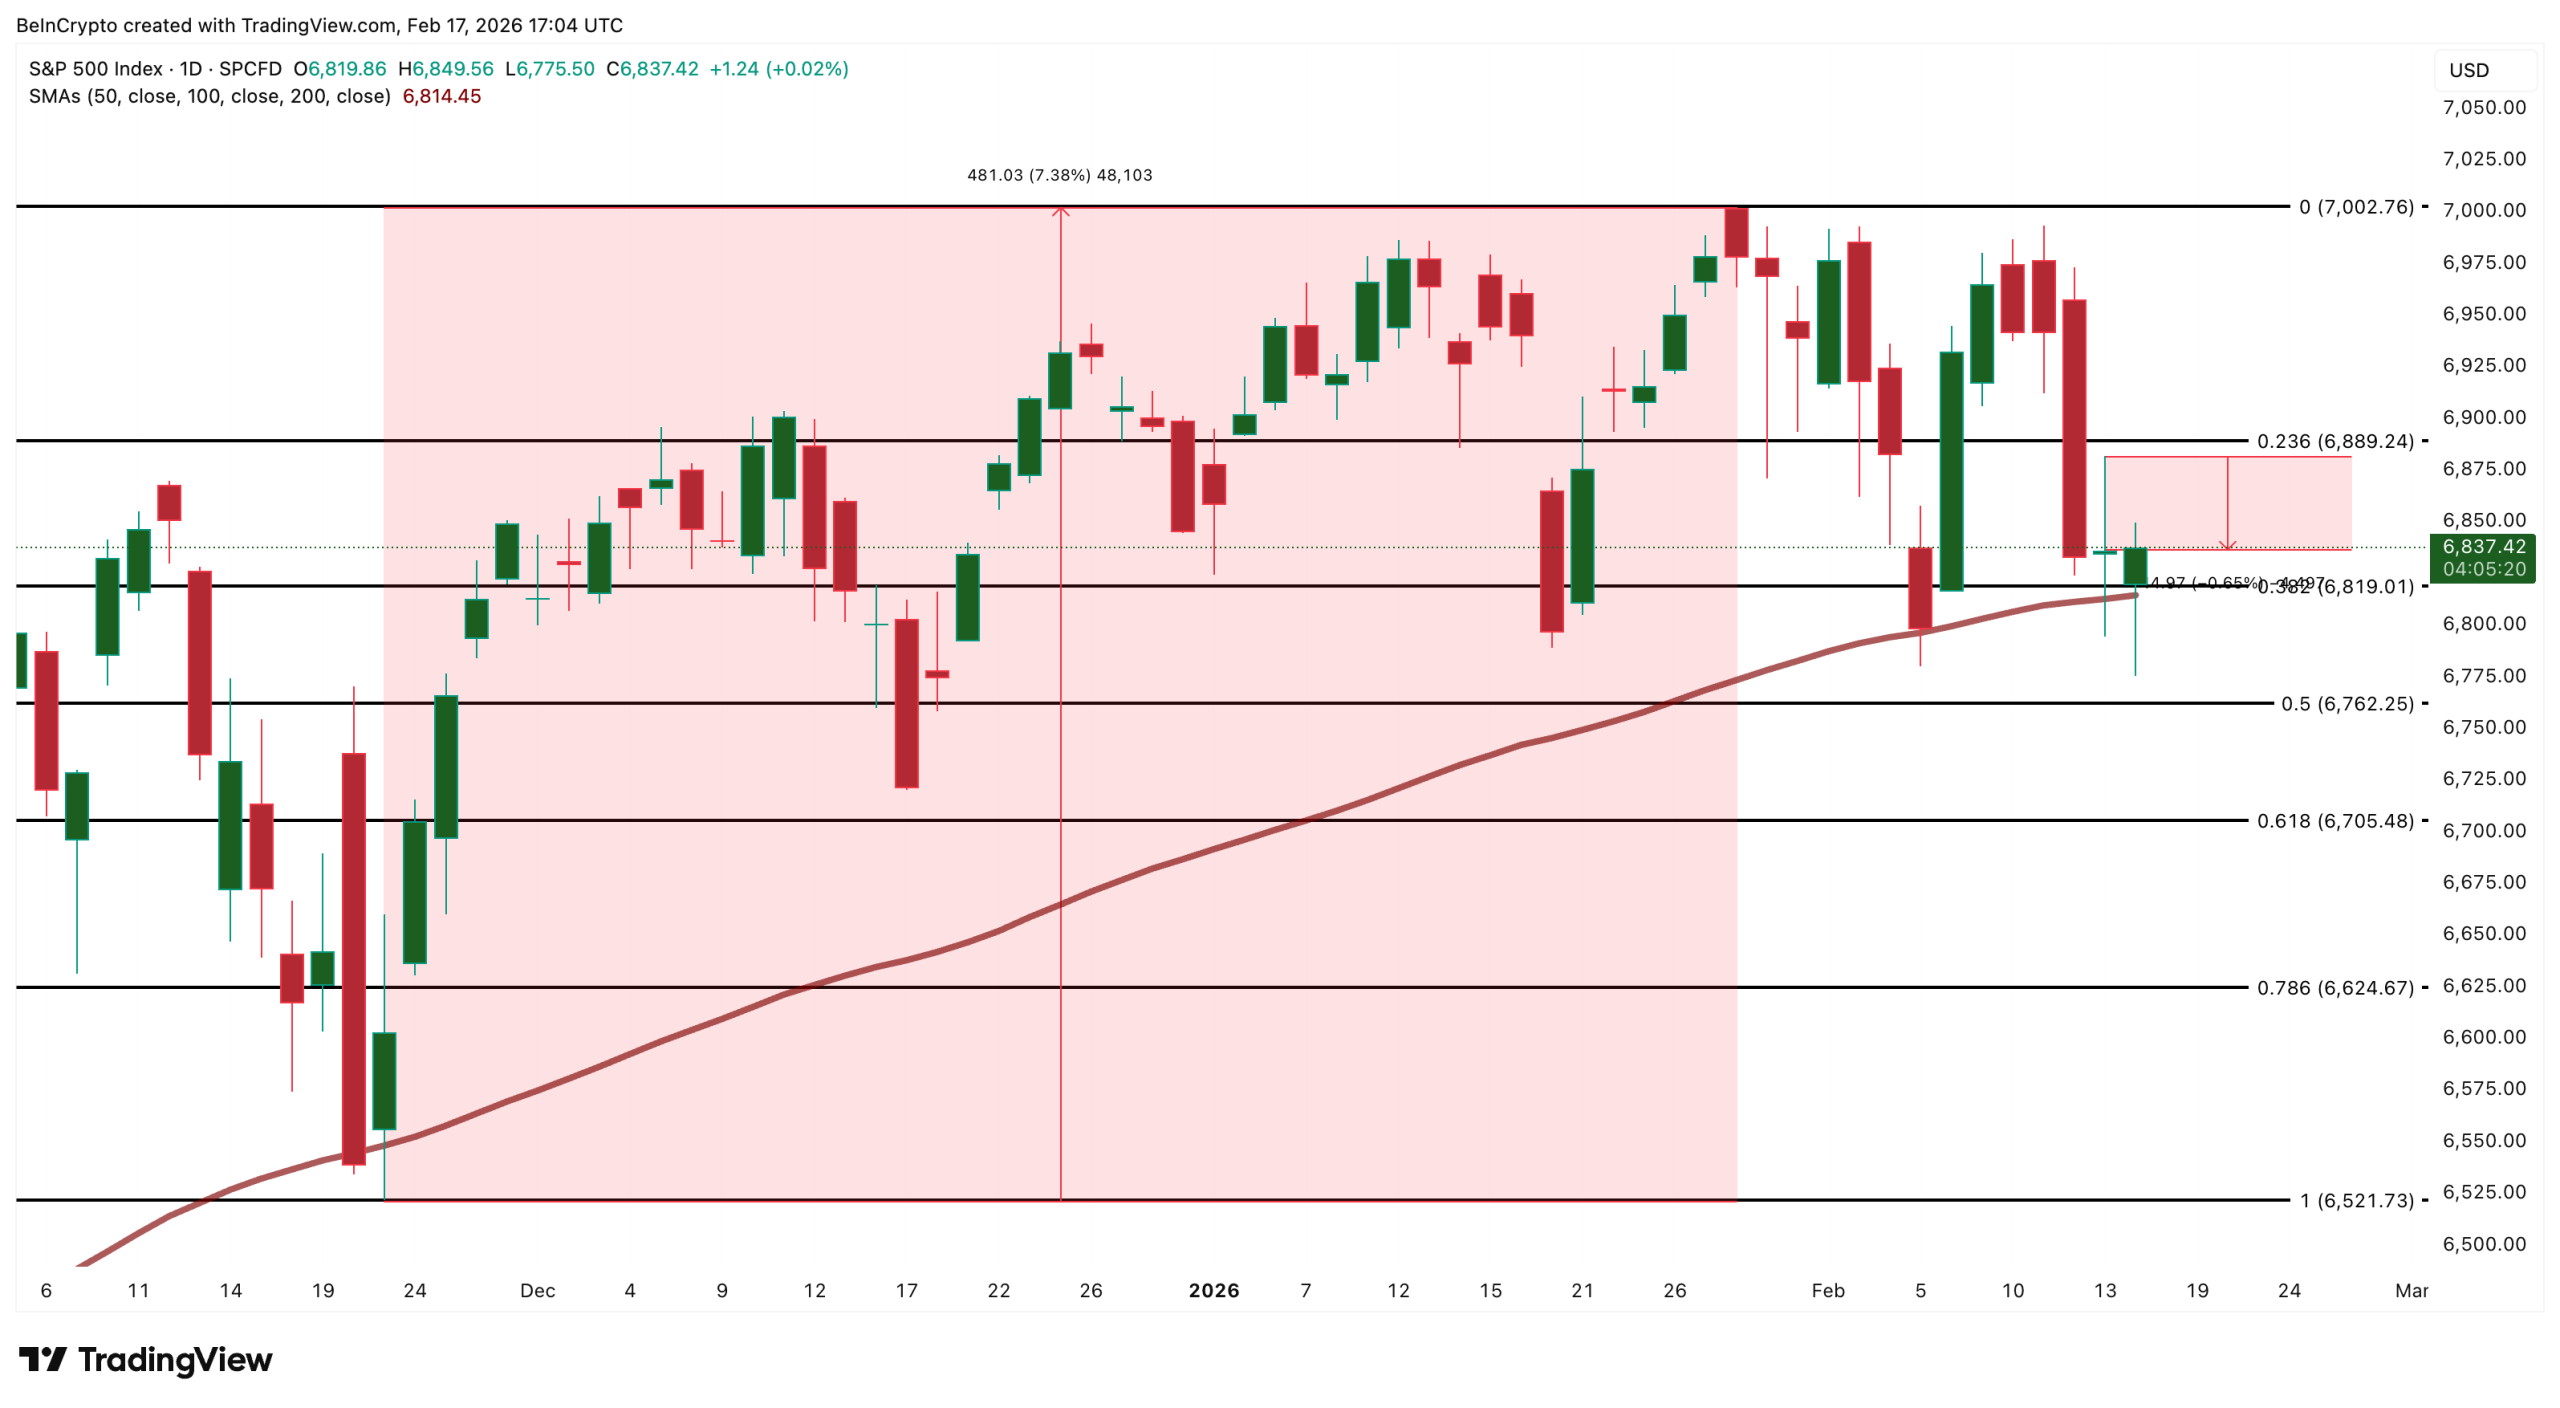
Wall Street remains cautious on February 17, 2026, with the US stock market trading mixed but overall subdued amid persistent SaaSpocalypse fears. The S&P 500 opened weaker, briefly dipping below its 100-day EMA before reclaiming it.
The index stabilized around 6,834–6,841 mid-session, down 0.65% intraday from its February 13 high.
The trend suggests the market might recover mildly, but the key to a broader recovery lies above the highs set on February 13 (Friday).
This echoes the late-November 2025 scenario. The index lost the 100-day EMA on November 28 but reclaimed it quickly the next session, triggering a strong rally. The S&P 500 gained approximately 7.38% from late November into late January.

The 100-day EMA has acted as strong support since then. Key support now sits around this zone, at around 6,819. A close below could invite broader weakness toward 6,762 and 6,705. A decisive push above 6,889 (above Friday’s high) could target the psychological 7,000 level.
However, stagflation-like concerns (sticky inflation, growth slowdown) and AI disruption anxiety limit upside conviction.
Sponsored
Sponsored
Nasdaq Composite trades deeper in the red, highlighting tech’s drag. Tech’s 33% S&P 500 weight amplifies the impact on the broader index.
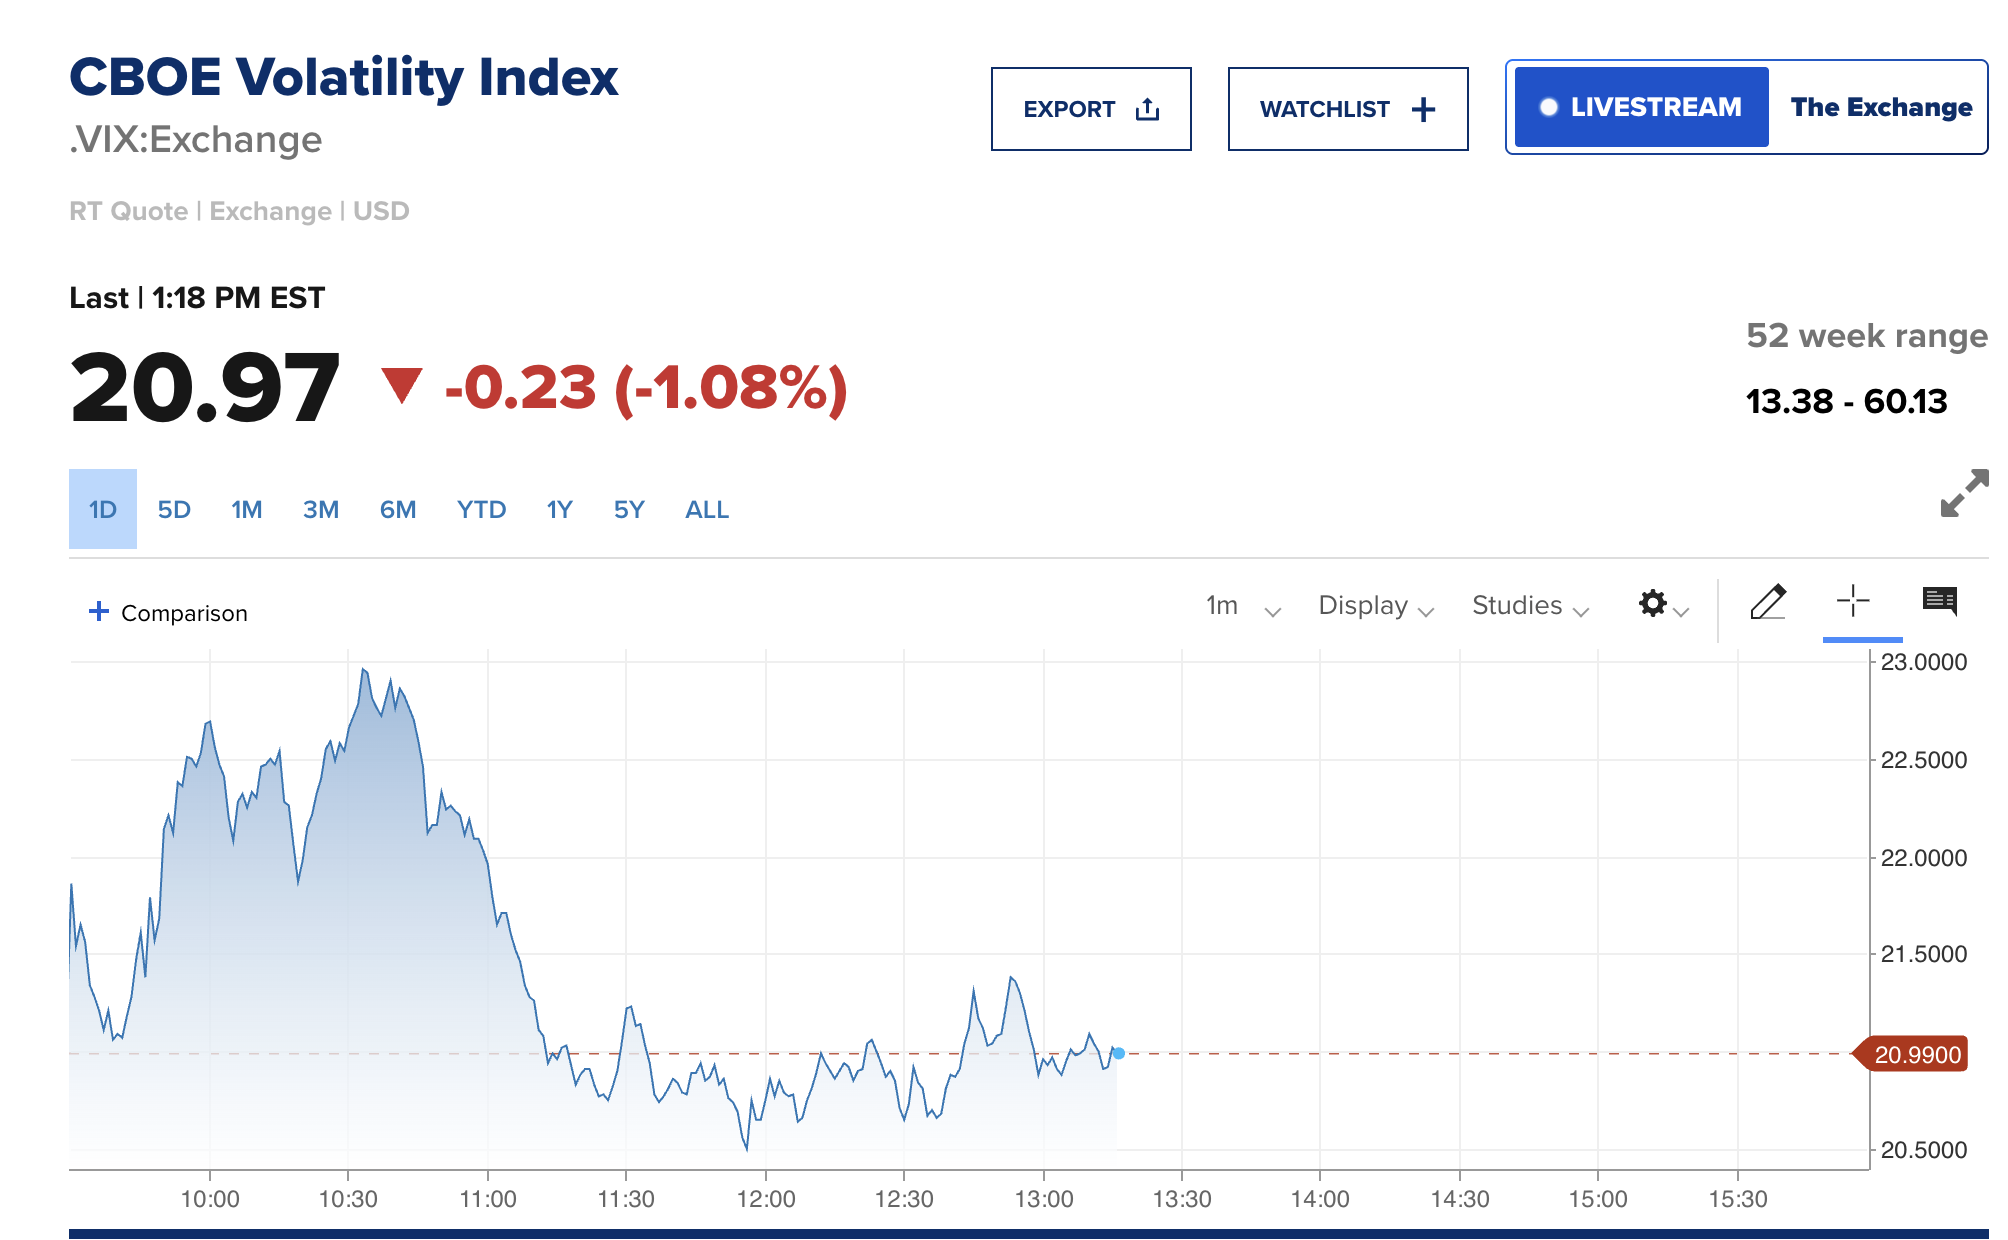
VIX, the Volatility Index, eased 1.08% to 20.97 (from higher early-session levels), signaling reduced volatility as the day progressed, though still elevated relative to recent lows and reflecting caution.
The US 10-year Treasury yield is 4.05% (down modestly today, near 2.5-month lows).
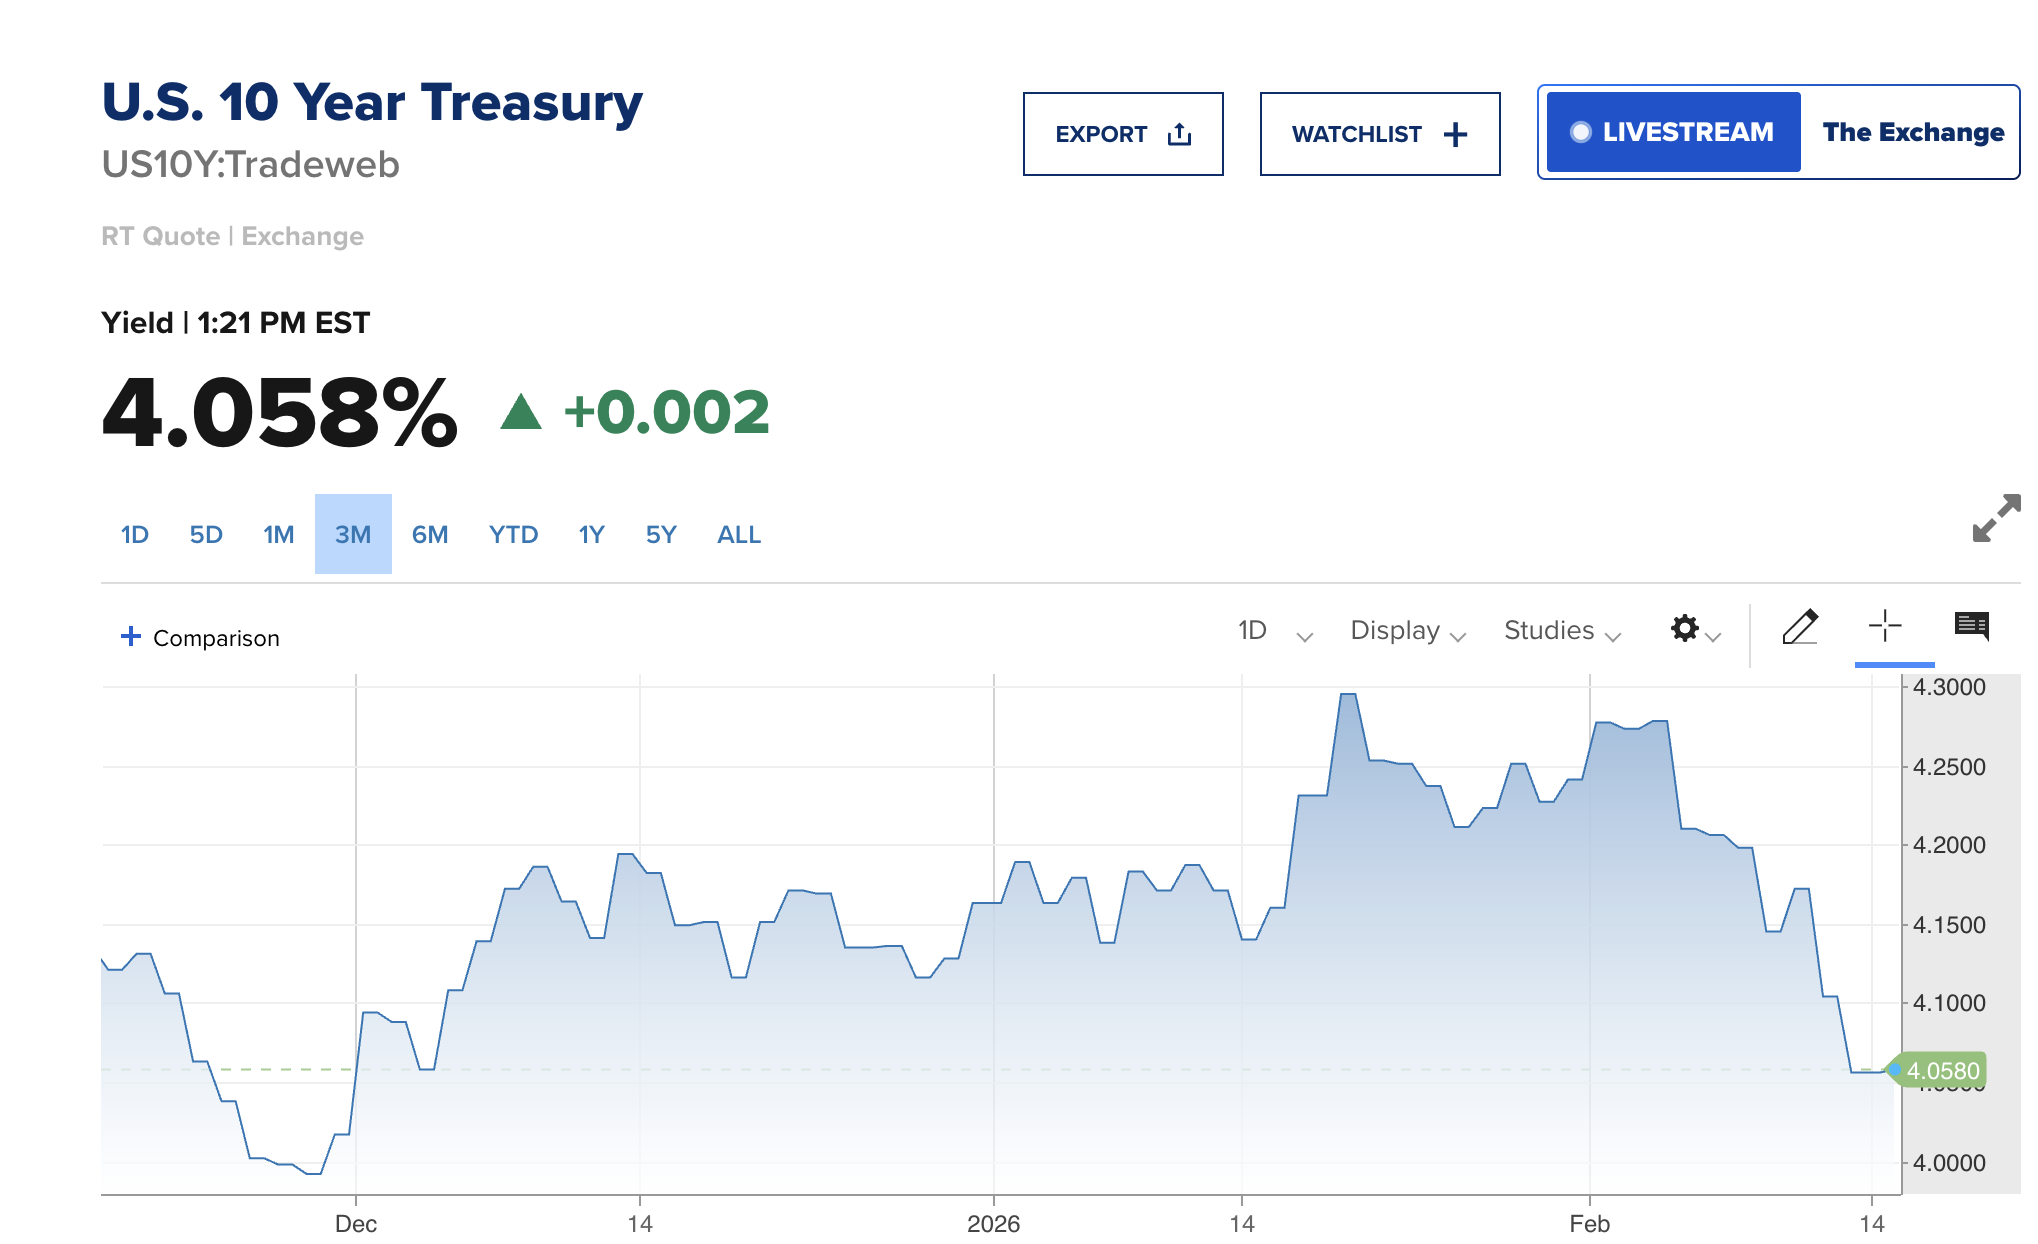
It reflects flight-to-safety flows and softer inflation expectations; supportive for bonds but pressuring growth stocks and crypto amid delayed rate-cut bets.
Sponsored
Sponsored
Sector Rotation in Focus: Defensives Shine While Tech Drags
The US stock market’s mixed tone on February 17, 2026, reveals pronounced sector rotation. Technology (XLK) is the standout laggard, down approximately 1.24% from February 13 highs (currently trading -0.37% on the day).
XLK is the Technology Select Sector SPDR Fund, managed by State Street Global Advisors, one of the flagship sector ETFs that slices the S&P 500 into its 11 GICS sectors for targeted exposure.
It tracks major tech names (Nvidia, Microsoft, Apple) and software/semiconductor companies. This makes XLK sensitive to growth sentiment and AI-related developments.
The XLK chart shows a developing head-and-shoulders pattern, a bearish structure. The neckline holds steady near 133; a decisive break below could confirm the pattern and trigger a 10% downside move (measured from head to neckline), potentially pushing toward 129 or even 120 in a deeper correction if broader market conditions or AI concerns worsen.
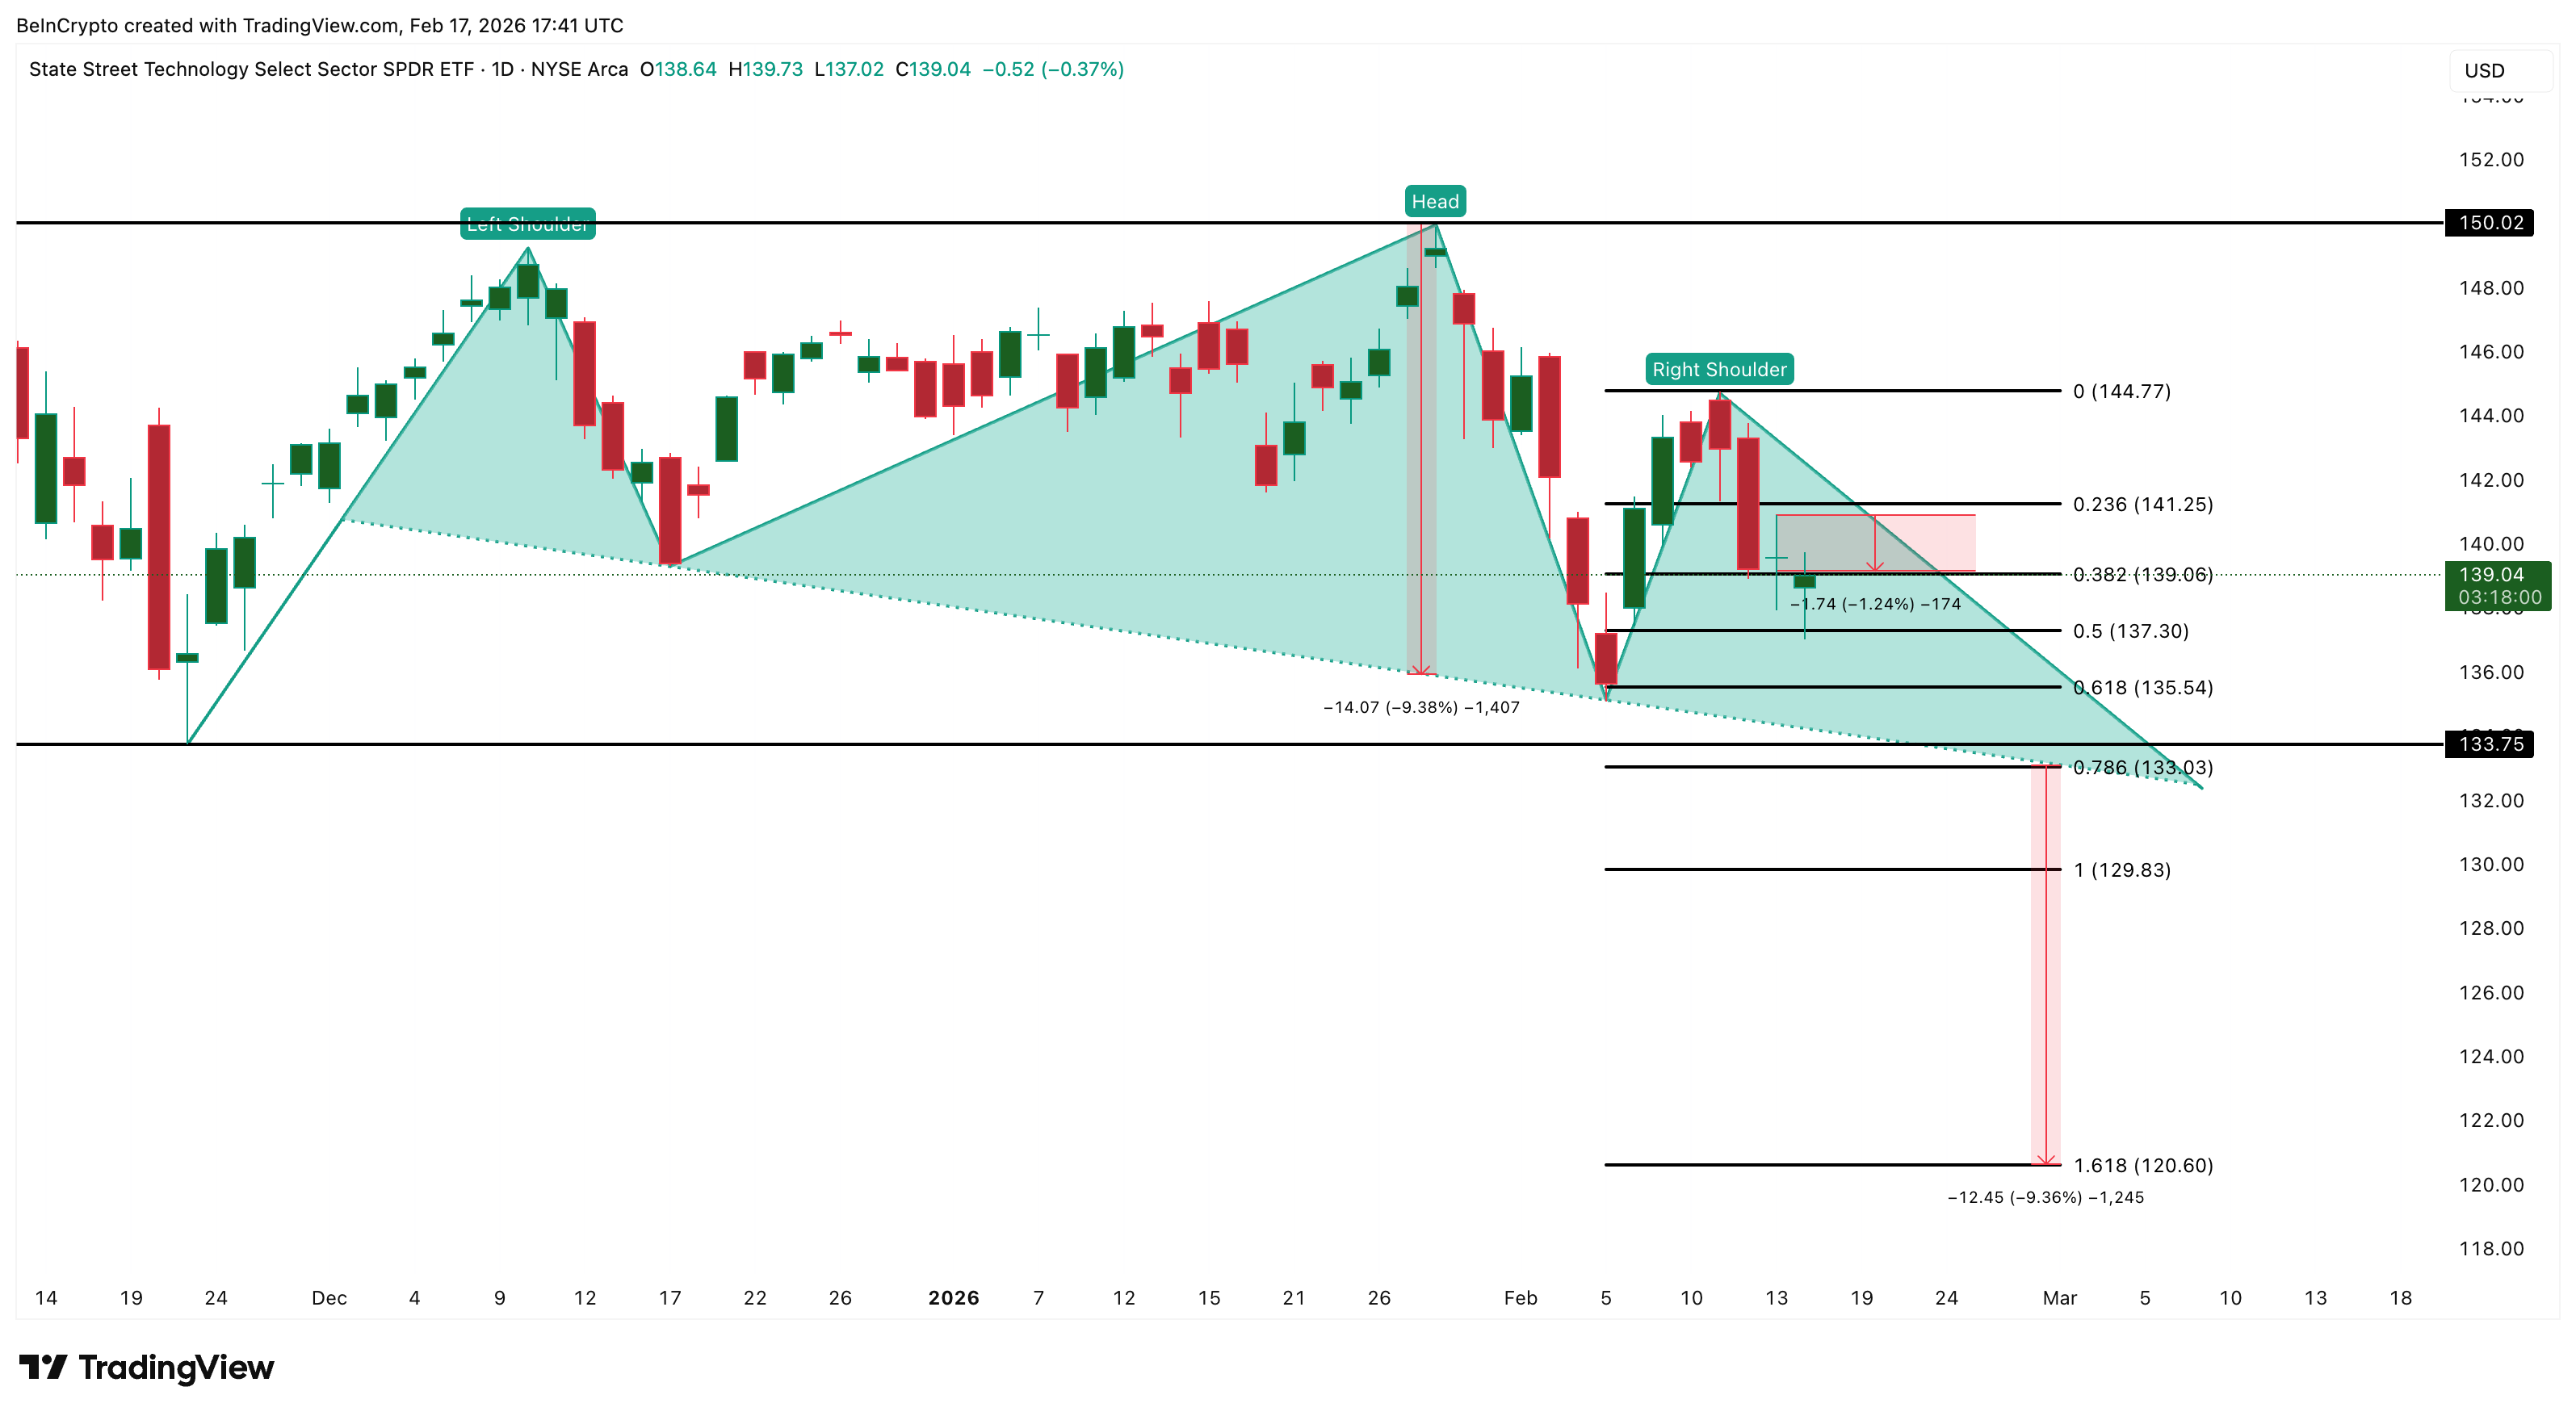
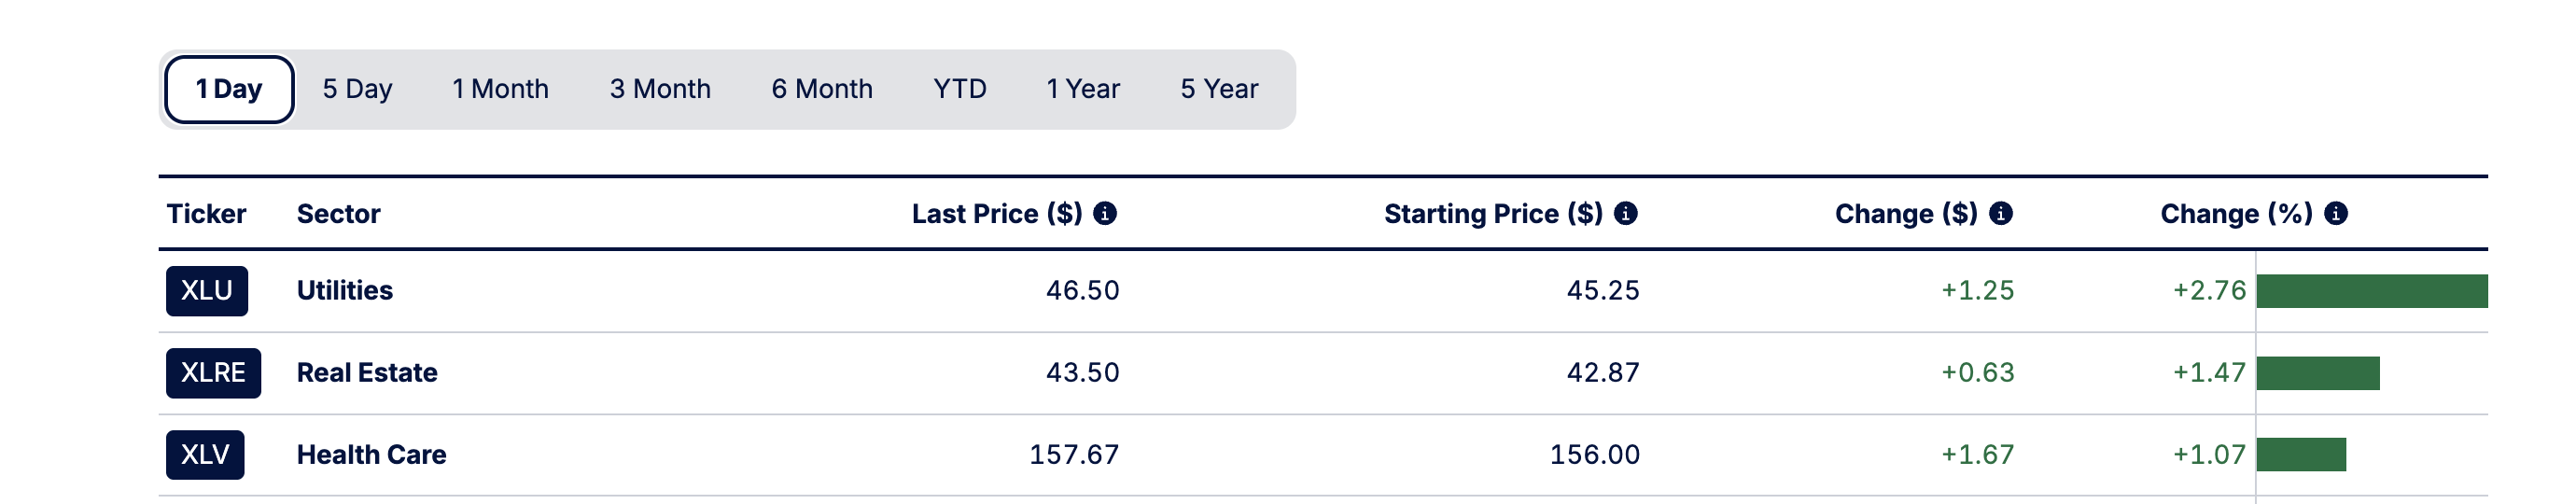
Utilities (XLU) continues to show relative strength after rallying 2.5% on Friday. While it’s down 0.40% today in line with broader weakness, the sector remains the strongest performer on a weekly basis.
This flow, from growth/tech into defensives and value, explains why the S&P 500 can trade flat-to-lower despite green pockets: tech’s 33% index weight magnifies XLK weakness, overshadowing gains elsewhere.
Sponsored
Sponsored
The bearish setup invalidates on a reclaim of 141–144; a move above 150 would fully negate the threat.
Synopsys (SNPS) Drops 4.4% As AI Anxiety Hammers Software Stocks
Synopsys (SNPS) is one of the standout US stock market laggards. It is trading at approximately 419 after dropping 4.43% intraday, at press time.
As a leading EDA software and semiconductor IP provider, SNPS is closely tied to the software infrastructure subsector. This leaves it vulnerable to ongoing concerns that AI may reshape chip-design workflows.
In the Technology Select Sector SPDR Fund (XLK), SNPS carries a modest weight of 0.72%. This limits its direct ETF impact but serves as a strong proxy for software weakness (e.g., ORCL -3.85%, CRWD -5.12%, FTNT -4.11%).
The daily chart shows SNPS trading inside a bear flag pattern following a 24% correction that began January 12, 2026, with the February 4 rebound/consolidation keeping price contained within the flag. It attempted a breakdown today, but buyers defended so far.
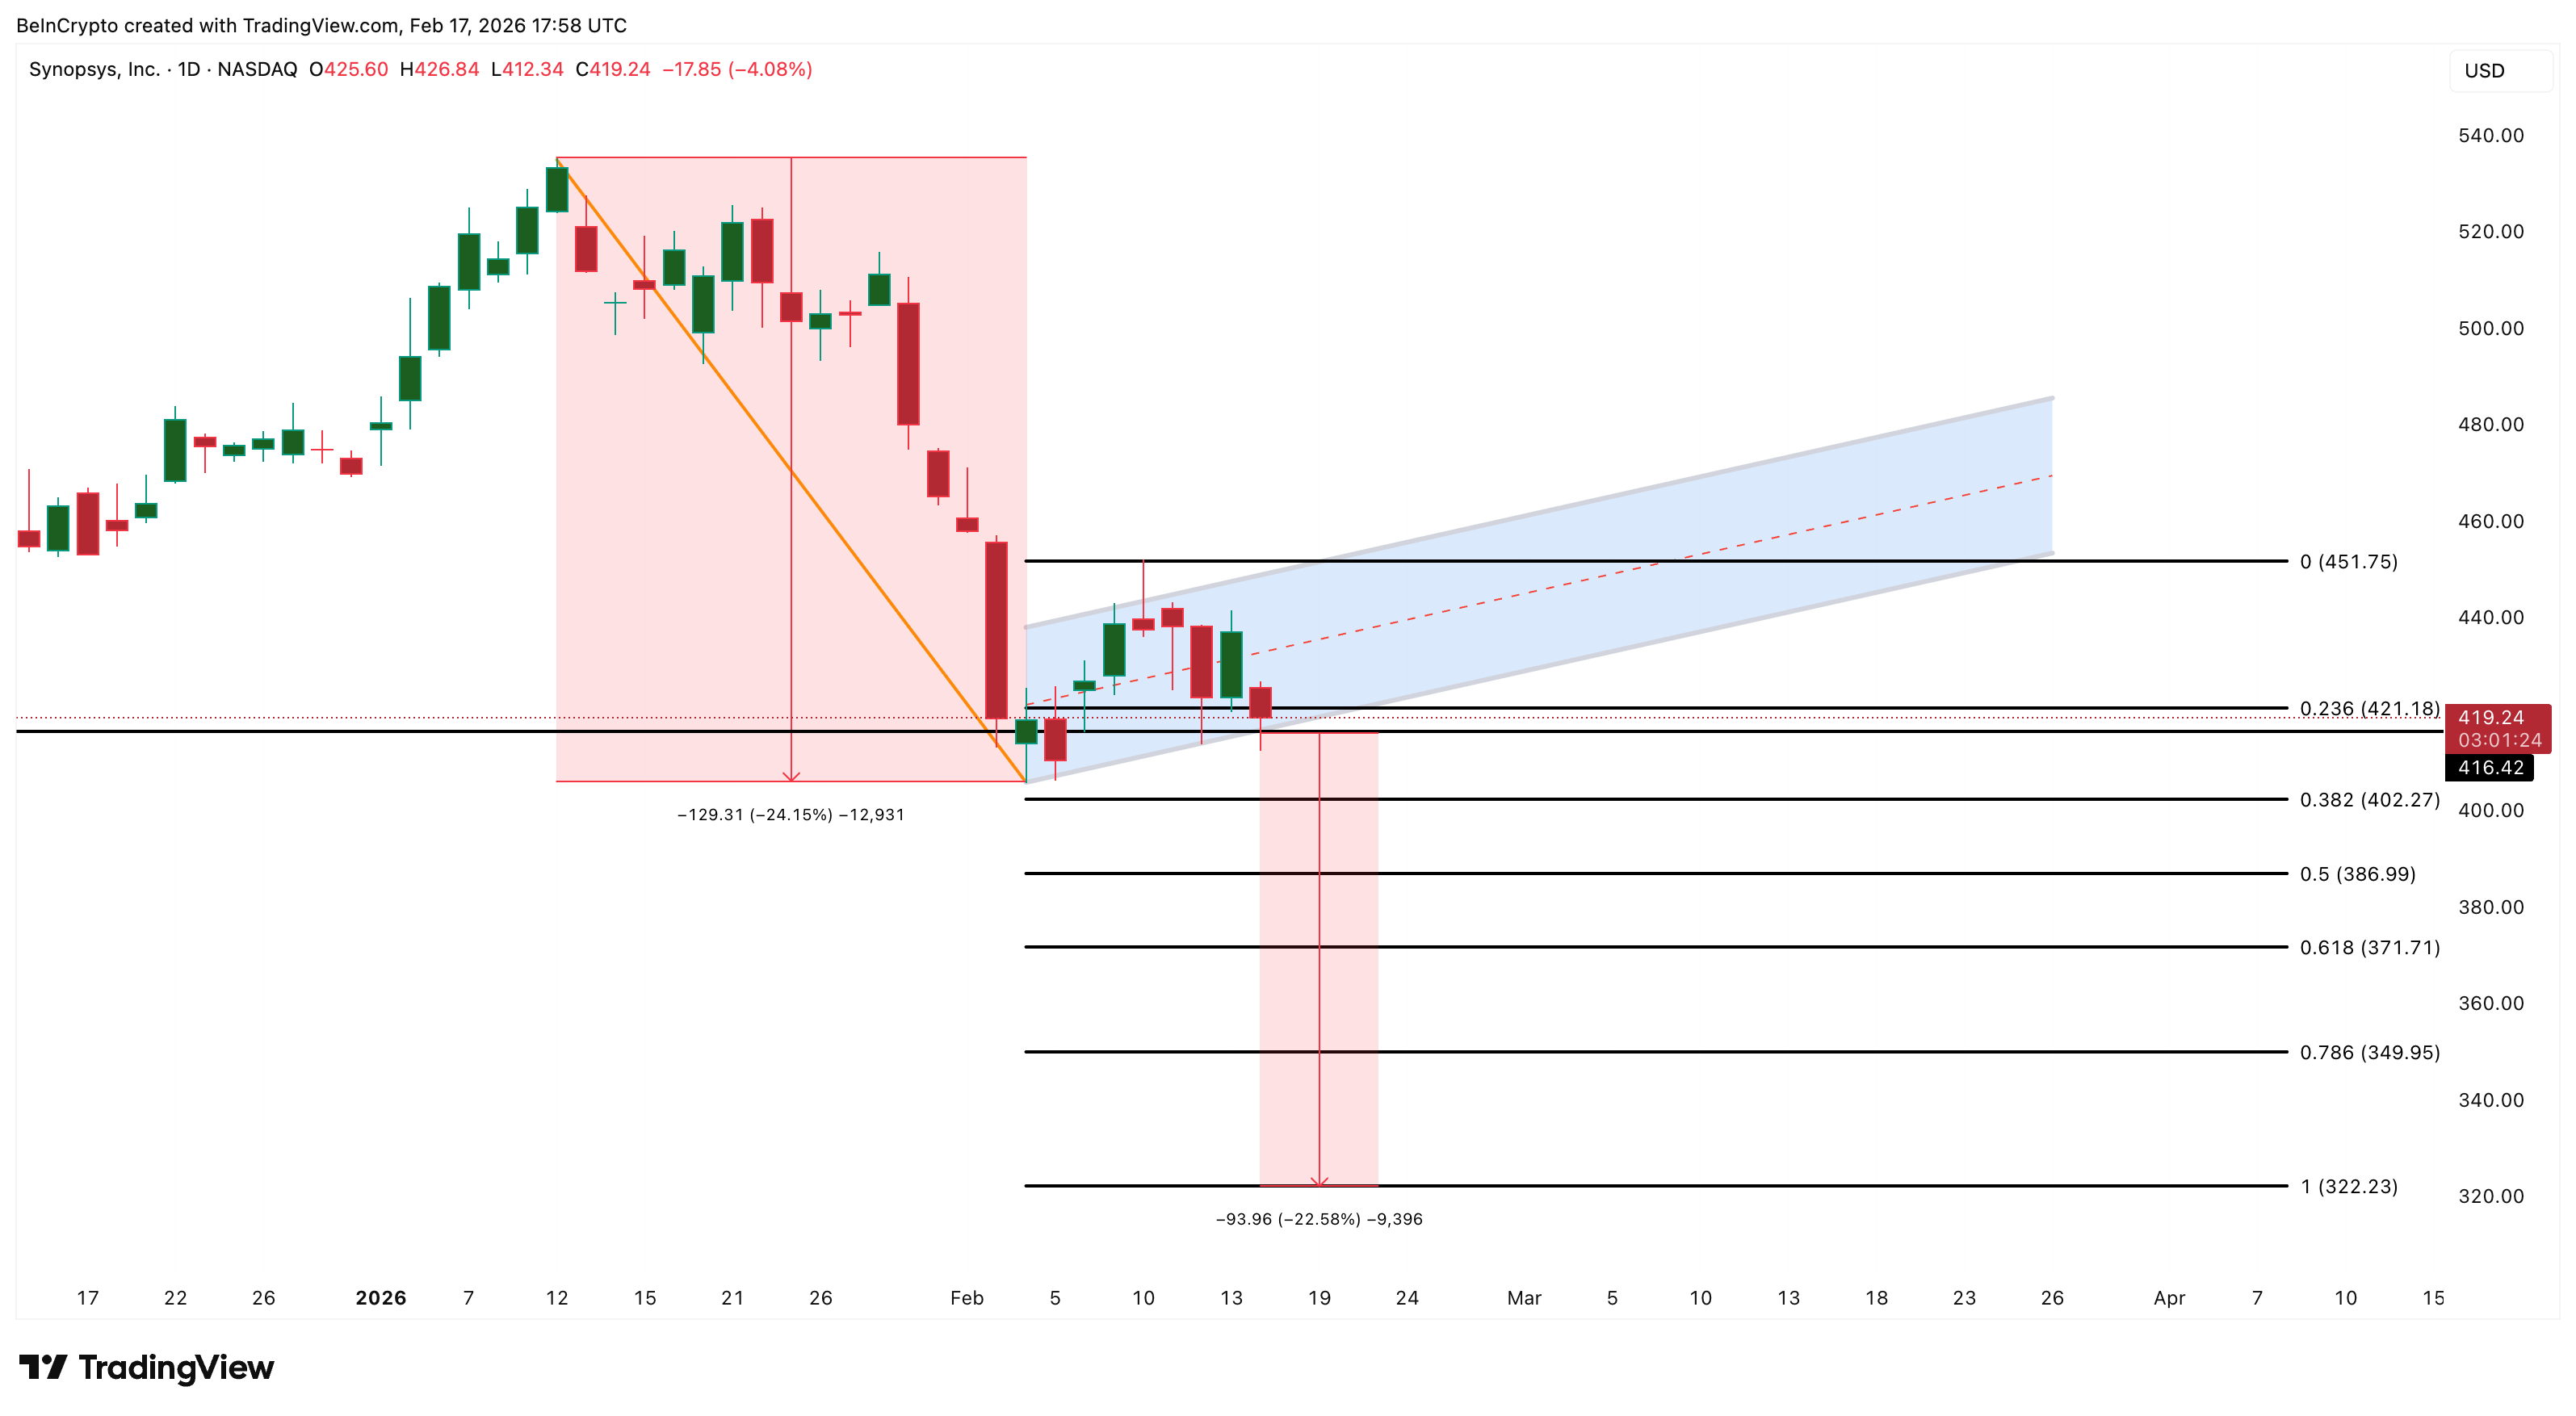
A confirmed break below 416 could activate the pattern, projecting downside toward 322 (over 20% from current levels). Intermediate support levels sit at 402 and 371.
The bearish setup invalidates on a reclaim of 451. This reinforces rotation away from software/growth names into defensives, adding to Nasdaq’s relative pressure.


Bitcoin is trading at $67,100 on Sunday, roughly flat over the weekend, but the mood around it is the worst it has been since the Iran conflict began on February 28.
Santiment data published Saturday shows social media commentary on bitcoin has hit a ratio of five bearish posts for every four bullish ones, the most negative skew in five weeks. The last time sentiment was this one-sided was the day Operation Epic Fury launched and bitcoin dropped below $65,000 for the first time in the conflict.
🗣️ According to social data across X, Reddit, Telegram, and other platforms, Bitcoin is seeing the highest ratio of bearish discussions (fear) since February 28th. With crypto’s #1 market cap sitting at $66.8K, FUD has crept back in with the community showing a key lack of… pic.twitter.com/Ym7SbUC22I
— Santiment ✈️ 🇫🇷 EthCC (@santimentfeed) April 4, 2026
The Fear and Greed Index sits at 9, deep in extreme fear territory, where it has been pinned between 8 and 14 for over a month. That kind of sustained single-digit reading without a corresponding price collapse is unusual. In 2022, the index hit comparable levels during the LUNA crash and the FTX implosion, both of which involved actual capitulation events with 20% to 30% single-day drawdowns. This time, bitcoin is grinding sideways in a $65,000 to $73,000 range while sentiment collapses around it.
What matters is that sentiment and price are telling completely different stories. Bitcoin has spent five weeks absorbing war headlines, Trump speeches, $403 million liquidation events, and the most bearish on-chain demand data in years without actually going anywhere. It is still trading within 5% of where it was when the conflict started, grinding sideways while the mood around it collapses.
The reason it hasn’t broken lower is visible in the institutional flow data. ETFs absorbed approximately 50,000 BTC in March, the highest monthly pace since October 2025. Strategy added another 44,000 BTC. Morgan Stanley received approval for a bitcoin ETF at 14 basis points, opening 16,000 advisors and $6.2 trillion in assets under management. The institutional bid is real and it is holding the floor.
But the floor is all it is holding. A CoinDesk analysis from early Saturday showed overall 30-day apparent demand at negative 63,000 BTC, meaning the rest of the market is selling faster than institutions can absorb. Whales holding 1,000 to 10,000 BTC have swung from adding 200,000 BTC a year ago to removing 188,000 today, one of the most aggressive distribution cycles on record.
April has historically been one of bitcoin’s strongest months, finishing green 10 out of 15 years with an average gain of 20.9%. But seasonality does not trade against a war, a negative Coinbase Premium, record whale distribution, and a Fear and Greed Index stuck in single digits.


Ant Digital Technologies, the blockchain division of Chinese conglomerate Ant Group, has unveiled a new platform aimed at enabling AI agents, not humans, to become the main participants in crypto transactions called Anvita.
Unveiled at the company’s Real Up summit in Cannes, Anvita is Ant’s bet on what it calls an “agent-to-agent economy,” where autonomous software programs can hold assets, trade, and make payments with little to no human involvement.
Anvita consists of two main products at its inception. The first, Anvita TaaS (Tokenization-as-a-Service), is focused on tokenizing real-world assets for institutions, including custody and treasury tools. The second, Anvita Flow, is a platform for AI agents to register, find each other, coordinate tasks and settle payments in real time.
“Pure RWA is just the ‘static infrastructure’ of digital assets,” said Zhuoqun Bian, president of blockchain business at Ant Digital Technologies. “The real transformation lies in moving toward an onchain agentic economy, where autonomous agents will not just analyze data — they will hold assets, execute trades, and optimize portfolios.”
Anvita Flow integrates the x402 protocol, developed by Coinbase and Cloudflare, which enables stablecoin payments directly over HTTP. Agents interacting on the platform can complete sub-cent transactions instantly using USDC, removing the need for traditional billing systems, subscriptions or human approval.
The system also includes an Agent Store with modules for data collection, financial analysis and gaming. Developers can list their own agents, and the platform supports major frameworks like OpenClaw and Claude Code, with flexible hosting options.
In practice, the potential extends beyond tokenized assets toward a more active onchain economy. Agents could allocate resources, execute trades, handle services on behalf of users, and settle micro-transactions automatically as they interact.
Ant Digital joins a growing field of companies building infrastructure for AI-driven commerce. Visa and Coinbase have released competing protocols for agent-based payments, with Visa’s Trusted Agent Protocol targeting card-rail checkout and Coinbase’s x402 targeting stablecoin micropayments.
Google unveiled its Agent Payments Protocol (AP2) in September, backed by over 60 organisations. Mastercard acquired stablecoin firm BVNK for $1.8 billion in the largest stablecoin infrastructure deal on record, signaling that traditional payment networks also see blockchain settlement as part of their future.
The Solana Foundation has reported the network already processed over 15 million onchain agent transactions, and Coinbase CEO Brian Armstrong has said he expects agents to surpass humans in transaction volume.
McKinsey has projected that AI agents could mediate $3 trillion to $5 trillion of global consumer commerce by 2030.
Still, usage remains lackluster. The x402 protocol is currently seeing roughly $28,000 in daily volume, much of it from testing, with Artemis analysts flagging roughly half of observed transactions as artificial activity.
Ant Digital’s blockchain, which already supports tokenized assets from various financial institutions, is currently pursuing USDC integration with Circle and applying for stablecoin licences in Hong Kong, Singapore and Luxembourg.


Satoshi Nakamoto’s listed birthday has again drawn attention across the crypto market on April 5.
Summary
- Satoshi Nakamoto’s profile lists April 5, 1975, making Bitcoin’s founder 51 years old on Sunday.
- April 5 may be symbolic because it matches Executive Order 6102 and gold ownership history.
- Satoshi’s final known public forum post came in 2010, followed by last messages in 2011.
The date comes from the Bitcoin creator’s profile on the P2P Foundation and remains one of the few public details tied to the pseudonymous founder.
The Bitcoin community marked April 5 as the birthday linked to Satoshi Nakamoto. The date appears on Nakamoto’s P2P Foundation profile, where the birth date is listed as April 5, 1975.
Based on that entry, Satoshi would turn 51 on April 5, 2026. Still, there is no public proof that the date reflects a real birthday, and the identity behind the name remains unknown.
Satoshi Nakamoto is the name used by the person or group that created Bitcoin, wrote its white paper, and launched its original software. Even after more than a decade, verified facts about the founder remain limited.
That is why the birthday entry continues to attract attention each year. The profile detail stands out because Satoshi left very little personal information in public view, making even a simple date a recurring point of discussion.
The date has also drawn interest because some Bitcoin users connect it to US monetary history. April 5 matches the anniversary of Executive Order 6102, a 1933 order that restricted private gold ownership in the United States.
Some members of the crypto community also point to the listed birth year of 1975, when private gold ownership again became legal in the US. Because of that overlap, some observers believe the date may have been symbolic rather than personal. That view remains uncertain, and no direct proof confirms the reason behind the choice.
Bitcoin founder remains absent from public view
Satoshi’s public silence has added to the mystery around the profile entry. On Dec. 13, 2010, Satoshi made the final known post on the BitcoinTalk forum.
In 2011, Satoshi sent the last known private messages to developers and said Bitcoin was in “good hands.”
Since then, no verified public message has appeared from the Bitcoin founder. Whether April 5, 1975 is a real birthday or a symbolic reference, the date continues to serve as a yearly reminder of the person or group behind Bitcoin’s creation.

X Head of Product Nikita Bier says no technology exists to fix the spam replies plaguing crypto accounts, claiming 80% of crypto activity is driven by bots.
The statement comes amid complaints that the platform is a “horrible website,” and concessions that it remains the least-worst channel for open communication.
X’s Bier Draws a Line on Crypto Spam
Bier’s admission marks a shift in tone from X’s earlier confidence in fighting spam through technical measures.
“The financial incentive to spam on X will decline enormously over the next 30 days and soon be negative,” X’s Nikira Beir said in March.
Over the past year, the platform reportedly purged 1.7 million bot accounts, revoked API access from InfoFi apps that incentivized posting, and rolled out a dislike button to suppress low-quality replies.
However, Bier now argues those tools have limits. He said the only viable path forward is enabling 2nd-degree reply restrictions, a feature X has been testing with Premium+ subscribers.
“There is no technology in the world that could ever fix the spam replies of a crypto account — because 80% of crypto is simply bots. The only path out is to enable 2nd-degree reply restrictions,” wrote Bier in a Sunday post.
The setting expands who can reply to a post beyond just direct followers to include followers of followers, while still blocking unknown accounts and bots.
The concession suggests X (Twitter) views the crypto bot problem as structural rather than solvable solely through detection.
If 80% of crypto accounts are bots, as Bier claims, no filtering system can separate legitimate users from automated ones at scale without collateral damage to real accounts.
Solana’s Anatoly Yakovenko and the Crypto Communication Crisis
Yakovenko’s response highlighted a deeper frustration within the crypto industry. The Solana co-founder called the platform “horrible,” yet acknowledged that open threads on X remain the best available option for public crypto communication.
The exchange followed a satirical post by Solana community member that mocked the state of crypto communications.
The post listed increasingly absurd rules, from not answering X DMs and Telegram messages to not answering your door or responding if your name is called.
The joke landed amid heightened security concerns following the $285 million Drift Protocol exploit on April 1, which used social engineering rather than code vulnerabilities.
That context added weight to the humor. The Drift attacker compromised administrative access through misleading approvals, not a smart contract bug.
In that environment, trusting any inbound communication becomes a genuine operational risk for crypto builders.
X’s Anti-Spam Playbook So Far
Bier has driven several anti-spam measures since joining X as Head of Product in mid-2025. In January 2026, he revoked API access from InfoFi apps like Kaito, which rewarded users for posting on X.
The move crashed Kaito’s token price by 20% and forced the project to sunset its Yaps incentive program.
In March 2026, X teased a dislike button on replies, and Bier signaled that spam’s financial incentive on the platform would turn negative within 30 days.
The platform also began preparing an auto-lock feature that flags accounts posting about crypto for the first time, requiring identity verification before they can continue.
Despite those efforts, Bier’s latest statement reframes the fight. Rather than promising to eliminate crypto spam, he is now telling users the problem is too deeply embedded in crypto’s own ecosystem for any platform to solve.
Could the 2nd-degree reply restrictions meaningfully reduce spam, or would they simply push bot operators to adapt?
Do you have something to share about Twitter’s spam problem, or any other topic? Write to us or join the discussion on our BeInCrypto Telegram channel and in our newsletters.
Follow us on X to get the latest news as it happens
The post 80% of Crypto Is Bots: Why X (Twitter) Might Never Fix the Spam Problem appeared first on BeInCrypto.


Anthropic has entered US election financing with a new political action committee as debate over artificial intelligence policy grows in Washington.
Summary
- Anthropic launched AnthroPAC, giving employees a channel to support candidates during rising AI policy debate.
- The PAC arrived as Anthropic battles Pentagon limits tied to weapons use and surveillance policy.
- Google-backed Texas expansion shows Anthropic is growing political reach while scaling infrastructure for AI demand.
The move adds a new political step for the company at a time when it is also fighting the Pentagon in court and expanding its AI infrastructure plans.
Anthropic filed a statement of organization with the Federal Election Commission on April 3 to create “AnthroPAC.” Reports said the committee is an employee-funded PAC tied to Anthropic and set up as a “separate segregated fund.”
The PAC is expected to back candidates from both major parties. Reports also said the money will come from voluntary employee contributions, while federal campaign finance rules require public disclosure and limit how much PACs can give to federal candidates.
The filing comes as AI policy draws more attention in Washington. Anthropic has already taken part in the political debate this cycle through a $20 million contribution to Public First Action, a group that supports AI safety efforts.
The new PAC gives Anthropic another channel to support lawmakers working on AI rules. That step places the company more directly inside the policy fight as lawmakers, regulators, and technology firms push different approaches on AI governance.
Anthropic is also in a legal dispute with the Pentagon over how its AI systems can be used. The company said in March that the Department of War labeled it a “supply chain risk” after it opposed the use of its tools in autonomous weapons and mass surveillance.
A federal judge in California temporarily blocked that action in late March. The Associated Press reported this week that the Trump administration has appealed that ruling to the Ninth Circuit.
Google backs Texas expansion
At the same time, Anthropic is expanding its computing capacity. Reports said Google plans to help finance a Texas data center project for Anthropic that could exceed $5 billion in its first phase and is being developed with Nexus Data Centers.
That project shows how fast AI infrastructure demand is growing. It also links Anthropic’s political move with a wider business push as the company seeks more influence in policy and more capacity for model development.

Key Takeaways
- Elon Musk’s SpaceX is preparing for a potential IPO with a valuation reaching $1.5 trillion
- The company’s Starlink division pulled in approximately $11.8 billion during 2025
- xAI, Musk’s artificial intelligence venture, was absorbed into SpaceX this year
- Investor confidence remains shaky after 2021 IPO class suffered massive losses of 70–80%
- Direct investment in SpaceX remains unavailable to retail traders, with limited fund access through ARKVX
Elon Musk’s aerospace powerhouse is preparing for what could become one of the largest initial public offerings in American market history. With a private valuation climbing to $1.5 trillion, SpaceX currently holds the title of the planet’s most valuable privately-held enterprise.
Musk launched SpaceX back in 2002 with Mars colonization as his ultimate vision. Over two decades, the enterprise has transformed into a leading player across rocket technology, satellite-based internet connectivity, and artificial intelligence applications.
The Falcon 9 launch vehicle stands as the globe’s most economically efficient and dependable rocket system, having completed more than 633 successful missions. Meanwhile, the company’s Starship platform represents a completely reusable spacecraft engineered for transporting humans and equipment to lunar and Martian destinations.
SpaceX’s Starlink internet constellation generated roughly $11.8 billion during 2025, establishing itself as a cornerstone revenue driver for the organization.
The integration of xAI into SpaceX’s portfolio occurred earlier this year. Musk has publicly stated his vision for space-based solar energy collection to fuel AI computing infrastructure on a massive scale, explaining the strategic rationale behind combining these ventures.
Market Volatility and IPO Concerns
The timing of SpaceX’s public market entry comes amid lingering skepticism about new listings. The IPO frenzy of 2021 left countless investors nursing substantial losses.
Allbirds serves as a cautionary tale—once commanding a $2.2 billion valuation, the company recently sold for approximately $39 million. BuzzFeed has seen its market capitalization collapse from over $1 billion to roughly $23 million. Names like UiPath, GitLab, and Warby Parker continue trading 70–80% beneath their debut prices.
These spectacular failures have created a more skeptical investor base. SpaceX faces pressure to demonstrate sustainable profitability rather than relying on market enthusiasm alone.
Unlike numerous ventures from the 2021 cohort, SpaceX operates as an established business generating substantial revenue. However, market observers note that restoring investor confidence requires clearing a significantly higher bar following years of disappointing IPO performance.
Mainstream investors lack direct purchasing options for SpaceX equity at present. Access remains limited to specialized vehicles like the ARK Venture Fund and XOVR ETF, both maintaining modest positions in the company.
Publicly Traded Space Sector Alternatives
Investors seeking immediate exposure to the space economy can access several companies already trading on public exchanges.
Rocket Lab has successfully deployed 252 satellites and is advancing development of its Neuron next-generation launch system. Intuitive Machines maintains a NASA partnership and provided critical infrastructure for the recent Artemis 2 lunar mission.
AST SpaceMobile operates as a direct Starlink competitor in satellite communications, with AT&T and Verizon among its strategic partners.
On the reporting date, Intuitive Machines’ shares surged 18.53%. AST SpaceMobile climbed 10.28%, while Rocket Lab advanced 3.27%.

Crypto World
OpenAI Cap Table Leak Reveals Microsoft’s 17x Windfall While Sam Altman Holds Zero Equity
Key Takeaways
- Microsoft’s approximately $13B investment in OpenAI now stands at roughly $228B — delivering a 17x multiple
- SoftBank deployed $64.6B and has unrealized gains exceeding $50B, with holdings valued at approximately $99.3B
- OpenAI CEO Sam Altman maintains no ownership position in the artificial intelligence company
- The nonprofit OpenAI Foundation retains 25.8% ownership acquired at no cost — while maintaining complete board control
- Nvidia’s position shows a slight loss, holding $29.6B in value against a $30.1B investment
An ownership breakdown detailing OpenAI’s shareholder structure surfaced online in early April, sparking widespread discussion about the distribution of value within the AI giant. Investor Sheel Mohnot shared the document on X, which appears compiled from publicly available filings and secondary market transactions. The data reflects OpenAI’s current $852 billion post-money valuation after completing a $122 billion capital raise.
The spreadsheet details each major investor’s ownership percentage, capital deployed, and return multiplier. This information provides unprecedented transparency into the financial structure of one of tech’s most valuable private companies ahead of its anticipated public offering.
Microsoft emerges as the dominant financial beneficiary according to the leaked data. The tech giant deployed approximately $13 billion through multiple funding rounds — beginning with a $1 billion investment in 2019, followed by a massive $10 billion injection in January 2023, plus an additional $2 billion during 2024. The company’s 26.79% ownership stake carries an estimated value of $228.3 billion, representing approximately a 17.6x return multiple. This combination of scale and returns is unmatched among OpenAI’s investor base.
Microsoft’s quarterly SEC filings verify the $13 billion total investment amount. OpenAI recently identified Microsoft as a material business dependency in investor disclosures, referencing revenue-sharing agreements and exclusive cloud infrastructure commitments.
SoftBank stands as the largest capital contributor beyond Microsoft, having pledged $64.6 billion to OpenAI. The Japanese conglomerate’s 11.66% ownership position is currently valued at approximately $99.3 billion. This represents unrealized gains surpassing $50 billion on the investment. CNBC reporting verified that SoftBank completed funding its $40 billion commitment by December 2025, utilizing a $40 billion bridge financing facility arranged by JPMorgan and Goldman Sachs.
Original Backers See Extraordinary Multiples
First movers in OpenAI’s funding history achieved the most impressive return multipliers, despite smaller absolute dollar amounts. Khosla Ventures deployed roughly $50 million during 2019, with that position now valued at approximately $1.5 billion — representing a 30x gain. Sound Ventures, the investment firm co-founded by entertainer Ashton Kutcher, committed between $20–30 million and currently holds about $1.3 billion in value, translating to a 43x multiple. Thrive Capital invested $3.5 billion and maintains a 1.98% stake currently worth $16.9 billion.
Nvidia represents the sole investor showing negative returns. The chipmaker holds 3.47% of OpenAI with a current valuation of $29.6 billion, compared to an initial cost basis of $30.1 billion. Much of Nvidia’s contribution came through GPU compute infrastructure rather than direct cash, making the return calculation more nuanced.
CEO Sam Altman’s Equity Remains Undetermined
Perhaps the most striking revelation in the ownership document is that Sam Altman, who has served as OpenAI CEO since 2019, currently possesses zero equity in the organization. His ownership line item shows as undecided. Board chairman Bret Taylor publicly stated in October 2024 that Altman’s equity arrangement had not been finalized. Altman personally refuted speculation about imminent equity grants during an internal employee gathering.
The original OpenAI Foundation nonprofit entity maintains 25.8% ownership with zero capital invested — theoretically producing an infinite return on a holding valued at approximately $219.8 billion. While representing a minority economic interest, the Foundation retains absolute authority over all board member appointments.
OpenAI is preparing for a public market debut targeted for 2026 or early 2027, with discussions centering on a potential $1 trillion valuation. Industry observers anticipate Altman’s ownership compensation will be addressed in connection with that liquidity event.


Drift Protocol said the April 1 attack on its platform followed months of planning and social engineering.
Summary
- Drift said attackers spent six months building trust before using malicious tools to breach contributor devices.
- The exchange linked the exploit with medium-high confidence to actors behind Radiant Capital’s October 2024 hack.
- Drift said repeated in-person contact at crypto events helped attackers study contributors and gain access.
The decentralized exchange linked the case to a group that spent time building trust with contributors before sending malicious tools and links. External estimates put the loss at about $280 million.
Drift Protocol said its early review found a long and organized campaign against the platform. The team said the attackers showed “organizational backing, resources, and months of deliberate preparation” during the operation.
The exchange said the contact began around October 2025. According to Drift, people posing as members of a quantitative trading firm approached contributors at a major crypto conference and claimed they wanted to integrate with the protocol.
Drift said the group kept meeting contributors at several industry events over the next six months. The team said the people involved were technically skilled, knew how Drift worked, and appeared to have real professional backgrounds.
That steady contact helped the group gain trust. Drift said the attackers later used malicious links and tools shared with contributors to compromise devices, carry out the exploit, and remove traces of their activity after the breach.
In addition, Drift said it has “medium-high confidence” that the same actors behind the October 2024 Radiant Capital hack carried out this exploit. That earlier attack caused losses of about $58 million and also involved malware used to gain access to internal systems.
Radiant Capital said in December 2024 that a North Korea-aligned hacker posed as a former contractor and sent malware through Telegram. Radiant said “this ZIP file” later spread among developers for feedback and opened the way for the intrusion.
Drift warns conferences can become attack targets
Drift said the people who met contributors in person “were not North Korean nationals.” At the same time, the team said DPRK-linked threat actors often use third-party intermediaries for face-to-face contact and relationship building.
The exchange said it is now working with law enforcement and other crypto industry participants to build a full record of the April 1 attack.
The case has also added a fresh warning for crypto firms, as conferences and in-person meetings can give threat groups a chance to study teams, build trust, and prepare later attacks.

Key Highlights
- Marvell’s shares climbed 21.3% throughout March, fueled by robust quarterly results and a transformative Nvidia partnership
- Fourth-quarter revenue increased 22.1% to $2.2 billion, while adjusted earnings per share rose 33.3% to $0.80
- Nvidia committed $2 billion to Marvell through an equity investment and unveiled a comprehensive strategic collaboration
- Company executives project 40% data center revenue expansion in fiscal 2027, significantly exceeding Wall Street’s 25% forecast
- Erste Group launched coverage with a Buy recommendation on April 2, highlighting robust financial metrics and AI market positioning
March proved to be a landmark month for Marvell Technology. The semiconductor company not only exceeded expectations with its quarterly performance but also secured a game-changing agreement with Nvidia.
Marvell Technology, Inc., MRVL
The fourth-quarter financial results impressed investors. Revenue surged 22.1% compared to the prior year, reaching $2.2 billion. Adjusted earnings per share hit $0.80, representing a 33.3% increase. Both metrics exceeded Wall Street projections.
Forward-looking guidance reinforced the positive momentum. Executives forecast a 9% sequential revenue boost in the first quarter, with adjusted EPS projected at $0.79. These projections also surpassed analyst expectations.
However, the month’s most significant development arrived on March 31. Nvidia revealed a $2 billion equity stake in Marvell, accompanied by an extensive strategic alliance.
The collaboration encompasses custom silicon development, networking solutions, and optical technology innovations. At its core sits NVLink Fusion, Nvidia’s framework for incorporating external chips into its artificial intelligence infrastructure ecosystem.
The arrangement’s significance lies in the architectural flexibility it creates. Previously, AI infrastructure typically followed two paths: Nvidia-centric systems or custom XPU chip configurations with Ethernet connectivity. This alliance introduces hybrid possibilities — combining XPUs with Nvidia’s GPUs, CPUs, and interconnect technologies.
Data Center Revenue Projections Exceed Expectations
Management established ambitious targets for fiscal 2027. The chipmaker anticipates data center revenue will expand by 40% — substantially surpassing the 25% consensus among financial analysts.
This optimism appears rooted in its XPU operations, which supply custom AI chip intellectual property to cloud computing giants. While concerns had emerged about potential market share erosion at Amazon following the launch of Amazon’s Trainium chips, the aggressive guidance indicates the XPU business remains robust.
Marvell has simultaneously diversified its client portfolio. Microsoft introduced its enhanced Maia2 XPU processor in January, incorporating Marvell’s intellectual property into the chip architecture.
The Nvidia alliance also encompasses silicon photonics — an emerging technology poised to eventually supplant copper-based networking within AI data centers. Given that Nvidia’s existing NVLink infrastructure relies on copper, the partnership with Marvell represents a strategic shift toward optical interconnect solutions.
Wall Street Coverage Intensifies
On April 2, Erste Group launched coverage of Marvell with a Buy recommendation. The investment firm noted that net profits have doubled across the previous five quarters, while return on equity has climbed to 19%.
Erste additionally emphasized Marvell’s competitive advantages in high-performance analog and optical DSP technologies as fundamental drivers behind its optimistic assessment.
The Nvidia investment propelled Marvell to 52-week peak valuations. The stock had traded within a constrained range for much of the preceding six months, but the convergence of impressive earnings and Nvidia’s endorsement triggered a breakout.
Marvell presently trades at approximately 27 times forward earnings projections — a valuation premium compared to last year, though one that numerous analysts consider justified given the data center expansion outlook.
The company’s XPU offerings now interface with Nvidia’s NVLink Fusion infrastructure, potentially unlocking additional revenue opportunities throughout Nvidia’s expanding network of hyperscale clients.
Anthropic, the AI safety-focused lab behind several widely used language models, has moved to formalize its political engagement by launching an employee-funded political action committee named AnthroPAC. A filing with the Federal Election Commission shows the organization as a connected entity to Anthropic, organized as a separate segregated fund and aimed at receiving voluntary contributions from employees. The filing outlines the PAC’s intent to participate in federal elections while remaining aligned with the company’s stated interest in AI policy and safety considerations.
Under U.S. campaign finance rules, individual contributions to a federal candidate are capped at $5,000 per election, with disclosures required through public filings. AnthroPAC’s organizers say the fund is designed to support candidates from both major parties. However, observers and industry watchers are already raising questions about how closely the effort will stay within bipartisan lines, given broader debates over AI regulation, safety standards, and the strategic direction of AI policy in Washington.
The AnthroPAC move lands as Anthropic navigates a fraught relationship with the U.S. government over how its technology should be employed. Separately, the Defense Department in February designated Anthropic as a supply chain risk—an action tied to the company’s stance against the use of its AI in fully autonomous weapons and mass surveillance. Anthropic has challenged that designation in court, contending it constitutes retaliation for a protected position. A federal judge in California has temporarily blocked the measure and paused further restrictions while the dispute unfolds.
Beyond governance and defense concerns, Anthropic has already been active politically this cycle. Notably, the company contributed $20 million to Public First Action, a political committee focused on AI safety and related policy advocacy, underscoring the firm’s broader strategy to influence AI-related regulation and public safety standards.
Meanwhile, Anthropic’s broader ecosystem is drawing capital and infrastructure support that could accelerate its technology roadmap. In a related development, Google is preparing to back a multibillion-dollar data-center project in Texas that would be leased to Anthropic via Nexus Data Centers. The project’s initial phase could exceed $5 billion, with Google expected to provide construction loans and be joined by banks arranging additional financing. The arrangement highlights the growing demand for AI infrastructure capable of supporting expansion in model training, inference, and data storage.
Key takeaways
- Anthropic formed AnthroPAC, an employee-funded political action committee registered as a separate segregated fund under the company’s umbrella.
- The PAC is intended to support candidates from both parties, with strict contribution limits and mandatory disclosures under U.S. election law.
- The move occurs amid fraught relations with the Pentagon over AI use, including a safety-focused designation that Anthropic is challenging in court.
- Anthropic has a track record of political giving in this cycle, including a $20 million contribution to Public First Action focused on AI safety.
- Google’s backing of a Texas data-center project for Anthropic signals strong infrastructure demand and potential financing mechanisms that could accelerate AI deployment.
Anthropic’s political engagement and the policy context
The formation of AnthroPAC marks a notable step in how AI firms engage with lawmakers and regulators. By coordinating staff contributions through a dedicated PAC, Anthropic signals a structured approach to influencing elections and policy debates that shape the development and governance of artificial intelligence. The FEC filing describes AnthroPAC as a “connected organization” operating under a separate segregated fund, aligning with typical industry practices for corporate-employee political activity. While the stated aim is bipartisanship, the broader AI policy environment in the United States has become highly polarized, with differing views on liability, safety mandates, data privacy, and government access to AI systems.
Investors and builders watching the space can interpret this as part of a broader trend: major AI developers increasingly engage directly in policy conversations, seeking to frame the regulatory environment in ways that balance innovation with oversight. The implications extend beyond ethics and governance; policy direction can materially affect the regulatory runway for product development, procurement, and collaboration with public sector actors. The presence of a formal PAC also raises questions about how corporate political contributions could influence which AI-safety and governance proposals gain traction on Capitol Hill and in regulatory agencies.
Defense frictions and legal maneuvering
The tension between Anthropic and the Department of Defense centers on how the company’s models should be deployed in sensitive contexts. The Pentagon’s decision to label Anthropic as a supply chain risk stemmed from the company’s public stance against fully autonomous weapons and broad surveillance use. Anthropic has challenged that designation in court, arguing that it amounts to retaliation for a viewpoint it regards as legitimate and protected. A federal judge in California issued a temporary ruling to pause the measure and related restrictions while the case proceeds, illustrating the jurisdictional balance between corporate risk assessments and national-security considerations in AI technology usage.
For policymakers, the case underscores a core policy question: where should the line be drawn between compelling safety and preserving innovation? If courts narrow how procurement risk designations can be wielded, it could affect how similar technology providers are treated as the government expands its AI procurement and testing programs. Conversely, if the government can justify risk designations on safety grounds, it could strengthen leverage for tighter controls on how AI systems are used in defense contexts.
Political giving and AI-safety advocacy
Anthropic’s political activity isn’t limited to its new PAC. Earlier in the cycle, the company contributed a sizable $20 million to Public First Action, a political arm focused on AI safety and public-interest considerations tied to the development and governance of AI technologies. This level of funding signals a broader strategy to influence public discourse and regulatory design around AI, complementing the PAC’s electoral role with policy advocacy and education efforts. Observers are watching how such funding patterns translate into concrete policy outcomes, particularly in an environment where legislators are weighing landmark AI bills and safety standards that could shape model development, data usage, and transparency requirements.
Infrastructure bets amid AI acceleration
Infrastructure matters are increasingly central to AI strategy, and Google’s involvement in a Texas data-center project for Anthropic is a vivid illustration. The Nexus Data Centers-leased facility, if realized as outlined, could become a cornerstone asset to support large-scale model training and deployment. The project’s initial phase exceeding $5 billion underscores the capital intensity of modern AI initiatives and the financial orchestration that underpins them. Google’s expected role in providing construction loans, alongside competitive financing arrangements from banks, points to the consolidation of AI infrastructure finance as a distinct sub-market within the tech sector. For Anthropic and similar firms, such backing could shorten timelines to deploy more capable models and scale services that demand robust, energy-efficient, and highly reliable data-center capacity.
As policy debates progress, industry participants and investors should monitor both political and practical developments: how much traction new AI safety proposals gain in Congress, how procurement rules evolve in defense programs, and how infrastructure financing evolves to accommodate the next wave of AI workloads. Each of these strands will influence not only which AI products reach market first, but also how quickly the industry can translate research advances into real-world use cases across enterprise, healthcare, and public services.
Readers should stay attentive to any updates on Anthropic’s PAC activity and the Pentagon case outcomes, as both arenas will shape the company’s public-facing strategy and its broader partnerships. The balance between safety-driven governance and aggressive innovation remains a live tension set to define the next phase of AI adoption and investment.

‘Hidden gem’ Robin Hood’s Bay ranked a top staycation spot

Medik8 Physical Sunscreen SPF50+ Urgently Recalled in Australia Over Failure to Meet Advertised SPF Rating

BTC enters April at its most hated level since the war began


-

 NewsBeat3 days ago
Steven Gerrard disagrees with Gary Neville over ‘shock’ Chelsea and Arsenal claim | Football
-

 Business3 days ago
No Jackpot Winner and $194 Million Prize Rolls Over
-

 Fashion2 days ago
Weekend Open Thread: Spanx – Corporette.com
-
Entertainment6 days ago
Fans slam 'heartbreaking' Barbie Dream Fest convention debacle with 'cardboard cutout' experience
-

 Crypto World4 days ago
Gold Price Prediction: Worst Month in 17 Years fo Save Haven Rock
-

 Tech6 days ago
The Pixel 10a doesn’t have a camera bump, and it’s great
-
Crypto World5 days ago
Dems press CFTC, ethics board on prediction-market insider trades
-

 Tech6 days ago
Avatar Legends: The Fighting Game comes out in July and it looks pretty slick
-

 Business3 days ago
Login and Checkout Issues Spark Merchant Frustration
-

 Sports15 hours ago
India men’s 4x400m and mixed 4x100m relay teams register big progress | Other Sports News
-

 Tech6 days ago
Apple will hide your email address from apps and websites, but not cops
-

 Sports5 days ago
Tallest college basketball player ever, standing at 7-foot-9, entering transfer portal
-

 Tech5 days ago
EE TV is using AI to help you find something to watch
-

 Politics6 days ago
Should Trump Be Scared Strait?
-

 Tech5 days ago
Flipsnack and the shift toward motion-first business content with living visuals
-

 Fashion6 days ago
The Best Spring Trends of 2026
-

 Tech5 days ago
How to back up your iPhone & iPad to your Mac before something goes wrong
-
Crypto World7 days ago
Bitcoin’s Six-Month Losing Streak: What On-Chain Data Says About the Market’s Next Move
-

 Politics6 days ago
BBC slammed for ignoring author of The Fraud
-
Tech5 days ago
Daily Deal: StackSkills Premium Annual Pass
You must be logged in to post a comment Login