

Crypto World
Why Most Crypto Users Are Actually Speculating on Attention

Crypto markets love pretending they run on fundamentals. In reality? A massive part of the market moves because of attention velocity — who’s being talked about, which narrative is trending, what influencers are amplifying, and which meme is capturing the timeline for 48 hours before everyone rotates to the next shiny thing. 😅
The uncomfortable truth is that many traders are not investing in technology, revenue, or long-term adoption. They are trading social gravity.
And sometimes, that matters more than the product itself.
The Market No Longer Trades Fundamentals First
Traditional finance often values assets based on cash flow, earnings, or economic performance.
Crypto operates differently.
A token can rally 300% with:
- no revenue,
- no users,
- no sustainable tokenomics,
- and sometimes no working product.
Why?
Because markets now react to visibility before utility.
If enough people pay attention to a narrative, liquidity follows. Once liquidity arrives, traders chase momentum. Then engagement algorithms amplify the movement even further.
The cycle feeds itself.
In many cases, price is simply the chart representation of collective online attention.
Narrative Rotation Is the Real Market Cycle
Every cycle in crypto develops its own obsession:
- DeFi summer
- NFTs
- Play-to-earn
- AI tokens
- Solana memes
- Restaking
- RWAs
- Telegram trading bots
- Perp DEXs
The pattern rarely changes.
Capital rotates toward the story, attracting the most engagement at a specific moment.
Sometimes the underlying technology is genuinely innovative. Other times, the narrative arrives years before actual adoption.
But traders often don’t care.
They only need enough momentum to front-run the next wave of attention.
This is why entire sectors can explode in valuation before proving product-market fit. The narrative itself becomes the asset.
Influencers Became Market Infrastructure
Crypto influencers are no longer just commentators.
Many effectively function as liquidity routers.
A single large account posting about a low-cap project can:
- trigger retail inflows,
- create trending discussions,
- activate algorithmic visibility,
- attract copy traders,
- and generate enough momentum for price expansion.
This creates a dangerous feedback loop.
Projects increasingly optimize for influencer exposure instead of product quality because attention has become a monetizable infrastructure.
The incentive is obvious:
- building takes years,
- Virality takes one tweet.
As a result, some teams prioritize:
- aesthetic branding,
- meme creation,
- engagement bait,
- rage farming,
- and influencer partnerships
over actual protocol development.
And honestly? The market often rewards them for it.
Engagement Farming Is the New Yield Farming
A few years ago, crypto users farmed liquidity incentives.
Today, many farm impressions.
CT (Crypto Twitter) evolved into an economy where attention itself has financial value:
- more visibility = more followers,
- more followers = more influence,
- more influence = more deal flow,
- More deal flow = more monetization opportunities.
This changes user behavior dramatically.
People post extreme predictions because outrage spreads faster.
They recycle bullish narratives because optimism attracts engagement.
They post “alpha” threads because authority converts into social capital.
In some cases, traders are no longer analyzing markets.
They are analyzing what other people will pay attention to next.
That’s a completely different game.
Memetic Momentum Is Stronger Than Logic
Memes simplify complexity into emotion.
And markets move emotionally far more often than people admit.
A meme coin with:
- strong branding,
- recognizable humor,
- viral community culture,
- and relentless online presence
can outperform technically superior projects simply because it captures the collective imagination.
Memes spread faster than research reports.
Jokes travel faster than whitepapers.
Identity spreads faster than utility.
This is why memetic momentum became one of the strongest forces in crypto markets.
At scale, attention itself becomes liquidity.
The Attention Economy Created Reflexive Markets
Crypto is uniquely reflexive.
Attention drives price.
Price attracts more attention.
More attention attracts more buyers.
More buyers push the price higher.
This loop continues until attention fades.
Then the reverse happens just as violently.
This explains why:
- dead ecosystems suddenly revive,
- abandoned narratives return,
- low-quality tokens temporarily outperform,
- And fundamentally strong projects can remain ignored for years.
Visibility often matters more than value creation in the short term.
That doesn’t mean fundamentals are irrelevant.
It means fundamentals frequently lose to narrative timing.
The Dangerous Part Most Traders Ignore
Many users believe they are trading technology.
In reality, they are often trading crowd psychology amplified by algorithms.
That distinction matters.
Because once attention becomes the primary driver:
- volatility increases,
- conviction weakens,
- narratives shorten,
- and markets become increasingly emotional.
This environment rewards speed, positioning, and social awareness more than deep technical understanding.
The smartest traders in modern crypto are not just reading charts anymore.
They are reading timelines.
Final Thoughts
Crypto has evolved into one of the purest attention markets ever created.
The winners are not always the best builders.
Sometimes they are simply the best storytellers.
And whether people admit it or not, much of modern crypto speculation revolves around one thing:
Capturing attention before everyone else notices where it’s flowing next.
REQUEST AN ARTICLE

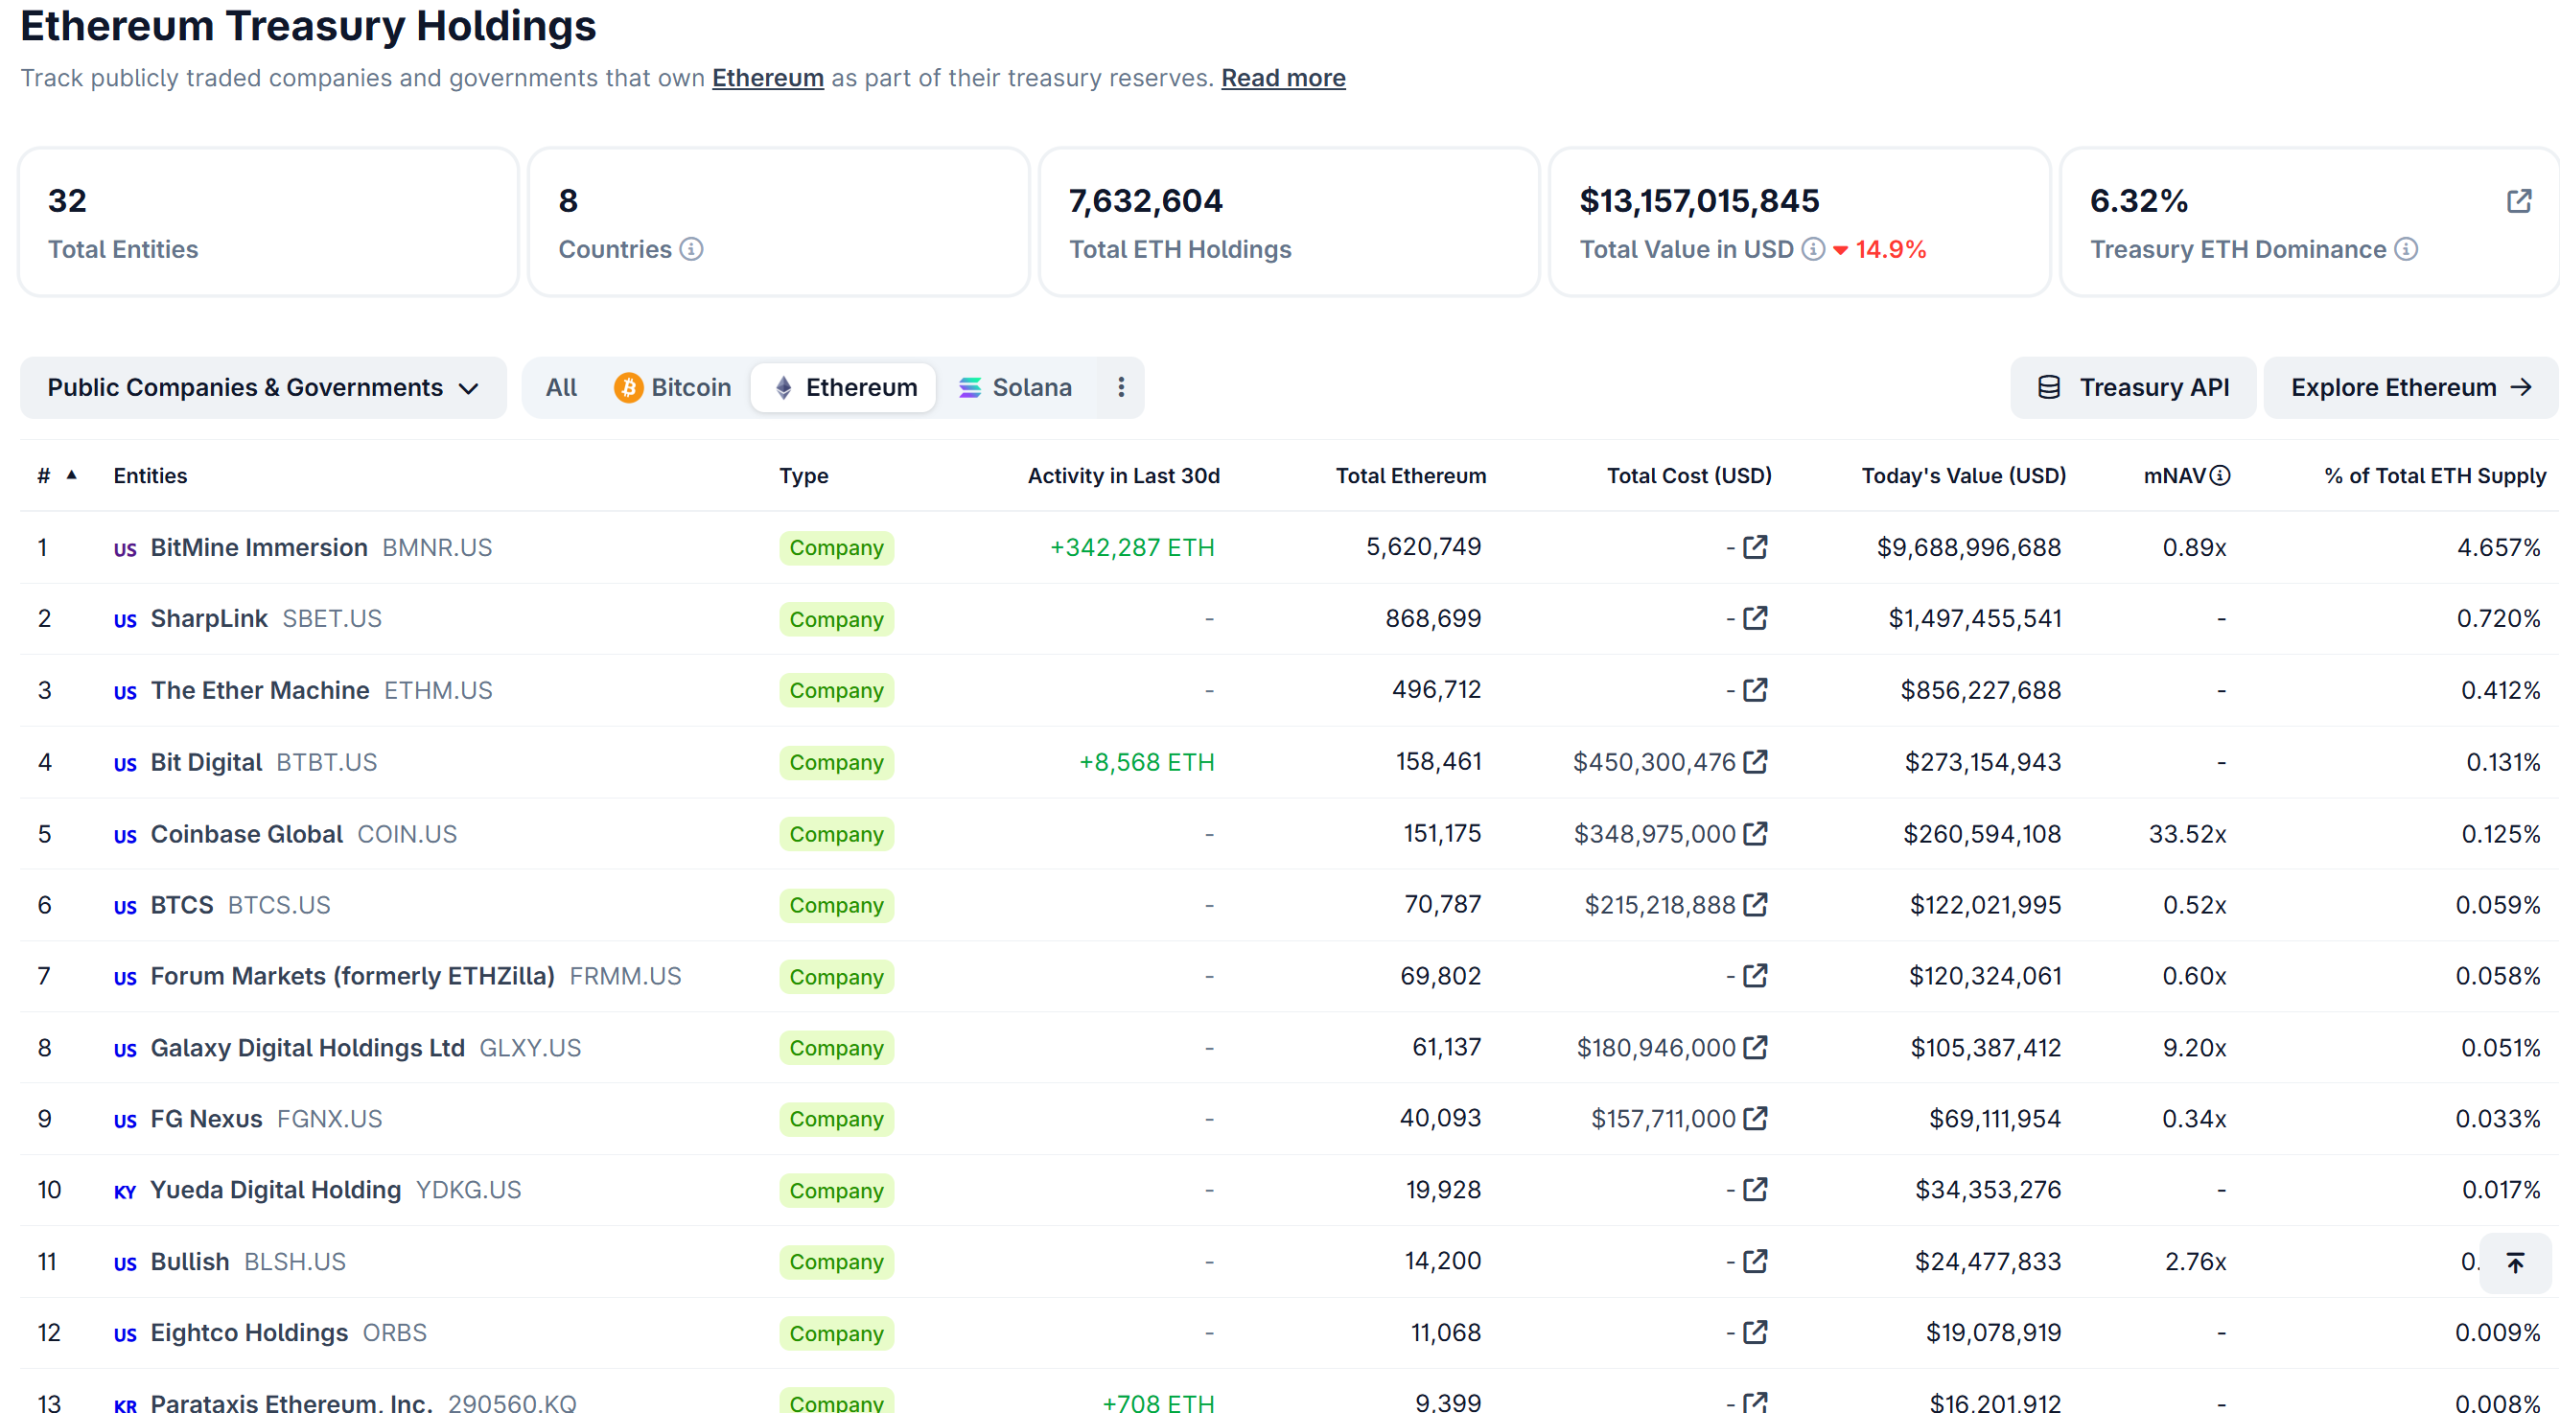
Tom Lee rejected warnings that core Ethereum development could face a funding crisis within nine months. “Zero chance” of a crisis, according to him.
These comments come as pressure builds on the Ethereum Foundation, where senior staff have been leaving, and concerns over long-term funding are growing. A former contributor who helped build Ethereum’s main outside funding vehicle now says core development needs about $30 million a year.
What Sparked the Ethereum Funding Fears
Trent Van Epps, who spent five years coordinating core protocol funding at the Ethereum Foundation, warned that development could slide into a slow-burning crisis within 3 to 9 months.
He flagged two sources tightening at once:
- The Client Incentive Program, a four-year initiative that paid client teams from staking rewards, expired in April with no successor.
- The Foundation is separately winding annual treasury spending from 15% toward a 5% baseline over five years, a path set by its own June 2025 policy.
The warning carries weight because Van Epps co-founded Protocol Guild, the main vehicle for funding core contributors outside the Foundation.
It vests donated project tokens to a curated list of developers and asks projects to pledge 1% of their supply, money that helps cover the network’s client teams and researchers.
Foundation Departures Deepen the Unease
The turmoil reaches the top. Hsiao-Wei Wang, who authored that treasury policy, stepped down as co-executive director on June 18, months after her counterpart Tomasz Stańczak exited in February.
“After my sabbatical, I have decided to step down as co-executive director and board member of the Ethereum Foundation effective today,” Wang stated.
Both co-director seats have now turned over this year.
At least eight senior staff members have left in the past five months, fueling debate over the foundation’s direction.
Board member Bastian Aue is serving in an interim capacity, while researcher Dankrad Feist tied the losses to management, not strategy.
“The problem isn’t with the strategy, it’s with management. And this exodus of talent is truly bearish for Ethereum, sadly.”
Follow us on X to get the latest news as it happens
Why Tom Lee Sees No Crisis
Lee chairs BitMine Immersion Technologies, the largest corporate Ethereum treasury, which holds more than 5 million ETH and is staking toward a target of 5% of all supply.

That position grounds his thesis that profit-seeking stakers, not the Foundation, will bankroll the network. He called the exits short-term noise.
“In my opinion, zero chance of this ‘crisis’ happening for $ETH zero ‘Funding secured’”
Bulls add that independent client teams, and Van Epps’ own Protocol Guild, keep core work going without the Foundation.
Skeptics are not convinced. Investor Virtual Bacon argued that layer-1 networks rarely die from a lack of money but stall when builders stop building, citing EOS and Cosmos as projects that faded after talent left.
“…two co-EDs out plus a funding warning at once, not one exit. Cosmos and Eos had builders too, they stalled when the will went. ETH might survive it, no L1 has yet,” he added.

Ethereum traded for $1,725 as of this writing, up only by a modest 2% in the last 24 hours.
The post Ethereum Crisis or Overblown FUD? Tom Lee Rejects Funding Fears appeared first on BeInCrypto.
Bitcoin has climbed more than 2% to $63,770 after a ceasefire agreement between Israel and Hezbollah helped ease market fears and pushed oil prices toward an 8% weekly decline.
Summary
- Bitcoin price climbed 2.4% as a ceasefire deal and falling oil prices improved risk appetite.
- A symmetrical triangle breakout above $64,760 could open the door to a move toward $80,000.
- ETF outflows continue, but liquidation clusters above current prices could fuel further gains.
According to crypto.news data, Bitcoin (BTC) price climbed 2.4% to an intraday high of $63,770 on June 20 before easing slightly to around $63,600. The move followed a 7% decline from the June 15 high near $67,200 to a local low around $62,300 on June 18, a drop that coincided with ETF outflows, geopolitical uncertainty, and a broader flight from risk assets.
Fresh optimism emerged after reports that Israel and Hezbollah had agreed to a ceasefire scheduled to begin Friday. Reuters cited a U.S. official confirming the agreement, while Iranian officials signaled readiness to resume diplomacy with Washington if the terms are respected.
The developments reduced immediate fears of a wider regional conflict and helped drive crude oil prices toward an 8% weekly decline, with Brent and WTI benchmarks trading near multi-week lows.
Safe-haven assets such as gold and silver also lost momentum as investors rotated capital into higher-risk assets. Gold fell 1.6% over the past 24 hours while silver dropped roughly 2%, coinciding with Bitcoin’s recovery from weekly lows.
Options positioning and short covering add fuel to rebound
Derivatives traders have turned a technical bounce into a recovery rally. A large options expiry may also be contributing to the move. Nearly $10.6 billion in Bitcoin options are set to expire on June 26, with market participants closely watching the event after reports showed a significant portion of open interest sits above current prices.
The recovery has also forced short sellers to reduce exposure after Bitcoin briefly entered oversold territory following the June 18 selloff. Such conditions often trigger short-covering activity, where traders buy back borrowed assets to close bearish positions, adding upward pressure to BTC price.
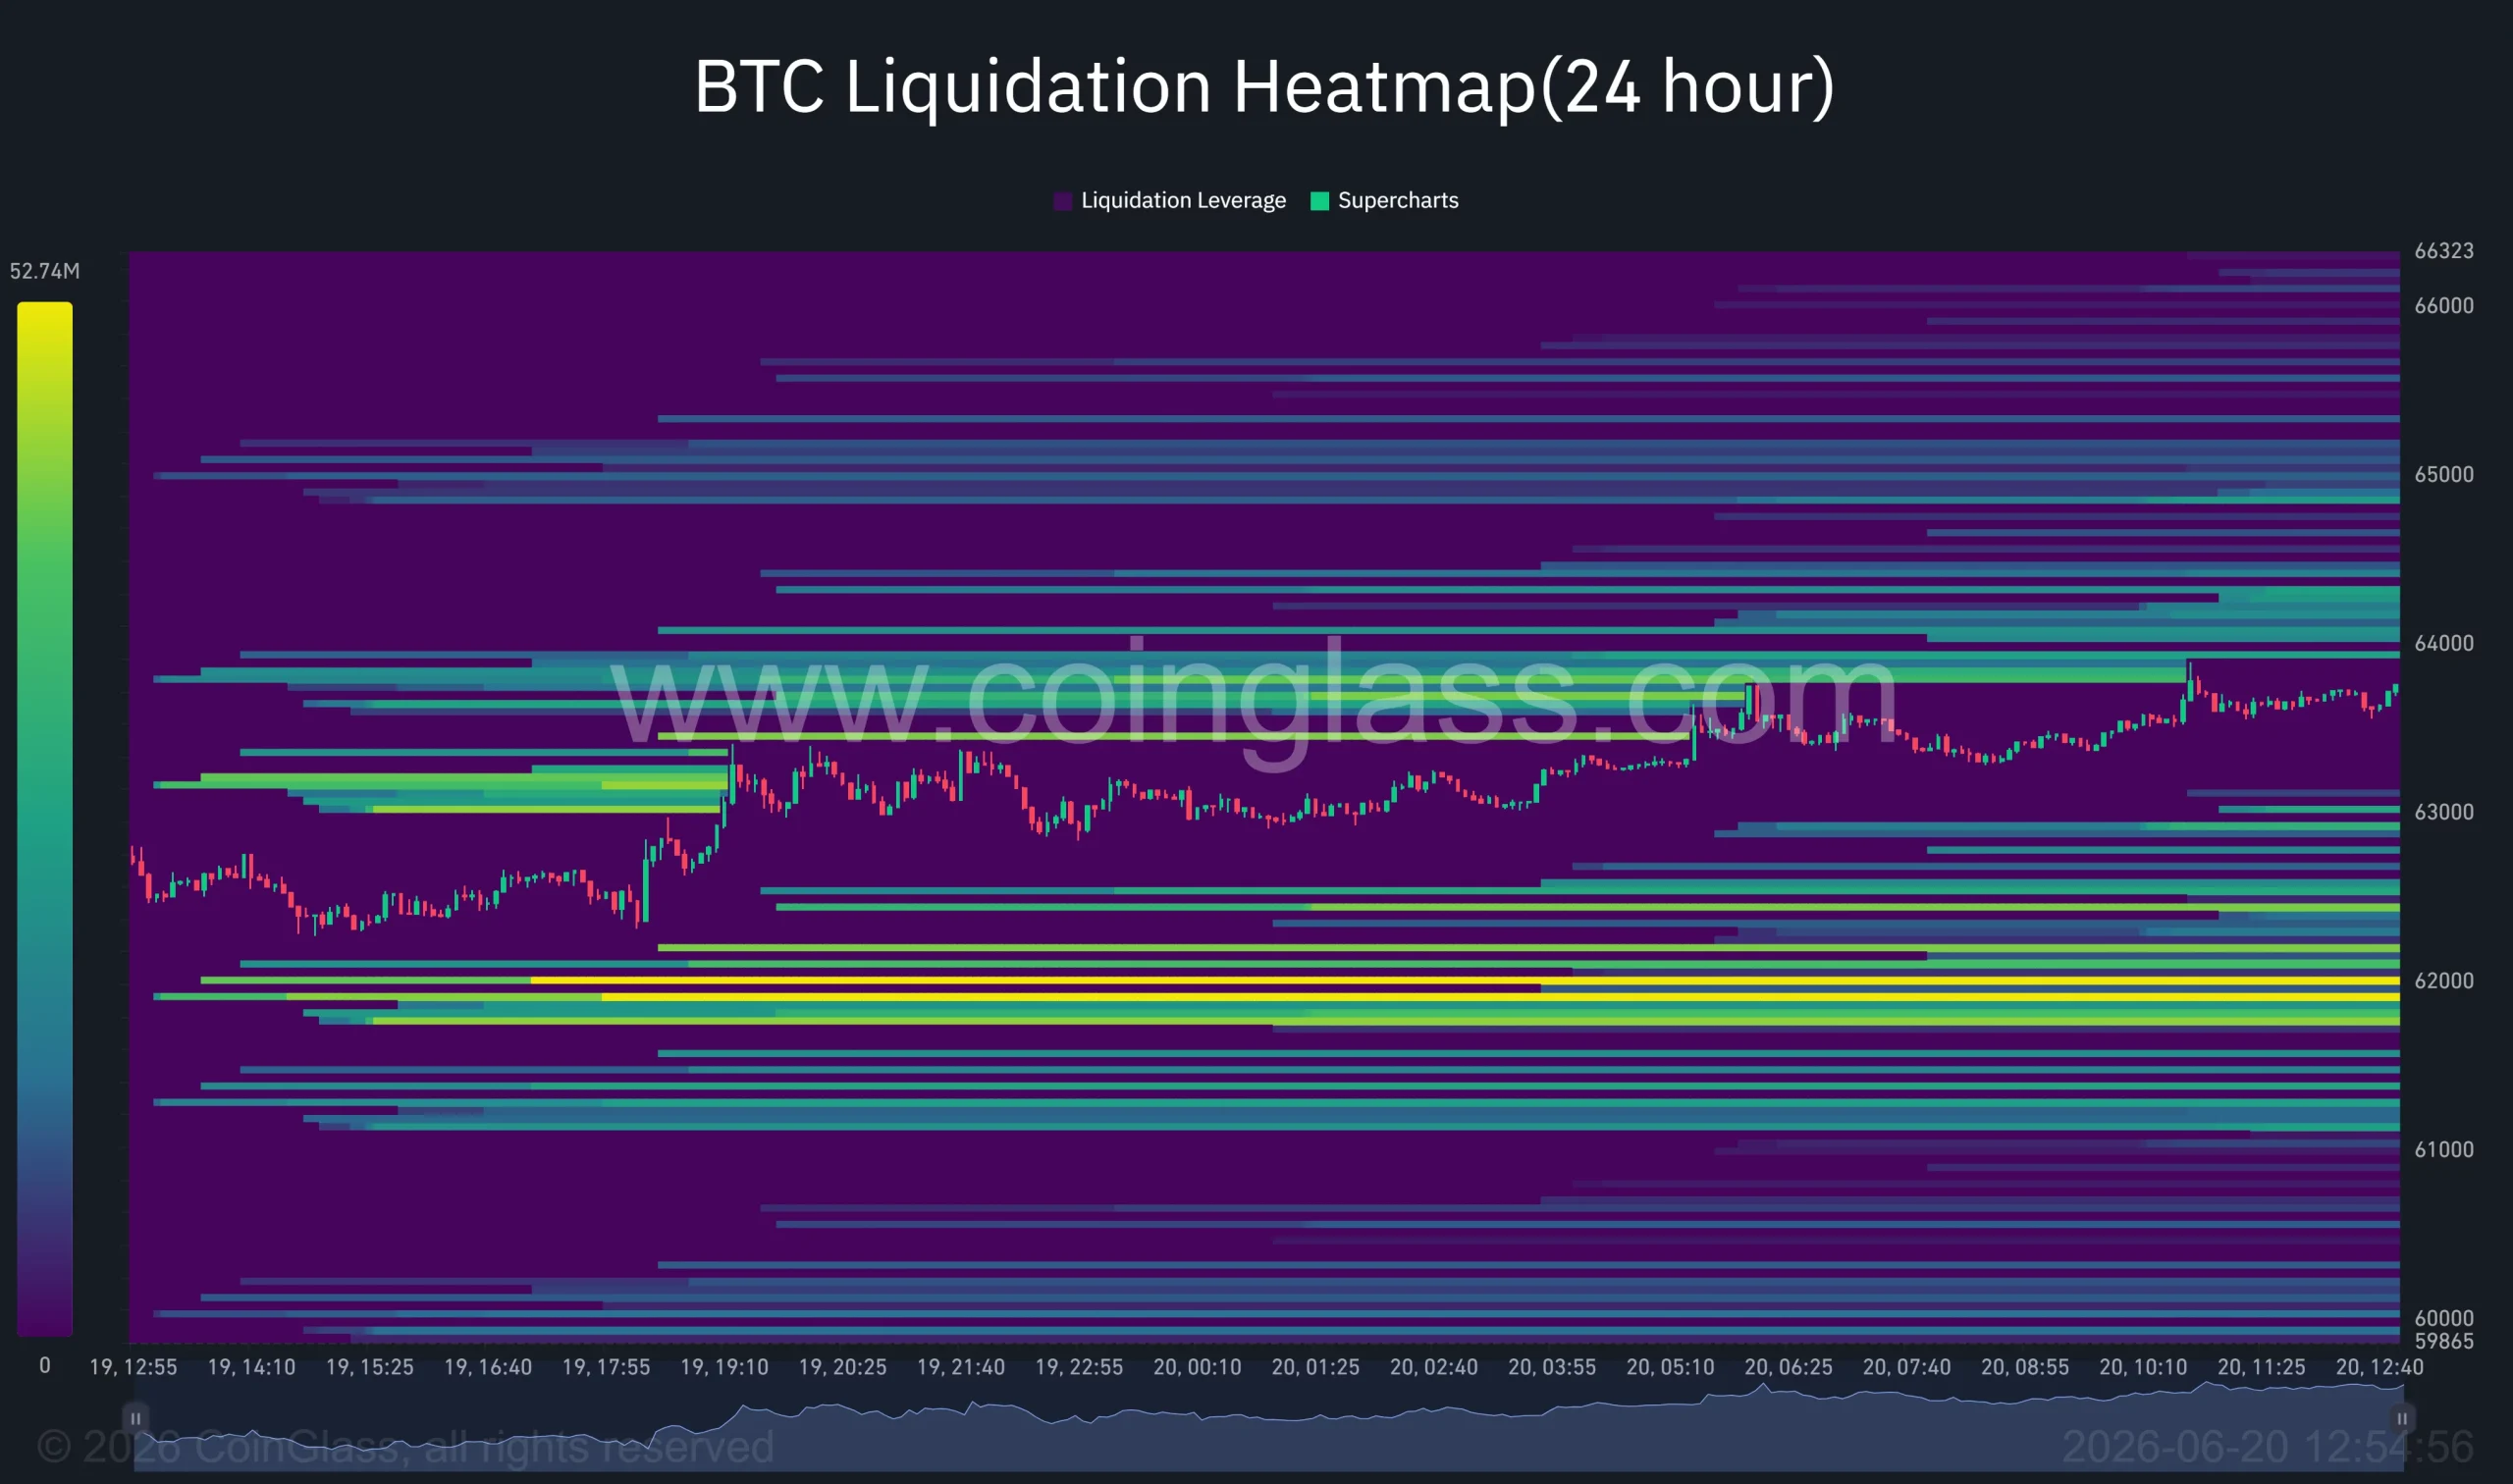
CoinGlass liquidation data shows one of the largest nearby liquidation clusters sits around the $64,000-$65,000 area, directly above current prices.
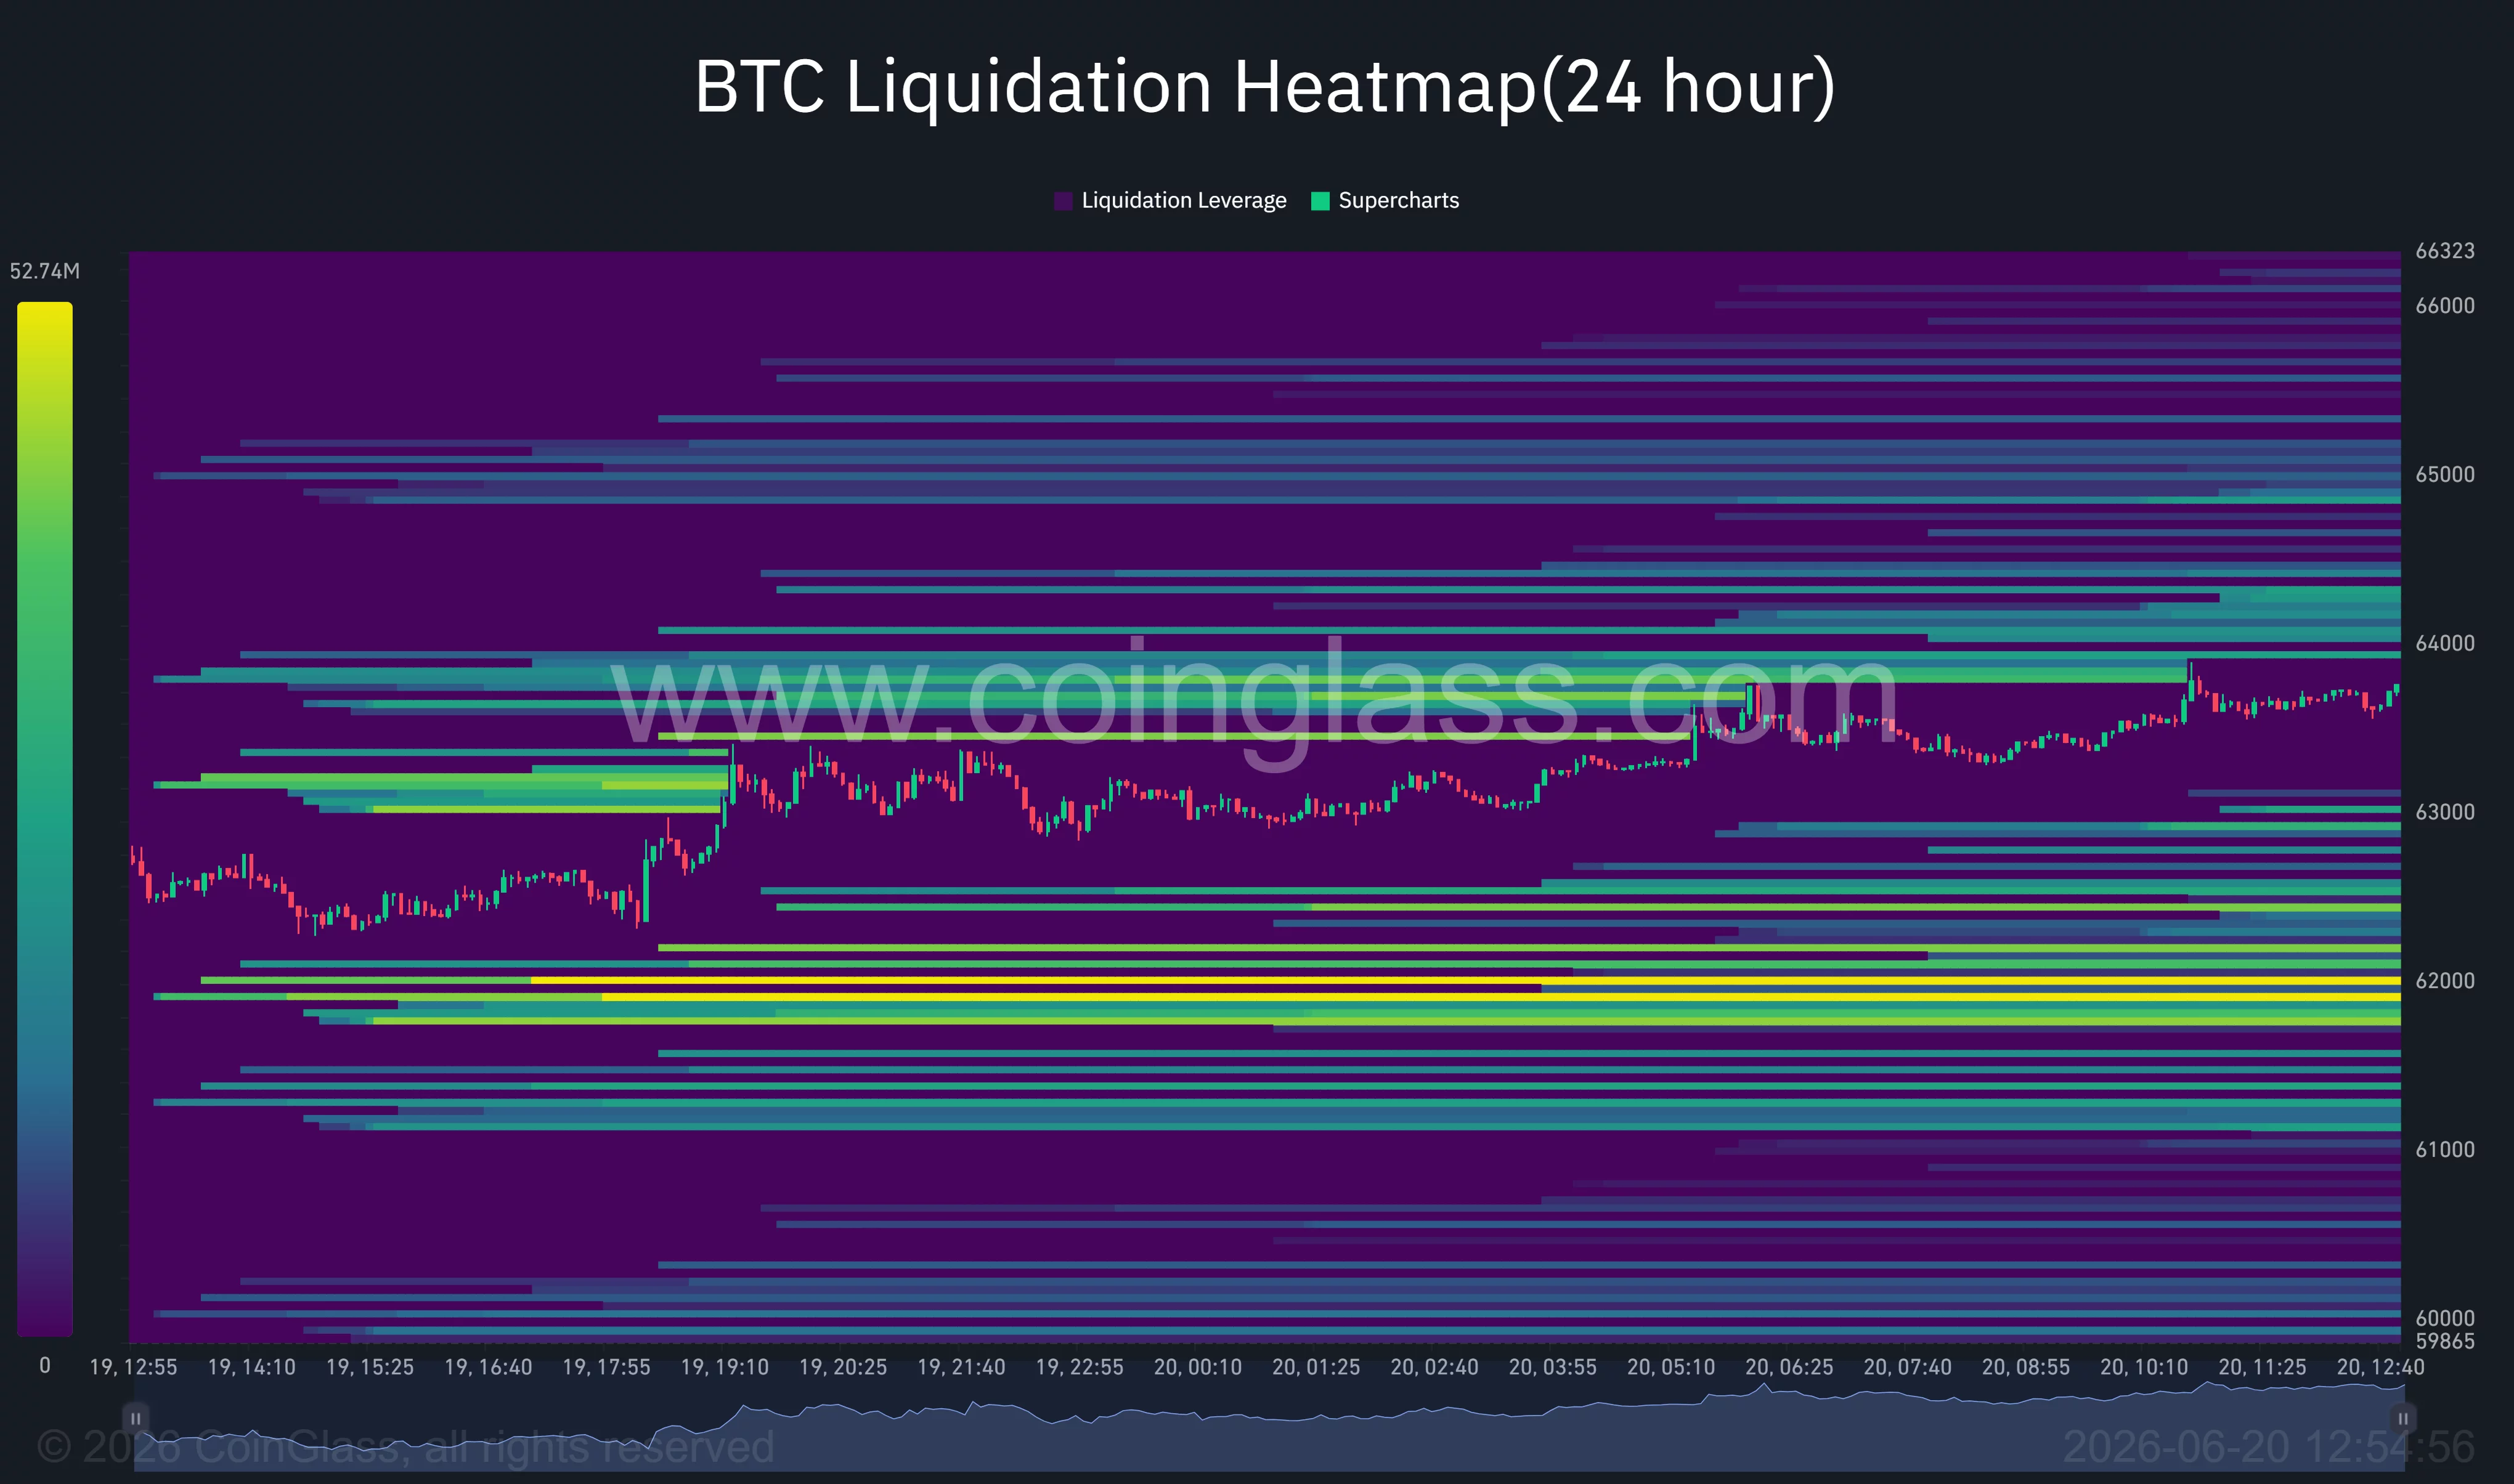
Additional liquidity pockets are visible near $66,000, suggesting that a sustained push higher could trigger another round of forced short liquidations and accelerate volatility.
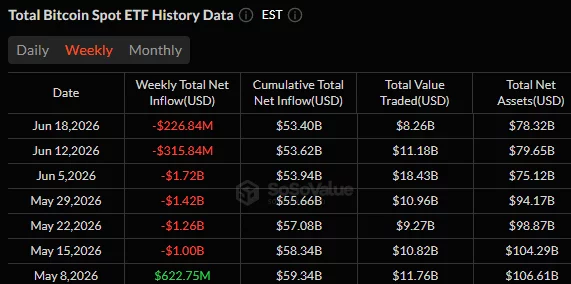
Institutional flows remain mixed. SoSoValue data shows that U.S. spot Bitcoin ETFs recorded more than $226 million in net outflows this week, extending a broader withdrawal trend that has persisted since mid-May. Although those flows remain a headwind, the pace of selling has slowed compared with the panic seen over the previous weeks.
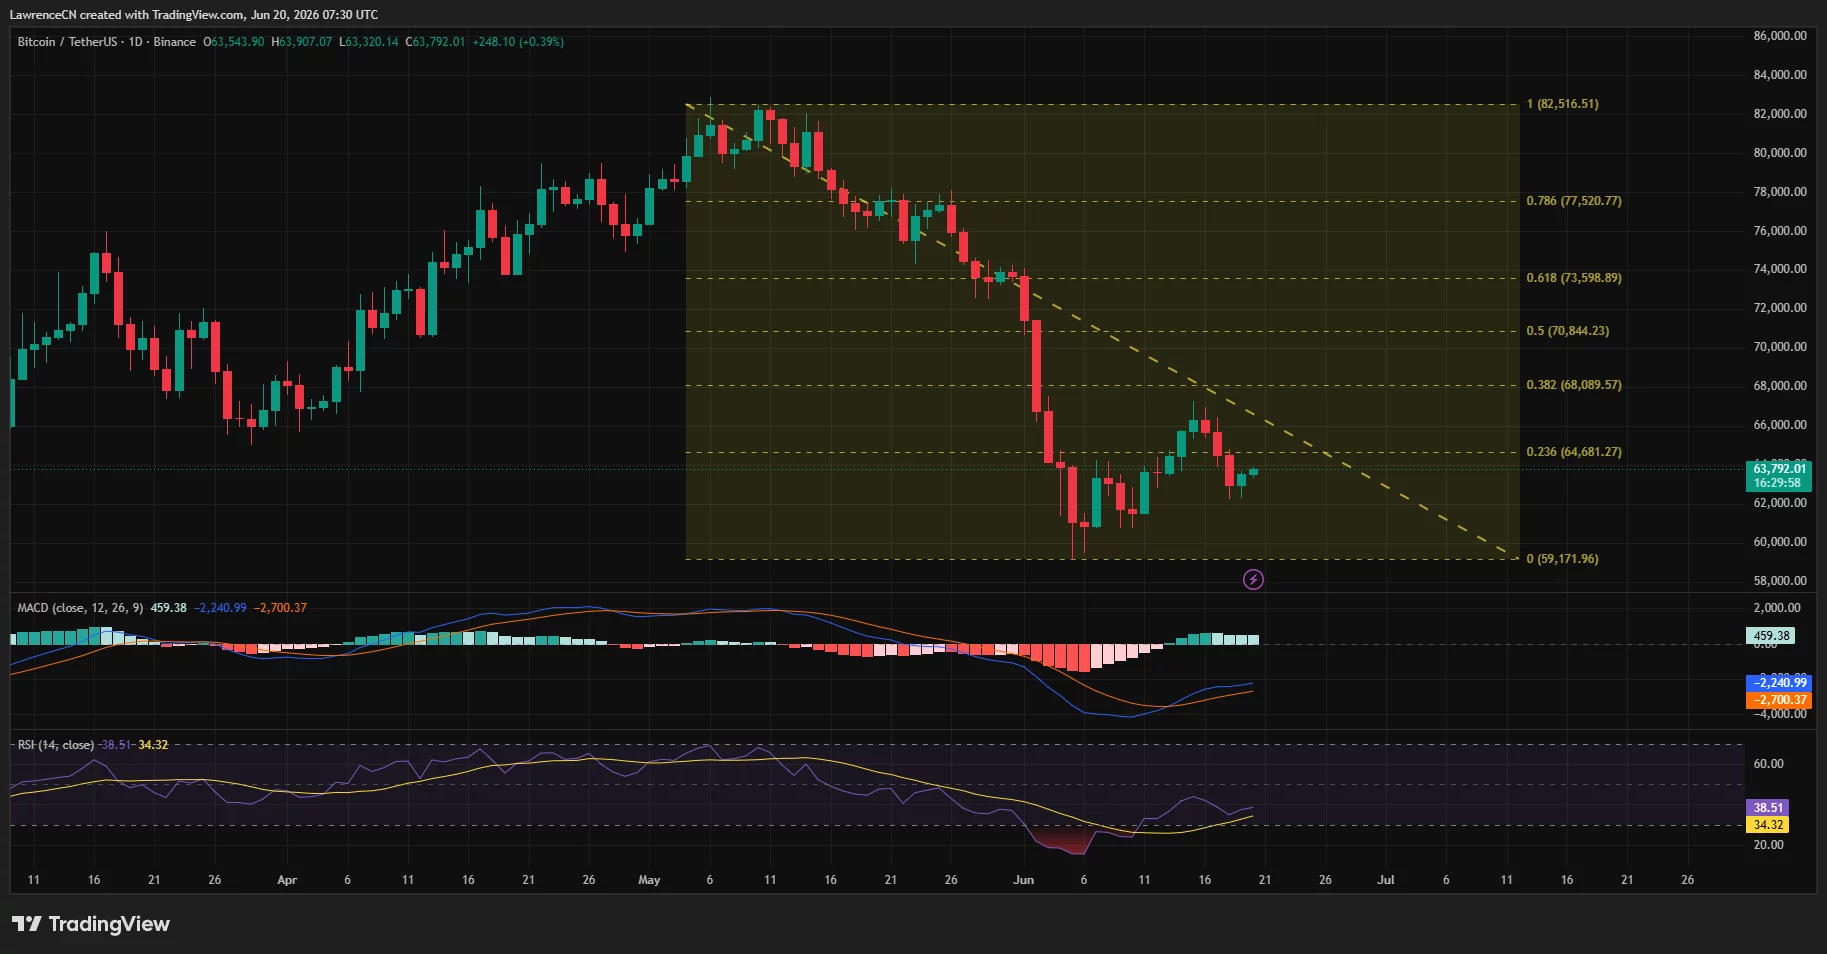
A breakout above $64,700 could open a path toward $80,000
The technical picture has improved considerably on both daily and four-hour timeframes.
On the four-hour chart, Bitcoin is trading inside a symmetrical triangle formed by a descending resistance trendline from the June 15 peak and a rising support trendline extending from the June 5 low. Price has compressed toward the apex of the pattern, a structure that often precedes a large directional move.
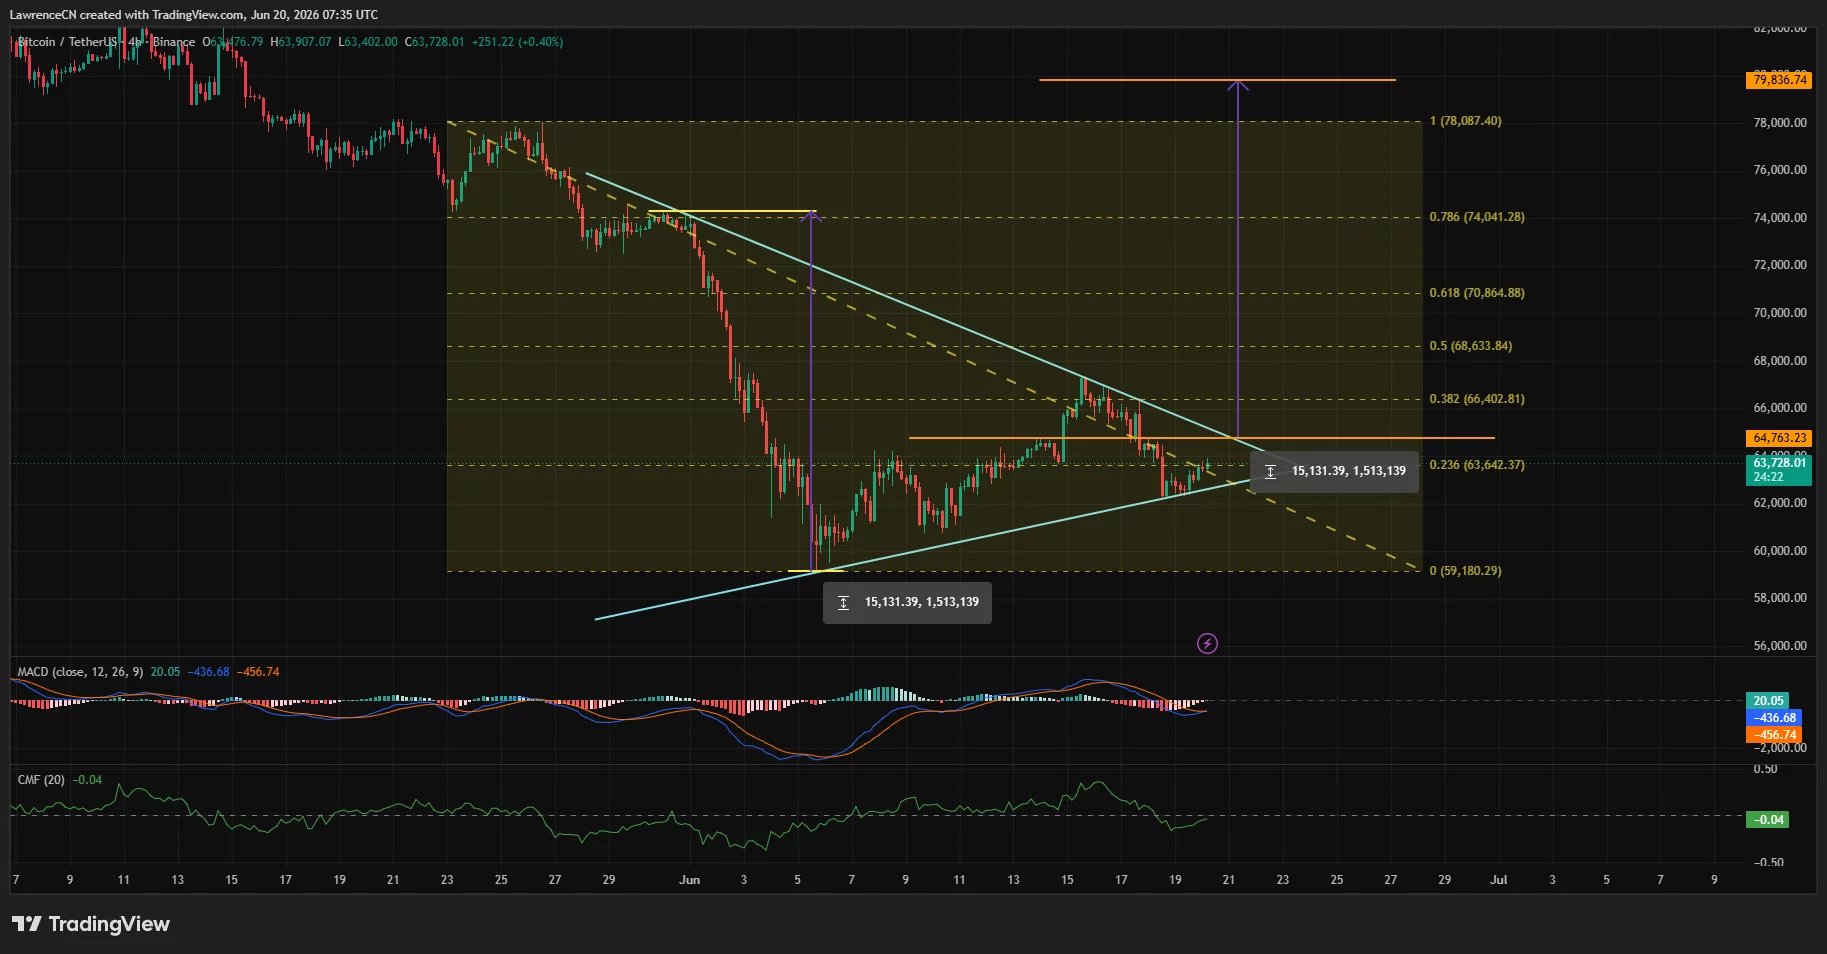
The key breakout level sits near $64,760. A decisive move above that area would place Bitcoin above both the triangle resistance and a major Fibonacci retracement level. The measured move target from the pattern projects toward the $79,000-$80,000 region, which also aligns with resistance near the upper Fibonacci extension visible on the chart.
Daily momentum indicators have started to improve. The MACD histogram has printed consecutive higher readings after a prolonged decline, while the RSI has recovered from near-oversold conditions and climbed back above 38. Chaikin Money Flow remains slightly negative but has begun turning upward, suggesting selling pressure has eased compared with earlier in the month.
The bullish outlook would weaken if Bitcoin loses the triangle’s ascending support and falls below $62,000.
CoinGlass heatmap data shows a large concentration of liquidity around $61,800-$62,000, making that zone an important battleground for traders. A breakdown beneath it could expose the June low near $59,200 and shift momentum back in favor of bears.
Beyond the charts, traders continue to monitor U.S.-Iran negotiations, Federal Reserve policy expectations, and ETF flows. Any renewed escalation in the Middle East, a rebound in oil prices, or another wave of institutional selling could limit Bitcoin’s recovery and delay a breakout attempt.

The Philippine Securities and Exchange Commission (SEC) has indicated it is prepared to regulate the tokenization of real-world assets (RWAs), arguing that the legal and supervisory framework needed for the next wave of capital-markets infrastructure is already in place. Speaking at Philippine Blockchain Week 2026, SEC Commissioner Rogelio Quevedo said he believes the regulator now has the “proper law” and the “proper regulatory mind and background” to support asset tokenization.
Quevedo’s comments also tied tokenization to a consumer-protection goal: expanding legitimate investment channels for overseas Filipino workers (OFWs), who often have capital but limited avenues to put it to work safely. He said enhanced enforcement—including the use of artificial intelligence—has improved the SEC’s ability to respond to scams, and that the agency is working with major online platforms to remove illegal offerings.
Key takeaways
- The Philippine SEC signaled readiness for regulated RWA tokenization, with Commissioner Rogelio Quevedo saying the legal and regulatory groundwork is in place.
- Quevedo framed tokenized products as a potential way to offer more legitimate investment options for OFWs amid persistent scam activity.
- The SEC is leveraging enforcement tools, including AI, and collaborating with online platforms to target fraudulent investment promotions.
- The SEC’s Strategic Sandbox (StratBox) provides a controlled environment for fintech firms to test new models while remaining subject to existing laws.
Tokenization positioned as innovation—and protection
Quevedo said the SEC’s confidence in tokenized assets stems from both legal authority and operational capacity. In his remarks, he suggested that asset tokenization could stimulate broader innovation within the capital markets and potentially reshape how exchanges function, describing the technology as having the potential to “revolutionize” stock exchange activity.
Just as important to the commissioner’s framing was investor protection. According to Quevedo, many OFWs have funds available but may struggle to identify credible investment routes. He pointed to scams that promise returns and target Filipinos looking for ways to grow their money. By supporting tokenized investment products within a regulatory structure, the SEC appears to be aiming to reduce the gap between where investors want to deploy capital and the quality of products available to them.
Quevedo also highlighted the regulator’s enforcement evolution. He said the SEC is using artificial intelligence to pursue “unscrupulous scams” and is coordinating with platforms such as Google and TikTok to remove illegal investment offerings. That combination—technology-assisted monitoring alongside platform-level takedowns—signals a more aggressive approach to combating fraudulent activity in parallel with any move toward tokenization.
StratBox: testing new models under SEC supervision
Quevedo’s statements build on the SEC’s existing sandbox mechanism, known as the Strategic Sandbox (StratBox). The framework, described in an SEC memorandum circular, is designed to let fintech companies test new products and business models in a live environment while remaining under regulatory supervision. The SEC may waive or modify certain regulatory requirements for individual sandbox participants—within the boundaries of its legal authority.
Just as the sandbox can offer flexibility, it does not create a blanket exemption. Participation does not automatically excuse firms from complying with applicable laws, and the sandbox cannot be used to sidestep legal or regulatory obligations. For investors and market participants, that distinction is crucial: tokenization may be explored in controlled conditions, but compliance expectations remain in view.
Earlier sandbox admissions hint at tokenization’s direction
The SEC’s sandbox approach has already included test cases relevant to tokenization and digital-finance workflows. In November 2025, the SEC said four companies were admitted to the StratBox, including one testing a tokenized real estate offering. Other participants were reported to be testing access to United States equities, while BlockShoals Technologies received in-principle approval to test crypto-related products and services, as described in coverage of the SEC sandbox process.
These prior admissions suggest the SEC’s sandbox is being used not only to observe digital finance features in isolation, but to evaluate how tokenized or crypto-adjacent models might interact with traditional investment access and regulatory expectations. At the same time, the commissioner’s 2026 remarks indicate that tokenization is no longer just an experimental topic—it is now being discussed as a policy priority backed by institutional readiness.
Why the SEC’s position matters for Philippine capital markets
If the SEC follows through on its readiness narrative, tokenization could become a more structured part of the Philippines’ capital-market development rather than a purely offshore or unregulated trend. For potential issuers, the key takeaway is that the regulator is signaling willingness to accommodate asset tokenization under a framework that includes legal structure, supervision, and enforcement capability.
For investors—especially those with cross-border ties—this could translate into a wider menu of regulated investment options. Quevedo’s remarks about OFWs underscore that the SEC is explicitly thinking about who is most exposed to scam targeting and what kinds of legitimate products might reduce that vulnerability. The enforcement emphasis, including AI-assisted pursuit of fraudulent schemes and engagement with large social and search platforms, also signals that the SEC is trying to close the channel through which illegal offerings are often promoted.
However, the sandbox model also implies a measured pace. Because StratBox participants are expected to remain subject to existing laws, tokenization in practice will likely advance through controlled pilots and specific approvals rather than open-ended experimentation. The details of how specific tokenized products would be authorized and supervised—especially across categories such as real estate, equities access, and other RWAs—remain for future regulatory guidance and individual approvals.
Readers should watch for how the SEC translates commissioner-level confidence into concrete licensing, product rules, and sandbox outcomes—particularly whether tokenized real estate and tokenized market access cases move from controlled testing toward broader authorization. Equally, the SEC’s use of AI and platform cooperation will be a key indicator of how quickly enforcement can keep pace with any expansion of tokenized offerings.

The Philippine Securities and Exchange Commission (SEC) has signaled that the country is ready to accommodate the tokenization of real-world assets (RWAs), with Commissioner Rogelio Quevedo saying he believes the necessary legal and regulatory foundations are in place.
Speaking onstage at the Philippine Blockchain Week 2026, Quevedo said the SEC was “now fully convinced that we have the proper law [and] the proper regulatory mind and background” to accept asset tokenization. He said the technology could spur innovation in the capital markets and “revolutionize” stock exchanges.
In an interview with Cointelegraph, Quevedo said tokenized investment products could provide overseas Filipino workers (OFWs) with more legitimate investment options. “Our OFWs, they have the capital. They do not know where to place their money. They do not know how to make their money earn,” he said, pointing to investment scams that have targeted Filipinos seeking returns.
Quevedo also told Cointelegraph that the regulator’s enhanced enforcement capabilities have made it better prepared to oversee emerging technologies. “We are also using artificial intelligence to go after these unscrupulous scams,” he told Cointelegraph, adding that the SEC was working with Google, TikTok and other online platforms to remove illegal investment offerings.
The remarks frame regulated tokenization as both a capital-markets innovation and a potential investor-protection tool in the Philippines, where the SEC continued to pursue unregistered investment schemes.

Philippine SEC Commissioner Rogelio Quevedo (left) and Cointelegraph’s Ezra Reguerra (right) at the Philippine Blockchain Week 2026. Photo: Cointelegraph
Philippine SEC tests tokenized assets under regulatory sandbox
Quevedo’s remarks build on the SEC’s Strategic Sandbox, or StratBox, which allows fintech companies to test new products and business models in a live but controlled environment under regulatory supervision.
The framework allows the SEC, within the scope of its legal authority, to waive or modify certain legal and regulatory requirements for individual sandbox participants. However, participation does not automatically exempt a company from existing laws, and the sandbox cannot be used to circumvent legal or regulatory requirements.
Related: Meta rolls out stablecoin payouts for creators in Philippines, Colombia
In November 2025, the SEC said four companies had been admitted to the sandbox, including one testing a tokenized real estate offering. Two participants were testing access to United States equities, while BlockShoals Technologies received in-principle approval to test crypto-related products and services.
Magazine: China’s 107 Bitcoin memory thief, Bithumb CEO booked: Asia Express

The expected delay with the latest Pi Network protocol update continues, but the team behind the project has now urged certain nodes to move faster so that it can be completed soon.
Meanwhile, the project’s native token has finally shown some strength, bouncing from the $0.13 support.
PI Nodes, Hurry Up
The crucial protocol updates began at the end of February, and each was implemented on or even before the set deadline. However, that changed with protocol version 24. The upgrade, which is mostly focused on improving the underlying infrastructure that supports node operations and mainnet activity, came with some delay.
Upon its completion, the team set the deadline for the next update in line – version 25. It was supposed to be completed by June 18, but long before that day arrived, the Core Team warned that there might be another setback with the time needed.
A couple of days after the deadline had already expired, the team posted an update earlier this morning about the status of the new update. They reassured that most Mainnet node operators have successfully upgraded to protocol version 25, and urged those who have not to “do so at your earliest convenience.” Otherwise, they risk being disconnected from the network.
Reminder for all Pi Mainnet Node operators: The majority of Mainnet node operators have already successfully upgraded to Protocol v25. If you have not yet upgraded your node, please do so at your earliest convenience to remain connected to the network.
As with previous…
— Pi Network (@PiCoreTeam) June 20, 2026
PI Bounces
The native token of the Pi Network ecosystem dumped hard during the early June market-wide crash, plunging to a new all-time low of under $0.12. It tried to rebound in the following weeks and neared $0.14. However, it faced another rejection there and tested the key support at $0.13 yesterday.
The bulls finally stepped up at this point and didn’t allow another breakdown toward the new low. Instead, PI has jumped by well over 4% on a daily scale, currently trading at around $0.135. It’s up by 15% since its all-time low, but the macro scale is quite painful, showing a 95.4% decline from the ATH seen in February 2025.
As reported yesterday, the token unlocking schedule for the next month is rather promising, with just 4.2 million coins set to be released on average daily. Similar occurrences could continue to ease the immediate selling pressure.
The post PI Price Bounces From Key Support as Pi Network Issues an Important Warning appeared first on CryptoPotato.


Two Texas brothers have pleaded guilty to federal robbery charges after prosecutors said they kidnapped a Minnesota family and forced the transfer of more than $8 million in cryptocurrency.
Summary
- Two Texas brothers pleaded guilty after prosecutors linked them to an $8 million crypto kidnapping and robbery.
- Victims were allegedly held at gunpoint for hours while attackers forced cryptocurrency transfers.
- CertiK reported that crypto-related kidnappings and assaults rose 75% in 2025 from the prior year.
According to the U.S. Attorney’s Office for the District of Minnesota, Isiah Angelo Garcia and Raymond Christian Garcia entered guilty pleas on Thursday to Interference with Commerce by Robbery, a charge that carries a maximum sentence of 20 years in federal prison.
Announcing the development, U.S. Attorney Daniel Rosen said the guilty pleas hold the defendants accountable for their actions during the armed robbery.
Prosecutors say victims were held at gunpoint for hours
Court filings cited by federal prosecutors state that the brothers traveled from Texas to Minnesota on Sept. 19, 2025, to carry out the attack. Authorities said the victim, his wife, and their son were confronted at gunpoint and forced into a prolonged ordeal designed to gain access to cryptocurrency holdings.
While the victim’s wife and son were held inside the family home for approximately nine hours, prosecutors said the victim was taken to a family cabin located roughly three hours away. There, according to the government’s account, he was compelled to transfer about $8 million in cryptocurrency from online accounts and hardware wallets.
The kidnapping began to unravel after the victim’s son managed to place an emergency call. Washington County sheriff’s deputies responded to the report and later recovered a rifle and a shotgun. Investigators also relied on surveillance footage and other evidence that prosecutors said linked the brothers to the crime.
In their plea agreements, both men admitted that firearms were used to threaten the victims during the robbery. Federal prosecutors said the defendants have also agreed to pay more than $8 million in restitution. Sentencing dates have not yet been announced.
Crypto kidnapping cases continue to rise worldwide
The case arrives as physical attacks targeting cryptocurrency holders become more common across multiple countries.
Security firm CertiK reported in February that crypto-related kidnappings and assaults increased by 75% in 2025 compared with the previous year. The company estimated that losses tied to such attacks reached $101 million during the first four months of 2026 alone.
Earlier this month, as reported by crypto.news, another crypto kidnapping case resulted in a guilty plea when Saif Faiq admitted to a federal conspiracy charge in Connecticut. According to the U.S. Department of Justice, prosecutors accused Faiq and his brother, Adam Iza, of organizing a plot to abduct the parents of a crypto millionaire linked to the theft of roughly 4,100 Bitcoin.
Recent incidents have also reached prominent figures in the digital asset industry. In May, the wife of The Sandbox co-founder Sebastien Borget survived an attempted kidnapping at the couple’s home in Villenoy, France. Local authorities said suspects posing as delivery workers entered the property and tried to force her into a vehicle before neighbors intervened and disrupted the attack.
In France, authorities have introduced new prevention measures as crypto-related kidnappings continue to climb.
Speaking at Paris Blockchain Week in April, Jean-Didier Berger, France’s Minister Delegate to the Interior Minister, said a prevention platform launched by the government had already attracted thousands of sign-ups. The remarks came as officials counted 41 cryptocurrency-linked kidnapping cases across the country during the first four months of 2026, an average of one every 2.5 days.
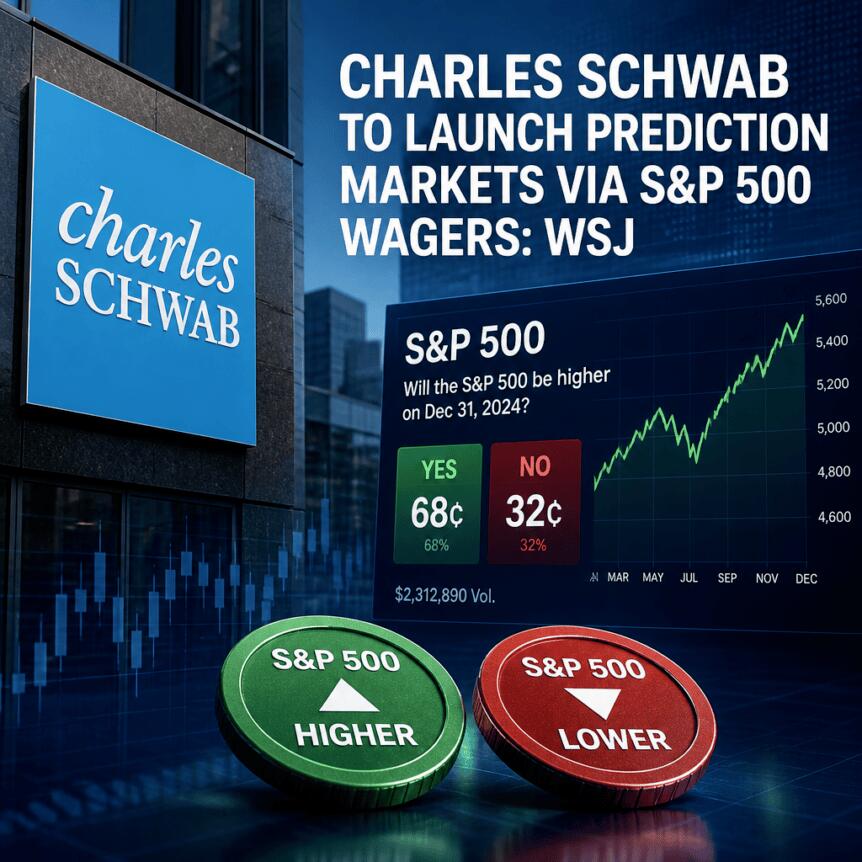
Charles Schwab is reportedly preparing to step into prediction markets, with plans to let customers place straightforward yes-or-no wagers tied to whether the S&P 500 closes above or below a selected price level. If the announcement holds, it would be one of the biggest mainstream finance players yet to formally offer event-style contracts to retail investors.
According to a Friday Wall Street Journal report, the firm is considering options contracts built around S&P 500 performance. The rollout is expected to happen in a matter of months through a partnership with Cboe Global Markets, potentially marking Schwab’s first entry into the prediction market category.
Key takeaways
- Schwab is reportedly planning yes-or-no options contracts based on whether the S&P 500 closes above or below a chosen price.
- The move is expected to be delivered via a partnership with Cboe Global Markets, according to the Wall Street Journal.
- Prediction platforms like Kalshi and Polymarket already offer similar S&P 500 contracts, creating direct competitive pressure.
- US regulators and lawmakers continue to scrutinize prediction markets, including disputes over classification and jurisdiction.
Schwab’s reported wager on the S&P 500
The reported Schwab product would focus on a narrow type of bet: a simple “yes” or “no” outcome tied to the S&P 500 index finishing above or below a target level. Unlike prediction venues that list a wide range of event outcomes—from political developments and sports results to weather and corporate-related milestones—this proposal is said to center on a single, market-linked question.
Earlier examples show how common such “index range” contracts have become. Platforms like Kalshi and Polymarket already provide S&P 500 event contracts, including structures built around the index’s closing level.
For Schwab, the significance is less about adding a new speculative category and more about packaging a format that has gained momentum among retail participants into a product framework familiar to traditional brokerage customers—options-style contracts for mainstream equity exposure.
How prediction markets could intersect with brokerage infrastructure
Prediction markets have expanded well beyond crypto-native audiences, but the most controversial parts of the ecosystem often involve how the products are structured and regulated. If Schwab’s approach is delivered through options contracts in coordination with Cboe, it could suggest a path that aims to fit event trading within established market mechanics rather than operating as a standalone betting platform.
That matters because Schwab is not new to expanding into digital asset-adjacent services. In May, the firm announced the launch of spot Bitcoin and Ether trading for certain retail clients, deepening its participation in crypto-related markets. It also reported record performance for its first quarter of 2026, including net income of $2.5 billion, per Schwab’s earnings release.
While digital assets and prediction markets differ in mechanics and regulatory frameworks, both are increasingly converging on retail demand for “market-like” ways to express views. The reported Schwab plan—anchored on a major benchmark index—could be viewed as a further test of whether prediction-style trading can grow inside institutions that already manage retail trading activity.
Why the timing is sensitive: regulation and ongoing litigation
Even as prediction markets have gained attention, they remain under legal and political pressure in the US. The scrutiny is not limited to any single platform: multiple entities, including Kalshi and Polymarket, have faced challenges tied to how their event contracts are regulated, as well as disputes connected to state oversight.
Lawmakers and state authorities have raised concerns about potential conflicts of interest—especially the idea that elected officials might profit from trading on nonpublic information. There have also been broader questions about whether prediction markets should be allowed to offer event contracts related to sports, an area where some state gaming authorities have challenged platforms’ authority.
At the federal level, the US Commodity Futures Trading Commission (CFTC) under Chair Michael Selig has argued that event contracts in prediction markets can qualify as “swaps,” implying the agency holds exclusive jurisdiction for regulation and enforcement. The resulting regulatory boundary has been a recurring theme in enforcement actions and court cases involving Kalshi, Polymarket, and the CFTC, alongside additional challenges brought by state regulators.
For Schwab, that backdrop makes the reported partnership approach especially important. A mainstream entrant will likely be expected to navigate not just product design, but also the classification of the contracts it sells and the oversight regime under which the business is operating.
Crypto exchanges also eye prediction markets
The Schwab news arrives at a moment when prediction markets are already part of the broader conversation in crypto. Cryptocurrency exchanges have explored prediction offerings, and earlier reporting highlighted that firms such as Coinbase had moved closer to bringing prediction market products to users.
In the same ecosystem, forecasts have suggested that prediction markets could reach very large annual volumes by the end of the decade, driven by retail interest in event trading. Even if those forecasts are aspirational, the common thread is that platforms are competing for the same user behavior: willingness to take positions on uncertain outcomes and pay for exposure to those bets.
If Schwab’s contract structure narrows the focus to index close outcomes, it may also be attempting to differentiate on simplicity and familiarity—offering a more “finance-native” way to place uncertainty around a benchmark—while avoiding some of the event categories that have drawn the most regulatory and reputational attention.
For traders and investors, the key question to watch next is how Schwab’s product will be structured and supervised: whether it truly fits within established brokerage and exchange oversight, and whether ongoing court and regulatory disputes around prediction markets affect its timeline or eventual rollout details. The outcome will likely shape how quickly prediction-style contracts can move from niche platforms into mainstream financial channels.

Arthur Hayes’ somewhat controversial and sporadic behavior in terms of crypto purchases and sales continues, this time with Ethereum.
According to on-chain data provided by Lookonchain, the former BitMEX CEO has now disposed of his entire ETH position, which he acquired just a few days earlier. Moreover, he sold at a loss.
Hayes Sells Days Later
His latest Ethereum accumulation spree began on June 17. At the time, Hayes purchased 1,400 ETH for $2.51 million but continued to acquire more tokens in the following days, including a $2.63 million buy for 1,500 units. In total, he scooped 5,900 ETH for $10.58 million at an average price of almost $1,800.
However, the analysts at Lookonchain informed that he had sold even more than that on Friday. Wallets related to him disposed of 6,000 ETH for $10.14 million, thus incurring a loss of more than $600,000 in days.
Arthur Hayes(@CryptoHayes) is buying high and selling low again.
Over the past 4 days, he accumulated 5,900 ETH($10.58M) at an average price of $1,793.
Just 4 hours ago, he dumped 6,000 $ETH($10.14M) at $1,690, incurring a $606K loss.https://t.co/YIuiTiAoWm… pic.twitter.com/LVCqzyTDrc
— Lookonchain (@lookonchain) June 19, 2026
Given his recent clash with the community over his behavior of shilling and then dumping the same alts he had been praising, many of the comments below the original post were not kind, to say the least.
Interestingly, unlike many of the altcoins that he sold off recently, which went down in price after the news was disclosed, ETH is actually up slightly from his average sell level to over $1,720.
Other Whales Are Buying
Meanwhile, further data from the same monitoring resource indicated that other large market participants are buying en masse. A wallet linked to K3 Capital withdrew 10,000 ETH (valued at over $17 million at press time) from Binance. Another, related to Chun Wang, purchased and transferred out of the world’s largest exchange 7,650 ETH ($13 million).
These acquisitions came amid analysts continuing to debate whether the second-biggest altcoin has neared its potential bear market bottom. In fact, some believe that ETH will find a floor faster than BTC.
The post Days Later: Arthur Hayes Sells Entire ETH Position at a Loss appeared first on CryptoPotato.

Sonic Labs has announced a leadership overhaul after the S token extended its long-running decline, with former chief technology officer Andre Cronje joining two other senior figures in stepping down from the organization’s board.
Summary
- Andre Cronje, Michael Kong, and David Richardson have stepped down from Sonic Labs’ board.
- Sonic Labs appointed new executives and launched governance reforms amid community concerns.
- S token remains under pressure, with technical indicators pointing to continued bearish momentum.
According to Sonic Labs, Andre Cronje, former Fantom Foundation chief executive Michael Kong, and executive chairman David Richardson have resigned from the board as the company restructures its governance and executive leadership.
The announcement coincided with another day of losses for the Sonic (S), which traded near $0.029 after falling about 5% over the past 24 hours.
In a separate statement, Cronje addressed criticism from community members and argued that responsibility should rest with the individuals who directly oversaw specific decisions.
While accepting accountability for the technology and technical decisions he led, he said he was not responsible for decisions involving the network migration, airdrop structure, tokenomics, or management of the legacy network.
“I stand behind the technology and technical decisions I led. I was not the author or decision owner of the migration, airdrop, tokenomics, or legacy-network decisions described above.”
Sonic Labs described the resignations as part of an orderly transition.
“These are the people who built what Sonic is today. They remain invested in Sonic’s success and are handing off their responsibilities the right way, in full. From here, they will no longer make business decisions for the organization.”
Sonic Labs has appointed Matt Visser as its new CEO and Kosta Kourkoumelis as chief operating officer as part of the transition.
Sonic Labs acknowledged that both the token’s performance and community sentiment have deteriorated. In a statement, the company said it was not attempting to downplay those challenges, stating that “the token is down” and that community sentiment has weakened.
As per data from crypto.news, the S token has fallen roughly 97% since launching in January 2025 as part of the network’s migration from Fantom to Sonic.
Why is Sonic changing its leadership structure?
Facing criticism from community members and investors, Sonic Labs said the management changes are tied to a new governance framework designed to improve accountability and communication.
Alongside the executive reshuffle, the company said it will introduce more transparent governance processes, provide clearer updates on development progress, and establish a dedicated risk and compliance committee. Sonic Labs stated that the departing board members helped build the network into its current form but will no longer participate in business decisions going forward.
Originally founded as the Fantom Foundation in 2018, the organization rebranded to Sonic Labs following a major network upgrade that replaced the Fantom Opera blockchain with the Sonic layer-1 network. The company says the blockchain can process up to 10,000 transactions per second while delivering sub-second transaction finality.
Earlier this year, Sonic Labs also expanded its ecosystem with the launch of USSD, a dollar-pegged stablecoin backed by tokenized U.S. Treasury assets. Announced in March, the stablecoin was introduced to support trading, lending, payments, and settlement activity across decentralized finance applications operating on the Sonic network.
What does the market signal about the S token?
Recent price action suggests traders remain cautious despite Sonic Labs’ efforts to restore confidence through governance and leadership changes.
Daily chart data shows the S token trading near $0.03 after breaking below the lower boundary of a bearish flag pattern that formed following a sharp June selloff. The formation emerged after the token dropped from roughly $0.049 to below $0.03, with a brief upward consolidation creating the flag before sellers regained control.
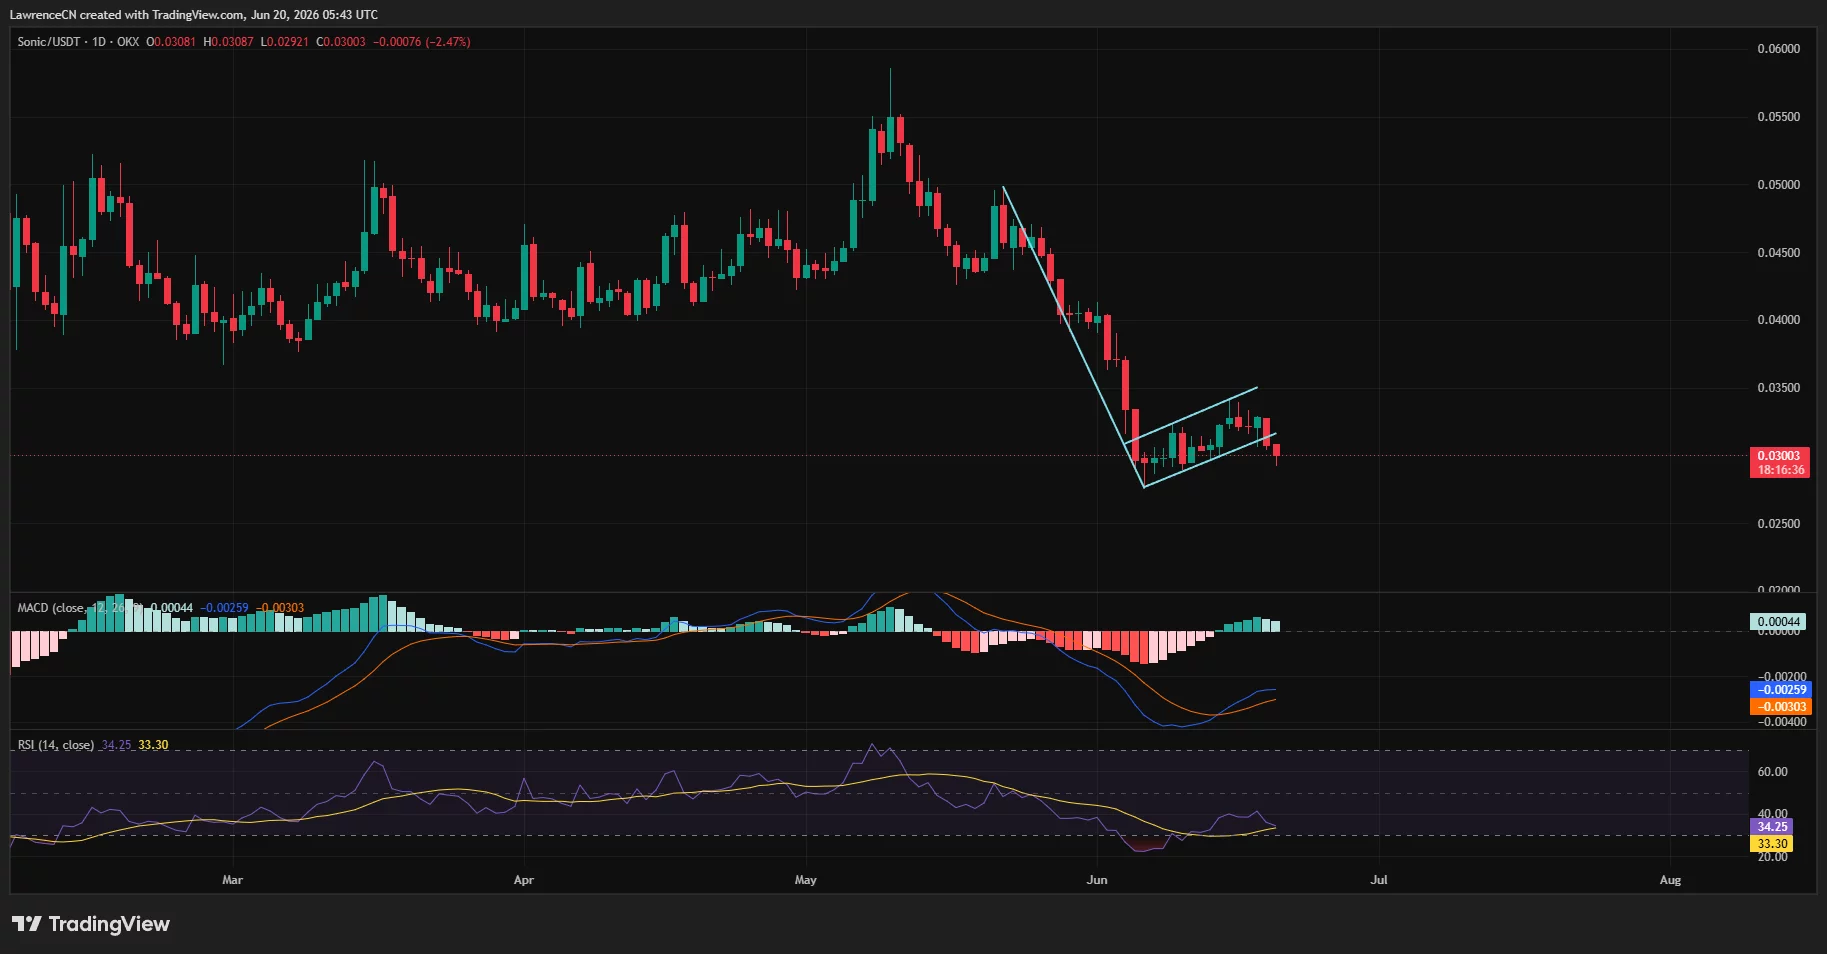
Momentum indicators continue to favor bears. The Relative Strength Index has slipped to around 34, remaining below the neutral 50 level and pointing to weak buying demand. Meanwhile, the MACD remains below the zero line despite a recent bullish crossover attempt, indicating that the broader trend remains tilted to the downside.
Following the breakdown, the recent swing low near $0.028 has become the nearest support level. A move below that area could open the door to lower levels seen during the token’s post-launch decline. On the upside, former flag support near $0.032 has turned into resistance, while a recovery toward the $0.034-$0.035 range would be needed to challenge the current bearish structure.
While Sonic Labs works through its leadership transition, executive turnover has also affected other parts of the crypto industry. As reported by crypto.news, on Thursday, Ethereum Foundation co-executive director Hsiao-Wei Wang announced her departure, adding to a reported 19 layoffs and departures from the organization this year.
Two brothers accused of kidnapping a Minnesota family at gunpoint to steal cryptocurrency have pleaded guilty in federal court, according to the US Attorney’s Office for the District of Minnesota. The case centers on an alleged $8 million theft from the victim’s online accounts and hardware wallets.
The guilty pleas, entered on Thursday by Isiah Angelo Garcia and Raymond Christian Garcia, underline how “wrench attacks” — violent robberies targeting crypto holders — are increasingly prompting coordinated law-enforcement action. The development also comes as analysts report a sharp rise in crypto-related assaults and kidnappings in recent years.
Key takeaways
- Garcia brothers pleaded guilty to Interference with Commerce by Robbery, a federal charge carrying a maximum penalty of 20 years in prison.
- Prosecutors say the kidnapping was used to force a victim to transfer $8 million in cryptocurrency from online accounts and hardware wallets.
- Both defendants admitted using firearms to threaten victims and agreed to pay more than $8 million in restitution.
- Sentencing has not yet been scheduled, leaving the timeline for final penalties still open.
- The case adds to a growing US and international crackdown on violent robberies aimed at crypto owners.
Guilty pleas in Minnesota kidnapping-for-crypto case
According to the US Attorney’s Office of the District of Minnesota, Isiah Angelo Garcia and Raymond Christian Garcia entered guilty pleas on Thursday in connection with an armed robbery in Minnesota. The charge is Interference with Commerce by Robbery, with prosecutors noting a maximum possible federal prison term of 20 years.
US Attorney Daniel Rosen said the pleas reflect the government’s effort to hold defendants accountable for the choices they made.
The criminal conduct prosecutors describe began when the two men allegedly traveled from Texas to Minnesota in September 2025. Prosecutors said their aim was to seize cryptocurrency by holding a victim and his family at gunpoint.
How prosecutors say the $8 million theft unfolded
In an earlier filing, the US Attorney’s Office stated that on Sept. 19, 2025, the brothers allegedly held the victim’s family at gunpoint and forced the victim to transfer cryptocurrency. Prosecutors said the robbery involved both online accounts and hardware wallets.
The alleged kidnapping lasted for hours. Prosecutors said the victim’s wife and son were held in their family home for about nine hours, while the victim was taken to a cabin roughly three hours away.
Police involvement began after the victim’s son was able to make an emergency call. Washington County sheriff’s deputies responded, and investigators later found a rifle and a shotgun. Prosecutors also pointed to surveillance footage and other evidence connecting the brothers to the burglary.
What the pleas mean legally and financially
In their guilty pleas, both defendants admitted to using firearms to threaten the victims as part of the robbery, according to the US Attorney’s Office. The plea agreement also includes restitution obligations exceeding $8 million.
Although the guilty pleas mark a major procedural step, the case is not yet at sentencing. The US Attorney’s Office said sentencing hearings have not been scheduled, meaning the final duration of prison terms remains uncertain.
For crypto owners and the broader market, cases like this are not only about criminal punishment. They also signal that investigators are willing and able to pursue federal charges in violent schemes tied to crypto custody and transfers, rather than treating them solely as isolated robberies.
Part of a wider pattern of crypto wrench attacks
The Minnesota case lands amid growing concerns about violent crimes specifically targeting cryptocurrency. In February, CertiK reported that the number of crypto-related assaults and kidnappings increased 75% in 2025 compared with the prior year. CertiK also estimated that losses from such attacks in the first four months of 2026 had already reached $101 million, according to a Cointelegraph report referencing CertiK’s findings.
This broader context helps explain why authorities appear to be pursuing multiple cases in parallel. Earlier in the year, US authorities unsealed an indictment involving three men accused of stealing at least $6.5 million in what prosecutors described as a violent robbery spree targeting cryptocurrency owners. In that case, prosecutors alleged the defendants posed as delivery drivers to enter residences and use violence to extract cryptocurrency.
Outside the US, the issue has also drawn official attention. During Paris Blockchain Week in April, Jean-Didier Berger, a minister delegate to the interior minister of France, said his office has taken “preventive measures” against crypto wrench attacks, including launching a prevention platform that generated thousands of sign-ups, according to a Cointelegraph report.
What to watch next
With the brothers now pleading guilty and restitution agreed, the next key development will be sentencing scheduling and the terms the court imposes. More broadly, investors and users should watch whether prosecutors continue to expand federal cases in wrench-attack schemes and how prevention efforts evolve as reported losses rise.

Tom Hanks Reacts To Surprise ‘Toy Story’ Family Reveal

Crypto Just Got Punched In The Gut – Hard! Breaking Crypto News!

How Durham Cathedral became ‘Cambridge’ in Virginia Woolf movie


-

 Business6 days ago
No Jackpot Winner as $257 Million Prize Rolls Over to $269 Million Monday Draw
-
 Crypto World5 days ago
Zimbabwe Requires Crypto Businesses to Register Annually Under New FIU Regulations
-

 Fashion14 hours ago
Weekend Open Thread: Miami – Corporette.com
-
 Entertainment6 days ago
Matt Damon’s Viral Sci-Fi Thriller Has Taken Over HBO Max
-

 Business6 days ago
Anthropic staff to meet White House officials next week, Axios reports
-

 Tech6 days ago
As AI companies race to go public, who else is along for the ride?
-
 Crypto World6 days ago
Bitcoin could crash to $48,000, if this historical pattern is triggered
-
 NewsBeat6 days ago
what doctors are seeing in ebike crashes
-
 NewsBeat6 days ago
Warning of disruption as Cardiff Crossrail works to start
-
 NewsBeat6 days ago
Tributes to former deputy head teacher at Cambridge school among death and funeral notices
-

 Politics6 days ago
“Israel’s” ban on ICRC visits ruled illegal, but Knesset moves to stop them permanently
-

 Entertainment6 days ago
Deion Sanders Shares Powerful Post After Viral Advice To Deiondra
-

 News Videos6 days ago
Financial Accounting | Last Day Revision Strategy and Booster | CMA Inter – June 2026
-
 Entertainment6 days ago
Kate Middleton Glare Goes Viral After Kids Booed At Royal Event
-

 Crypto World6 days ago
XRP ETFs Outperform As Bitcoin And Ethereum Funds Extend Outflow Trend
-

 Tech5 days ago
Over 400 Arch Linux packages compromised to push rootkit, infostealer
-
 Crypto World6 days ago
Market Preview: SpaceX (SPCX) IPO Record, Federal Reserve Meeting, and Iran Nuclear Agreement
-

 Business6 days ago
Invesco Quality Income Fund Q1 2026 Commentary
-

 Sports6 days ago
Dick Advocaat’s Curacao scores first-ever World Cup goal against Germany
-

 NewsBeat6 days ago
Singer Oliver Tree dies aged 32 in helicopter crash in Brazil
You must be logged in to post a comment Login