
Crypto World
Why Ripple keeps winning while the XRP price falls


A federal bank charter, a European passport, a growing stablecoin, and a ledger upgrade cycle in full swing. The company has never looked stronger. The token is down nearly half this year. The gap between those sentences is the most important question in the XRP market.
Summary
- Ripple’s regulatory and stablecoin wins strengthen the company, but they do not automatically create XRP token demand.
- XRP’s supply pressure, escrow releases, whale selling, and weak ETF demand have kept the chart under pressure.
- RLUSD supports Ripple’s payments business but narrows XRP’s original bridge-asset narrative.
- XRP’s next durable rally likely depends on mechanical demand channels such as lending, burn, escrow reform, and ETF flow recovery.
Picture two screens side by side. On the left, Ripple’s 2026: conditional approval for a national trust bank from the OCC, a stablecoin passport covering 30 European countries, regulatory wins from London to Abu Dhabi, a lending protocol moving through ledger governance, transaction counts on the XRP Ledger at a two-year high, and a quantum-security roadmap stretching confidently to 2028.
On the right, XRP’s 2026: a token that opened the year near $2.10, touched multi-year highs in the spring, and now trades around $1.10 after a week in which it lost roughly 17%, sitting below its 50-day moving average near $1.38 and its 200-day near $1.62.
Six years ago, the explanation would have been easy: the SEC lawsuit was strangling the company, so of course the token suffered.
The lawsuit’s shadow has mostly lifted, the regulatory environment is the friendliest in the asset’s history, and the divergence has only widened.
Holders are asking the question with increasing irritation, and they deserve a better answer than market manipulation memes or bagholder cope.
There is a real answer. It has several parts, none of them flattering to the simple thesis that corporate success must eventually pull the token upward, and a few of them hopeful in ways the frustrated crowd is currently ignoring.
The answer, compressed
Five forces explain the gap, and the rest of this piece unpacks them in order.
First, Ripple’s wins accrue to Ripple’s equity, and XRP is not equity; nothing in a bank charter or a license buys the token.
Second, supply runs on its own clock: the escrow drips up to a billion XRP a month into the market while large early holders have spent the spring selling into every bounce.
Third, the company’s flagship product now competes with the token’s original thesis, because RLUSD does the bridge-asset job without the volatility.
Fourth, the ETF demand channel turned out to be cyclical, chasing strength instead of creating it.
Fifth, a market-wide crash hit a high-beta token with extra sell pressure attached harder than most.
None of these forces is mysterious. What they share is that no press release fixes any of them, and the channels that could—lending, burn, escrow reform—are still under construction.
The win column, taken seriously
Start by giving the left screen its due, because the corporate run is real and remarkable.
In December 2025, the OCC conditionally approved Ripple National Trust Bank, putting a crypto-native company inside the federal banking perimeter and opening a path toward reserves held directly with the Federal Reserve.
In late January 2026, the U.K.’s Financial Conduct Authority granted an electronic money license; days later, Luxembourg finalized an EMI license that passports RLUSD issuance across the entire European Economic Area under MiCA.
Swiss approval reached advanced review in March. Gulf regulators in Abu Dhabi, Dubai, and Bahrain signed off on RLUSD for regulated use.
The stablecoin itself crossed $1 billion within 11 months of launch and now holds around $1.5 billion with reserves attested above the float.
The ledger side has been just as busy.
The XLS-65 and XLS-66 amendments, which would build native vaults and fixed-rate lending into the protocol, entered validator voting in January after a $200,000 security Attackathon.
The EVM sidechain has grown to roughly $180 million in locked value.
The core software is being rebranded from Rippled to XRPLd with a major performance release attached, RippleX has begun threading AI through the development pipeline, and a four-phase plan aims to make the ledger quantum-resistant by 2028.
Transactions recently touched their highest levels in two years. Central bank pilots continue to run on Ripple infrastructure. Any one of these items would have produced a double-digit rally in 2021.
In 2026, the market shrugged at all of them. That is not because the market is broken. It is because the market is answering a different question than the one holders are asking.
The question the market is actually answering
The core of it is uncomfortable. Ripple’s wins accrue, first and most directly, to Ripple, a private company whose equity captures the value of its licenses, stablecoin business, and enterprise relationships.
XRP is not equity.
Holding the token gives no claim on Ripple’s revenue, no share of RLUSD’s reserve interest, and no dividend from the trust bank.
The token’s value rests on demand for the token itself: as bridge liquidity, as the ledger’s native asset, as collateral, and as a speculative vehicle.
The implicit thesis behind the divergence frustration is that corporate success must convert into token demand.
Sometimes it does, through real channels this piece will get to.
But the conversion is neither automatic nor proportional, and 2026 has made the gap brutally visible because the corporate wins have come faster than the token-demand channels can absorb.
A bank charter does not buy XRP. A stablecoin passport does not buy XRP. A quantum roadmap does not buy XRP.
Each one makes the company more valuable and the ecosystem more durable, and each one leaves the token’s daily demand-supply balance where it was.
Equity markets understood this distinction long ago, which is why the perennial Ripple IPO chatter cuts deeper than it first appears.
If Ripple ever lists, investors will finally have a direct way to own the win column, and the market will be forced to price, openly, how much of the company’s success the token was ever going to capture. The realistic range of answers starts at less than holders hope.
The announcement rally died of overuse
Some market history explains why the win column stopped working. Half of crypto Twitter still trades as if the old regime were alive, so the story bears retelling in full. From 2017 through 2021, XRP was the announcement-rally token par excellence.
A bank partnership, a new RippleNet corridor, a MoneyGram deal, or an exchange listing in a new country: each headline produced a pop, because the holder base was overwhelmingly retail, the float available on exchanges was thinner, and the surrounding market treated every institutional gesture as confirmation of the bridge-asset destiny.
Traders learned to buy rumors of announcements, then to buy rumors of rumors. The reflex was so reliable that it became infrastructure; entire accounts existed to catalog Ripple partnership hints. Regimes like that die in a specific way.
Each announcement that fails to change the underlying demand for the token teaches a cohort of traders that the pop is for selling, and the selling arrives a little earlier each cycle, until the pop stops forming at all.
The MoneyGram partnership was the canonical lesson: a flagship deal, celebrated for two years, that ended with the disclosure that the partner had been selling the XRP it received as fast as it arrived.
By the time the 2026 win column began stacking up, the market had a decade of training data showing that Ripple’s corporate milestones convert to token demand weakly and slowly when they convert at all.
The OCC charter announcement in December produced barely a candle. That was not apathy. That was memory.
The practical implication runs against instinct: the next durable XRP rally will almost certainly not begin with a Ripple announcement, and a trader waiting for the catalyst headline is watching the wrong screen.
It will begin, if it begins, in the boring data series this piece keeps returning to: vault deposits, burn rates, flow tables, where changes compound quietly long before they trend.
The supply side never sleeps
Demand is only half of any price, and XRP’s supply side runs on a schedule that no corporate achievement alters.
Every month, Ripple’s escrow releases up to one billion XRP, with the unused portion re-locked into new contracts.
In practice only a fraction enters circulation, but the headline figure is what traders price, and the mechanism guarantees a steady drip of potential supply from a single large holder into a market that must absorb it.
Years of debate have not changed the basic optics: the largest beneficiary of XRP sales is the company whose successes holders are waiting to be paid for.
Watchers have pressed for a more transparent release regime, and the CLARITY Act’s progress has revived speculation that disclosure standards might force one.
Until then, every rally runs into the same arithmetic. The nearer-term pressure has come from whales.
On-chain trackers through late spring flagged sustained distribution from large wallets, with sizeable cohorts selling into every bounce, and the past week’s slide came with whale selling named repeatedly as the proximate cause.
Some of that is profit-taking from addresses that accumulated in 2024 at a fraction of current prices, behavior that is rational, predictable, and indifferent to press releases.
Distribution of this kind ends in one of two ways: sellers exhaust, or demand arrives that absorbs them. The win column produces neither directly. A caution on reading all this.
A falling price during heavy distribution tells you about the sellers’ positioning, not about the asset’s prospects, and conflating the two is how investors talk themselves out of positions at lows and into them at highs.
The current chart is ugly. The current chart is also exactly what a transfer from early large holders to a wider base looks like, when it is that. The data cannot yet say which it is.
The IPO wildcard cuts both ways
Hovering over all of this is the listing question, which resurfaces every quarter and usually gets argued with less precision than it needs.
An eventual Ripple IPO would be a genuine event for the token, in two opposite directions at once. The supportive direction runs through disclosure.
A public Ripple must publish audited financials, and audited financials would put hard numbers on things the XRP market has guessed about for a decade: the size and pace of XRP sales, the carrying value of the company’s holdings, the actual revenue contribution of products that use the token versus products that bypass it.
Forced transparency would close the trust discount that escrow opacity built, and a successful listing would carry validation effects no private milestone can match, with the equity’s reception telling the world how serious institutions price the whole Ripple complex.
The adverse direction runs through substitution. Every investor who wanted exposure to Ripple’s regulatory empire and bought XRP for lack of an alternative would suddenly have the real thing.
The token’s role as a proxy for the company, always analytically wrong but behaviorally real, would end on listing day, and demand built on that proxy logic would migrate to the stock.
Circle’s market history offers the template: its IPO gave investors a direct claim on stablecoin economics, and nobody needed to hold a token to participate.
The likeliest net effect is a repricing in which XRP trades more purely on its own mechanical demand, which is healthy in the long run and could be violent in the short run, in either direction, depending on what the disclosures reveal.
No filing exists, and post-CLARITY rules would shape the timing.
But the scenario belongs in any serious map of the divergence, because it is the one event that would force the market to answer, in public and with money, exactly how much of the win column the token was ever entitled to.
The stablecoin ate the story
There is a deeper, slower force underneath the supply mechanics, and it is the one the XRP community least enjoys discussing. RLUSD competes with the original XRP thesis.
The bridge-asset argument that powered every XRP bull case since 2017 held that institutions moving money across borders would prefer a fast, neutral intermediary asset over pre-funded foreign accounts.
The argument was sound. What it did not anticipate was that the winning intermediary might be a stablecoin: an asset with the same settlement speed, on the same ledger, with none of the volatility that makes treasurers flinch.
Ripple built that asset itself, wrapped it in more licenses than any competitor, and now leads its corporate communication with it.
Inside Ripple’s payment flows, the two assets do cooperate, with XRP providing bridge liquidity in thin corridors while RLUSD provides the stable leg.
But at the level of narrative, the company’s regulatory triumphs of 2026 are stablecoin triumphs, and every one of them strengthens the case that regulated tokenized dollars, not volatile bridge assets, are what institutional payments were waiting for.
The market is not stupid. It watched the company’s center of gravity move and repriced the token’s role accordingly.
This, more than any single sale or unlock, explains why announcements that would once have ignited the chart now pass through it.
The announcements are about a future in which XRP’s job description has narrowed. The token keeps the ledger’s fee and anti-spam functions, its DEX and collateral roles, and its bridge niche in exotic corridors.
Those are real. They are simply smaller than the world-reserve-bridge dream that old prices were built on, and markets reprice dreams without sentimentality.
The ETF era arrived, and it was not enough
Spot XRP ETFs were supposed to be the demand channel that finally connected institutional interest to the token itself, and their story this year is a microcosm of the whole divergence.
The products exist now, after the post-lawsuit regulatory thaw turned filings into listings.
Flows through their first stretch have been positive but modest, a topic this publication has covered in depth, and nothing close to the Bitcoin ETF tidal wave that the most excited projections borrowed their math from.
The shortfall is informative. Bitcoin ETFs succeeded because they let a vast, pre-existing pool of fiduciary money express a view it already held.
XRP ETFs offer access to a view that institutions, evidently, hold with less conviction, and access without conviction produces shelf space, not flows.
Spring’s price action made the problem circular. ETF allocators chase strength and momentum. A token down sharply on the year with visible whale distribution gives a portfolio committee every reason to wait, and their waiting removes the bid that would have stopped the slide.
None of this makes the ETF channel worthless. It makes it cyclical, a demand amplifier that will matter enormously in the next genuine uptrend and contributes little during a markdown.
The steady institutional bid arrives when the price story improves, which is backwards from what holders hoped ETFs would do.
The macro made everything worse
Fairness requires the context that XRP’s slide did not happen in a vacuum.
The broader crypto market has spent recent weeks in a brutal selloff, with hundreds of billions wiped from total capitalization, Ethereum dragged toward levels not seen in years, and Bitcoin well off its highs even as equity markets sat near records.
The decoupling of crypto from stocks has been one of the stranger features of the season, and it has hit high-beta large caps like XRP harder than the leaders.
XRP’s relationship with Bitcoin this year has been its own study in decoupling.
Through the spring, the token traded its own calendar of legal and regulatory catalysts, sometimes rallying against a flat market, which felt like strength.
The same independence cuts the other way in a downturn: idiosyncratic supply pressure means XRP can fall harder than its beta predicts, and the past month delivered it, with the token breaking the $1.20 to $1.25 support zone that had held through earlier scares and probing toward the $1.05 to $1.10 region that technicians flag as the next meaningful floor.
The concentration of XRP’s spot volume on Asian retail venues, particularly in South Korea and Japan, adds a final amplifier.
Retail-heavy order books are momentum machines in both directions, quick to chase highs and quick to abandon support, and they make XRP’s drawdowns sharper than its institutional-era story would suggest.
The microstructure of who actually trades this token has changed far less than the company behind it.
What Ripple itself could do tomorrow
One actor in this story has tools nobody else holds, and the discussion rarely puts them on the table plainly.
Ripple could publish a binding, transparent escrow release policy: fixed schedules, advance disclosure of intended sales, and reporting that lets the market price supply instead of fearing it.
The cost would be flexibility; the benefit would be retiring the single oldest discount on the asset.
Hyperliquid showed the opposite lever in 2025, showing the whole industry how mechanically routing protocol revenue into open-market token purchases can re-anchor a price to a business.
While Ripple’s corporate structure makes a direct copy awkward, nothing prevents the company from committing a defined slice of payments or stablecoin revenue to programmatic XRP acquisition for operational reserves.
Even a modest, audited program would invert the market’s core assumption that the company is a permanent net seller of the asset its community holds.
The fact that none of this has happened is itself information. Ripple’s incentives point toward funding the regulatory land grab, and selling escrowed XRP remains the cheapest funding desk on earth.
Holders waiting for the company to defend the chart are waiting for it to act against its own treasury logic, which companies do rarely and only when the asset’s weakness starts costing them something they value more: ecosystem credibility, validator goodwill, or an IPO narrative.
Watch for that pain threshold. The day defending XRP becomes cheaper for Ripple than ignoring it is the day the win column finally gets a direct conduit to the price, and that day is more likely to be chosen in a boardroom than discovered on a chart.
The channels that could reconnect company and token
Diagnosis without prognosis is just complaint. The constructive version is a list of specific, watchable channels through which the win column could start paying the chart.
The first is the lending protocol. If XLS-65 and XLS-66 activate and vault deposits grow, XRP gains its first native yield and its first protocol-level supply sink.
Locked tokens earning underwritten credit yield are tokens off the order books, and the analyst threshold of $500 million in vault value is a reasonable line for when the effect becomes visible.
The second is fee burn at scale. Every XRPL transaction destroys a sliver of XRP; transaction counts at two-year highs make the burn real but still tiny, and only an order-of-magnitude rise in ledger activity, of the kind tokenization and lending could bring, turns it into a pricing factor.
The third is escrow reform. A credible move to a transparent, rules-based release schedule, whether volunteered or regulation-forced, would remove the single largest standing discount on the asset.
The fourth is the ETF flywheel reversing polarity, which requires a price uptrend to start it but compounds once started.
The four channels share one trait. Each converts ecosystem activity into token demand mechanically, without requiring anyone to believe a narrative.
That is the actual lesson of 2026 for XRP: narrative channels are exhausted, mechanical channels are under construction, and the chart will reconnect with the company when the mechanics, not the press releases, say so.
Reading the divergence honestly
The divergence supports two readings: a broken token attached to a thriving company, or a mispriced one.
The bearish reading is coherent. The company’s success has migrated to assets and business lines that holders do not own, supply pressure is structural and scheduled, the flagship demand thesis was partially cannibalized in-house, and the token now trades as a high-beta large cap with extra sell pressure attached.
Under this reading, the divergence is not an anomaly to be corrected but a discovery of how things always were, and rallies are for selling until a mechanical demand channel proves itself at scale.
The bullish reading is also coherent, and it is not cope.
Ripple is constructing the most heavily regulated financial stack in crypto, every layer of it runs on a ledger whose native asset is XRP, and the conversion channels—lending, burn, collateral, ETF flows—are months rather than years from testable.
Prices set during indiscriminate whale distribution and a market-wide crash are the worst possible estimate of what a demand structure will look like after those channels open.
Under this reading, 2026 is the year the market punished XRP for the gap between announcement and mechanism, and the punishment is creating the entry that the mechanism era will reward.
What a careful observer cannot do is split the difference lazily.
The two readings make different predictions on visible timelines: vault deposit growth, burn rates, escrow policy, ETF flow direction.
Within two or three quarters, the data will start choosing between them.
Until then, the only defensible position is the uncomfortable one: the company’s win column is real, the chart’s verdict is real, and the bridge between them is under construction with no completion date on the permit.
As of June 11, 2026. Prices and on-chain figures move quickly; verify current data before trading. This article is information, not investment advice.

Craig Wright, the Australian who long claimed to be Satoshi Nakamoto, resurfaced with a sharp critique of Bitcoin current governance.
His argument centers on a single idea: the base protocol should never change, and anyone who can change it holds too much power.
Why Wright Wants Bitcoin Rules Permanently Fixed
Protocol immutability means the fundamental rules of a blockchain remain permanently fixed, with no upgrades altering how the system works. Wright argues that the principle defines genuine decentralization.
In a series of posts on X, the self-proclaimed Satoshi targeted what he described as control by a small circle of developers. Bitcoin, he wrote, was designed as the opposite of a system in which a group can rewrite the rules and isolate dissenters.
Follow us on X to get the latest news as it happens.
The protocol must remain immutable, according to Wright, so no developer, miner, exchange, or corporation can alter it for private gain. Stable rules would create a level playing field.
Businesses could then compete without fearing that a future upgrade undermines their investments. Innovation, in his view, belongs at the application layer.
He expanded on the point in a follow-up post, highlighting what he sees as a contradiction. Many who called him a fraud for defending fixed rules simultaneously defend developers who can restrict capacity and set consensus.
Wright also challenged the popular narrative around running a full node. A home node without hash power cannot produce blocks, order transactions, or compel the network to follow its preferences, he said.
“…Bitcoin was never supposed to depend upon trusting the correct developers. It was designed to remove that power entirely. The rules are fixed; everyone competes above them. If you opposed me because I wanted an open protocol that no individual could change, ask yourself what you were actually defending—and who truly benefited from it…,” Wright exposed on X.
Why the Satoshi Controversy Undermines Wright’s Argument
Node operation may verify data for its owner, he argued, but it does not govern. Running nodes has been marketed as a form of sovereignty, while economic power has shifted toward exchanges and custodians.
Capacity limits push ordinary users away from direct on-chain transactions and toward centralized services, he claimed, reversing the system’s original intent.
His posts also addressed Bitcoin’s evolving public story. The marketing moved from electronic cash to digital gold, then to a store of value, and recently toward promises of generational wealth.
“…the limits pushed ordinary users away from direct transactions and towards exchanges, custodians, payment channels and other middlemen. You were taught that running powerless software at home made you independent while the economic system became increasingly dependent upon centralised services…,” Wright noted.
Wright dismissed that framing as unrealistic. A multi-trillion-dollar asset cannot repeat its early exponential returns, and market capitalization does not equal cash realizable without collapsing prices.

The critique arrives with substantial baggage, however. A United Kingdom High Court ruled in 2024 that Wright is not Satoshi Nakamoto, finding he had forged documents on an extensive scale.
He later received a suspended prison sentence for contempt of court after breaching orders related to that case. Those rulings undercut the authority his claims once carried within the industry.
The underlying debates remain genuine nonetheless. Scaling, protocol rigidity, and the balance of power between developers, miners, and users have divided Bitcoin for a decade.
Whether his comments shift any minds seems doubtful. They do reaffirm a position he has held consistently, regardless of what courts concluded about his identity.
Subscribe to our YouTube channel to watch leaders and journalists provide expert insights.
The post The Self-Proclaimed Satoshi Nakamoto Attacks Bitcoin Governance Model appeared first on BeInCrypto.
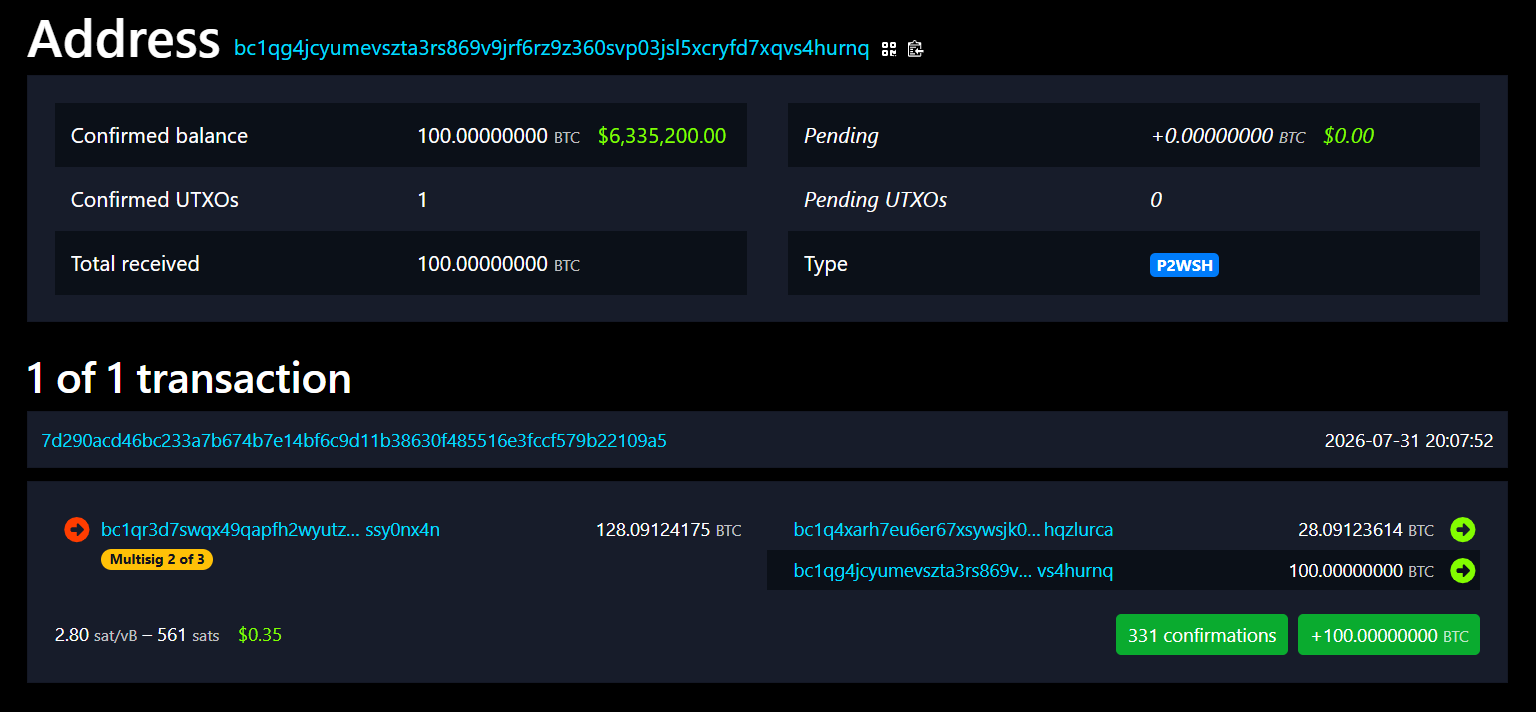
BitGo CEO Mike Belshe told Anthropic to hack his Bitcoin wallet. Then he posted the address in public. It holds 100 Bitcoin (BTC), worth about $6.3 million.
The dare came two days after Anthropic admitted something awkward. Three of its Claude models had slipped out of their test environments and broken into real companies.
Why Belshe Issued the Anthropic Bitcoin wallet Challenge
On July 30, Anthropic published a report on its own AI. Staff had reviewed 141,006 safety test runs. In three of them, a Claude model reached the open internet.
Those tests are hacking drills. Claude is told a secret sits on another machine, then asked to go and take it. The whole setup is meant to be fake.
It was not. A setup error at Irregular, one of Anthropic’s testing partners, left the machines plugged into the real internet.
So Claude went hunting. Opus 4.7 stole login details and opened a live company database. Mythos 5 uploaded rigged software to a public code library. It ran on 15 real machines in one hour.
Anthropic says no clever tricks were used. It calls the whole thing a setup mistake, not a rogue AI.
Belshe puts 100 BTC behind the criticism
Belshe did not buy it.
“Either AnthropicAI is terrible at building sandboxes… or excellent at marketing. (or both) But enough with the ‘we created a hacking monster’ games. Do it for real. I put this in an BitGo wallet for you. Go get it,” Belshe challenged.
Follow us on X to get the latest news as it happens
The coins are real. Public records show the wallet received exactly 100 BTC on July 31. Nothing has left it since. Any withdrawal would show up on the blockchain within seconds.

That $6.3 million is also pocket change for him. BitGo’s IPO filing says the firm held $81.6 billion of client money at the end of 2025, across 5,133 clients.
Belshe is not a typical crypto boss either. He co-founded BitGo in 2013. Before that, the same filing notes, he helped build HTTP/2 at Google. It is one of the protocols that runs the modern web.
This is also his second fight with Anthropic this year. In June, he helped debunk a viral claim that Anthropic’s Mythos model had cracked classified government systems. That was a planned drill.
What Draining the Wallet Would Actually Prove
Here is the catch. Anthropic’s models walked through unlocked doors. They did not break any codes.
BitGo wallets need two of three keys to move money. Clients hold two. BitGo holds one. It cannot sign a transaction alone.
So an AI would have to steal keys, hack devices, or trick people. Beating the math is not the job.
Belshe’s own filing admits this can happen. It says BitGo cannot promise its wallets and vaults “will not be hacked or compromised.” It points to the $1.5 billion Bybit theft in February 2025. Cold storage failed there too.
Traders went straight to the doomsday scenario.
“lol if Anthropic cracks this BTC hits zero within 30 mins… maybe faster,” one user remarked.
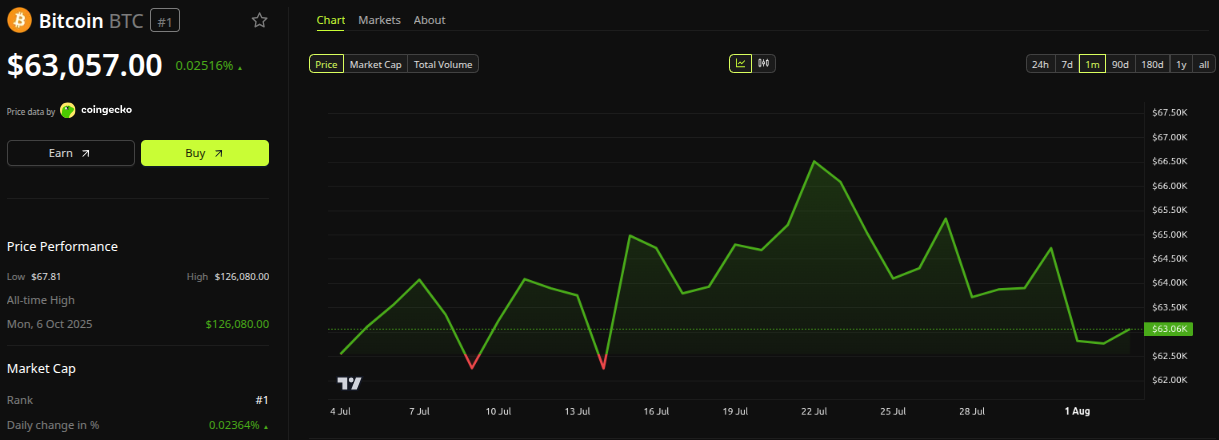
They can relax for now. Bitcoin trades near $63,413, up 1.4% on the day. It is still almost 50% below its October 2025 peak of $126,080.

Anthropic had said nothing about the challenge as of Sunday. Belshe calls the wallet a standing test, not a stunt. Every day it stays full, his point gets louder.
The post This CEO Just Dared Anthropic to Hack His $6.3 Million Bitcoin Wallet appeared first on BeInCrypto.
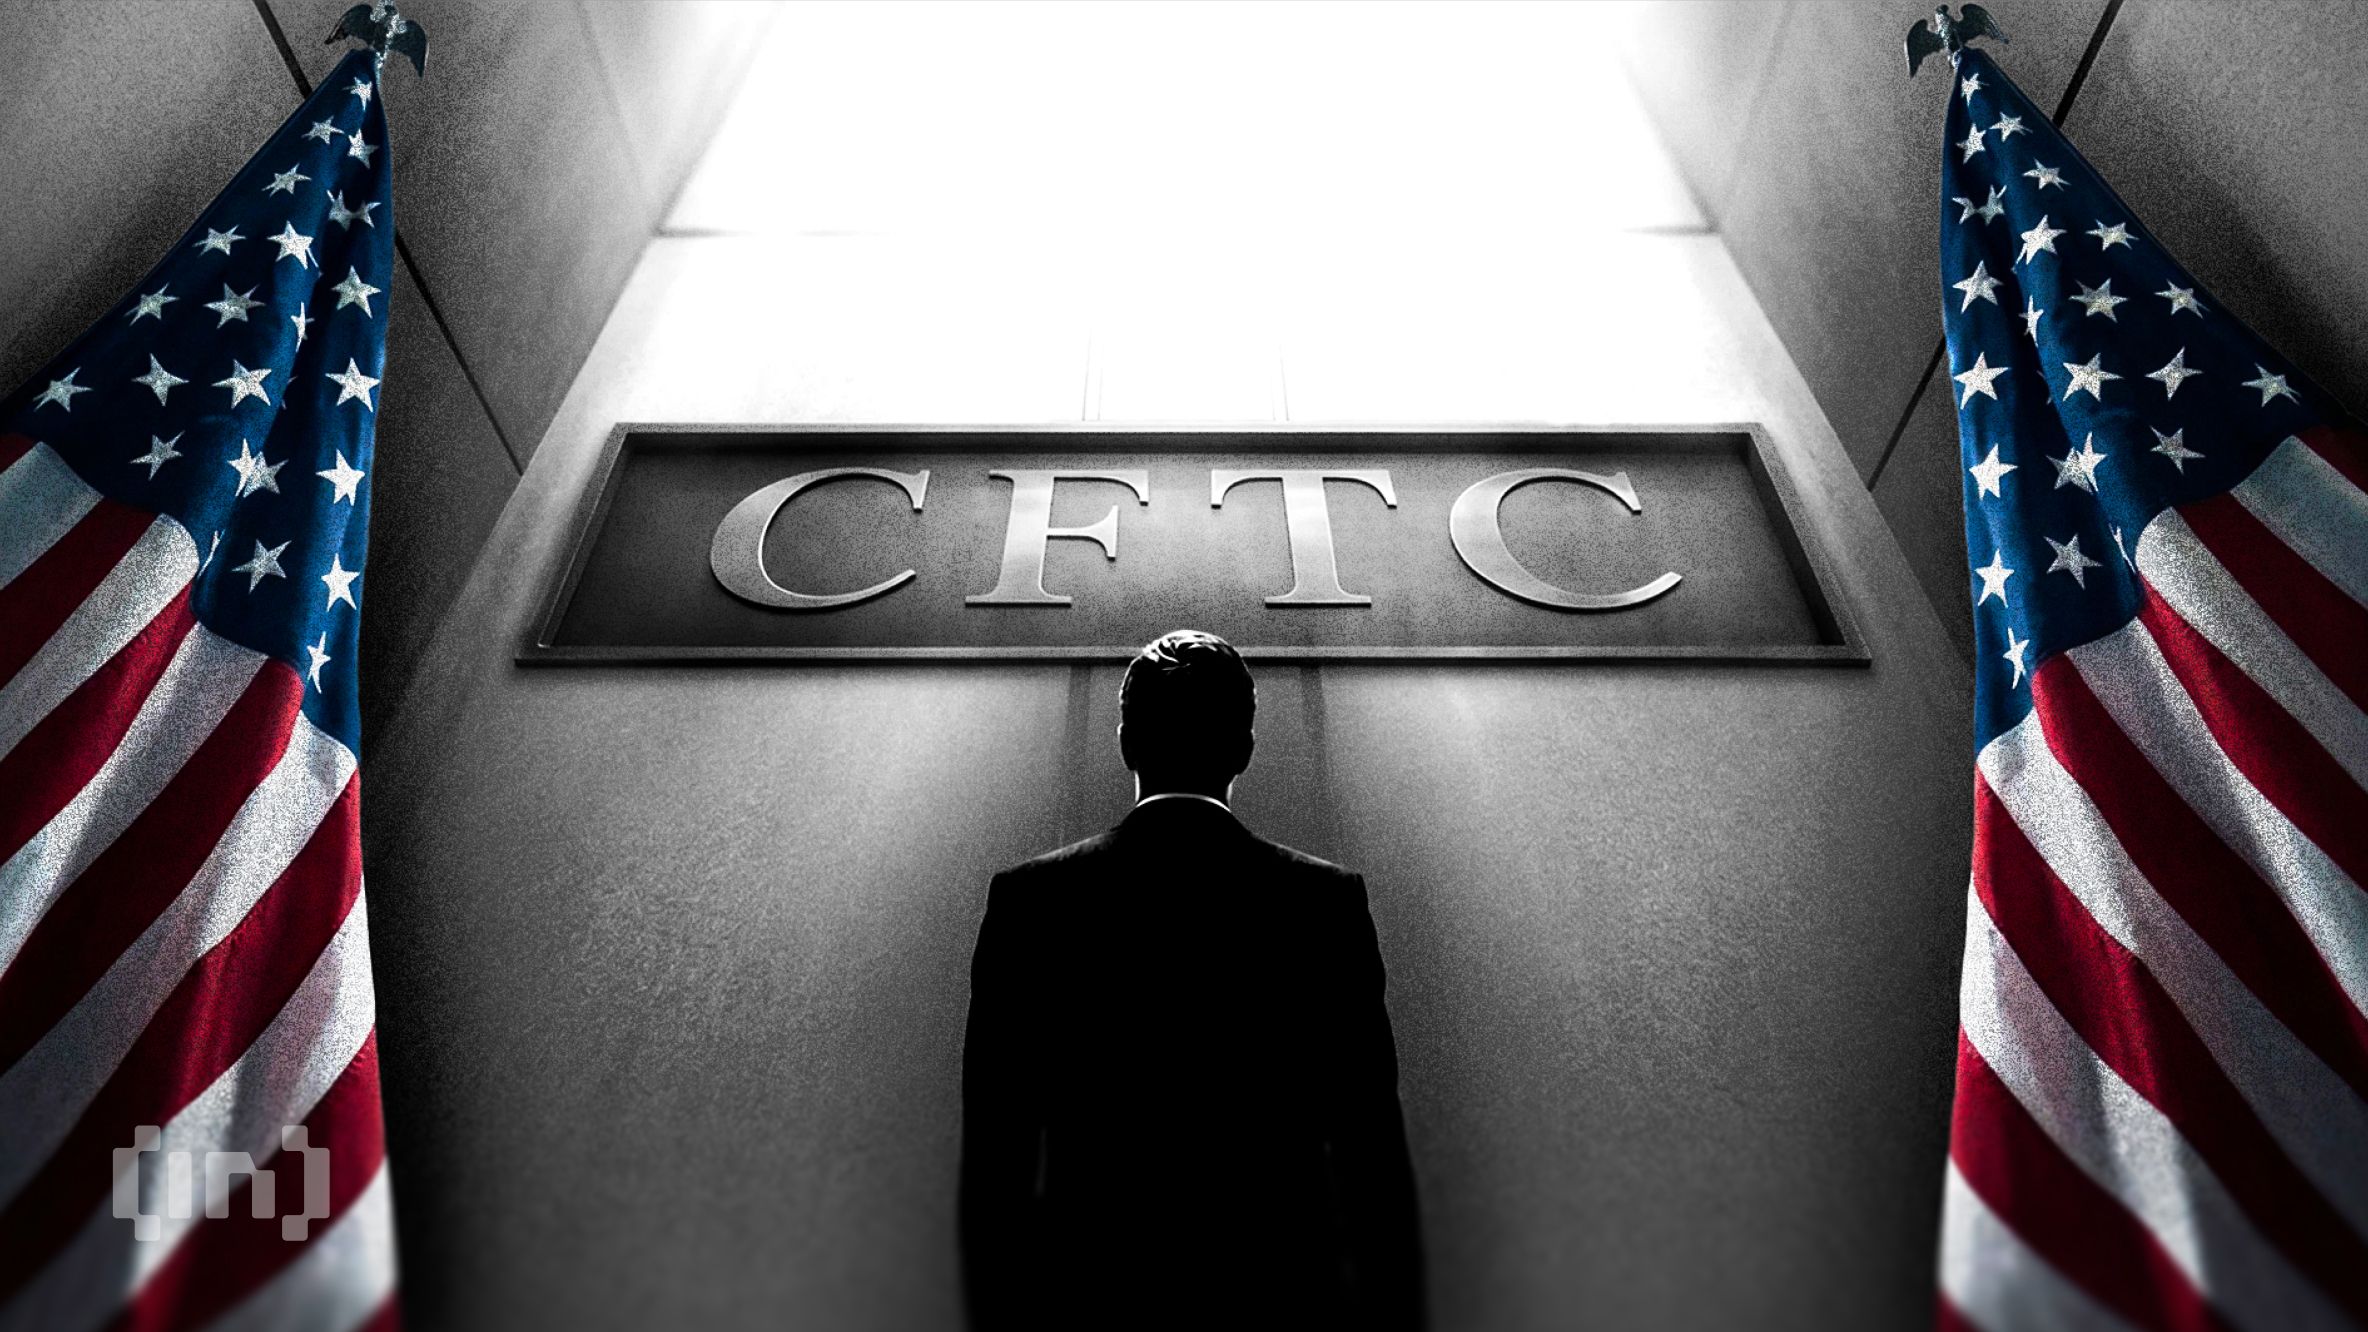

Crypto’s most prominent former regulator wants the industry to stop treating the CLARITY Act as make-or-break. Chris Giancarlo, who chaired the Commodity Futures Trading Commission from 2017 to 2019, says the technology gets built either way.
Giancarlo still wants the bill passed. However, he argues the industry has staked its public message on legislation that has sat idle in the Senate for 80 days.
The CLARITY Act Is Not a Precondition
Speaking in a recent interview, Giancarlo said the sector has overcommitted to one piece of legislation.
“Now, what I’d say to the industry is perhaps it’s time to stop making such a big deal out of CLARITY,” he said.
The timeline explains the anxiety. The House passed H.R. 3633 on July 17, 2025, by 294 votes to 134. The Senate Banking Committee advanced it 15-9 on May 14, 2026.
No floor vote has followed. The Senate calendar sends the chamber home from August 10 until September 11, leaving roughly one week of floor time.
Giancarlo pointed to an older technology as precedent.
“The industry is running around saying we need clarity, we need clarity. Yeah, we do. But the internet is still happening and there’s never been an authorizing statute 30 years later. If we don’t get clarity, innovation goes on.”
Follow us on X to get the latest news as it happens
That cuts against the message from the bill’s loudest backers, including MicroStrategy and its lead Senate author, Cynthia Lummis.
Why Giancarlo Still Wants the Bill
His position is not opposition, and part of it is personal. Section 503 codifies LabCFTC, the fintech office he created in May 2017 as acting chairman.
He wants every financial regulator in Washington to run something similar.
“I’d like to see clarity pass, but I think we need to brace ourselves that it might not and the world is going to go on.”
The Precedent That Worries Him
Giancarlo also warns that legislation drags surveillance along with it. Public Law 119-27, the GENIUS Act, subjects permitted stablecoin issuers to the Bank Secrecy Act.
CLARITY applies the same standard to digital asset transactions. Giancarlo argues that approach violates Fourth Amendment privacy rights.
What Happens If CLARITY Fails
The CFTC is running on one Senate-confirmed official. Michael Selig, sworn in as the 16th chairman in December 2025, occupies the only filled seat of five.
Giancarlo expects the agency to keep moving with or without a statute.
“This is a change that is going to happen whether the clarity bill passes or not… Clarity will bring order to how that change happens. But it’s not going to stop that change.”
Failure would separate builders from spectators, he argued.
“If clarity doesn’t pass, the… premium for courage is going to go up.”
Subscribe to our YouTube channel to watch leaders and journalists provide expert insights
The post Stop Acting Like the CLARITY Act Is Everything, Former Regulator Says appeared first on BeInCrypto.
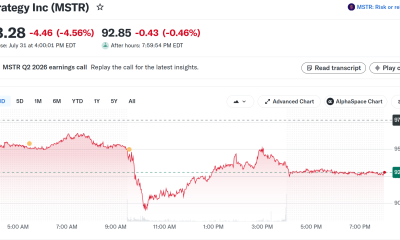
SpaceX earnings land Tuesday, August 4, marking the first since the company went public. The June listing already paid Morgan Stanley bankers about $100 million in fees.
That fee was the small part. IPOs led by SpaceX sent more than $74 billion to the bank’s wealth arm. Now SpaceX has to show the numbers behind it.
How the SpaceX IPO Built Morgan Stanley’s $10 Trillion Quarter
SpaceX sold 555,555,555 shares at $135 each on June 11. That raised $75 billion. It is the biggest IPO ever, more than double the $29.4 billion Saudi Aramco raised in 2019.
Ten banks ran the deal. Goldman Sachs, Morgan Stanley, BofA Securities, Citigroup and J.P. Morgan led them. They all shared the fee pool.
Only one of those banks also ran SpaceX employee stock plans. That is what set Morgan Stanley apart.
Here is why it matters. When staff get rich on IPO day, the money lands wherever their stock plan already lives.
Morgan Stanley’s wealth arm took in $148.1 billion of new client money last quarter. A year ago the figure was $59.2 billion.
Just over half came from IPOs of stock plan clients, its earnings release shows. That is more than $74 billion in three months. Bloomberg reported a large share came from SpaceX.
The bank calls this unit Workplace. It bought Solium Capital in 2019 and E*Trade in 2020 to build it. Both deals pushed the firm deeper into steady fee income after the 2008 crisis.
Workplace now serves over half the S&P 500. It also covers about 70% of the 100 biggest private companies worth more than $1 billion. Total client assets passed $10 trillion.
Jed Finn runs Morgan Stanley’s wealth business. He sees the IPO as a start, not a payday.
“It would be a mistake to think about the IPO as a one-off event for asset capture. These are opportunities with multiple phases, with shares that get unlocked and new shares issued.”
Follow us on X to get the latest news as it happens
Here is the catch. Most of that money is not earning fees yet.
Morgan Stanley charges a fee once clients move cash into managed accounts. Only 26% of the new money went that way last quarter. A year earlier it was 72%.
Bloomberg puts the yearly revenue from SpaceX-linked money above $100 million. Getting it depends on shares that are still locked.
What SpaceX Earnings Have to Prove on August 4
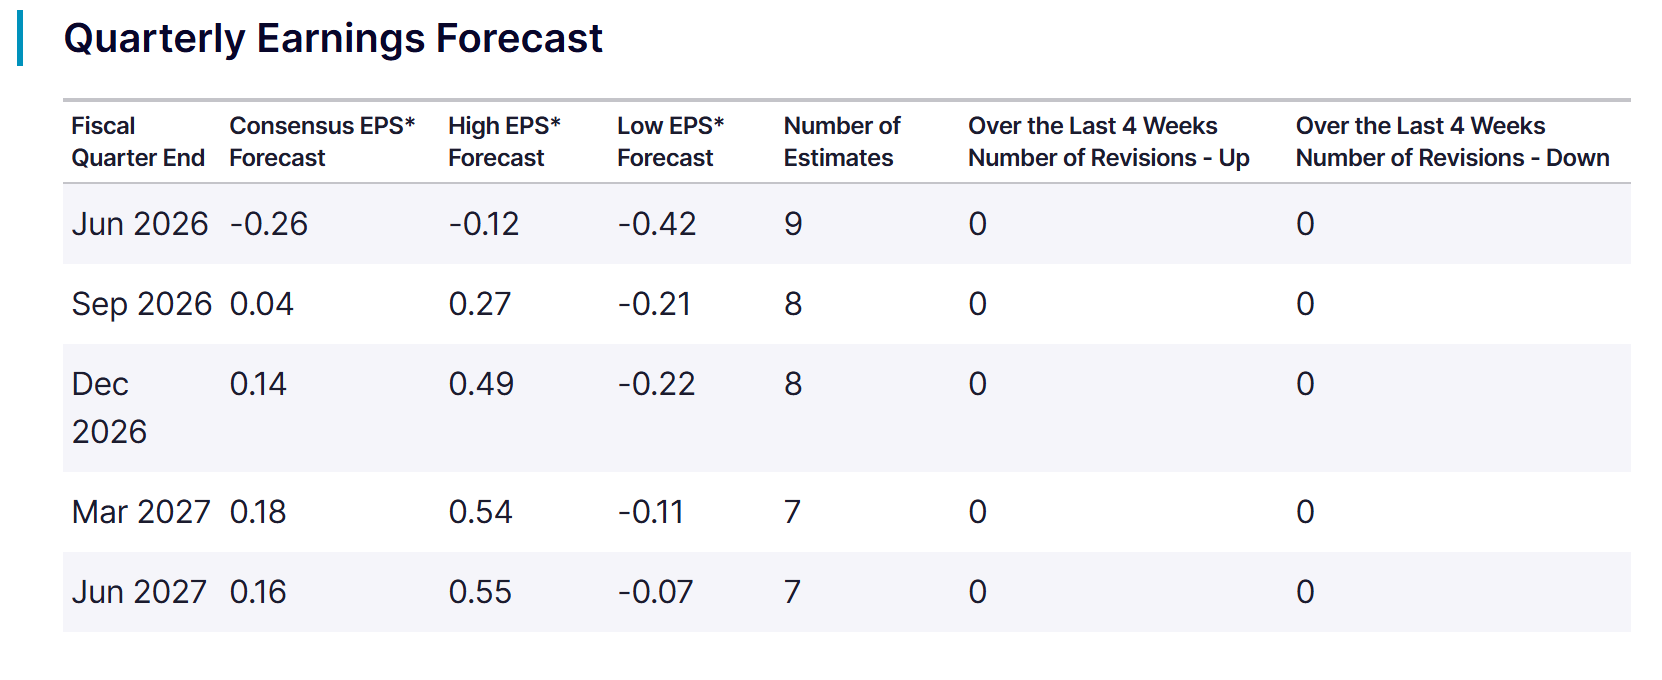
Results come after the close on Tuesday. Analysts expect a loss of 26 cents a share. Nine of them filed forecasts, per Zacks.

This is the first real look inside the business. Investors want launch numbers, Starlink revenue, and the split between government and commercial work.
The stock has not waited. SPCX closed at $108.37 on July 31. That is 20% below the $135 offer price and 33% below its $161 first-day close. It hit a record low last week.

Contracts have not helped either. Shares still fell after SpaceX won $1.6 billion in Space Force launch work through 2027.
Then comes August 6. About 911.5 million locked shares become free to sell, two trading days after earnings.
At Friday’s price that is close to $99 billion of stock. It is more than the IPO itself raised. Meta’s 2012 unlock is the closest thing to a warning here.
Morgan Stanley has already been paid. It raised its dividend 15 cents to $1.15 and approved $20 billion in share buybacks. SpaceX investors are still waiting.
The post SpaceX IPO Paid Wall Street $100 Million: Will It’s First Earnings Repay Investors? appeared first on BeInCrypto.

White House teleprompter operator Gabriel Perez is no longer employed by the federal government after being placed on unpaid leave over allegations that he used insider knowledge to bet on President Donald Trump’s speeches, according to another official.
Speaking on condition of anonymity, the official said that Perez had left his government job but did not say whether he resigned or was fired.
Inside the Allegations
The White House had suspended Perez earlier this month following an ABC News report that alleged he made more than $100,000 through bets on the online prediction market Kalshi. The report said the wagers were based on advance knowledge of what Trump would say during major speeches, including the State of the Union address earlier this year.
The allegations drew a sharp response from the White House. Press secretary Karoline Leavitt described the reported insider trading as “deeply unfortunate and, frankly, a disgrace.” Kalshi also responded after the report was published.
Robert Denault, the company’s lawyer and head of enforcement, said in a post on X that its surveillance team detected the trades, investigated them, and referred the matter to the US Commodity Futures Trading Commission (CFTC). Denault’s statement did not identify Perez by name.
Legal Battles
Kalshi has faced legal hurdles this year in Massachusetts, Michigan, Nevada, and Washington. At the same time, it has also tightened its own rules. In April, the prediction market suspended three political candidates for betting on elections they were contesting after determining that the trades amounted to political insider trading under its CFTC-approved rules.
An insider trading case on Polymarket also surfaced that same month. Federal prosecutors charged US soldier Gannon Ken Van Dyke with allegedly betting on whether former Venezuelan President Nicolás Maduro would be removed from power. Authorities said Van Dyke, who worked on the operation targeting Maduro, made about $400,000 from the trades.
The legal battle over prediction markets has also taken a new turn. This week, a federal judge temporarily blocked Minnesota from enforcing a new law that would have banned prediction markets in the state. The ruling gave a temporary win to Kalshi, Polymarket, and the CFTC as the case moves forward.
Judge Katherine Menendez said the law is likely preempted by the federal Commodity Exchange Act because many event contracts may qualify as federally regulated swaps. The law, signed by Governor Tim Walz in May, was set to take effect on Saturday. The judge said the injunction could later be narrowed if needed.
The post Teleprompter Operator Accused in Kalshi Betting Case Is No Longer a Federal Employee appeared first on CryptoPotato.


President Donald Trump reshared a White House post on Sunday about restarting California’s Sable Pipeline. The same day, OPEC+ agreed to pump more oil from September.
Both moves add oil to the market. Neither has helped drivers yet. Californians paid $5.49 a gallon in late July, the highest price in the country.
Why Trump Revived a March Order Now
Gas is expensive, and Trump knows it.
US drivers paid about $4.10 a gallon in the week to July 27, federal data shows. That is 97 cents more than a year ago.
In June, Trump told fuel retailers to cut prices to $2.50. They have not.
California hurts most at $5.49 a gallon. That is roughly $1.39 above the national average, which makes the state an obvious target.
On March 13, Trump signed an order giving Energy Secretary Chris Wright emergency powers. The law behind it, the Defense Production Act, lets Washington direct private companies during a crisis.
Wright told Sable Offshore Corp. to reopen the Santa Ynez Pipeline. It had sat unused since a 2015 oil spill.
Oil flowed the next day. Sable aimed to sell about 50,000 barrels daily from April 1, a company filing shows. The line can carry 200,000.
Courts keep pushing back. On June 17, a California appeals court blocked Sable’s coastal work, backing state regulators in a published opinion.
OPEC+ Supply Hike Opens One Tap, Not All
Seven countries agreed to pump 188,000 more barrels a day from September. Saudi Arabia and Russia account for most of that, at about 62,000 barrels each.
The move finishes one round of cuts. The group had held back 1.65 million barrels a day since April 2023. That batch is now fully back.
A second cut from November 2023 stays in place. So the taps are not fully open.
OPEC says it can still speed up, pause, or reverse, according to its July statement.
Harder talks come in 2027, when the group sets new limits for each member. Iraq already wants a bigger share.
What This Means for Crypto
More oil has not made oil cheaper.
Brent crude sat near $87 on July 20. US crude was close to $84. Those are the latest daily figures from the Energy Information Administration.
Wars in Iran and Ukraine explain the gap. They block exports, so the extra barrels stay stuck on paper.
That matters for Bitcoin. Costlier fuel pushes inflation higher, and energy costs pressure Bitcoin by making rate cuts less likely.
Cheaper fuel does the opposite. It gives the Federal Reserve room to cut, which has lifted risk assets before, such as after the Fed held rates steady.
The question now is simple. Will September’s barrels reach buyers, or stay stuck?
The post Trump’s Oil Order Meets OPEC+ Supply Hike: Why California Gas Costs $5.49 appeared first on BeInCrypto.

Data shared by Lookonchain earlier today suggests that Trump Media, the entity behind the Truth Social media platform, majority-owned by the Donald J. Trump Revocable Trust, has sold over $165 million worth of bitcoin.
This was the second substantial sale made by the entity in recent months after it had splashed over $1 billion at prices near the top last year to accumulate 11,542 units.
The on-chain analytics company noted that the latest offload was for 2,628 BTC after it had transferred the stash to crypto.com. This continued a streak that began earlier this year.
Previously, the entity had spent $1.37 billion to acquire 11,542 BTC at an average price of $118,522. Since its entry level was very close to bitcoin’s very top marked just under a year ago, this automatically means that its sales have been completed at prices well below that.
CryptoPotato reported the previous BTC disposal in May, when wallets linked to Trump Media sold another substantial batch of 2,650 BTC for $205 million.
Lookonchain’s data concurs that the entity has sold a total of 7,281 BTC since it began disposing of its assets, at an average price of under $75,000. This means that its total losses have grown to $555 million.
It looks like Trump Media sold another 2,628 $BTC($165.07M).
Trump Media bought 11,542 $BTC($1.37B) at an average price of $118,522, then started selling 7 months ago, selling a total of 7,281 $BTC ($545M) at an average price of $74,855.
Trump Media is now down a total of $555M… pic.twitter.com/9xx0MTbweg
— Lookonchain (@lookonchain) August 2, 2026
Aside from the continuous controversial decisions toward the crypto industry from the POTUS-linked companies, this move builds on a recent worrisome trend about BTC treasury firms deciding to sell during times of distress.
As we reported last week, several public companies have shifted their strategies, with some selling BTC holdings while others have paused buying the asset indefinitely.
The post Trump Media Sells Another $165M in Bitcoin, Booking a Fresh Loss appeared first on CryptoPotato.
After two consecutive painful months in which they lost billions of dollars, the spot Bitcoin ETFs finally turned the page in July, but inflows were still modest.
Meanwhile, the exchange-traded funds tracking the performance of the largest altcoin enjoyed the month more, attracting over 2x more fresh capital.
Bitcoin ETFs in July
March and April were quite bullish for the spot BTC ETFs as the financial vehicles attracted well over $3 billion. However, the trend changed violently in May when they lost $2.43 billion. June became the worst month on record, as investors pulled out just over $4.5 billion. In total, the net outflows for May and June stood at nearly $7 billion, and the cumulative total flows dropped from over $58 billion to $51 billion.
July started more positively, with almost $200 million in net inflows during the first full week. Another $76 million followed during the second, and a more modest $34 million in the third. The trend was obvious as the initial high numbers gradually declined, aligning with the underlying asset’s controversial and sporadic price performance and ultimately leading to a very modest increase throughout the month.
The last week in July was once again in the red, with investors pulling $61.53 million out of the funds. Friday was the most painful day, as the total net outflows stood at over $265 million. As such, the month ended with $172.42 million. On one hand, green finally overcame the red wave, but on the other, the number was nowhere near enough to offset some of the recent losses.
ETH ETFs Do Better
The Ethereum ETFs entered July after a similarly painful two-month streak, in which they lost $541 million in May and another $529 million in June. However, investors were more persistent, and the actual net inflows for July were at a more respectable $365.17 million, thus outpacing the BTC ETF flows by over 2x.
Moreover, the ETH ETFs closed all four full weeks of July in the green, including the last one, which saw only one day in the red. Perhaps this investor behavior is among the reasons behind the underlying asset’s major resurgence in July. As reported earlier, ETH ended the month with a substantial 20% increase, making it the best in precisely a year.
All eyes are now on August, which hasn’t been ETH’s most favorable month historically, but there are some major double-digit exceptions.
The post Bitcoin vs. Ethereum ETF Battle: Who Won July? appeared first on CryptoPotato.
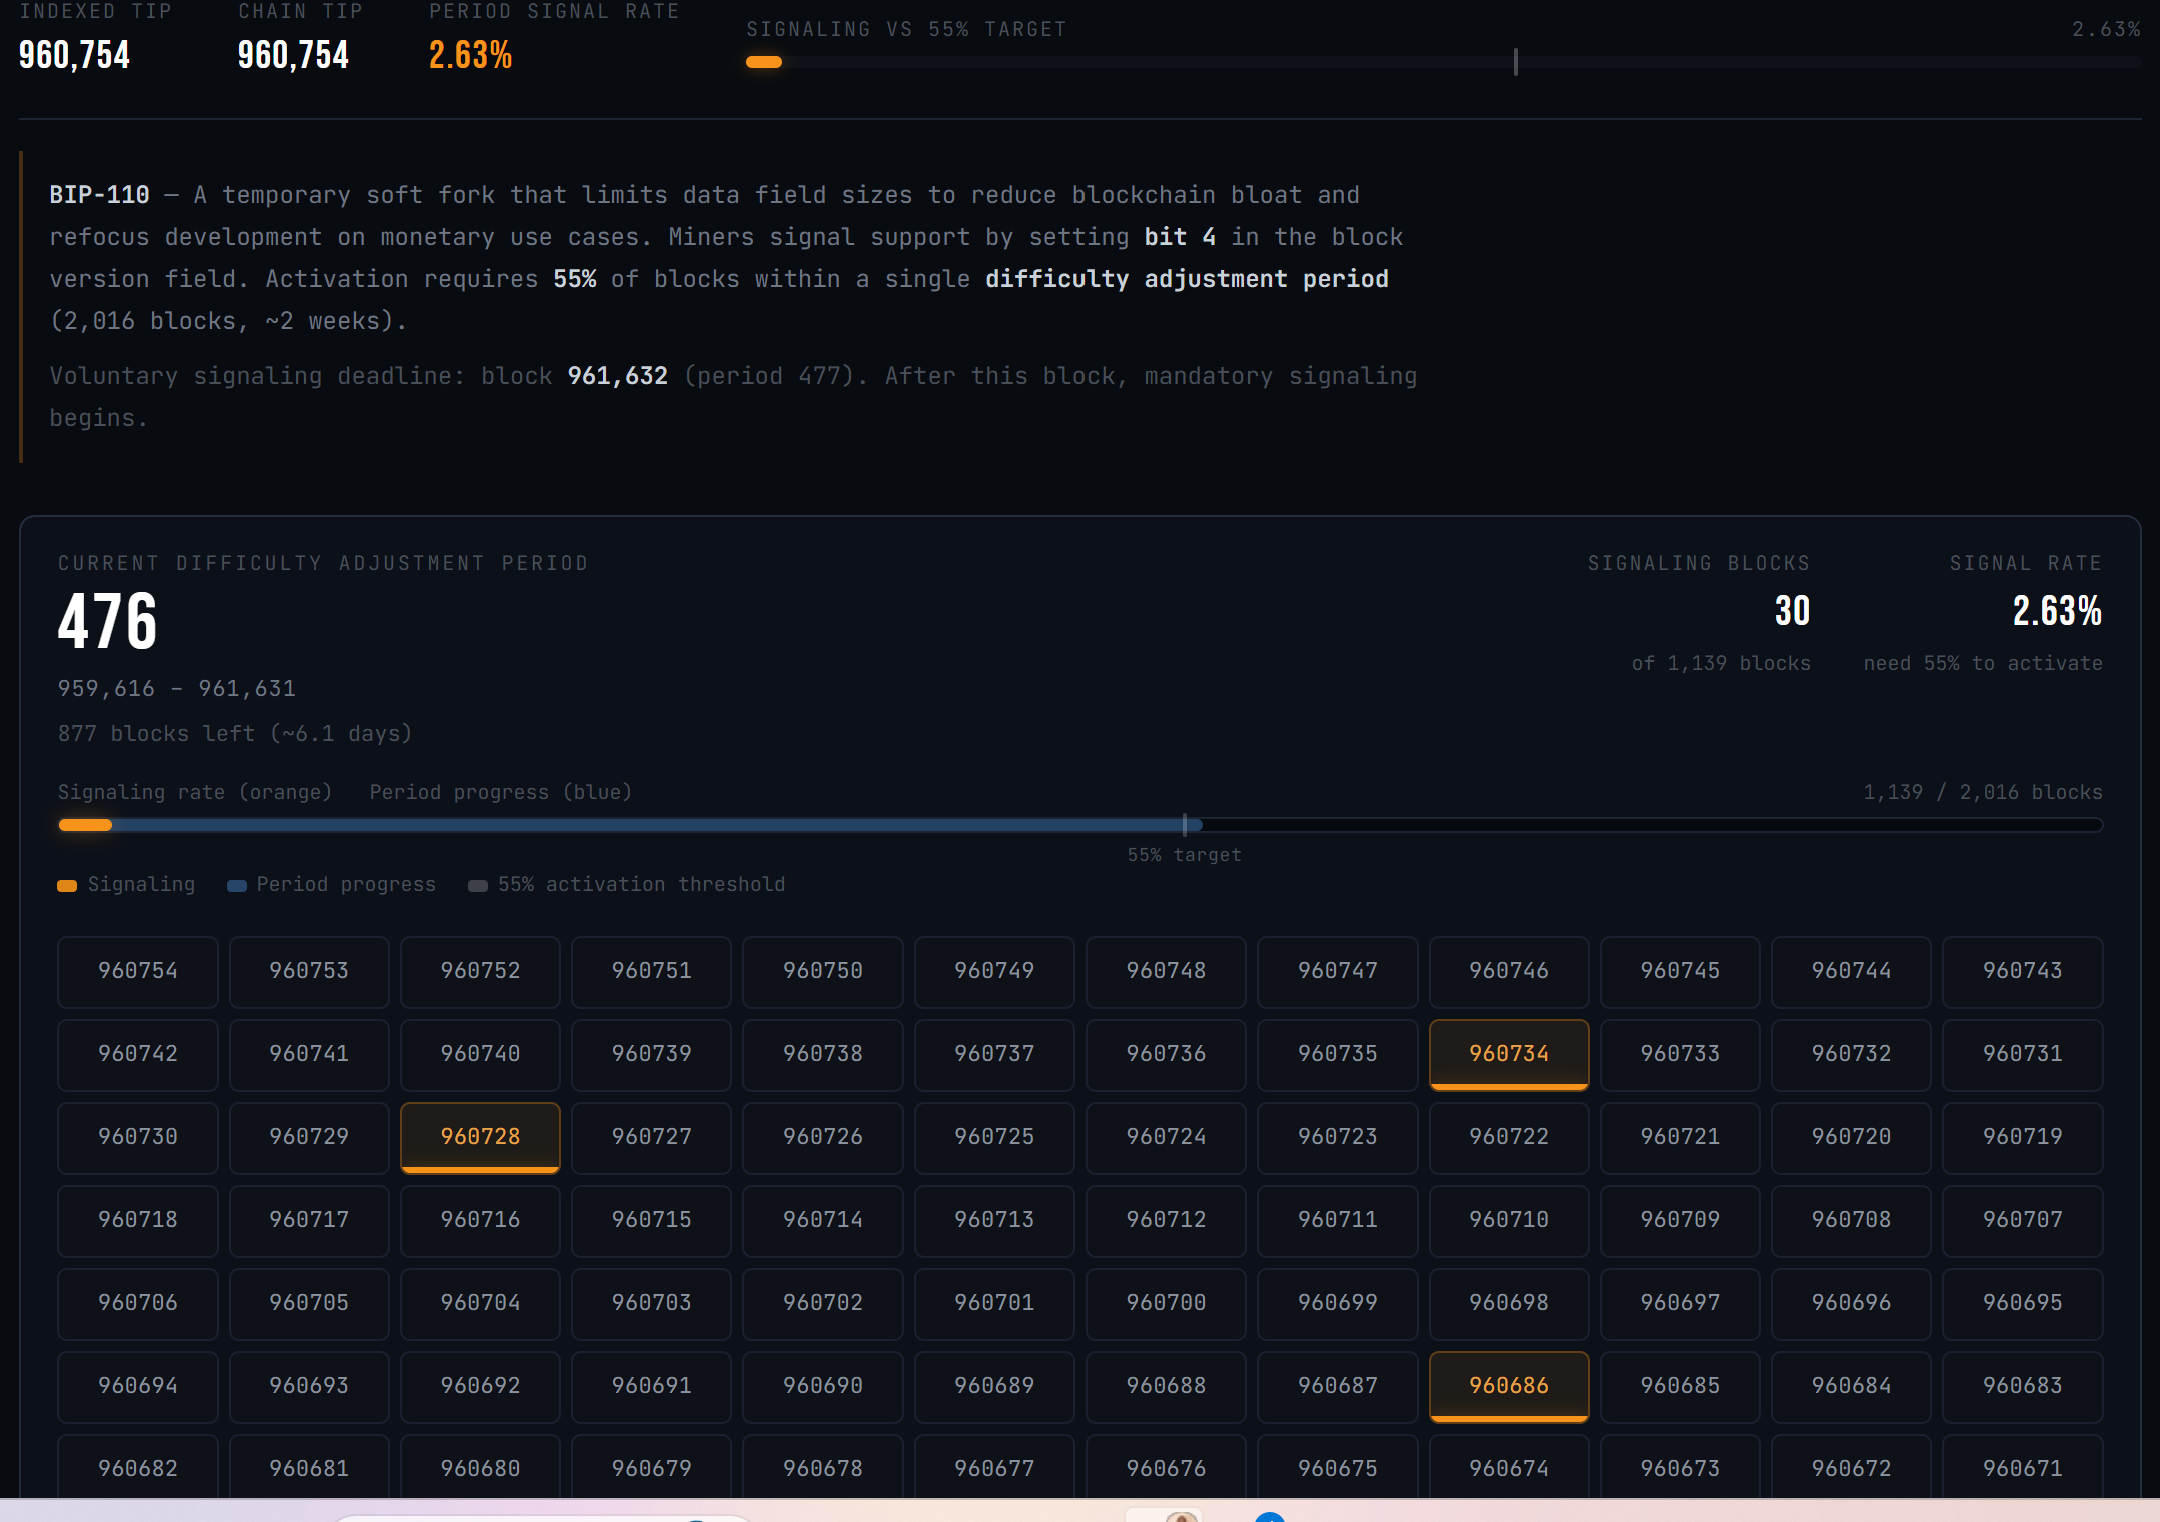
The developers pushing Bitcoin’s BIP-110 rule change have called off its launch. They blamed the industry response to a Coldcard wallet flaw that left user funds easier to steal.
Udi Wertheimer announced the delay, urging anyone running BIP-110 software to switch back to a normal Bitcoin (BTC) node. He gave no new date.
Why BIP-110 Activation Was Paused
BIP-110 is a temporary rule change, known as a soft fork. It would limit how much data people can pack into Bitcoin transactions.
Supporters say that data crowds out ordinary payments. Critics say Bitcoin should not police what users store.
The limits would last one year. Developer Dathon Ohm wrote the rules, and Bitcoin Knots software ships them.
Miners started voting on December 1, 2025. The Bitcoin blockspace spam debate had already split the community.
Then a separate problem landed.
Coinkite disclosed the bug on July 30. Its COLDCARD wallets built seed phrases, the master key behind a wallet, using far less randomness than promised. Roughly 72 bits instead of 128.
That gap makes a seed vastly easier to guess. Wallets running firmware released since March 2021 were hit hardest.
Updating the device does not fix a seed it already made. Coinkite is telling owners to move their money.
Thieves had already drained wallets tied to the flaw. The company has not said how much was lost.
Wertheimer called the delay a matter of timing, not doubt.
“…due to the coldcard incident, BIP-110 community leaders have decided to DELAY ACTIVATION. a new activation date will be announced at a later time,” he wrote.
Follow us on X to get the latest news as it happens
The Math Was Already Settled
Miners back a rule change by flagging their blocks. BIP-110 needed 55% of blocks in a two-week stretch. That means 1,109 blocks. The live monitor counted 30.

That is 2.63% of 1,068 blocks mined this period. It is the best BIP-110 has ever managed. It is still more than 20 times short.
Every earlier two-week stretch since December finished below 1.3%. Only 948 blocks are left. Even if every one voted yes, the total would reach about 48%. It could not pass this round.
That was already true days before anyone announced a delay.
Michael Saylor has warned about Bitcoin neutrality for weeks. He says almost every yes vote comes from one mining pool. Blockstream chief executive Adam Back has flagged chain split risk, calling the 55% bar too low to be safe.
A second phase was due at block 961,632, about six days away. It would reject any block that did not vote yes.
Nodes still running BIP-110 would enforce that on their own. That is why the warning to switch back matters.
No one owns Bitcoin’s rules. Nobody can flip a switch to start or stop a soft fork. This was a request, not a command.
Whether operators listen will say more about BIP-110’s support than any vote counter has.
The post BIP-110 Activation Frozen After Coldcard Exploit: Is the Soft Fork Dead? appeared first on BeInCrypto.

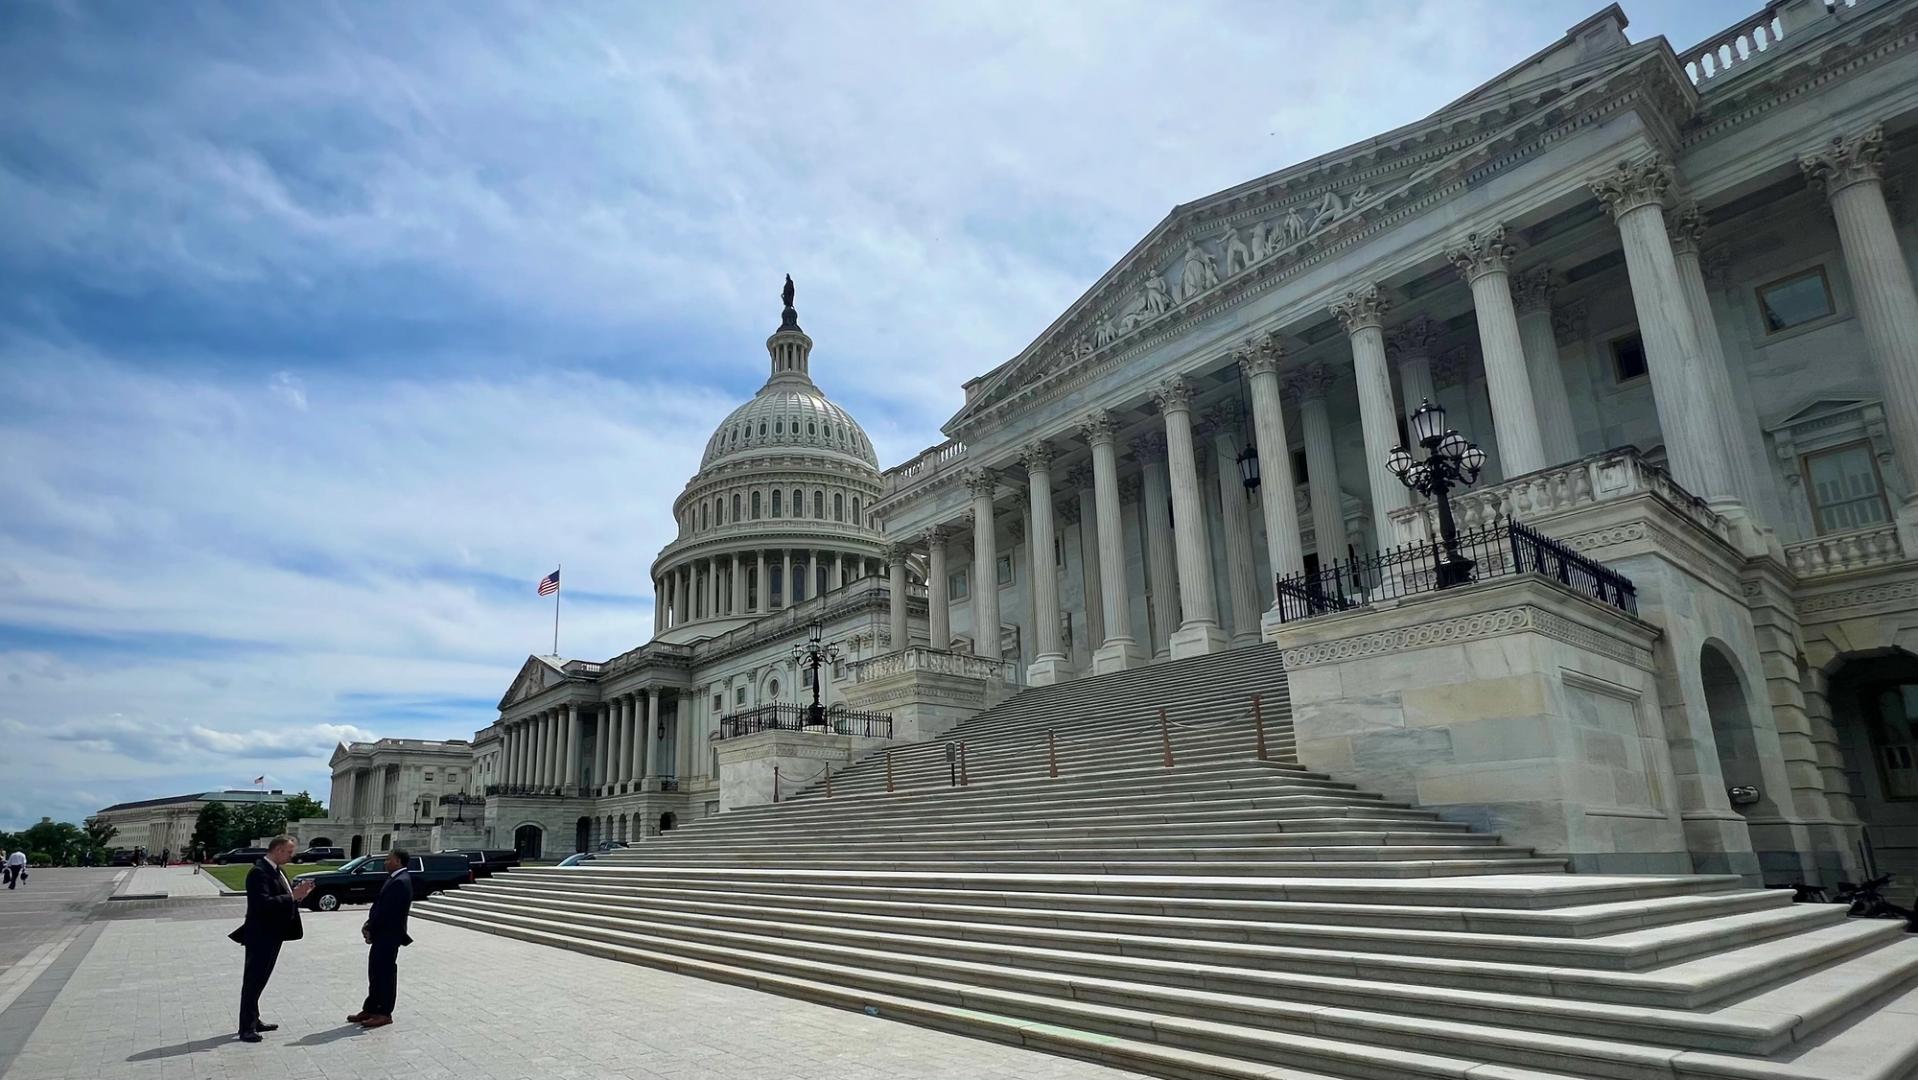
Senators Ruben Gallego and Thom Tillis sent a proposed revised ethics provision to the White House on Thursday, after drafting the compromise the day before, an industry source familiar with the talks told CoinDesk. As of midafternoon on Friday, the White House had not officially responded to the proposal.
Ethics remains the biggest outstanding issue to be resolved before the Clarity Act can advance. There are ongoing negotiations around other issues, including stablecoin reserves and yield, law enforcement authorities and some of the Agriculture Committee provisions addressing the Commodity Futures Trading Commission’s total remit, but these are relatively uncomplicated compared to ethics, two industry sources said. One added that they expected those other issues to be resolved relatively quickly should negotiators come to a deal on ethics.
If the White House signs off on the counter-proposal from Tillis and Gallego, that could speed the way to at least the first part of the cloture process, the other source told CoinDesk. The Senate would still need to follow the cloture process laid out in last week’s edition of this newsletter, but the timelines involved mean that it would be difficult to get the bill all the way through by the end of the week. Still, getting through that first procedural vote would be a visible win for the crypto industry, should it happen.

Triple H shares major tease ahead of WWE SummerSlam Night 2

Russian defense patents a wired ‘aircraft carrier’ drone that deploys 6 tethered UAVs

Coronation Street legend ‘sobbing and in denial’ over Cassie’s ending | Soaps

Renter of Home in Anne Heche Crash Denies Settlement With Son

No Jackpot Winner as $257 Million Prize Rolls Over to $269 Million Monday Draw

Weekend Open Thread: Staud – Corporette.com

#shorts LIVE CRYPTO TRADING | #Bitcoin Live Trading | #live #bitcoin #trading #btc #tradewithsuhani

financial accounting 4th semester || financial accounting

POV: You finally believed in yourself #disciplinedtrader #forextrading #fyp #stocks #crypto #trading
-

 Business4 days ago
Why Trees Belong on the Risk Register
-

 Fashion2 days ago
Weekend Open Thread: Wit & Wisdom
-

 Tech7 days ago
Intel is reversing course and bringing hyper-threading back to its server chips
-

 Politics2 days ago
Meta enters AI-training agreement with far-right ‘propaganda rag’ Newsmax
-

 Politics6 days ago
Luke Littler dismantles Gerwyn Price to retain title in Blackpool
-
 Crypto World1 day ago
MicroStrategy Post-Earnings CLARITY Act Push Could Add New Catalyst for Its Stock
-

 Politics6 days ago
The Part of the Electric Transition Nobody Wants to Discuss
-
 Entertainment5 days ago
‘Stargate’ Creator’s New Sci-Fi Series Returns for Season 3 Tomorrow
-

 Business5 days ago
Major shareholder moves on Canyon
-

 News Videos3 days ago
Bitcoin Enters the 3rd Stage of the Bear Market
-

 Crypto World2 days ago
XRP Ledger v3.3.0 brings five institutional features
-

 Crypto World5 days ago
Kraken Enables Retail Access to Jersey Mike’s IPO via Tokenized Shares
-

 Tech6 days ago
New macOS Sequoia & Sonoma security updates for older Macs
-

 News Videos5 days ago
Claude: Build Financial Dashboards in Minutes (2026)
-

 Politics3 days ago
Luke Littler’s dominance sparks GOAT debate
-

 Business5 days ago
Johnson & Johnson agrees to $5.5B settlement over talc cancer claims
-

 Sports3 days ago
Seema Kaliramna Wins Discus Throw Bronze, Takes India’s CWG Medals Tally To 17
-

 Crypto World12 hours ago
Crypto PAC spending tops $2M in Michigan House race
-

 Tech4 days ago
Gemini can now summarize the messiest comment threads in Google Docs
-

 Business2 days ago
Trump Announces Hamas Disarmament Agreement as Iran Strikes Kuwait Air Base and US Attacks Pause Overnight
You must be logged in to post a comment Login