

Crypto World
Will it Push Ether’s Price Lower?
An early Ether (ETH) investor sold their ETH holdings over the past week as the price headed toward $2,000, sparking fears of further losses. However, onchain data tells a different story as traders speculate where ETH/USD might bottom.
Key takeaways:
- An early Ethereum whale sold $136 million in ETH, adding pressure as Ether trades below the $2,000 level.
- Onchain data shows no evidence that older ETH investors are selling en masse.
- Analysts warn the ETH price could fall further toward the $1,500 support.
Ethereum OG whale sells $136 million ETH
An old Ethereum whale, an early investor holding tokens since the network’s first years, sold 55,000 ETH worth about $112.25 million and 9,442 ETH worth roughly $24 million over the past week.
Related: Ether bears at risk of $2B squeeze as short positions build around $2K
The early Ether investor offloaded a combined $136 million at an average price of $2,041 per ETH, according to blockchain data tracker Lookonchain.

Selling by an old ETH wallet. Source: Lookonchain
However, this does not appear to be part of a wider trend, as an analysis of Ethereum’s supply, based on “HODL waves,” reveals that a significant portion of Ethereum supply remains unmoved on various time frames. In fact, the share of the supply by older holder cohorts has generally increased over the past year.
More recently, the 3m-6m investor cohort saw a notable reduction in supply, which has dropped to 9% from 13.5% on May 19. The 1w-1m holder cohort has also seen its supply holdings drop to 2.6% from 4.76% over the same period. This suggests that most of the supply changing hands is being done by short-term holders.
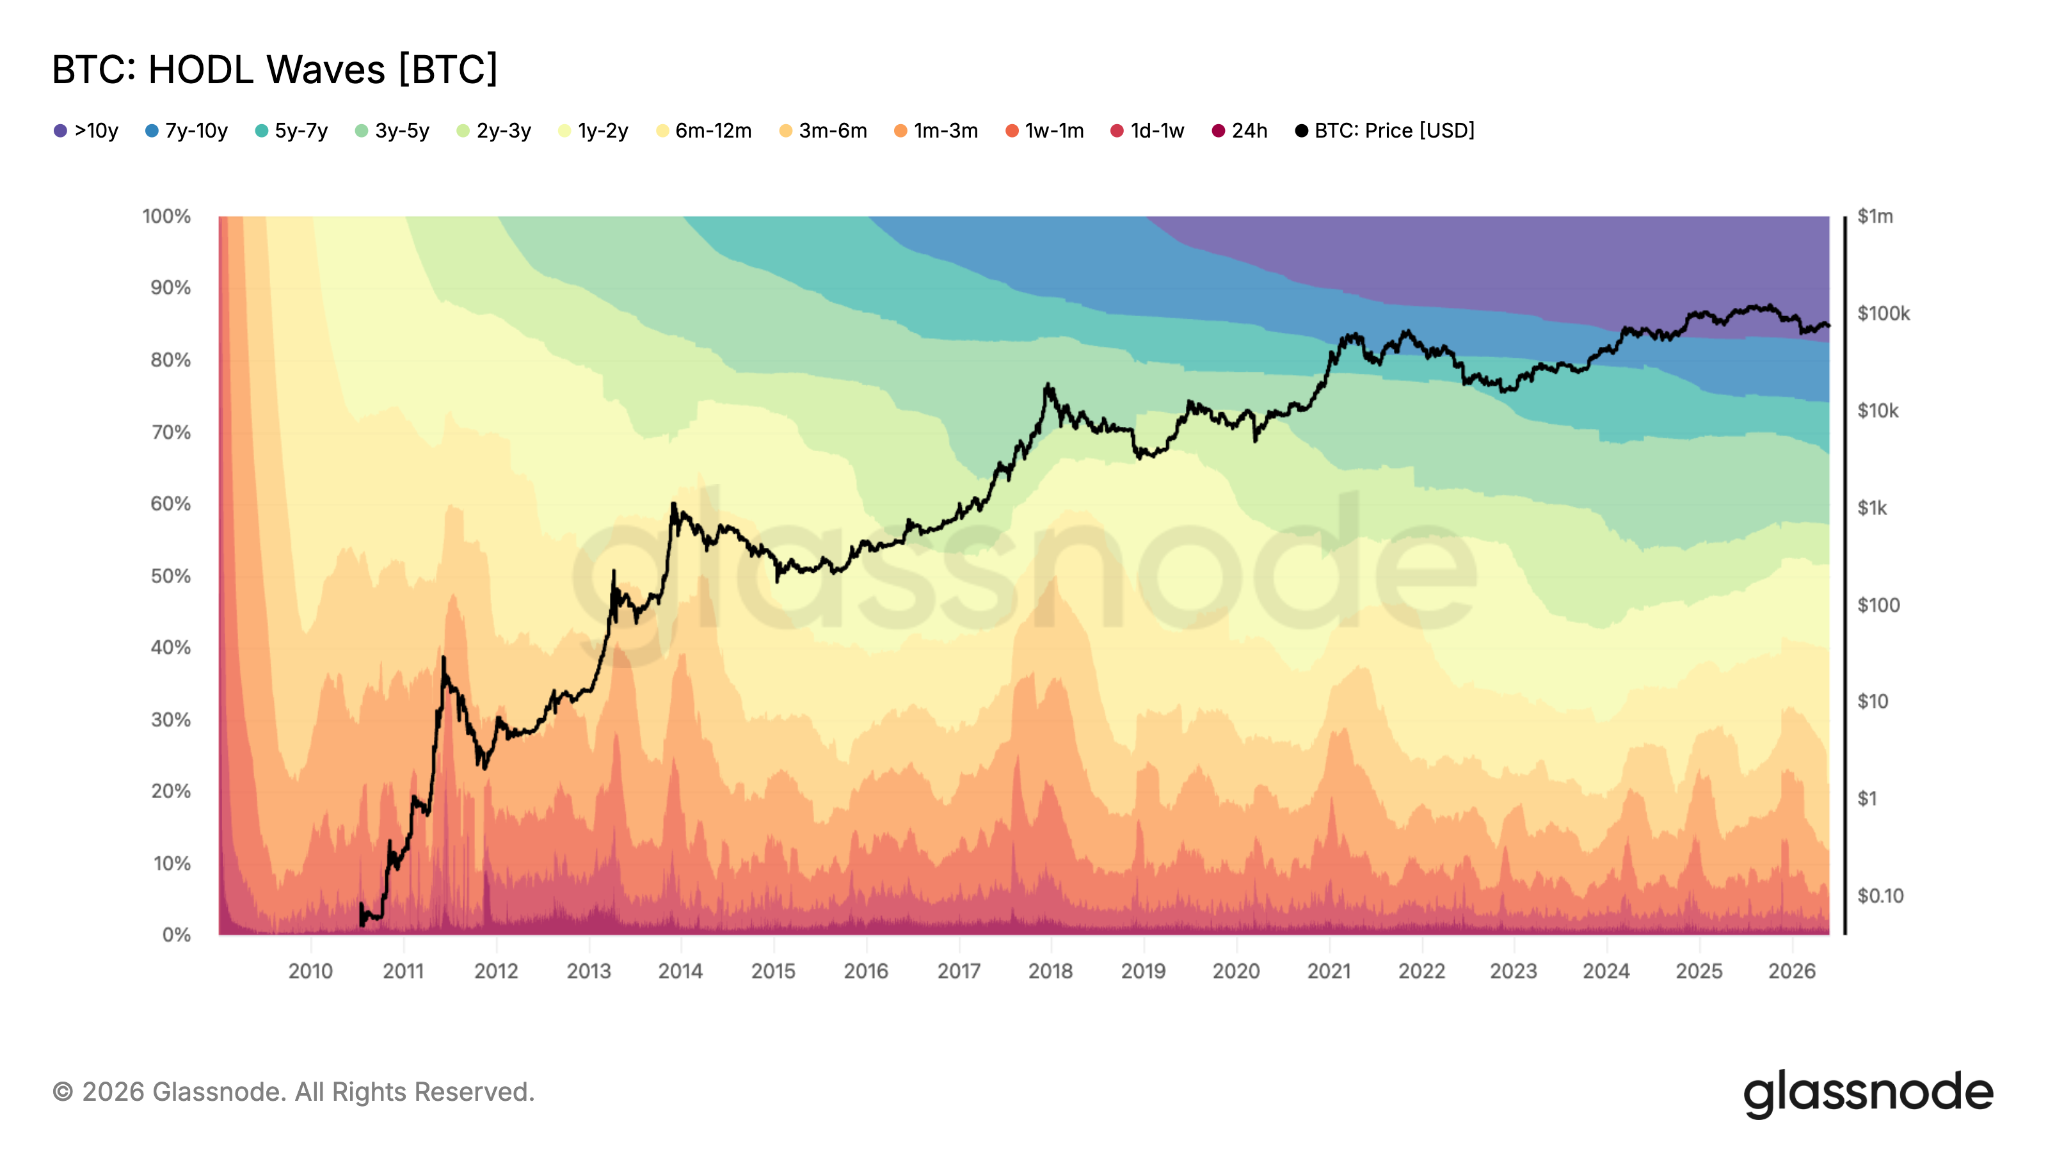
Ethereum: HODL Waves. Source: Glassnode
In fact, supply held by the 5y-7y investor cohort has increased slightly to 9% from 8.59% on May 19.
Moreover, the chart below shows that the supply last active 5-7 years ago has only seen a modest rise in recent weeks and is well below the activity seen in 2022 when ETH price bottomed below $1,000.
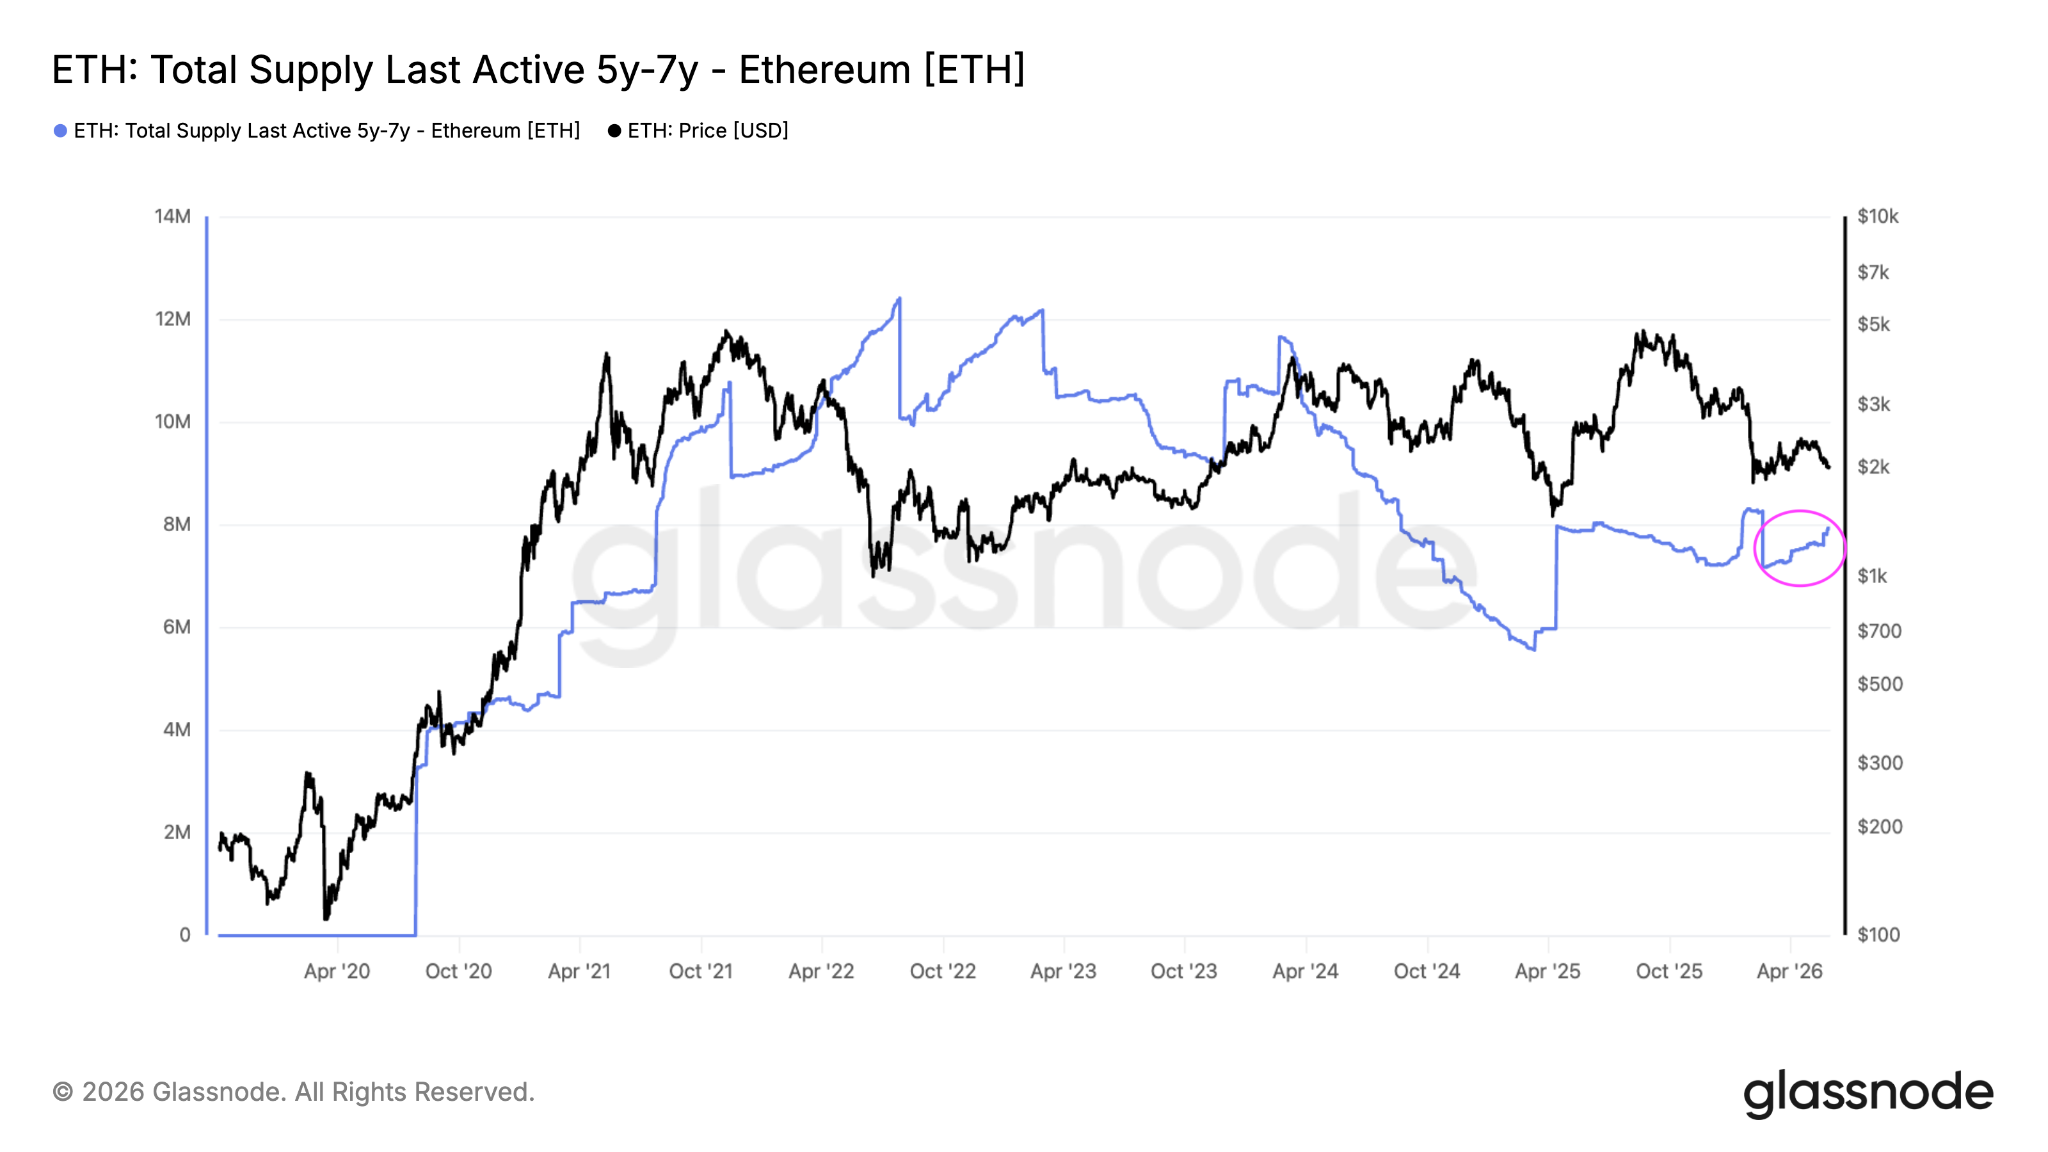
ETH: Total supply last active 5 years to 7 years. Source: Glassnode
Except for several significant players announcing that they have sold a part or their entire ETH holdings recently, there’s no real broad trend to support the argument that Ethereum OGs are selling en masse.
Ether price drop to $1,500?
Since Thursday, ETH/USD has been oscillating around the $2,000 psychological level as traders braced for more price downside.
At the time of writing, ETH is trading at $1,980, down 2% over the last 24 hours and 6.5% on the week.
“This doesn’t look good for Ethereum,” analyst Alex Marzell said in an X post on Sunday adding:
“Momentum continues to favor the bears as $ETH moves closer to the next key support area.”
ETH/USD daily chart. Source: X/Marzell
Marzell was referring to the crucial support around $1,800, which analysts say must hold to avoid a deeper correction.
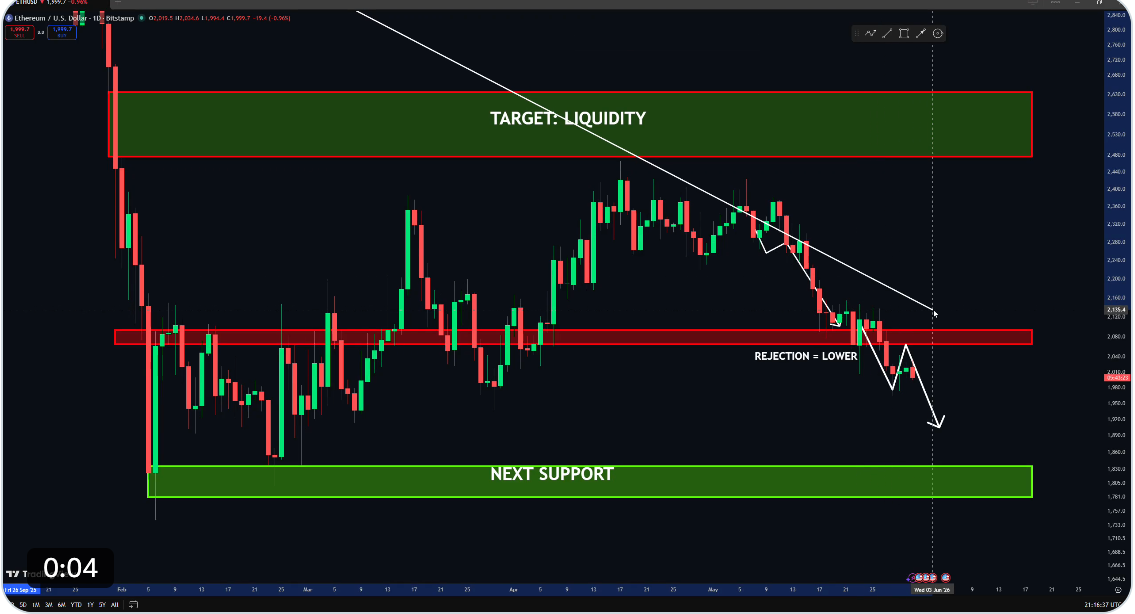
Fellow analyst Merlijn The Trader said that the ETH/USD price action is “mapping perfectly onto a Wyckoff Accumulation structure,” as shown on the three-day chart below.
The analyst explained that ETH is currently in a “Phase B consolidation, post-selling climax” and was entering Phase C, where it would bottom below $1,500.
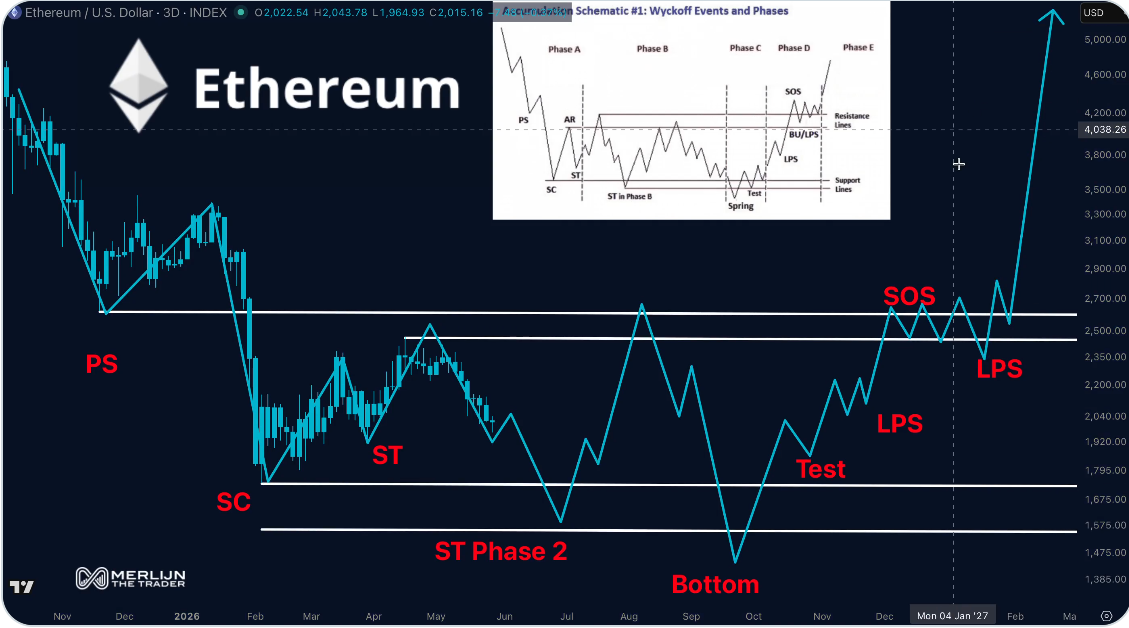
ETH/USD three-day chart. Source: Merlijn The Trader
Another analysis by Echo Analysis said a bear flag breakdown projected ETH price drop toward $1,500 support.
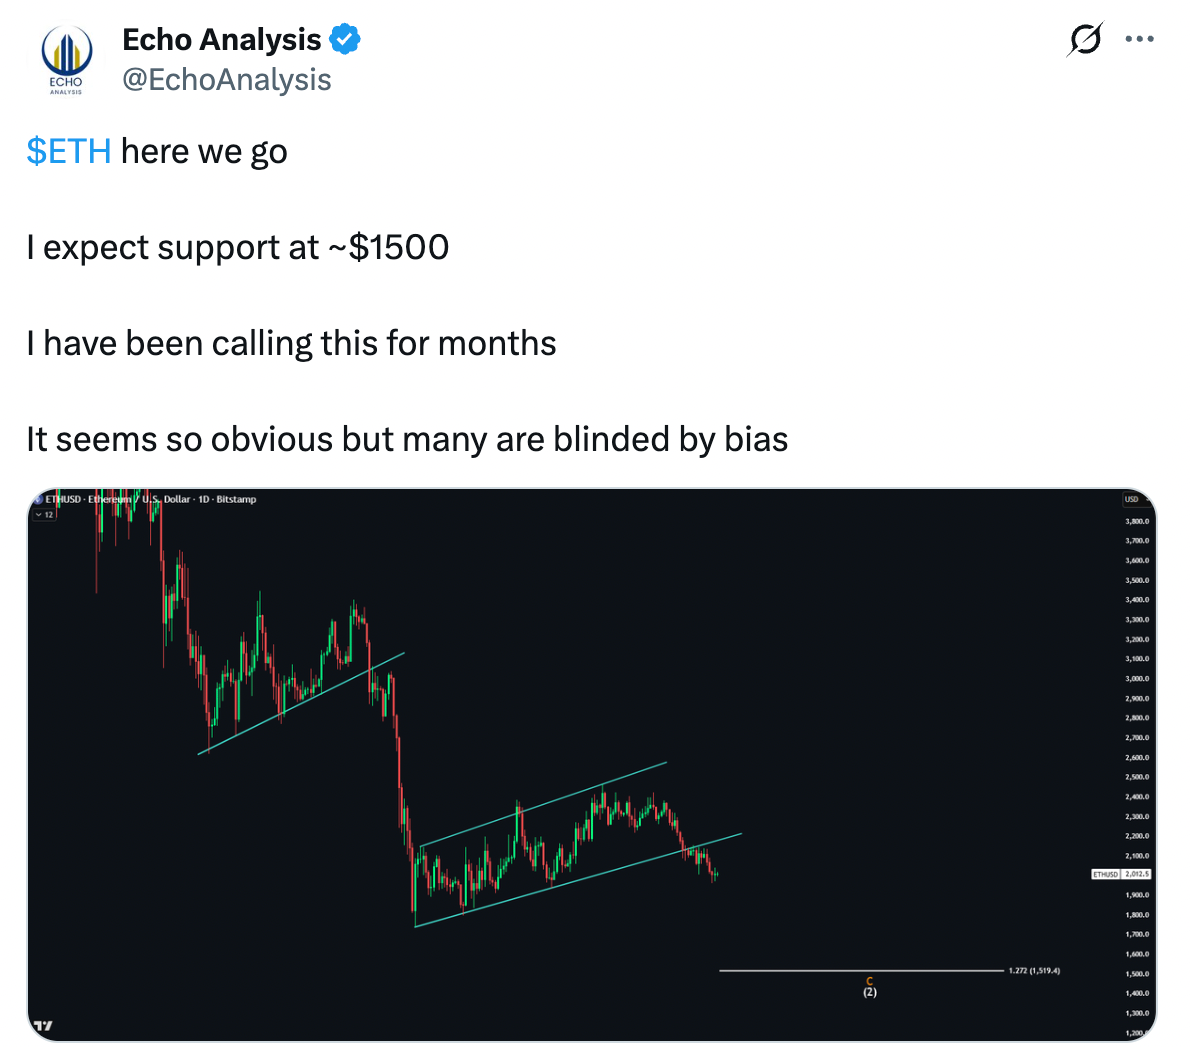
ETH/USD daily chart. Source: Echo Analysis
As Cointelegraph reported, increasing supply on exchanges and declining ETF demand put ETH at risk of another leg down toward the $1,500-$1,700 demand zone.

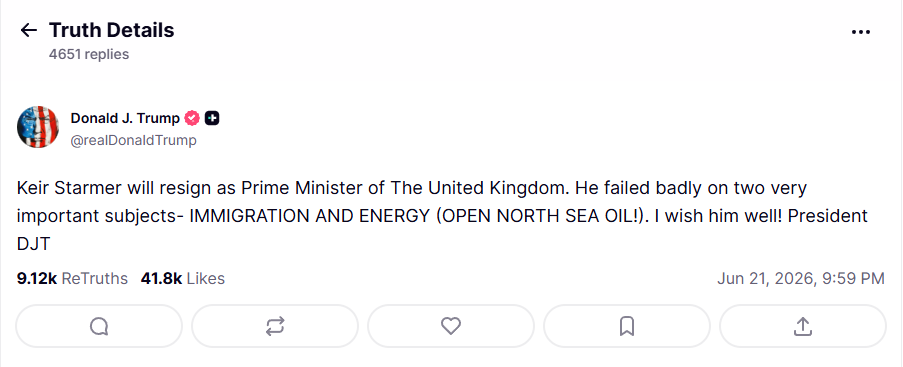
Donald Trump has all but confirmed reports that UK Prime Minister Keir Starmer is set to resign, singling out his government’s ban on new North Sea oil licences as a central cause of his political collapse.
In a Truth Social post on Saturday, June 21, Trump wrote that Starmer had “failed badly” on two issues, immigration and energy, demanding the UK “open North Sea oil.”
North Sea Ban Under Fire as Energy Bills Surge
The UK government announced on November 26, 2025 that it would grant no new oil and gas exploration licenses. It became the largest economy to take that step. The move drew immediate criticism, and its political cost has grown sharply since.

The ongoing US-Israel conflict with Iran disrupted oil and gas flows across the Middle East and triggered a sharp rise in UK energy prices. Since the outbreak of the conflict, Brent crude surged from around $73 a barrel to nearly $114 — while June gas futures on the Dutch TTF jumped nearly 50%.

Ofgem confirmed a 13% rise in the household energy price cap from July. This lifted the annual dual-fuel bill from £1,641 to £1,862, with gas bills climbing 24% and electricity rising 5%.
Critics have pointed to the North Sea ban as compounding British exposure to that shock. Although analysts from Oxford’s Smith School note that even maximum North Sea extraction would save households only between £16 and £82 per year. This is because any domestic oil is sold at global market prices regardless of origin.
Starmer’s Position Collapses
Trump had previously told reporters that Starmer is “a nice man” but warned he needed to “straighten out immigration” and “start drilling”. Sunday’s post dropped the ambiguity entirely.
Starmer’s political position had weakened significantly following major losses in local elections. Andy Burnham’s decisive win in the Makerfield by-election didn’t help either. There are also around 100 Labour MPs formally requesting his resignation.
UK media reported widely on Sunday that an announcement was expected Monday.
The post Trump Declares Starmer Will Resign, Blames North Sea Oil Ban appeared first on BeInCrypto.
MicroStrategy’s flagship Bitcoin funding vehicle, Strategy’s Stretch (STRC), has traded at a persistent discount to its $100 liquidation preference since late July 2025, prompting renewed scrutiny of its capital-raising design. As STRC’s market price fell to new lows in the lead-up to mid-2026, critics framed the move as evidence that the structure may rely on continuous inflows to meet shareholder expectations.
At the same time, other analysts argue the steep drawdown reflects leverage dynamics rather than a fundamental deterioration in Strategy’s Bitcoin accumulation plan. For institutional stakeholders, the episode matters not only for how STRC functions economically, but also for how such instruments fit within broader oversight and investor-protection frameworks—particularly as leveraged exposures and yield-linked terms raise compliance and risk-management questions.
Key takeaways
- STRC was structured to trade near its $100 par (liquidation preference) via adjustable dividends tied to that benchmark.
- In mid-2026, STRC traded materially below $100, with reports indicating a late-day close below par after a record low intraday print.
- The widening discount has coincided with a slowdown in Strategy’s weekly Bitcoin additions, increasing attention on funding efficiency.
- Critics—including Peter Schiff—reiterated claims that the instrument resembles a “centralized Ponzi,” while analysts counter that leverage wipeouts better explain the move.
- STRC’s dividend mechanics are being debated in terms of how the liquidation preference converts into an effective yield for discounted entry prices.
Why STRC’s discount to $100 is drawing regulatory-style scrutiny
STRC was introduced in July 2025 as a preferred-equity style instrument designed to remain close to its $100 par value, supported by adjustable dividends. The practical objective, as described by market participants around the offering, is to create a predictable redemption/return framework while enabling Strategy to raise capital to purchase additional Bitcoin.
According to the reported trading updates, STRC fell to an intraday record low of $82.53 and closed around $88.59—still below the $100 liquidation preference. While a discount can occur for many reasons in credit-like and preferred structures, sustained divergence from par tends to intensify investor-protection concerns: it can indicate that the market assigns a higher probability of stress scenarios than the instrument’s contractual yield implies.
That dynamic is now fueling accusations that STRC depends on ongoing capital formation to sustain returns—an argument Peter Schiff has repeated, describing STRC as “a classic centralized Ponzi.” Critics’ central compliance-adjacent concern is not the existence of leverage per se, but the possibility that the structure’s economics may become self-reinforcing in a way that disadvantages later entrants if market prices cannot stabilize near par.
Strategy has not, in recent public statements cited in the reporting, directly engaged with the “Ponzi” characterization. Instead, it continues to position STRC as preferred equity supported by its Bitcoin treasury strategy. Nevertheless, the market’s focus has shifted to the contract terms that link dividends to the $100 benchmark and to the implications for investors who adopt leveraged positions.
From an institutional monitoring perspective, this is the kind of dispute that can evolve into formal regulatory or litigation scrutiny: when the price relationship to a stated benchmark deteriorates, supervisors and compliance teams typically ask whether disclosure and risk labeling adequately reflect the instrument’s downside behavior, including margin-call pathways for leveraged holders.
Dividend mechanics and the effective yield debate
Reportedly, STRC uses an adjustable dividend framework with a currently stated 11.5% annualized rate, with proceeds primarily directed toward acquiring Bitcoin. However, the instrument’s market price movement changes how discounted investors interpret return.
Analysts cited in the coverage argue that STRC dividends are calculated relative to the $100 liquidation preference rather than the current market price. Under that interpretation, a discounted entry can produce a higher effective yield than the headline rate. For example, one analyst noted that at $90, the effective yield would be approximately 12.8%, while at $85 it could be around 13.5%, assuming the dividend rate remains anchored to the $100 liquidation preference.
This distinction matters in practice because it highlights a structural tension: a vehicle can offer an attractive contractual yield while still trading far below par due to market-implied stress, forced deleveraging, or holder expectations about future dividend adjustments and redemption outcomes.
Strategy’s next dividend rate announcement has been reported as scheduled for June 30, with the company reportedly retaining alternative funding options such as issuing additional Strategy shares and using cash reserves—elements that, from a governance standpoint, influence whether the instrument is likely to remain within a stable pricing band or whether it will continue to trade at a deep discount.
Slower Bitcoin purchases and funding-efficiency questions
Alongside the price drawdown, reporting indicates that Strategy’s pace of Bitcoin accumulation moderated as STRC traded below par. The company added 1,550 BTC for $101 million in the week ending June 8 and 1,587 BTC for $100 million in the week ending June 15, taking total holdings to 846,842 BTC.
These additions were meaningful, but the weekly dollar amounts were reported to be much smaller than earlier in 2026. For comparison, Strategy was reported to have bought 34,164 BTC for $2.54 billion in a single week during April, and 24,869 BTC for roughly $2.01 billion in May—figures that underscore how the “cash-in-to-BTC” conversion can change when the funding vehicle trades at a discount.
In addition, a small Bitcoin sale was reported earlier in June—32 BTC, worth approximately $2.5 million—described as potentially linked to dividend obligations. While the sale was minimal relative to the size of Strategy’s overall treasury, it reflects a key operational reality for dividend-linked structures: even if the primary plan is to finance purchases via issuance proceeds, cash requirements can still require asset sales when market conditions weaken.
In institutional terms, this is where compliance and risk governance intersect with capital markets execution. A vehicle that depends on continuous issuance can face liquidity and market-impact constraints when its own price dislocates from its stated preference benchmark, potentially affecting obligations to income-seeking or leveraged investors.
Leverage wipeout vs. structural failure
Not all analysts interpret STRC’s decline as a sign of failing fundamentals. Jesse Myers, head of Bitcoin strategy at The Smarter Web Company, argued that the move resembles a leverage wipeout rather than an impairment in Strategy’s broader positioning. In the cited commentary, Myers suggested that STRC holders might assume stable trading near the $99–$100 band and that once the price fell, margin calls and forced selling amplified the downward momentum.
Other market commentators similarly focus on how leveraged investors can create nonlinear liquidation dynamics: a discount that begins as a repricing can become accelerated when position sizing is calibrated to assumptions that do not hold.
Still, the debate remains unresolved for compliance observers because both narratives—leverage-driven volatility and structural dependence—can coexist. The instrument may behave as expected under certain conditions while also exhibiting fragile performance when market participants reduce exposure or when funding terms become less favorable. That uncertainty is precisely what supervisors and institutional risk teams often seek to clarify through documented scenario analysis, stress testing, and disclosures around redemption, dividend adjustment triggers, and investor suitability.
Closing perspective
With STRC continuing to trade below its $100 liquidation preference and with dividend-rate decisions and capital-raising activity tied to that benchmark, the next dividend announcement and any further changes in issuance patterns will likely determine whether the discount stabilizes or deepens. For institutional compliance and legal teams, the episode highlights the importance of monitoring how leveraged investor behavior and contract-linked yield mechanics interact with pricing—especially for instruments positioned as central to a broader Bitcoin treasury strategy.

Technical analyst Jesse Olson says Bitcoin could face a sharp drawdown scenario in 2026 if the US stock market experiences a major, recession-level shock. In a post shared over the weekend, Olson highlighted a downside target near $23,980, framing it as a potential outcome if equities fall by more than 50%—a regime he links to how BTC historically behaves when risk appetite collapses.
The call comes alongside on-chain and market-demand indicators pointing to continued caution among institutional participants. Coinbase Premium Index readings have stayed largely negative so far this year, while US spot Bitcoin ETFs have recorded net outflows since May, according to SoSoValue data.
Key takeaways
- Jesse Olson’s worst-case technical target for Bitcoin centers on $23,980 if equities undergo a collapse of 50%+.
- Negative Coinbase Premium Index readings suggest institutional-style demand has not returned with conviction.
- Since May, US spot Bitcoin ETFs have logged $4.68 billion in net outflows, reflecting weaker ETF buyer activity.
- CryptoQuant-associated analyst Darkfost argues institutions tend to buy only after “confirmation,” not during the early stages of a downturn.
Why Olson’s chart points to $23,980 under a macro crash
Olson’s analysis is based on a two-week BTC/USD chart and his proprietary Market Sniper Pro VWAP indicator. In his post, he references a long-term, volume-weighted support line—an anchored VWAP-style tool commonly used to visualize where an asset’s average traded price may act as support or resistance.
According to Olson’s description, the line appears to be anchored to the 2022 bear-market bottom, allowing it to slope forward over time as a potential long-term zone. On this setup, Olson presents $23,980 as a base-case forecast for Bitcoin during a severe macro sell-off scenario where the US stock market drops by more than 50%.
That framing matters for traders because it treats BTC’s direction not just as a function of crypto-native flows, but as a response to broader liquidity and risk-reduction behavior across markets. When stocks fall abruptly, BTC has often traded like a high-risk asset, and the knock-on effect can include forced selling, hedging, or simply an institution-wide reduction in exposure.
Olson’s warning sits in the same broader macro conversation that has been circulating among traditional-market strategists. For example, GMO co-founder Jeremy Grantham has called the ongoing AI market boom a major speculative bubble, while Michael Burry has compared parts of the current rally to the late stages of Dot-com mania. Economist Gary Shilling has also warned that a US recession is “almost inevitable” by year-end and suggested stocks could be at risk of a 20%–30% decline.
Even if investors don’t match Olson’s exact scenario, his key contribution is identifying a concrete level that traders may watch if correlations between BTC and risk assets intensify. In a fast-moving equity drawdown, technical targets like $23,980 can shift from hypothetical to actionable much quicker than many market participants expect.
Institutional demand signals stay muted: Coinbase premium and ETF flows
A second layer of Olson’s bearish backdrop comes from indicators tied to institutional and professional positioning.
First, the Coinbase Premium Index—tracked by CryptoQuant and shown in a chart referenced in the coverage—measures the price gap between Bitcoin on Coinbase and Binance. A positive premium is generally interpreted as stronger US institutional demand, while a negative reading can imply weaker professional buying or relatively heavier selling on Coinbase.
In 2026 so far, the index has remained largely negative, which—based on how the metric is commonly used—suggests that institutional-style bids have not returned decisively.
Second, spot Bitcoin ETFs in the US have shown continued outflow pressure. According to SoSoValue, funds have recorded $4.68 billion in net outflows since May. While ETF flows don’t map perfectly to spot market “strength” tick-for-tick, consistent outflows typically align with reduced buying pressure from the ETF wrapper—one of the main channels through which many traditional allocators access BTC.
Why the “de-risking” narrative matters for timing
CryptoQuant-associated on-chain analyst Darkfost, cited in an X post from Sunday, offered a blunt explanation for why these signals may persist during downturns. In the referenced post, Darkfost said that institutional investors “don’t act like retail,” emphasizing that they operate with “permanent risk management logic.” The key point from the quote is that these investors are not necessarily looking to buy a potential bottom, but to see “confirmation” and “performance”—conditions that may not appear early in a drawdown.
For market participants, this distinction affects expectations about recovery. Retail-driven rebounds can happen quickly, but professional flows often lag—meaning ETF outflows and negative premium readings can remain in place even if BTC stops falling temporarily. If Olson’s macro crash scenario were to unfold, the combination of technical downside levels and institutional hesitation could reinforce each other: equities weaken, risk appetite fades, and demand signals fail to provide a timely counterweight.
That tension is also reflected in earlier commentary referenced in the source material. Analysts such as Galaxy Digital’s Alex Thorn and a pseudonymous trader known as Crypto Kid have previously argued that Bitcoin could decline below $30,000 in a stock-market crash scenario. Olson’s more specific target near $23,980 fits into the same broader thesis: if equities break down sharply, BTC’s drawdown could extend beyond widely watched round-number levels.
What to watch next if equities wobble
If macro stress increases, traders and investors will likely focus on whether BTC breaks down toward Olson’s indicated zone—and whether demand indicators improve before or after any sell-off accelerates. The key question is timing: do institutional metrics like Coinbase premium and spot ETF flows stabilize early, suggesting de-risking is ending, or do they remain weak, implying further downside risk?

TLDR:
- XRP trades at $1.13 after a steep 68% drop from its prior $3.66 cycle peak.
- 24-hour trading volume rose 4.83%, reaching a total of $868.27 million in activity.
- Trader Diana points to $1.10–$1.30 as a key accumulation zone on the weekly chart.
- Cryptollica says this XRP washout has only occurred twice before in 13 years.
XRP changed hands at $1.13, down 1.06% over 24 hours. Trading volume hit $868.27 million, a jump of 4.83%.
The token has now fallen 68% from its cycle high of $3.66. That high was set during a previous rally phase. The pullback has reset trader expectations across social media.
XRP Price Holds Support Zone After Steep Correction
The $1.10 to $1.30 range has become a focal point for traders. Crypto commentator Diana, who posts as @InvestWithD on X, said this zone represents an accumulation area. She argued the broader weekly chart structure still points upward despite the drop.
Diana outlined several upside levels in her post. She cited $2.00 to $2.50 as first resistance, and $3.66 as a retest of the previous cycle high. In addition, she highlighted the $5.00 to $6.00 price zone as a possible range for price discovery.
She also flagged $8.17 as a Fibonacci extension target. A further level near $17.15 appeared in her post as a long-term channel projection. Diana described $0.40 to $0.60 as a deeper macro support zone if the current range fails.
Separately, an account posting as @Cryptollica framed the current setup differently. The post claimed XRP has only seen this level of washout three times in 13 years. It suggested past instances of heavy pessimism preceded later rallies.
Trading Activity Reflects Mixed Sentiment Among Holders
Circulating supply for XRP sits at 62.05 billion tokens, against a max supply of 100 billion. Total supply stands at 99.98 billion. The token’s fully diluted valuation reached $113.44 billion based on current pricing.
Holder count data places active addresses at 536,410. That figure offers a snapshot of distribution across the network. Volume relative to market value sat at 1.23% over the past day.
Neither Diana nor Cryptollica cited specific on-chain metrics to support their projections. Their posts relied on chart pattern interpretation rather than fundamental data. Social sentiment around XRP has fluctuated through the corrective phase.
Price action over coming sessions may test whether the $1.10 floor holds. Traders following the accumulation thesis are watching that range closely. Others remain cautious given the scale of the recent pullback.

Global hedge fund leverage sits near multi-year highs. JPMorgan estimates that quarter-end rebalancing could trigger a $165 billion stock selloff before June ends, raising the risk of sharp moves in crowded technology trades.
The warnings come from Goldman Sachs and JPMorgan, two of the biggest forces in equity markets. Both point to the same risk, that leveraged and concentrated positions could amplify any pullback once mechanical selling begins.
Leverage Builds Inside a Crowded AI Trade
Goldman Sachs prime brokerage data has tracked leverage rising for over a year. Gross hedge fund leverage reached about 294% in June 2025, a five-year high, Reuters reported.
A note from Goldman trader Lee Coppersmith, circulated this month, said net leverage has since pushed to four-year highs.
JPMorgan strategist Nikolaos Panigirtzoglou sharpened the concern. He warned that stretched positioning in semiconductors is raising the risk of more frequent selloffs.
These value-at-risk shocks strike when volatility breaches funds’ internal limits and forces selling.
His team calculates that semiconductors’ share of global equity value is now more than six times their share of revenue. That is over double the comparable figure for the Magnificent Seven.
The concentration leaves the rally in AI stocks exposed if sentiment turns.
Why the $165 Billion Stock Selloff Matters
The near-term trigger is mechanical. JPMorgan estimates that quarter-end rebalancing could drive up to $165 billion in equity sales as June closes. Big investors are trimming stocks after a strong run.
Japan’s $1.9 trillion Government Pension Investment Fund is the single largest seller at about $60 billion.
US pension funds account for another $55 billion. Norway’s and Switzerland’s funds add tens of billions more, while balanced mutual funds offset roughly $15 billion of buying.
The selling meets a market already on edge. Under new Chair Kevin Warsh, the Federal Reserve held rates this month and signaled a possible hike this year.
That hawkish Federal Reserve stance has repriced rate-cut bets and lifted volatility.
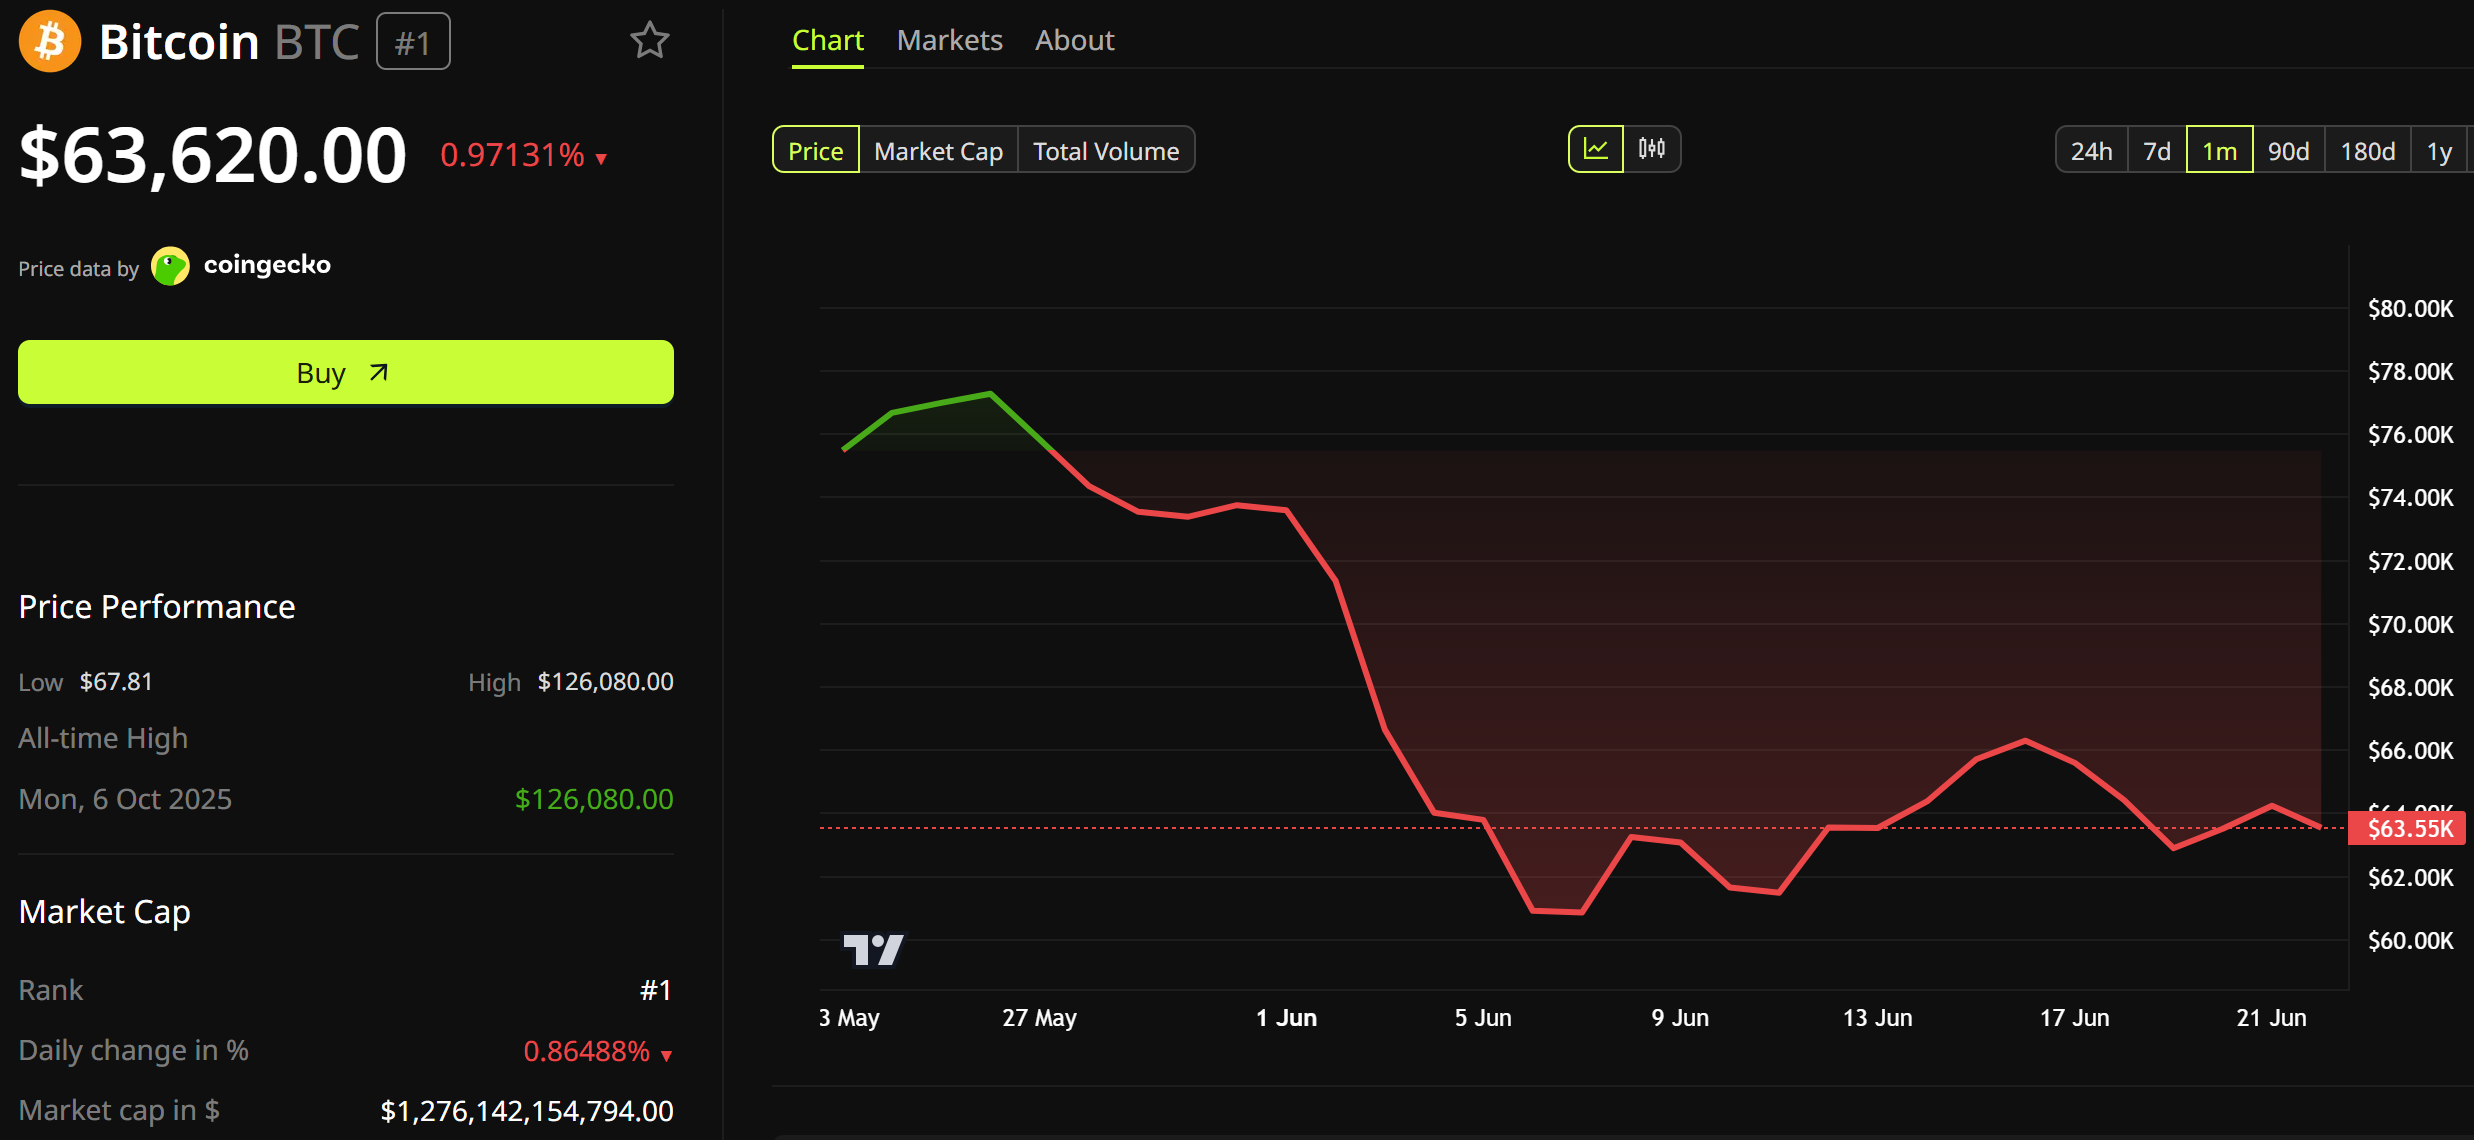
What it Means for Bitcoin
The fragility reaches into Bitcoin (BTC). JPMorgan flagged that the network’s hash rate has grown more sensitive to price.
That signals more miners are operating near breakeven, an added pocket of fragility for crypto.
Bitcoin traded near $63,620, with a market value of about $1.28 trillion. It has slid toward the low $60,000s in recent weeks.

The token now trades more like a tech stock than a safe haven. It weakened as FOMC and AI earnings rattled markets.
If forced equity selling collides with high leverage and crowded AI bets, cross-asset volatility could climb into month-end.
The market absorbing the flows or amplifies them may set the tone for stocks and crypto this week.
The post $165 Billion Stock Selloff Looms as Goldman Flags Rising Leverage appeared first on BeInCrypto.
The Proof-of-Stake (PoS) blockchain network, Algorand, has revealed that it is pushing toward becoming quantum-resistant by the end of 2027. The announcement comes as concerns about the post-quantum threat rise in the crypto space.
According to a blog post by the network’s team, the quantum threat has been deemed a serious risk to the security of blockchain technology. Hence, Algorand has outlined a roadmap detailing its efforts, plans, progress, milestones, and ongoing research in the area of post-quantum cryptography (PQC).
Algorand Pushes for Quantum Resistance
Google Quantum AI recently identified Algorand among a set of smart-contract platforms that can achieve PQC. The blockchain already executed its first PQC-secured transaction in 2025 and intends to complete the full PQC transition in less than two years.
“Post-quantum migration is a balancing act. Moving too slowly leaves systems exposed to future quantum attacks, but moving too quickly can mean relying on algorithms and implementations that have not yet been sufficiently battle-tested,” Algorand’s team explained.
The first step in the roadmap is introducing support for native post-quantum accounts in the protocol release scheduled for the third quarter of 2026. Previously enabled Falcon accounts via the Algorand Virtual Machine (AVM) currently demonstrate the viability of post-quantum signatures on the Algorand protocol, but these are not natively supported by the ledger. The introduction of native post-quantum account support will give room for network-level support for multiple concurrent signature schemes.
After the Algorand team establishes a clear direction for standardizing a new derivation scheme for lattice-based post-quantum keys, the network will implement PQC updates to its tools. These include legacy software development kits (SDKs), hardware wallets, and the AlgoKit. Eventually, the network will introduce support for additional signature schemes on traditional Ed25519 accounts.
Exploring Post-Quantum Multisignatures
While implementing these upgrades, Algorand intends to create an environment that enables the integration of future advances with minimal protocol disruption.
“Building on our robust history of native multisig, the arrival of cryptographic agility and native post-quantum accounts enables us to deploy native multisig support for multi-cryptography schemes by the end of 2026. We view this as an essential advancement for institutional operations, treasury management, and high-stakes financial applications,” the team explained.
One of the final steps in the roadmap explores post-quantum multisignatures as a generic policy layer over independently verifiable signatures. This will allow for weighted approvals, hybrid combinations of classical and post-quantum signers, and future PQC signature algorithms as standards develop. This step will ensure protection against both classical and quantum-era threats.
Meanwhile, Algorand is not the only blockchain network pushing for quantum resistance in the coming years; Ethereum and Ripple are working towards the milestone as well.
The post Algorand Reveals Plans to Become Quantum Resistant by 2027 appeared first on CryptoPotato.
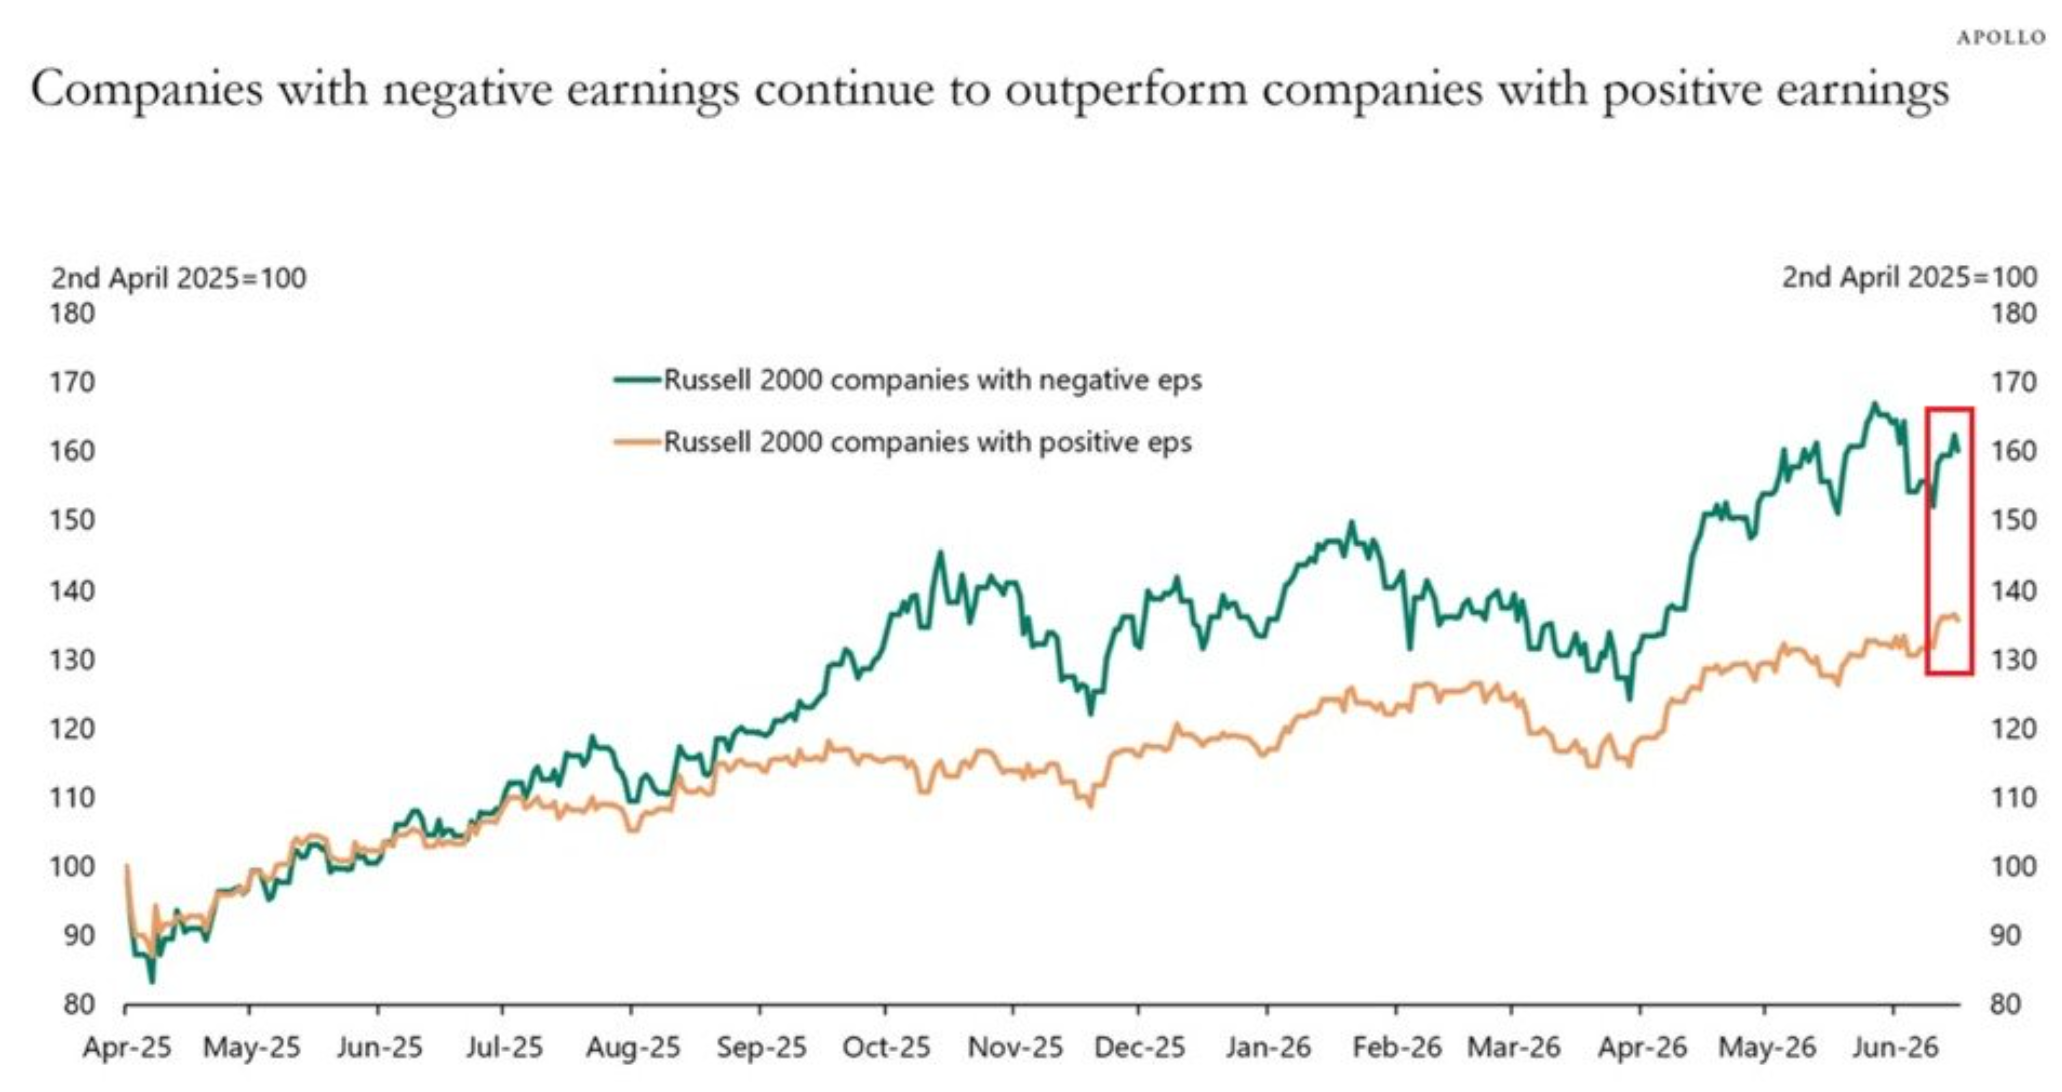
Unprofitable Russell 2000 stocks have climbed about 60% since April 2025, far outpacing the 38% gain for profitable small-cap firms, according to Apollo Global Management.
The divergence has widened through mid-2026, prompting Apollo chief economist Torsten Slok to warn that the market has stopped pricing risk the way it once did.
Unprofitable Russell 2000 Stocks Lead the Rally
The split is stark. Of the index’s roughly 2,000 members, 806 carried negative trailing earnings late last year. Another 1,120 were profitable, Apollo data showed.
That 40% share is not new. Slok first flagged it in November 2023, warning the loss-making firms would be vulnerable to high rates and slowing growth.
Now those same names lead the market. The reversal is the puzzle Slok keeps returning to.
The rally itself traces to early April 2025. Stocks bottomed after the Liberation Day tariff shock. The Russell 2000 has since gained nearly 44% off that low, Royce Investment Partners said.
Micro-caps did even better, up about 66%. Traders watched the rebound through the Russell 2000 breakout signal that pointed to rising risk appetite.
Small caps have since pushed to fresh record highs across the index.

AI Bets Are Fueling the Speculative Bid
Most of the loss-makers are tech firms, Slok told Fortune. Many sit in software, semiconductors, and biotech, sectors riding the AI stocks driving gains across the broader market.
Semiconductor makers led the micro-cap leg of the advance, Royce noted.
Investors are paying up for the promise of future growth rather than current profit. That reach has fed growing AI bubble fears among strategists eyeing stretched valuations.
“Something is broken in price discovery when companies with negative earnings keep outperforming companies with positive earnings.” Slok wrote in a June 20 note.
Not everyone reads it as froth. Morgan Stanley’s Lisa Shalett notes that small-cap firms carry a cost of capital above their return on assets.
Royce’s Francis Gannon counters that many small caps are genuine suppliers to the AI buildout. He also expects stronger small-cap earnings growth in 2026.
The gap keeps widening, with cheap money and AI enthusiasm holding it open.
Slok has returned to the divergence since October, and it has yet to close. Profitable names closing the distance may hinge on interest rates and how long the AI trade lasts.
The post Unprofitable Russell 2000 Stocks Surge 60%, Outpacing Firms That Actually Earn Money appeared first on BeInCrypto.
TLDR:
- HYPE ETFs drew $31.4M inflows equal to 0.208% of market cap, leading relative ETF demand.
- HYPE outpaced SOL on relative inflow rate while BTC and ETH recorded net ETF outflows in period.
- Smaller market cap magnified HYPE ETF impact compared with BTC and ETH capital flows data view.
- ETF flow divergence highlights uneven capital rotation across major crypto assets weekly shift.
HYPE ETFs recorded stronger relative inflows than Bitcoin and Ethereum over the past week, according to reported market data. The token attracted $31.4 million in net ETF inflows, equal to 0.208% of its market capitalization.
Bitcoin and Ethereum both registered negative readings over the same period, while Solana posted weaker positive inflows.
The divergence has placed HYPE ETF activity under closer attention as capital flows shift unevenly across major crypto assets.
HYPE ETF vs BTC & ETH Inflows Show Market Cap Divergence
Data from Hyperliquid Hub and Henry Vo TTT showed HYPE ETF inflows reached $31.4 million over seven days. The figure represented 0.208% of total market capitalization, positioning HYPE ahead on a relative inflow basis.
Solana recorded 0.016% inflows, significantly below HYPE’s absorption rate across the same reporting window. The gap highlighted uneven ETF demand intensity across mid-cap and large-cap crypto assets.
Bitcoin posted a negative 0.011% reading during the same period, based on reported ETF flow data. Ethereum followed with a negative 0.007% figure, signaling net outflows across its ETF exposure.
Both assets faced weaker capital participation compared to smaller-cap tokens in the same cycle. This divergence pointed to shifting allocation behavior across crypto-linked investment products.
Relative comparisons showed how ETF flows scale differently across market capitalizations.
Smaller assets like HYPE reflect sharper percentage movements even with lower absolute inflows.
Larger assets require significantly higher capital to shift their ETF flow percentages meaningfully. The structure of ETF exposure continues to amplify differences between major crypto assets.
HYPE Market Cap Impact and ETF Flow Pressure Across Crypto
HYPE’s smaller market capitalization amplified the effect of ETF inflows on circulating supply dynamics. A $31.4 million inflow represented a larger proportional absorption compared with BTC and ETH flows.
This structural difference explains why relative inflow metrics often favor mid-cap crypto assets.
ETF demand therefore appears more visible in tokens with lower overall market value.
Market participants have tracked whether the inflow trend continues beyond a single weekly cycle. Sustained ETF demand typically signals more consistent capital allocation across crypto investment products.
Short-term spikes remain common, but continuity determines long-term market interpretation.
The latest figures place renewed focus on comparative ETF activity across major tokens.
Future reporting periods will determine whether HYPE maintains its inflow advantage over larger assets. Bitcoin and Ethereum flows will also remain key benchmarks for market-wide ETF sentiment.
Solana’s relative positioning adds another layer to ongoing capital rotation patterns. ETF flow divergence continues to shape how traders interpret crypto market strength.

LUNC price forecast is getting more interesting amid stability in terms of technology and a number of developments within the ecosystem. Short-term dynamics are highly volatile, but market participants keep an eye on the possibility for upgrades and protocol launches to help form a rebound pattern.
Judging from the comments of the analyst terra_army on social media, LUNC is possibly reaching an important stage of its market cycle. The analysis of the weekly chart reveals a period of consolidation accompanied by a decrease in volatility and development of the price base.
Starting from 2022, the majority of the price moves of Terra Classic have occurred in a defined range without any breakdown during bearish trends. Support kept forming in the $0.00006-$0.00007 area, allowing for a long-term accumulation setup.
Technical Indicators Indicate Positive Change
There are a number of technical indicators that have started showing signs of improving conditions in higher time frames. Short-term moving averages have started to flatten out after a long period of decline, whereas momentum oscillators have moved from extremely bearish levels.
Furthermore, the Bollinger Bands, which had been quite tight for a longer duration, have started to widen. This usually indicates a return of volatility following a period of consolidation. It is being watched to see whether there will be any sign of strong directional movement. The overall technical picture remains positive despite a recent downtrend, and traders have their eyes set on a possible breakout in the coming days.
Short-Term Selling Pressure Is An Obstacle
Despite the positive long-term scenario, there was some short-term selling pressure seen in LUNC. The price was seen at $0.00006803 following a daily decline of over five percent. Market capitalization also decreased amid the session due to traders’ cautiousness.
From intraday charts, it could be observed that the asset formed a lower highs and lower lows formation. A couple of bounces were witnessed within the day as well; however, they all met selling pressure.
The drop was fueled further when support at $0.0000690 broke down, causing the asset to move towards $0.0000670 before it found a floor. Even though a slight bounce was seen, resistance zones still keep the upward momentum limited. There was also a decrease in trading activity, with daily volume declining over 20%.
Community Ecosystem Development Continues To Fuel Optimism
In addition to technical developments, developments in the ecosystem of Terra Classic continue to drive optimism among the members of the community. Among the highly anticipated events is the impending mainnet launch of the Juris Protocol, which could act as a catalyst for boosting network activity.
More efforts are being directed towards infrastructure improvements, including upgrades to the station platform in order to improve accessibility and user experience.
The Market Module 2 has also garnered a lot of attention in the community. It aims to link the various Terra Classic projects under one ecosystem while providing USTC staking abilities to the network.
On the other hand, the burning program of Binance is continuing to reduce the amount of supply in circulation. Investors have also cited increasing visibility from HTX and the likelihood of more exchanges joining in future burn programs.
The above developments by Terra Classic will see investors keep their eye on whether the growth of the ecosystem, supply reduction programs, and improved technical conditions can enhance the prospects of LUNC in the future.


Anthropic has reportedly finished training a more capable Mythos successor, according to AI watcher Andrew Curran. The company has not confirmed the model’s existence, name, or capabilities.
Curran said the system could ship as Mythos 5.1 or Mythos 6, or stay internal. His report came nine days after US export controls forced Anthropic to suspend Mythos 5 and Fable 5.
Mythos Successor Emerges from Training
Curran describes the supposed new system as stronger than Mythos 5. However, he stressed uncertainty over its name and whether Anthropic would release it at all.
“A new, more capable version of Mythos has emerged from training. I don’t know whether it will be called Mythos 5.1 or Mythos 6, or if Anthropic will keep it internal to accelerate further development…” Curran wrote.
Anthropic released Mythos 5 and Fable 5 on June 9 and lost them to the directive three days later. Several still expect an iterative upgrade, partly because the model suspension order limits today’s lineup.
Fable 5 ships with heavy safeguards for public use. Mythos 5 runs with fewer security restrictions through Project Glasswing, the firm’s vetted cybersecurity program.
Anthropic says about 50 partners have used early Mythos models to find more than 10,000 high- or critical-severity software flaws.
Why the Suspension Does Not Stop Development
Commerce Secretary Howard Lutnick sent the directive to Anthropic chief Dario Amodei on June 12, citing national security.
It barred every foreign national, including Anthropic’s own foreign-born staff, so the firm disabled both models worldwide.
The government flagged a method for bypassing Fable 5’s safeguards. Anthropic reviewed the demonstration, called it narrow, and warned the same standard would halt new model launches industrywide.
It is still working to reverse the export controls.
Subscribe to our YouTube channel to watch leaders and journalists provide expert insights
The order followed a reported Amazon warning to officials. Amazon has committed up to $25 billion to Anthropic.
Even so, it reportedly told the administration its researchers used Fable 5 to surface attack-ready information.
The clash later drew comments from Donald Trump and a public defense from Amodei.
Curran argued that halting deployment does little to slow progress and may even speed it up by freeing resources.
He pointed to open-weights rivals such as Z.ai’s GLM-5.2, which matches far larger closed models on coding tasks at a fraction of the cost.
The successor’s path stays uncertain. Anthropic shipping it publicly, restricting it to Glasswing, or keeping it internal could reshape the AI race.
The company continues to seek restored access for both suspended models and has not addressed latest developments publicly.
The post Anthropic Reportedly Finishes Training Successor to Suspended Mythos 5 Model appeared first on BeInCrypto.

Harmanpreet Kaur Throws Fielders Under The Bus As Team India Stare At Shocking Women’s T20 World Cup Exit

Someone Forked systemd Over Its New Birth Date Field
Wowcher apologises for ‘unacceptable’ email mocking boy’s crocodile attack at zoo


-
 Crypto World7 days ago
Crude Oil Plunges Over 4% as US-Iran Agreement Reopens Hormuz Strait
-

 Fashion2 days ago
Weekend Open Thread: Miami – Corporette.com
-
 Tech5 days ago
The Adder At The Heart Of Intel’s 8087 FPU
-
 Business2 days ago
Wall Street Week Ahead: Investors see Micron earnings as pulse check of AI rally momentum
-

 Crypto World2 days ago
HIVE shares jump as $220M AI deal speeds Bitcoin mining pivot
-

 Sports3 days ago
FIFA World Cup 2026: Canada beat 9-men Qatar 6-0 to register first ever win | FIFA World Cup 2026
-

 Business3 days ago
Brexit cost 6% of UK economy, Bank of England company data suggests
-

 Business1 day ago
MHP SE 2026 Q1 – Results – Earnings Call Presentation (OTCMKTS:MHPSY) 2026-06-20
-

 Crypto World2 days ago
Jake Chervinsky accuses CME of protecting derivatives monopoly
-

 Business1 day ago
Soccer-U.S. defends Iran World Cup travel restrictions, says discussions ongoing
-

 Crypto World4 days ago
Anthropic’s Dario Amodei Urged AI Unity at G7, Even as US Banned His Models
-

 Tech4 days ago
Weeks Of In-The-Field Testing And A Verdict
-

 Tech4 days ago
Adobe adds its AI assistant to Premiere, Illustrator and InDesign
-

 Entertainment1 day ago
Renter of Home in Anne Heche Crash Denies Settlement With Son
-

 Politics2 days ago
Andy Burnham and the meaning of Makerfield
-
 Crypto World2 days ago
Can Charles Hoskinson Really Rescue Cardano?
-
 Crypto World3 days ago
Iren (IREN) Stock Surges on Jefferies Buy Rating: AI Infrastructure Play Gains Momentum
-

 Politics3 days ago
BBC Reporter Discusses Cross Party Criticism Of Trumps Iran Deal
-

 Tech3 days ago
Instagram Now Lets You Add A Unique Caption To Each Carousel Slide
-

 News Videos3 days ago
IMPACT ON BITCOIN IF NO GOLD IS FOUND IN FORT KNOX
You must be logged in to post a comment Login