
Crypto World
Will Shiba Inu price drop as whale transfers 370B SHIB to exchange?

Shiba Inu is back in focus after on-chain data showed a large holder moving hundreds of billions of tokens to a centralized exchange, raising fresh concerns about potential sell pressure.
Summary
- On-chain data from Arkham shows a whale transferred roughly 370 billion SHIB to Binance and Bitget deposit addresses, raising concerns about potential sell pressure.
- SHIB is trading near $0.00000601, holding short-term support at $0.00000580–$0.00000590, with resistance at $0.00000640 and $0.00000700.
- Indicators remain cautious: the Awesome Oscillator is still negative but weakening, while the MFI around 44 signals limited buying momentum.
According to data from Arkham Intelligence, a whale address deposited roughly 370 billion SHIB to exchange wallets in a series of transactions over the past 24 hours. The transfers, routed to both Binance and Bitget deposit addresses, totaled several million dollars in value.
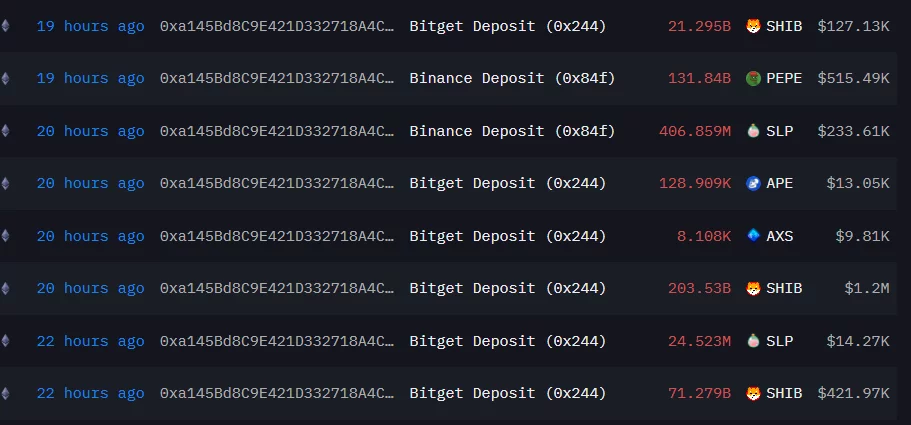
Large exchange inflows are often interpreted as a sign that a holder may be preparing to sell, as tokens moved off self-custody and onto trading platforms increase immediate circulating supply.
While it is not yet confirmed whether the whale intends to liquidate, the timing comes as SHIB continues to trade in a broader downtrend, adding weight to bearish sentiment.
Shiba Inu price action and key levels
On the daily chart, SHIB is currently trading near $0.00000601, consolidating after a prolonged slide from January highs near the $0.00000900 region.
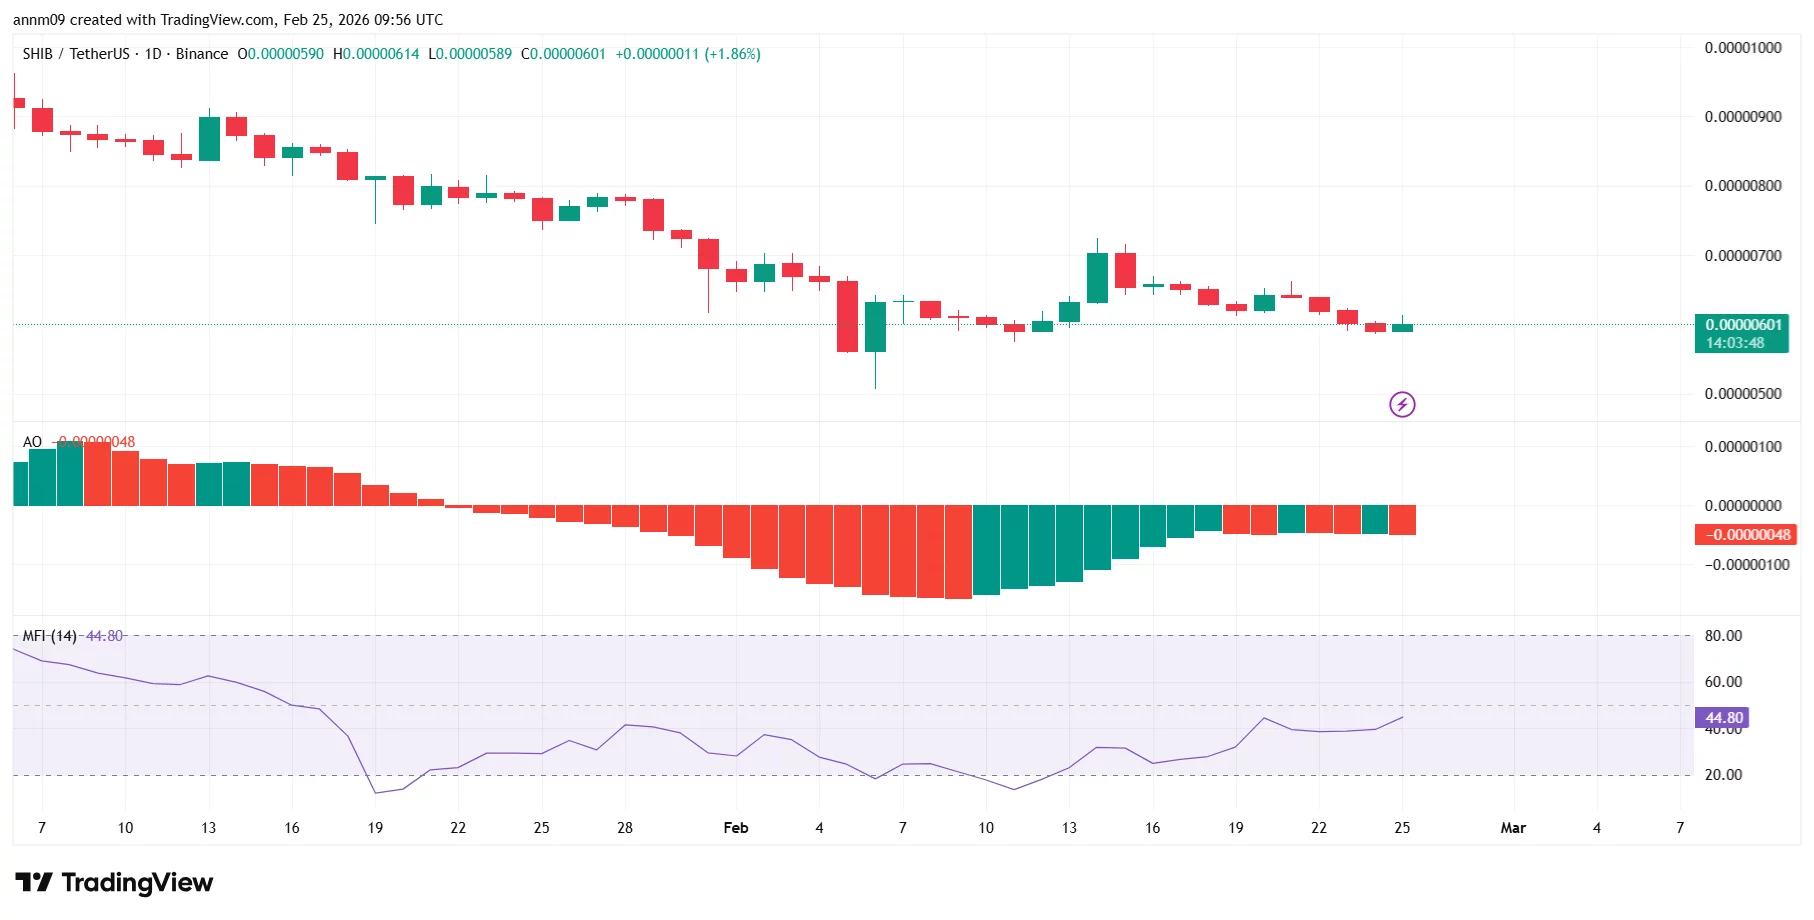
Price recently bounced from the $0.00000580–$0.00000590 support zone, which has acted as a short-term floor. A decisive breakdown below this region could expose the next psychological support around $0.00000550, followed by deeper support near $0.00000500.
On the upside, immediate resistance sits near $0.00000640, where recent daily highs were rejected. Above that, stronger resistance is clustered around $0.00000700, a level that capped the mid-February rebound.
Bulls would need a sustained move above $0.00000700 to shift short-term structure back in their favor.
Momentum indicators show tentative stabilization but no strong bullish reversal yet. The Awesome Oscillator (AO) remains slightly negative, though red histogram bars are shrinking, suggesting bearish momentum is weakening but not fully reversed.
The Money Flow Index (MFI 14) sits around 44, below the neutral 50 mark, indicating modest capital outflows and a lack of strong buying pressure.
Together, the indicators point to consolidation rather than immediate breakdown but they also fail to confirm a bullish shift.
If the 370B SHIB deposit translates into aggressive selling, pressure on the $0.00000580 support zone could intensify. A breakdown would likely accelerate downside momentum. However, if support holds and exchange inflows do not materialize into sustained sell volume, SHIB could remain range-bound between $0.00000580 and $0.00000640 in the near term.
For now, whale activity adds uncertainty but the chart suggests bears still hold the broader structural advantage unless key resistance levels are reclaimed.

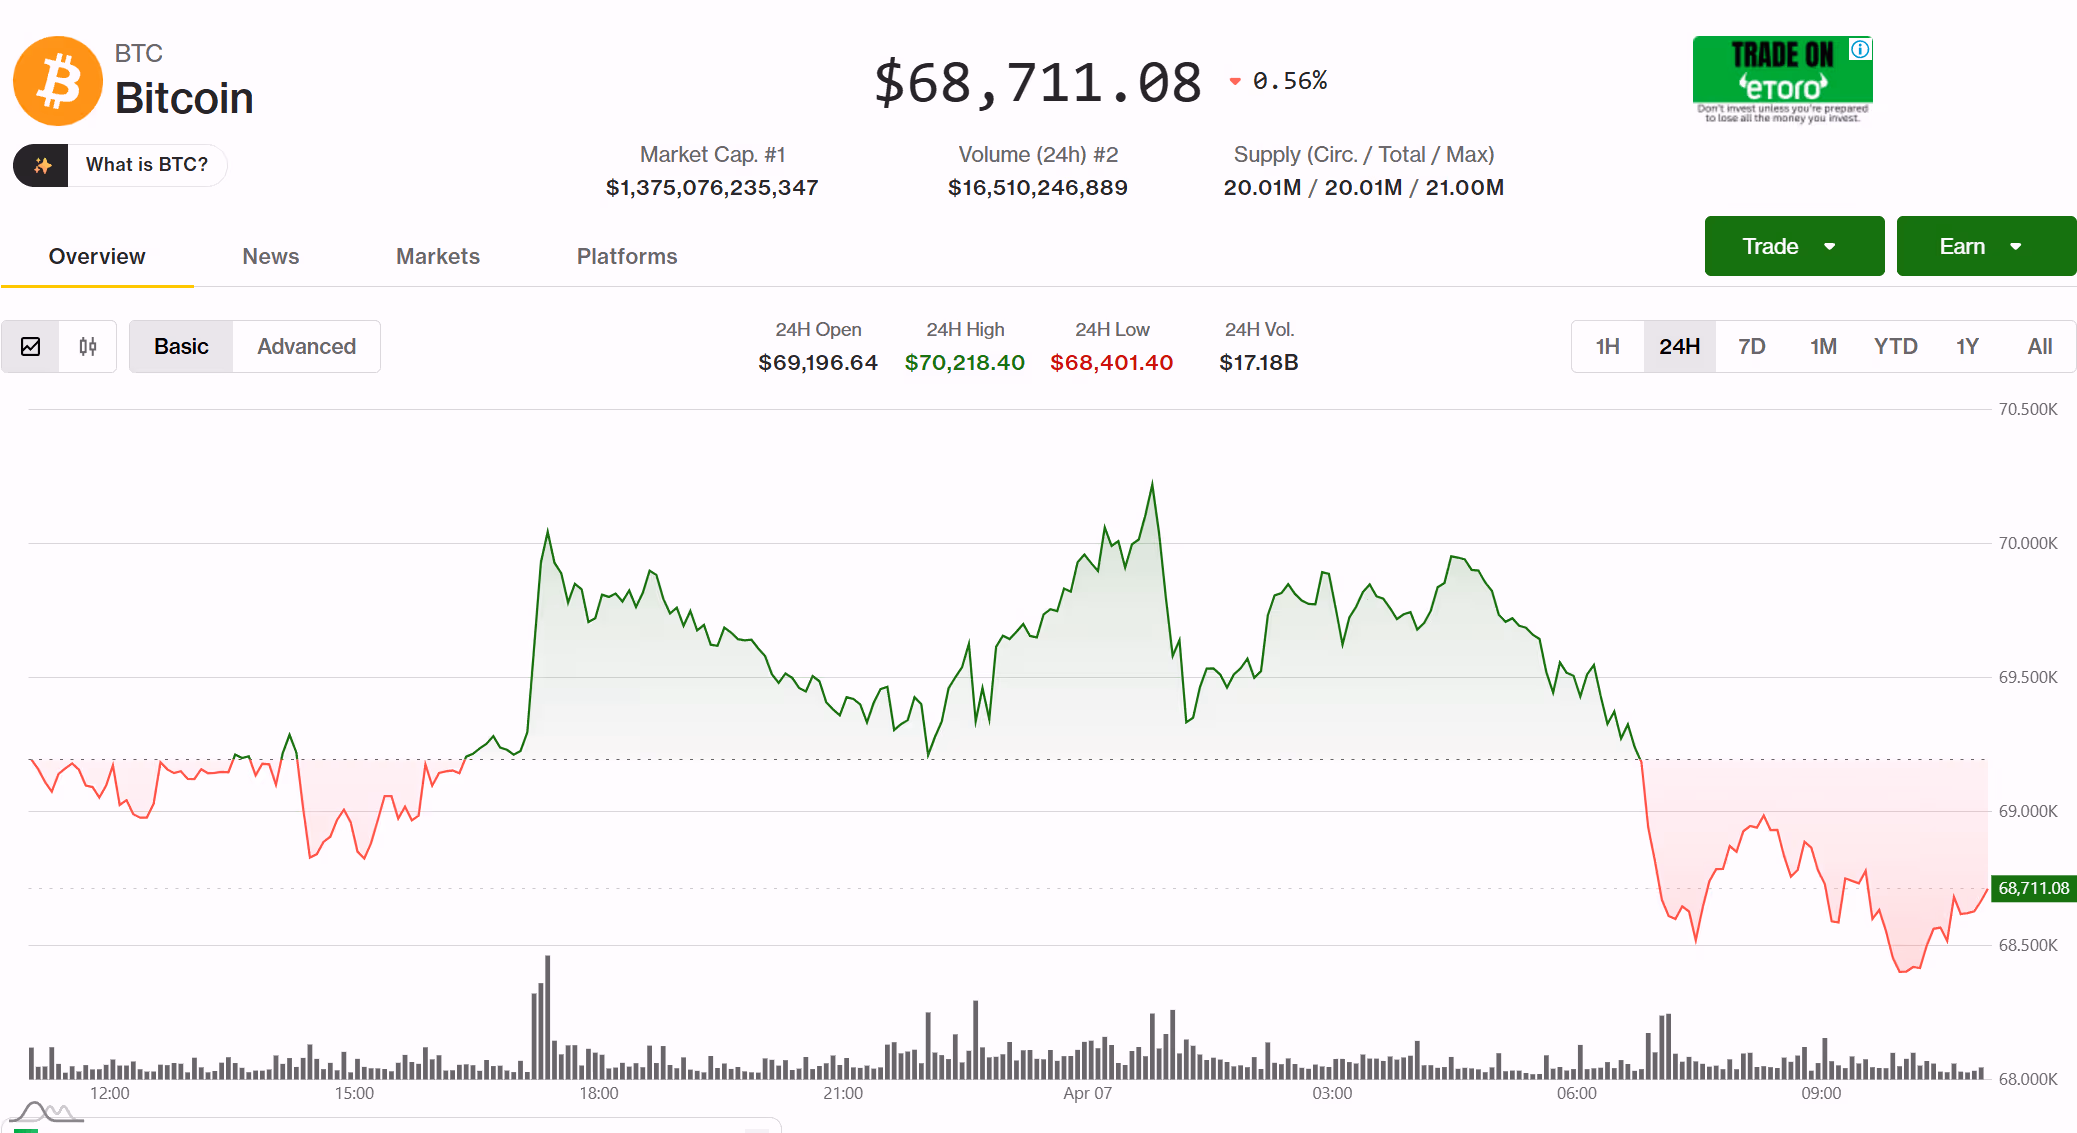
Bitcoin slid toward $68,000 on Tuesday, with traditional markets closed in Hong Kong for a long weekend, as repeated failures near $70,000 left the bitcoin market vulnerable to a break lower.
The drop came after another failed push above $70,000, with prices slipping quickly once they approached the lower end of the $65,000 to $73,000 range that has defined trading since late March. Intraday losses accelerated near that boundary, highlighting how little support exists when momentum turns.

That calm is not being driven by strong demand. Recent Glassnode data shows softer trading volumes and subdued onchain activity even as prices recover, indicating limited participation behind the move.
Meanwhile, in a note to CoinDesk, crypto-native trading and liquidity firm Caladan pointed to negative demand trends and ongoing distribution by large holders, leaving bitcoin reliant on macro-driven flows and derivatives positioning rather than broad-based accumulation.
The result is a market that looks stable on the surface but is structurally fragile if that balance shifts.
That vulnerability is becoming more visible in derivatives markets. Options data shows traders are increasingly paying up for downside protection, with implied volatility holding above realized levels, a sign that investors are bracing for a larger move even as spot prices remain rangebound.
Analysts who spoke to CoinDesk earlier point to a negative gamma setup below roughly $68,000, where market makers may be forced to sell bitcoin as prices fall in order to hedge their exposure.
The danger: this dynamic can accelerate declines, transforming a gradual move into a sharper, self-reinforcing rout that could drag prices toward the $60,000 level if support breaks.
Prediction markets reflect a similar shift in sentiment. On Polymarket, traders are assigning a 68% probability that bitcoin will trade at or below $65,000 in April, while higher targets such as $80,000 have seen sharply declining odds.
Taken together, the signals point to a market where the calm may hold, but only until key levels give way.


NASHVILLE, Tenn. — The Securities and Exchange Commission is close to proposing a “regulation crypto” fleshing out its approach to overseeing the crypto industry and drawing lines between transactions that might be securities and where they aren’t, the agency’s head said Monday.
SEC Chair Paul Atkins said the commission’s new reg crypto is in front of the White House Office of Information and Regulatory Affairs, meaning it’s one step away from being published. This rulemaking is focused on the Securities Act of 1933 and will address fundraising and startup exemptions, among other issues, he said Monday at an event hosted by Vanderbilt University and the Blockchain Association.
He told CoinDesk after his question-and-answer session that the SEC also intends to put out its long-awaited innovation exemption soon.
“We’d love to have reactions and everything else,” he said. “It’s not a rule as such but obviously we need to know how it’s functioning and if people have problems with it or not.”
One aspect to this exemption, he said, is that it wouldn’t disadvantage incumbents and focus solely on startups.
“We want people really to experiment within [that] framework,” he said.
Midterm watch
At multiple points during his talk, Atkins pointed to Congress’s role, saying that his agency’s rulemaking process was well underway despite whatever Congress may do.
“I think we have enough of a runway now, even notwithstanding what may happen in the midterms — although I really still want a friendly Congress obviously — they can throw tacks on the road in front of our tires but they’re not going to really slow us down.”
Atkins also said the audience needed “to be engaged in this upcoming election,” pointing to Senator Bernie Moreno as an example.
“To have Congress really veer off track is not going to any of us any good, and it’s going to put a lot more questions into the future because people then just have ‘oh gosh, maybe this is again a passing phase,’” he said. “We’ve got to make sure that your friends are in Congress. I think you saw how that really paid benefits in the last election.”
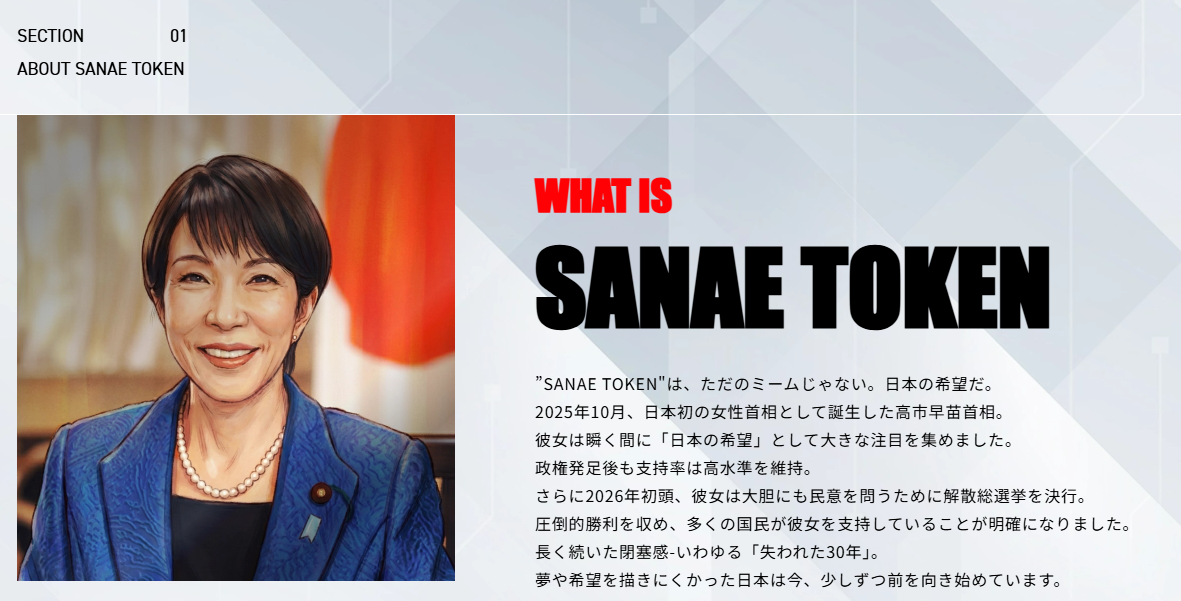
Japan’s SANAE TOKEN saga has entered a new phase, with fresh media reports alleging the prime minister’s office knew more than it admitted. But for crypto markets, the bigger story is what happens next in Tokyo’s legislature.
The political noise and the regulatory signal are arriving at exactly the same time.
How the Token Unraveled
SANAE TOKEN launched on Solana on Feb. 25, as BeInCrypto reported. NoBorder DAO — a community led by serial entrepreneur Yuji Mizoguchi — issued it as part of a “Japan is Back” initiative, with Takaichi’s name and likeness on the project website. The token surged over 40x on launch day before Takaichi’s March 2 denial triggered a 58% crash.
The FSA opened a probe into NoBorder DAO for operating without a crypto exchange license. The token’s operators halted issuance shortly after.
Japanese Tabloid Reports Secretary’s Approval
Weekly Bunshun, a Japanese tabloid known for breaking political and celebrity scandals, says developer Ken Matsui told the magazine his team informed Takaichi’s office that the project was a crypto asset. That directly contradicts her March 2 denial. Takaichi said neither she nor her office had been told anything about the token.
The publication says it obtained audio recordings of Takaichi’s chief secretary over a period of more than 20 years, reportedly describing the project favorably. Another Japanese online media reported that Takaichi’s office had not responded to media inquiries on the matter as of Tuesday. Takaichi has held no press conference since February 18, when her second cabinet was inaugurated.
The political dimension remains unresolved. What matters for crypto is whether the scandal accelerates — or complicates — Japan’s regulatory overhaul.
FSA Bill Changes the Rules
Japan’s Financial Services Agency submitted its landmark crypto reform bill to parliament this week, Asahi Shimbun reported. The legislation moves crypto from the Payment Services Act into the Financial Instruments and Exchange Act, reclassifying digital assets as financial instruments for the first time.
As BeInCrypto previously reported, the maximum prison term for unlicensed crypto sales would triple to 10 years, with fines rising from ¥3 million to ¥10 million. The SESC gains criminal investigation powers it has never held over crypto operators. The SANAE TOKEN case was explicitly cited in Nikkei’s reporting on the legislative push.
The bill would also void transactions with unregistered operators by default, making it easier for investors to seek refunds — a provision directly relevant to the SANAE TOKEN case.
The post Did Japan’s PM Actually Back the Memecoin Bearing Her Name? appeared first on BeInCrypto.

South Korea’s financial regulator has ordered all crypto exchanges to verify user asset balances every five minutes, following a massive overpayment incident that shook market confidence earlier this year.
One botched reward payout exposed systemic cracks across the entire industry.
What Triggered the Rules
In February, Bithumb accidentally sent 2,000 BTC per person instead of 2,000 Korean won ($1.40) during a promotional event. The error amounted to roughly $42 billion in misallocated crypto. The Financial Services Commission (FSC) launched emergency inspections across all five major Korean exchanges immediately after. What they found went far beyond a single human mistake.
Most exchanges were only reconciling their books once every 24 hours. Three had no automatic kill switch to halt trading when discrepancies appeared. Four lacked multi-step approval systems for high-risk manual transactions. Two exchanges hadn’t even separated their general accounts from high-risk transaction accounts — a basic safeguard.
What Exchanges Must Now Do
The FSC announced a three-pillar reform package on April 6. Exchanges must run automated balance checks every five minutes, with alerts and automatic trading halts triggered by major mismatches. Monthly external audits replace the previous quarterly schedule, and public disclosures must now include asset-by-asset blockchain holdings rather than a simple coverage ratio.
For manual, high-risk transactions such as event payouts, exchanges must use separate accounts, deploy validity-check systems that automatically reject mismatched inputs, and require cross-verification by a third party before execution.
The FSC will also require exchanges to appoint dedicated risk management officers and establish risk management committees — standards already expected of traditional financial firms. Compliance checks move from annual to twice-yearly, with results reported to regulators.
DAXA, the industry body, will complete self-regulatory amendments this month, with systems built out by May. Key provisions will feed into Korea’s forthcoming second-phase Digital Asset Act.
The post Every 5 Minutes: Korea’s New Rule for Crypto Exchanges appeared first on BeInCrypto.
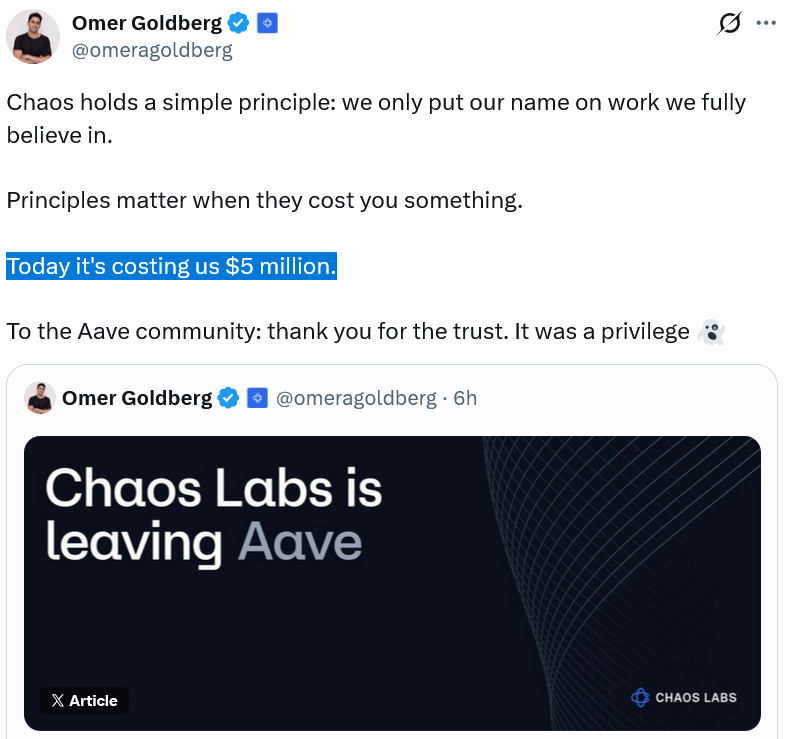
Chaos Labs has parted ways with the Aave ecosystem after serving as the crypto lending protocol’s main risk service provider for three years, citing a budget dispute and disagreements over how Aave should manage risk.
“This decision was not made in haste,” Chaos Labs founder Omer Goldberg said in a post to X on Monday. “We worked in good faith with DAO contributors. Aave Labs was professional and supported increasing our budget to $5m to retain us. However, we are leaving because the engagement no longer reflects how we believe risk should be managed.”

Aave Labs CEO Stani Kulechov said that Chaos didn’t depart on bad terms, but claimed that Chaos pitched a proposal seeking to become the sole risk provider and thus force out other partners — a compromise Aave wasn’t willing to accept.
Chaos played a key role in Aave’s back-end infrastructure, from pricing loans and managing risk in the Aave V2 and V3 markets since November 2022, during which Aave’s total value locked rose fivefold to $26 billion.
Risk has been a major talking point in the Aave community after a user lost $50 million in a trade while interacting with Aave’s interface on March 12. The following week, Aave said it would introduce an “Aave Shield” protection feature to deter users from high-risk trades.
As for Chaos’ departure, Goldberg said there became an increasing misalignment over how the parties thought risk should be managed. He noted that some Aave contributors had left, raising its workload, while also arguing that Aave V4’s expanded functionality introduced additional operational and legal risks that fell on Chaos’ shoulders.
“While Aave Labs is optimistic about a swift migration to V4, history suggests these transitions take months and even years,” Goldberg said. “Until V4 fully absorbs V3’s markets and liquidity, both systems need to be operated and managed simultaneously. The workload during the transition doesn’t halve. It doubles.”
Weighing the risk of a protocol failure, Goldberg said, “There is no regulatory framework, no safe harbor, and no settled law that answers the question of what a risk manager or curator owes when a protocol fails. If things work, the work is invisible. If things break, the blame is not.”
As such, “We are walking away from a $5 million engagement,” Goldberg said.
Chaos wanted Aave to boot LlamaRisk, Chainlink: Kulechov
Aave Labs CEO Stani Kulechov told a slightly different story, stating that Chaos wanted to be the sole risk manager and use its price oracles instead of Chainlink’s.
Following that request would have forced Aave to push out its other risk protocol partner, LlamaRisk, and thus abandon its two-layer economic risk model.
Related: DeFi lender Aave launches on OKX’s Ethereum L2, X Layer
Kulechov added Aave was unwilling to integrate Chaos-built price oracles, citing Aave’s “track record” with Chainlink’s services, which its “users are currently more comfortable with at scale.”
He also said Chaos was already “exploring winding down its risk consultancy services,” and that Aave had offered to double its payment to $5 million to retain them.
Cointelegraph reached out to Chaos Labs for comment.
Kulechov noted that Chaos’ departure hasn’t disrupted the Aave protocol, its smart contracts, token listings or network integrations.
Moving forward, Aave said it “will work closely with LlamaRisk to ensure a smooth transition” and maintain its two-layer economic risk model.

Chaos’ departure comes amid a protocol-wide feud over how much funding and revenue control Aave Labs should receive versus Aave’s decentralized autonomous organization.
Despite the internal issues, Aave crossed the $1 trillion mark in cumulative lending volume in late February, marking a first in the DeFi industry.
Magazine: Animoca teams up with Ava Labs, Shrapnel on Steam: Web3 Gamer
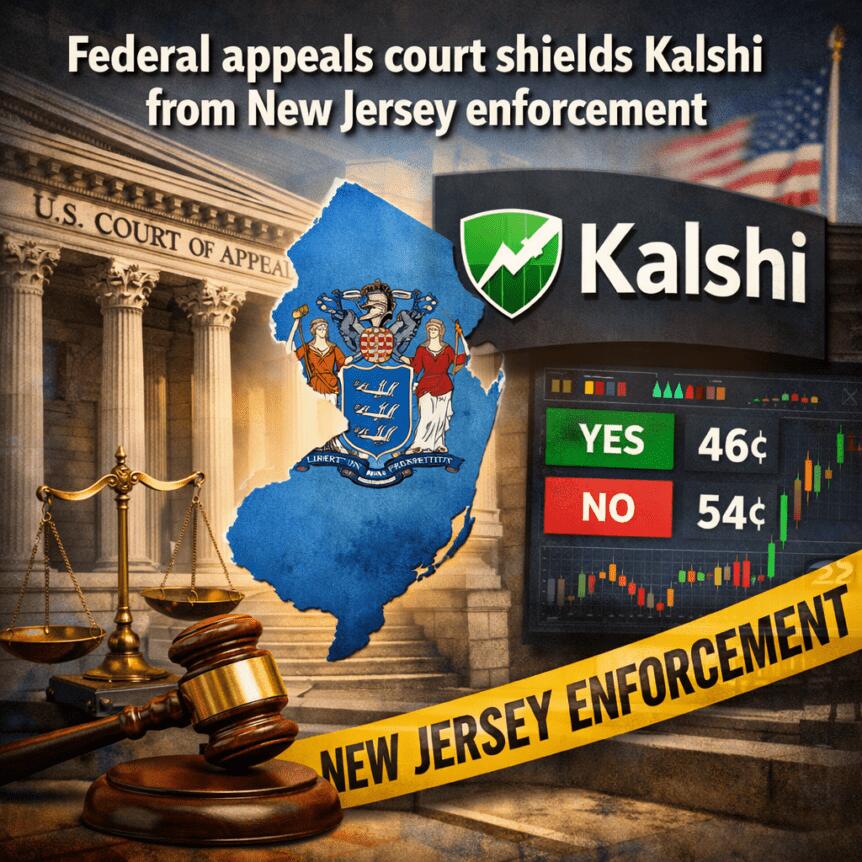
A U.S. Court of Appeals for the Third Circuit handed Kalshi, a prediction‑market platform, a notable victory by ruling 2-1 against New Jersey’s enforcement action over the company’s sports‑event contracts. The decision reinforces Kalshi’s argument that federal commodities law preempts state gambling statutes, potentially setting up a clash that could reach the Supreme Court and redefine how prediction markets are regulated in the United States.
The appellate panel affirmed a lower court finding that Kalshi operates as a designated contract market under the exclusive jurisdiction of the Commodity Futures Trading Commission (CFTC). In practical terms, the court suggested that allowing state authorities to police Kalshi’s products would interfere with federal oversight and create a patchwork regulatory regime that Congress aimed to replace with centralized federal authority.
“Allowing New Jersey to enforce its gambling laws and state constitution would create an obstacle to executing the Act because such state enforcement would prohibit Kalshi, which operates a licensed designated contract market under the exclusive jurisdiction of the CFTC, from offering its sports-related event contracts in New Jersey,” wrote Circuit Judge David J. Porter. “This state regulation is exactly the patchwork that Congress replaced wholecloth by creating the CFTC.”
The ruling arrived amid ongoing friction at the state level around prediction markets and sports betting. Just days earlier, a Nevada judge extended Kalshi’s ban on offering event‑based contracts, underscoring how state actions can diverge from federal strategy. The divergent state rulings have spurred debate about whether the Supreme Court should step in to clarify the authority boundaries between state gaming regulators and federal market overseers, particularly after the high court’s 2018 decision that opened the door for states to legalize and regulate sports betting.
In a dissent attached to the Third Circuit opinion, Circuit Judge Jane Roth warned that the majority’s framework could obscure the central question: whether sports‑event contracts are swaps and thus fall under federal regulation. Roth described Kalshi’s actions as a “performative sleight” aimed at masking the fact that Kalshi’s products function similarly to traditional sports gambling, suggesting the decision could have sweeping implications that deserve closer scrutiny.
Key takeaways
- The Third Circuit ruling in Kalshi’s favor reinforces federal preemption of state gambling laws where prediction-market contracts are concerned, upholding CFTC’s exclusive jurisdiction over such products.
- A timely dissent warns that the decision might oversimplify a complex overlap between swap regulation and sports betting, signaling potential future court battles.
- The decision lands against a backdrop of ongoing state actions, including a Nevada extension of Kalshi’s ban on event‑based contracts, illustrating a fragmented regulatory landscape.
- Following the ruling, the CFTC has continued to push its interpretation of authority, signaling a broader regulatory push that could influence the trajectory of prediction markets nationwide.
- The evolving legal framework may eventually force a clarifying ruling from the Supreme Court, with broad implications for platforms, users, and developers in the prediction‑market ecosystem.
Regulatory momentum and what it means for markets
At the center of the dispute is the CFTC’s stance that its jurisdiction over “swaps” and related contracts extends to sports and other event-based products offered on platforms like Kalshi. CFTC Chair Michael Selig has positioned prediction markets as a core priority since assuming the role, arguing that the agency’s jurisdiction is broad enough to cover event contracts tied to sports, politics, agriculture, and beyond. In recent months, Selig has opened a proposed rulemaking process to public comment and filed an amicus brief in a Ninth Circuit case connected to state gaming authorities, underscoring the agency’s willingness to push a federal approach to regulation.
Public remarks from Selig emphasize a view of regulation that focuses on the nature of contracts rather than the specific topic. “Our definition of commodity and statute is very broad,” he said at a policy summit, noting that the framework encompasses a wide array of event contracts—from sports to elections and commodities like grains. He also highlighted that regulators seek to carve out exceptions for contracts that are readily susceptible to manipulation, signaling a nuanced approach to what qualifies as a permissible prediction market product.
The CFTC’s posture has included legal action aimed at curbing what it sees as unlawful attempts by states to regulate prediction markets. The agency has pursued litigation against several states and authorities that it argues are overstepping or attempting to regulate these markets outside federal boundaries. The combined legal pressure from the CFTC—alongside the Third Circuit ruling in Kalshi’s favor—illustrates a broader strategic push to define a single federal framework for prediction markets in the U.S. economy.
What’s next for Kalshi and the broader ecosystem
Kalshi’s victory in the Third Circuit strengthens the platform as it navigates a challenging regulatory environment. Yet the path forward remains unsettled. State authorities remain active on this issue, and others could join the fray as more cases unfold and regulators refine their positions. The Nevada extension of Kalshi’s ban, in particular, serves as a reminder that state-level actions can persist alongside federal efforts, potentially creating a multi-front regulatory dynamic that platforms must navigate.
For investors, traders, and developers following Kalshi and prediction markets, the key questions revolve around regulatory clarity and market access. If the Supreme Court ultimately weighs in, the decision could set a nationwide precedent on whether federal law preempts state gambling regulations for prediction markets and how such markets should be supervised. In the meantime, market participants should monitor both federal regulatory developments—especially any new rulemakings from the CFTC—and state court outcomes, as these will shape product design, licensing strategies, and user protections across platforms.
Kalshi’s leadership has framed the Third Circuit decision as a major win for the industry and its millions of users. As the legal battle unfolds, the industry will be watching how a potential Supreme Court review could recalibrate the balance between state innovation and federal oversight in the fast-evolving world of prediction markets.
Readers should keep an eye on forthcoming court dockets and regulatory updates, as the next few months could yield important milestones that either reinforce the federal framework or push the conversation toward a broader reexamination of how prediction markets are regulated in the United States.
The crypto news today is turning bullish fast. Polygon now processes $730 billion in yearly stablecoin volume and just locked in Mastercard for on-chain payments, but even that kind of adoption only delivers small gains from a token sitting near its all-time low. TAO gained over 100% in March as money rotated into AI plays.
The name showing up everywhere right now is Pepeto, where a full exchange runs live with a Binance listing on the way, and $8.8 million in presale capital keeps growing. Forecasters point to 100x once trading opens, and the tools are already working for everyone who got in early.
Jack Dorsey’s Block launched BTCday on April 6, a Bitcoin faucet that gives away free BTC to new users as a way to push adoption across its Bitkey and Cash App products according to CoinDesk. Block already holds 8,883 BTC worth $594 million on its balance sheet.
When a company sitting on $594 million in Bitcoin starts giving it away to onboard new users, the bullish signal is impossible to miss. Money is flowing toward crypto projects that actually work, and the ones still at presale pricing are where the biggest gains in every cycle get made.
Top Crypto News Today Tokens: Pepeto, Polygon, and TAO Compared
Pepeto: The Live Exchange Driving 100x in the Crypto News Today Spotlight
Block is giving away free Bitcoin because adoption is the game now, and the projects that already have working tools are the ones that catch the wave. Pepeto runs a full exchange where traders swap, bridge, and screen tokens at zero cost, and that kind of daily utility is why forecasters tag it as a 100x entry and the hottest presale of the cycle.
Every trade on PepetoSwap costs zero, every cross-chain transfer through the bridge arrives at full value across Ethereum, BNB Chain, and Solana, and the contract screener grades every token before your wallet touches it, catching the traps that drain portfolios during volatile stretches.
The Pepe cofounder who built an $11 billion token with zero products behind it designed this exchange with a Binance veteran, and SolidProof audited every contract before the presale opened. Staking at 187% APY compounds holdings daily as listing day approaches.
At $0.0000001862 with $8.8 million raised during extreme fear, forecasters target 100x because a functioning exchange from the Pepe founder with a confirmed Binance listing is a setup this cycle has only produced once. Every wallet inside before listing day banks what latecomers spend a multiple to get after trading opens.
Polygon (POL): Polygon Handles $730B in Stablecoin Volume but Returns Stay Modest
POL trades at $0.092 per CoinMarketCap, sitting near its all-time low as Mastercard integrates Polygon for on-chain payments and the Gigagas roadmap targets 100,000 transactions per second.
At a sub-billion market cap, a recovery toward $0.20 gives roughly 2x over months. Solid infrastructure with big-name partnerships, but presale exchanges with confirmed listings are where 100x math actually works.
Bittensor (TAO): TAO Rallied 100% in March but the Big Multiples Are Behind It
TAO trades near $320 per CoinMarketCap, up over 100% in March as AI capital poured in. Grayscale filed for a Bittensor Trust, and targets reach $700, a solid 2x from here.
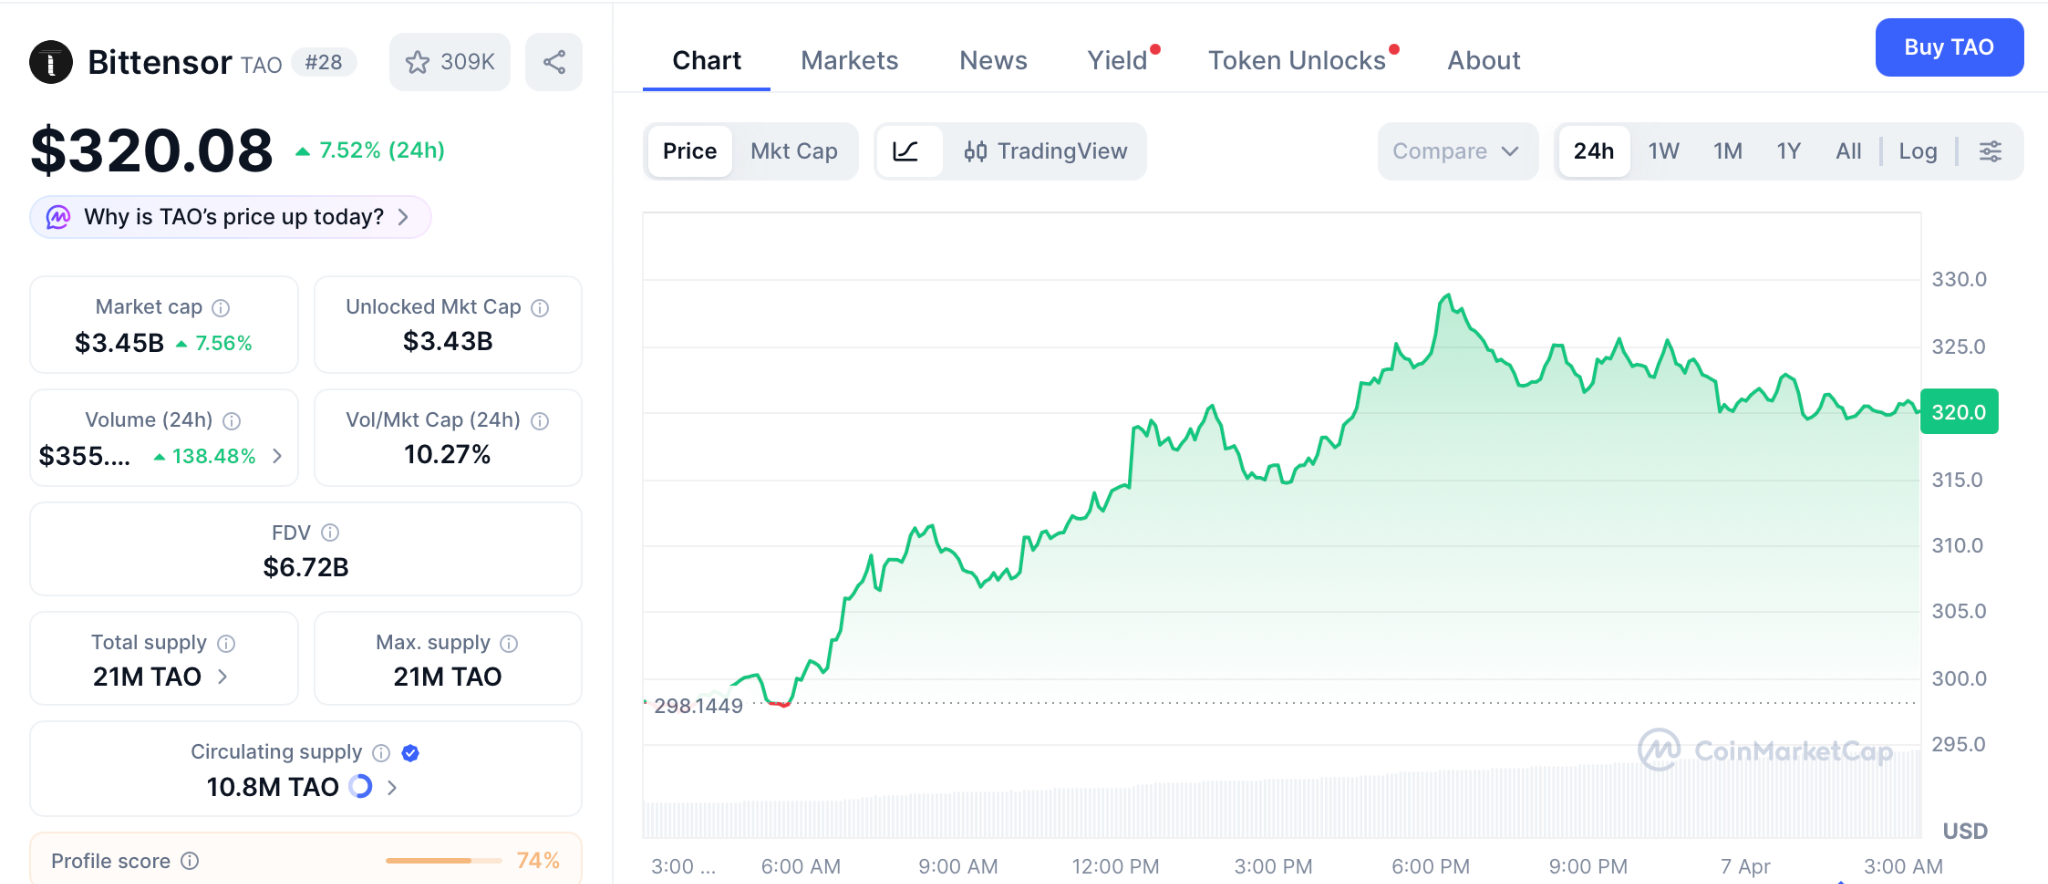
Strong AI growth, but the presale gap is where cycle-defining multiples get made. Pepeto offers the math that TAO at a $3 billion cap will not produce from this level.
Conclusion
Block just started giving away Bitcoin to push adoption, Polygon just locked in Mastercard, and TAO just landed a Grayscale filing. The crypto news today is bullish across the board, but the investors who turned $1,000 into six figures on early AAVE or early Pepe all did the same thing: they found a working project at presale pricing and moved before the listing changed the math.
The Pepeto official website is where the presale is still open. Get in before the Binance listing reprices everything, because projects that combine meme momentum, live tools, and a confirmed listing never stay at ground floor pricing once trading begins.
Click To Visit Pepeto Website To Enter The Presale

FAQs
What is the strongest pick in the crypto news today for 100x returns in 2026?
Pepeto is the strongest 100x pick in the crypto news today because it runs a live zero-fee exchange with a contract screener, a cross-chain bridge, and a confirmed Binance listing, all audited by SolidProof. The presale sits at $0.0000001862 with $8.8 million raised while Polygon and TAO offer under 2x from their current caps.
Why does the crypto news today point to Pepeto over Polygon and TAO for growth?
Pepeto delivers presale-to-listing distance that Polygon at $0.092 and TAO at $320 cannot produce from their existing valuations. The Pepe founder’s $11 billion track record, 187% APY staking, and a Binance listing on a confirmed timeline make it the highest-upside entry covered in the crypto news today.
Disclaimer: This is a Press Release provided by a third party who is responsible for the content. Please conduct your own research before taking any action based on the content.

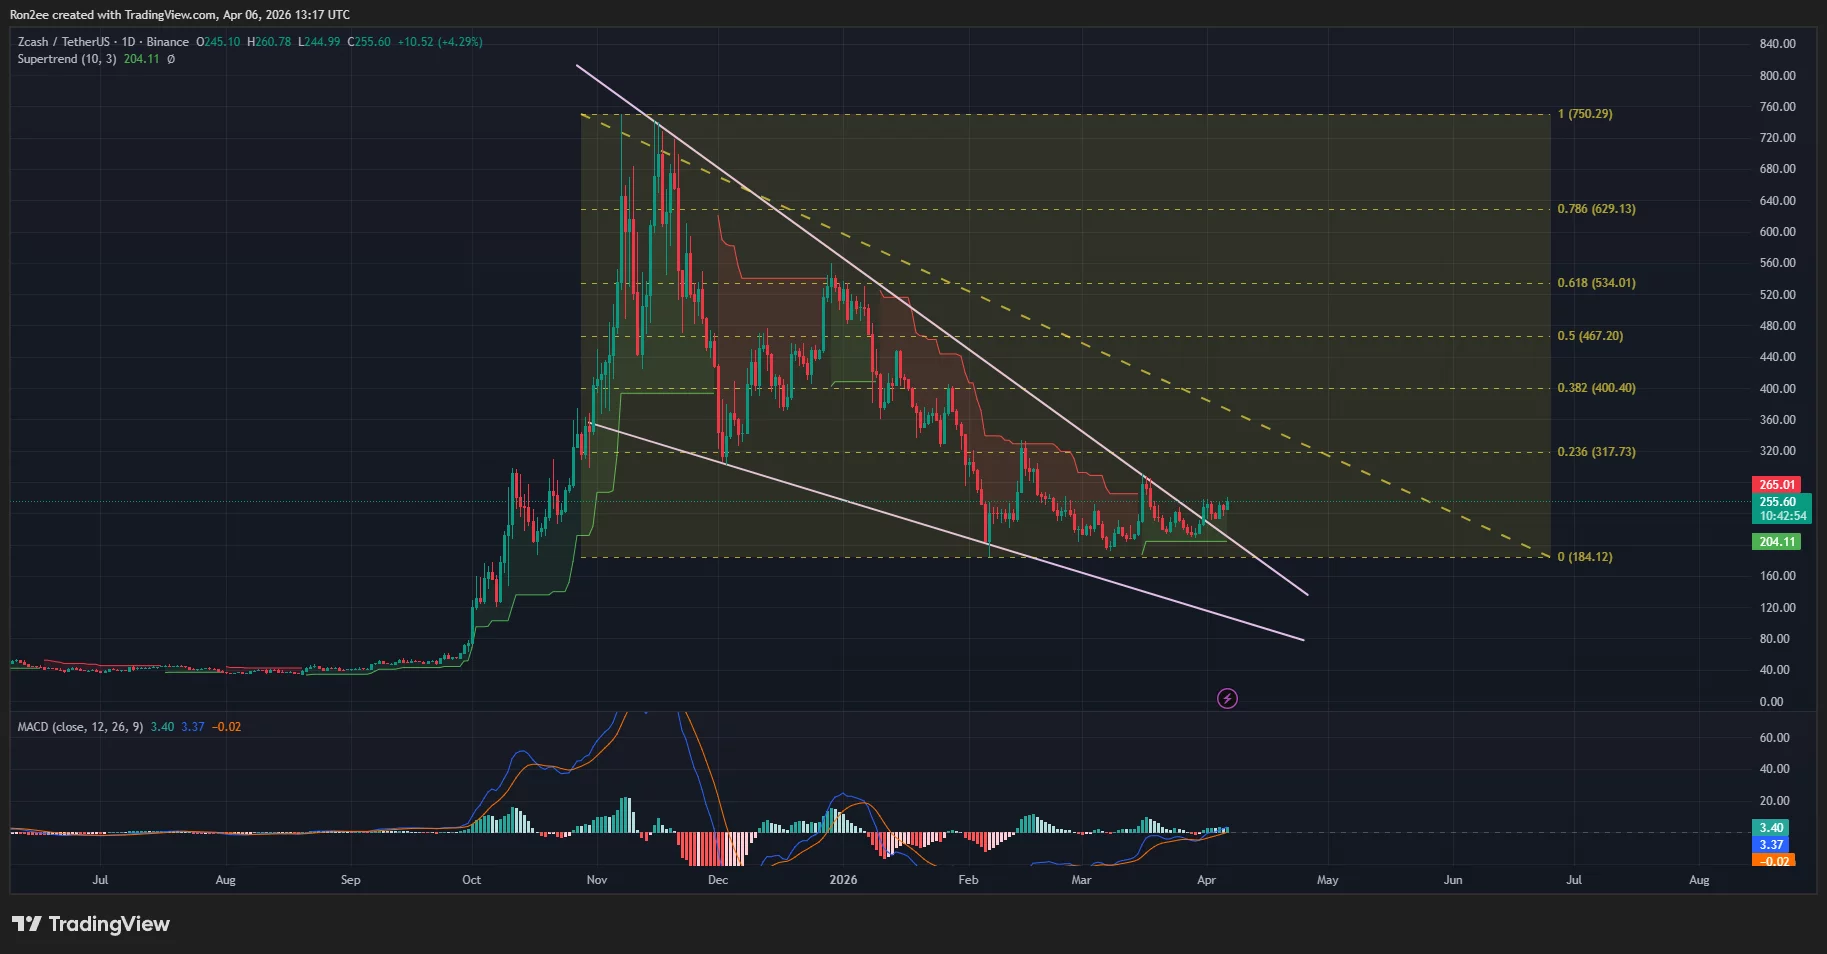
Zcash price has rallied over 20% in the past month, surpassing the $250 mark. Is the token set for higher gains as it has confirmed a bullish setup, while adoption for its shielded transactions continues to expand across the ecosystem?
Summary
- Zcash price rose over 20% in a month, crossing $250 amid rising demand for shielded transactions.
- Zcash Open Development Lab secured $25 million in funding from Paradigm and a16z crypto to expand ecosystem tools.
- Shielded pool holdings hit a record $5.17 billion, signaling increased adoption of Zcash’s privacy features.
Zcash (ZEC) price rallied due to multiple fundamental and technical drivers that converged to create a perfect storm for the asset.
Zcash rallied as it secured fresh backing from institutions. Notably, the Zcash Open Development Lab, a key contributor to the network’s development, announced securing over $25 million in seed funding from venture firms including Paradigm and a16z crypto on March 27, 2026. The funding will support the development of the Zodl wallet alongside other privacy-focused financial tools on the Zcash ecosystem.
Additionally, the total amount of ZEC held in shielded pools has hit a new record high of $5.17 billion at press time, a figure that equals over 31% of the total circulating supply.
A jump in shielded liquidity suggests that a greater number of holders are now using the core privacy features of Zcash, which translates to genuine utility and more demand for the token.
On the daily chart, Zcash price has confirmed a falling wedge pattern formed of two converging and descending trendlines. Breakouts from such patterns have historically sustained upside for the related assets over the following sessions, suggesting that the current momentum is more than just a temporary spike.

In Zcash’s case, the rally could potentially extend to $400, which aligns with the 38.2% Fibonacci retracement level.
Technical indicators appear to be favoring the bulls at the time of writing. The MACD lines were pointing upwards while the Supertrend flashed green, both indicating that the path of least resistance remains to the upside. These signals often attract momentum traders who look for confirmed trend reversals to enter new positions.
However, it should be noted that the Zcash rally could face some resistance at $317, a major resistance and support level that has historically acted as a pivot point Zcash price.
Disclosure: This article does not represent investment advice. The content and materials featured on this page are for educational purposes only.
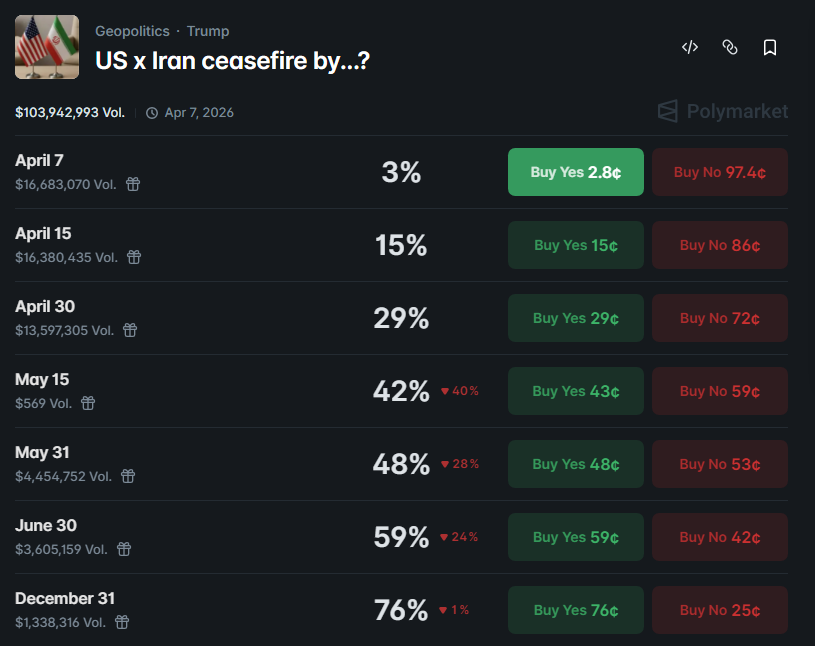
Polymarket traders are giving Trump’s Iran ceasefire deadline just a 3% chance of success, based on over $103 million in live trading volume. That single number captures everything about where market sentiment stands right now.
The numbers send a clear message: the crowd sees no deal arriving on Trump’s timeline.
The Crowd Has Already Decided: No Deal Tuesday
Iran rejected a 45-day ceasefire proposal brokered primarily by Pakistan, with Egypt and Turkey also involved as mediators. Tehran countered with its own 10-point plan, demanding a permanent end to the war instead. Trump dismissed the Iranian response as insufficient and insisted that his Tuesday deadline was final.
Polymarket’s probability curve shows ceasefire odds rising only slowly across future dates. Traders put the chances at 15% by April 15 and 29% by the end of April. The window stretches to 59% by June 30 and 76% by the end of December.
A separate Polymarket contract on Strait of Hormuz shipping paints an equally grim picture. That market assigns just 14% odds to traffic returning to normal levels by April 30. The contract has dropped more than 51 percentage points since it first opened for trading.
Oil Shock Meets Crypto: The Bill Is Coming Due
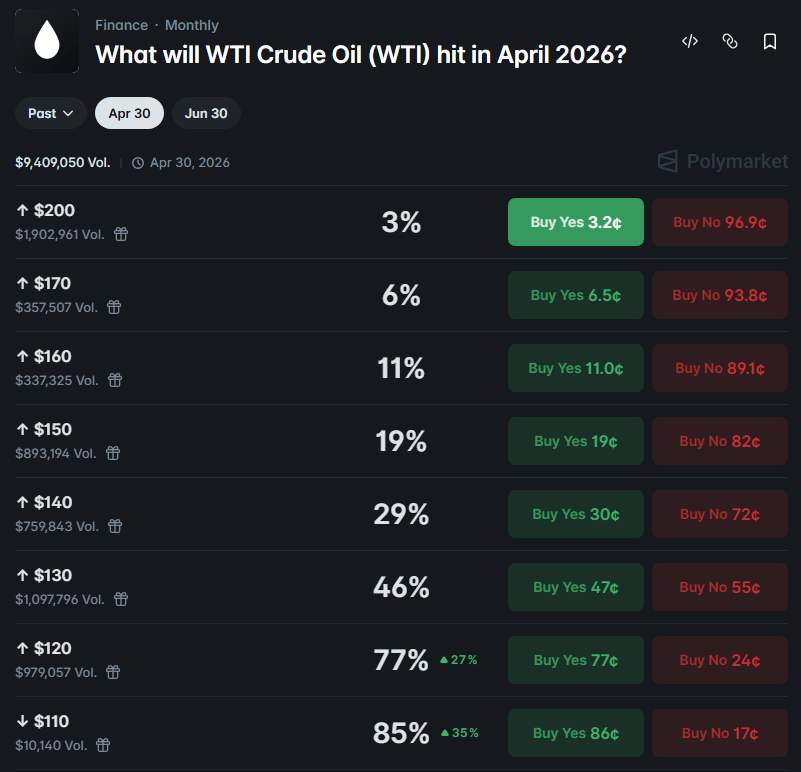
The ongoing war has pushed oil prices sharply higher as the strait remains effectively shut to normal traffic. Polymarket’s separate “Will WTI hit $120 in April?” contract now sits at 77%, a stark reflection of how traders see the energy crunch playing out. Both markets together paint a picture of a world where the war drags on, and oil stays expensive.
Polymarket’s crowd is betting that Tuesday’s deadline will pass without any breakthrough agreement. The ceasefire contract’s 3% odds have barely moved even as mediators worked through the weekend. Until that number shifts decisively, prediction markets say the conflict has much further to run.
The post Polymarket Gives Trump’s Iran Deadline Only a 3% Chance appeared first on BeInCrypto.

Disclosure: This article does not represent investment advice. The content and materials featured on this page are for educational purposes only.
Investors eye presales as capital shifts to early-stage projects like DOGEBALL, targeting high-growth potential.
Summary
- DOGEBALL presale 2026 offers early access to DOGECHAIN, a Layer 2 blockchain with 2-sec blocks and near-zero fees
- Early buyers can use code DB25 for a 25% bonus, capturing massive upside before Q1 2026 altcoin rally
- DOGEBALL pairs viral meme utility with high-speed gaming blockchain, aiming for 50x–100x returns in 2026 presale
Waking up to a sea of green candles is the dream of every trader, but the real “overnight” successes are actually authored months in advance during quiet presale windows.
While the majority of the market is currently distracted by high-cap coins fighting for 5% gains, savvy capital is flowing into early-stage infrastructure projects that offer a clear path to 50x or 100x returns. The window for the next 100x crypto presale is currently open with DOGEBALL (DOGEBALL), a project that pairs viral meme appeal with a high-performance Layer 2 blockchain.

For those who have ever looked at a price chart and wished they had a time machine to go back to the ICO stages of the world’s most successful tokens are currently standing at a similar crossroads.
The next 100x crypto presale isn’t just about finding a lucky ticker symbol; it is about identifying projects with “Stage 1” pricing and “Tier 1” utility. DOGEBALL has already raised over $180,000, signaling that the smart money has identified its $0.015 launch price as a massive arbitrage opportunity compared to the current $0.0004 entry point.
From $0.29 to millions: The Massive ROI lessons from Polkadot
Polkadot (DOT) remains the ultimate case study for why early participation in the next 100x crypto presale is the most effective wealth-building strategy in this industry. During its initial offering, DOT was available for just $0.29, a price that many “safe” investors ignored because the technology seemed unproven. Those who recognized the necessity of its interoperability protocol saw their modest investments transform into life-changing portfolios as the token multiplied by more than 180x at its peak valuation.
The psychological barrier of “being too late” often stops people from entering the market, but the crypto ecosystem consistently produces new cycles of innovation. The good news for those who missed the Polkadot surge is that 2026 has introduced a fresh opportunity with even higher utility. By identifying the next 100x crypto presale like DOGEBALL now, you are positioning yourself at the same foundational level that turned early DOT buyers into crypto millionaires before the rest of the world caught on.
Why the DOGEBALL crypto presale 2026 is outperforming competitors
The DOGEBALL crypto presale 2026 stands apart because it is the native utility token for DOGECHAIN, a custom-built Ethereum Layer 2 blockchain. Unlike standard meme projects that exist only on paper, DOGECHAIN is a functional, testable environment designed specifically to handle high-frequency gaming transactions with near-zero fees. This isn’t just a token; it is a proprietary piece of technology that offers lightning-fast 2-second block times and full EVM compatibility for developers.
Investors are flocking to this DOGEBALL crypto presale 2026 because it solves the “utility gap” found in most low-cap coins. With an integrated online game and a massive $1m prize pool already active, the token has immediate demand. The presale is strategically capped at just four months, running from January 2nd to May 2nd, 2026. This aggressive timeline ensures that the community stays engaged and the project launches exactly when the Q1 altcoin bull run is expected to hit its peak velocity.
Calculate 50x gain and secure a 25% bonus today
The mathematics behind the next 100x crypto presale is incredibly compelling for early participants. Someone who secures DOGEBALL at the current Stage 2 price of $0.0004 is locking in a 3,650% increase based solely on the $0.015 listing price. This does not even account for the post-launch “moon” potential as the token hits major exchanges. By acting now, you are essentially buying an asset at a fraction of its intended market value before the general public is allowed to trade it.
To maximize the position, they can use the limited-time bonus code DB25 during their purchase to receive an instant 25% boost in their token count. This means for every 1,000 tokens someone buys, they get an extra 250 for free, significantly lowering their risk and increasing their upside. As the project nears its $490k Stage 3 milestone, the price will increase again, making today the most profitable time to enter the next 100x crypto presale ecosystem.
How to join the Dogeball crypto presale 2026 in three steps
Joining the DOGEBALL crypto presale 2026 is a seamless process designed for both veteran traders and newcomers. First, visit the official website and connect a preferred digital wallet, such as MetaMask or Trust Wallet. The platform is highly flexible, accepting a wide range of currencies, including ETH, USDT, BNB, SOL, and even direct Credit or Debit card payments for those who prefer to buy with fiat.
Once a wallet is connected, simply enter the amount to invest and remember to input the code DB25 in the bonus field. This ensures that 25% extra DOGEBALL tokens are immediately obtained. After confirming the transaction, tokens will be visible on the dashboard. Take advantage of the 80% APY staking rewards during the presale period to allow the bag of this next 100x crypto presale to grow passively while waiting for the May 2nd launch.

The final countdown to the Dogeball crypto presale launch
As we conclude this analysis of the next 100x crypto presale, it is clear that DOGEBALL is the most structured opportunity of 2026. We have discussed the historical success of Polkadot, the unique Layer 2 technology powering DOGECHAIN, and the massive 100% “Buyer of the Week” bonuses that have already sparked intense competition among whales. This project isn’t just selling a dream; it is delivering a fully audited, high-utility ecosystem that is ready for mass adoption.
The DOGEBALL crypto presale 2026 represents the perfect convergence of memecoin viral energy and serious blockchain infrastructure. With only a few weeks remaining in the 4-month window, the time for hesitation has passed. Use the bonus code DB25 today to secure 25% extra tokens and hold a significant stake before the token lists at $0.015. Don’t let this be another “what if” story; make DOGEBALL a ticket to the 2026 bull run.
For more information, visit the official website, Telegram, and X.
FAQs for the next 100x crypto presale
What is the next 100x crypto presale to buy right now?
DOGEBALL (DOGEBALL) is currently the next 100x crypto presale to watch because of its proprietary Layer 2 blockchain and its planned 50x jump from Stage 1 pricing to its $0.015 listing price. The project offers real gaming utility and a verified audit.
Which crypto will give 100x in 2026 for early investors?
Many analysts believe the next 100x crypto presale will be DOGEBALL due to its 80% staking rewards and its position as the first ETH L2 built specifically for gaming. The short 4-month presale window also creates rapid momentum for a successful market launch.
What makes a crypto presale successful in the long term?
A successful next 100x crypto presale requires real utility, which DOGEBALL provides through its $1m gaming prize pool and zero-tax DOGECHAIN. Unlike temporary hype projects, DOGEBALL has a long-term roadmap including CEX listings and corporate gaming partnerships.
Disclosure: This content is provided by a third party. Neither crypto.news nor the author of this article endorses any product mentioned on this page. Users should conduct their own research before taking any action related to the company.
Iran-US war live: Trump vows to decimate Iran as deadline approaches and says he’s ‘not worried’ about war crimes

Investment scams cost West Australians $13.7m in losses
Bitcoin drops toward $68,000 as demand weakens and whales sell


-

 NewsBeat4 days ago
Steven Gerrard disagrees with Gary Neville over ‘shock’ Chelsea and Arsenal claim | Football
-

 Business4 days ago
No Jackpot Winner and $194 Million Prize Rolls Over
-

 Fashion3 days ago
Weekend Open Thread: Spanx – Corporette.com
-

 Crypto World5 days ago
Gold Price Prediction: Worst Month in 17 Years fo Save Haven Rock
-

 Business1 day ago
Three Gulf funds agree to back Paramount’s $81 billion takeover of Warner, WSJ reports
-
Crypto World7 days ago
Dems press CFTC, ethics board on prediction-market insider trades
-

 Sports2 days ago
India men’s 4x400m and mixed 4x100m relay teams register big progress | Other Sports News
-

 Business3 days ago
Expert Picks for Every Need
-

 Business5 days ago
Login and Checkout Issues Spark Merchant Frustration
-

 Tech7 days ago
EE TV is using AI to help you find something to watch
-

 Sports6 days ago
Tallest college basketball player ever, standing at 7-foot-9, entering transfer portal
-
Tech7 days ago
Daily Deal: StackSkills Premium Annual Pass
-

 Tech7 days ago
How to back up your iPhone & iPad to your Mac before something goes wrong
-

 Tech7 days ago
What Are The Biggest Limitations Of Supercomputers?
-

 Crypto World6 days ago
Bitcoin enters the public bond market as Moody’s gives a first-of-its-kind crypto deal a rating
-
Crypto World6 days ago
Bitcoin stalls below key resistance as technical signals skew bearish
-

 Politics7 days ago
Transform Your Space with Stunning Small Works
-

 Politics6 days ago
Starmer’s centre has collapsed, and the left was right all along
-
Business2 days ago
No Jackpot Winner, Prize to Climb to $231 Million
-

 Fashion7 days ago
Zara Turns Up the Heat With New Swimwear
You must be logged in to post a comment Login