

Crypto World
XRP Price Dips 2.4% Amid Ripple’s Strategic Shift to Stablecoin Integration

Key Takeaways
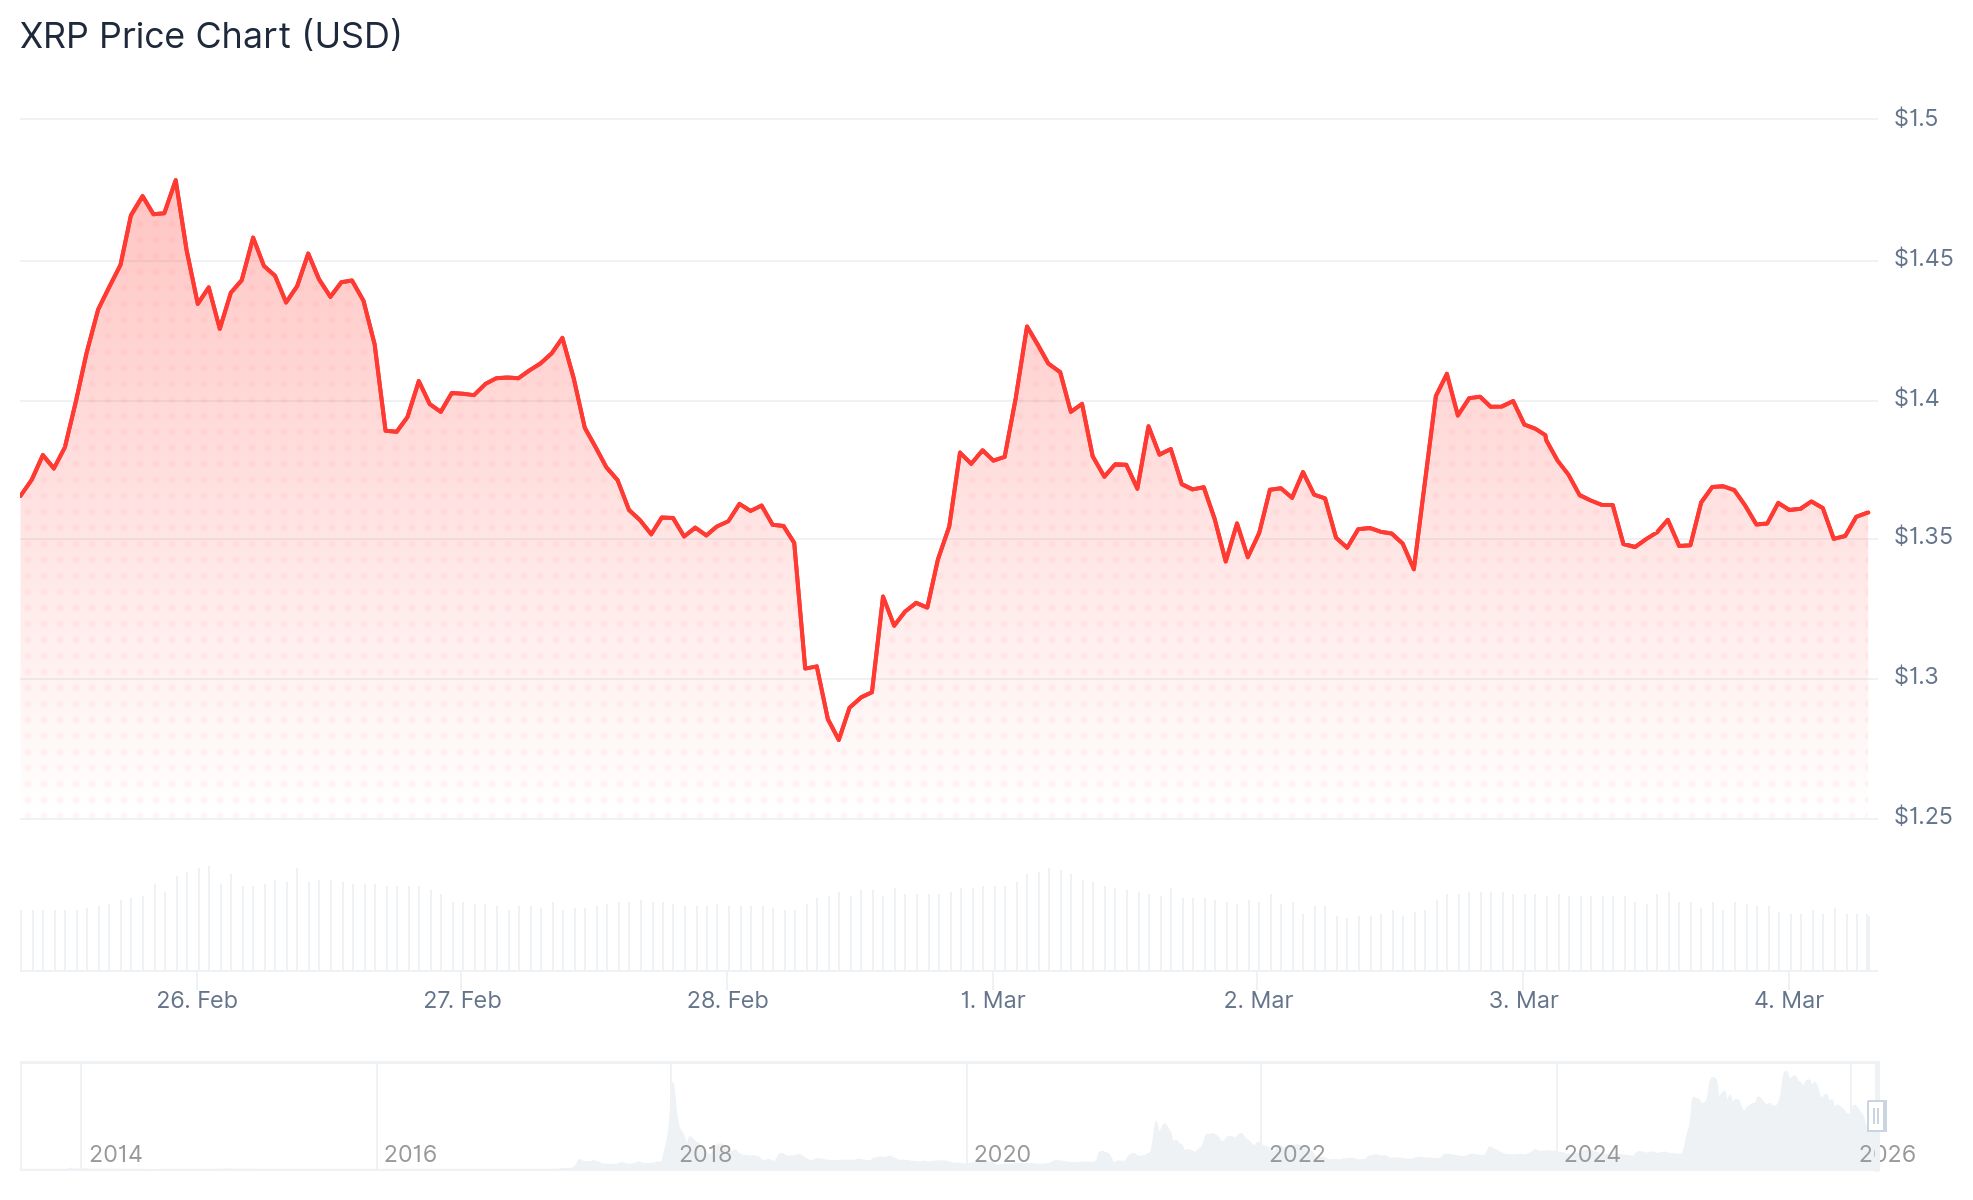
- XRP declined 2.4% over a 24-hour period, settling around $1.36 with trading activity between $1.34 and $1.40
- Market-wide selloff intensified due to Middle Eastern geopolitical tensions pushing oil prices upward
- Ripple announced integration of stablecoin capabilities, including RLUSD, into its payment infrastructure
- Technical analysis shows crucial support at $1.3320 with resistance positioned at $1.3880
- Market observers note RLUSD could potentially rival XRP’s traditional bridge currency function within Ripple’s network
On Tuesday, March 3, 2026, XRP experienced a 2.4% decline over 24 hours, settling near $1.36 based on CoinGecko market data. The digital asset fluctuated within a $1.34 to $1.40 price corridor throughout the trading day.
The token maintained a market capitalization hovering around $83 billion. Trading volume reached approximately $3 billion within the same 24-hour timeframe.
The price decline mirrored a wider retreat across risk-sensitive assets. Market participants attributed the selloff primarily to intensifying U.S.-Israel military operations targeting Iran.
“The market is concerned that the US is getting pulled deeper into this conflict,” said Tim Ghriskey, senior portfolio strategist at Ingalls & Snyder.
Bitcoin experienced a parallel downturn, declining 1.35% to $68,496 during the identical period. Data from Chainalysis revealed significant cryptocurrency withdrawals from Iranian trading platforms, totaling $10.3 million between Saturday and Monday.
Ripple Unveils Enhanced Payment Infrastructure
Tuesday brought Ripple’s announcement regarding the expansion of its Ripple Payments platform to accommodate both conventional fiat currencies and stablecoin assets. The firm is strategically positioning RLUSD, its dollar-backed stablecoin, as a primary instrument alongside XRP within the enhanced platform.
“Success in this space requires enterprise-grade infrastructure, extensive licensing, and deep liquidity,” said Monica Long, Ripple’s president.
Throughout the previous year, Ripple has strategically transformed itself into a stablecoin infrastructure provider. This transformation included the $200 million acquisition of Rail, a stablecoin payment solutions company, and the subsequent RLUSD launch following the Genius Act’s passage, which established clearer regulatory guidelines for stablecoins.
Implications for XRP’s Market Position
Historically, XRP has functioned as the primary bridge currency within Ripple’s international payment infrastructure. RLUSD now presents an additional option operating within the identical ecosystem.
Certain market analysts contend this development presents complications for XRP’s value proposition. Financial institutions utilizing XRP for transaction settlements typically execute conversions almost instantaneously, generating minimal sustained buying pressure.
RLUSD introduces a stable, regulatory-compliant alternative that may prove more attractive to banking institutions and financial service providers.
From a technical analysis perspective, XRP is currently positioned beneath its 100-hourly Simple Moving Average. A descending trend line has established itself with resistance concentrated near $1.3880 on the hourly timeframe.
Should the price breach $1.3880, subsequent resistance levels appear at $1.40 and $1.4320. On the downside, support levels are identified at $1.3320, followed by $1.3085.
XRP reached peak values approaching $3.50 in late 2025 before entering a correction phase. The token has remained below $1.50 since that downward adjustment.
As of Tuesday’s close, XRP was valued at roughly $1.36.


By Omkar Godbole (All times ET unless indicated otherwise)
Bitcoin rose to just short of $72,000, hitting a one-month high and lifting the broader crypto market even as the war in the Middle East wreaks havoc on traditional markets.
The outperformance stems from several factors, including relative positioning, rising odds of the passage of the U.S.’s long‑debated Clarity Act aimed at legalizing stablecoins and hopes that conflict with Iran will end soon.
Bitcoin, down nearly 50% from its record high in October, was oversold before hostilities began Saturday. So as traditional assets tumbled, BTC held up well. That has likely revived investor interest in the largest cryptocurrency, drawing institutions back to the spot ETFs.
As noted on Monday, bitcoin stands to gain because the war will only worsen government finances worldwide, leading to more “fiat debasement.“
Meanwhile, the New York Times put out an interesting report that likely aided the price bounce, according to Bloomberg. The report said that the day after the attacks began, operatives from Iran’s Ministry of Intelligence contacted the CIA to discuss terms for ending the war. While the U.S. ignored the overture, the outreach suggests backchannels are still active and could be used again, potentially leading to a ceasefire.
Lastly, there’s the possibility the Clarity Act could be passed soon.
“There was speculation circulating in the U.S. that the Clarity Act was close to being signed into law. This helped lift many altcoins relative to major assets, as they are expected to be among the biggest long-term beneficiaries of the legislation,” Paul Howard, director at trading firm Wincent, said in an email.
However, he added that there is currently no strong evidence that a large pool of sidelined money is waiting to flood into digital assets, and any rotation is still relatively small or gradual.
Looking ahead, traders expect volatility to persist, particularly if the Strait of Hormuz, a key oil-supply chokepoint, remains closed and oil prices continue to surge.
“We expect continued volatility, but if the disruption persists, pressure to reopen Hormuz is likely to build. Bitcoin has held up better than broader risk, and bears watching as an early signal of stabilizing sentiment,” QCP Capital’s market insight team said. Stay alert!
Read more: For analysis of today’s activity in altcoins and derivatives, see Crypto Markets Today
What to Watch
For a more comprehensive list of events this week, see CoinDesk’s “Crypto Week Ahead“.
- Crypto
- Macro
- March 4, 8:15 a.m.: U.S. ADP employment change for February (Prev. 22K)
- March 4, 10:00 a.m.: U.S. ISM services PMI for February (Prev. 53.8)
- March 4, 2:00 p.m.: U.S. Fed Beige Book
- Earnings (Estimates based on FactSet data)
Token Events
For a more comprehensive list of events this week, see CoinDesk’s “Crypto Week Ahead“.
- Governance votes & calls
- Uniswap DAO is voting across two linked proposals to expand v2 and v3 protocol fees to eight layer-2 networks and enable a new tier-based fee system across all v3 pools. Voting ends March 4 & 5.
- ENS DAO is voting to replace three DNSSEC oracle algorithms to patch a critical RSA signature forgery vulnerability and significantly reduce gas costs. Voting ends March 4.
- Unlocks
- Token Launches
- March 4: Block Street (BSB) to list on Binance Alpha, Bybit, others.
Conferences
For a more comprehensive list of events this week, see CoinDesk’s “Crypto Week Ahead“.
Market Movements
- BTC is up 4.49% from 4 p.m. ET Wednesday at $71,283.58 (24hrs: +6.65%)
- ETH is up 5.19% at $2,068.65 (24hrs: +5.64%)
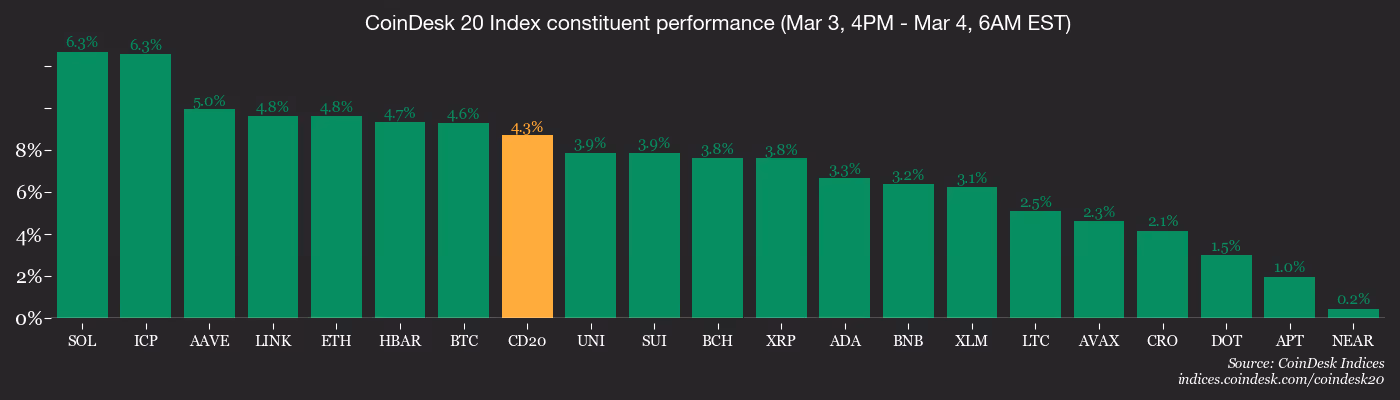
- CoinDesk 20 is up 4.31% at 3,086.55 (24hrs: +5.45%)
- Ether CESR Composite Staking Rate is down 1 bps at 2.85%
- BTC funding rate is at 0.0051% (5.6119% annualized) on Binance

- DXY is down 0.25% at 98.81
- Gold futures are up 1.70% at $5,194.10
- Silver futures are up 4.00% at $86.24
- Nikkei 225 closed down 3.61% at 54,245.54
- Hang Seng closed down 2.01% at 25,249.48
- FTSE 100 is up 0.18% at 10,502.97
- Euro Stoxx 50 is up 0.70% at 5,812.08
- DJIA closed on Tuesday down 0.83% at 48,501.27
- S&P 500 closed down 0.94% at 6,816.63
- Nasdaq Composite closed down 1.02% at 22,516.69
- S&P/TSX Composite closed down 2.19% at 33,784.90
- S&P 40 Latin America closed down 4.95% at 3,539.33
- U.S. 10-Year Treasury rate is up 1 bps at 4.06%
- E-mini S&P 500 futures are unchanged at 6,825.00
- E-mini Nasdaq-100 futures are unchanged at 24,762.00
- E-mini Dow Jones Industrial Average futures are down 0.12% at 48,501.00
Bitcoin Stats
- BTC Dominance: 59.61% (+0.81%)
- Ether-bitcoin ratio: 0.02909 (0.26%)
- Hashrate (seven-day moving average): 1,025 EH/s
- Hashprice (spot): $31.26
- Total fees: 2.71 BTC / $183,733
- CME Futures Open Interest: 101,620 BTC
- BTC priced in gold: 13.7 oz.
- BTC vs gold market cap: 4.77%
Technical Analysis

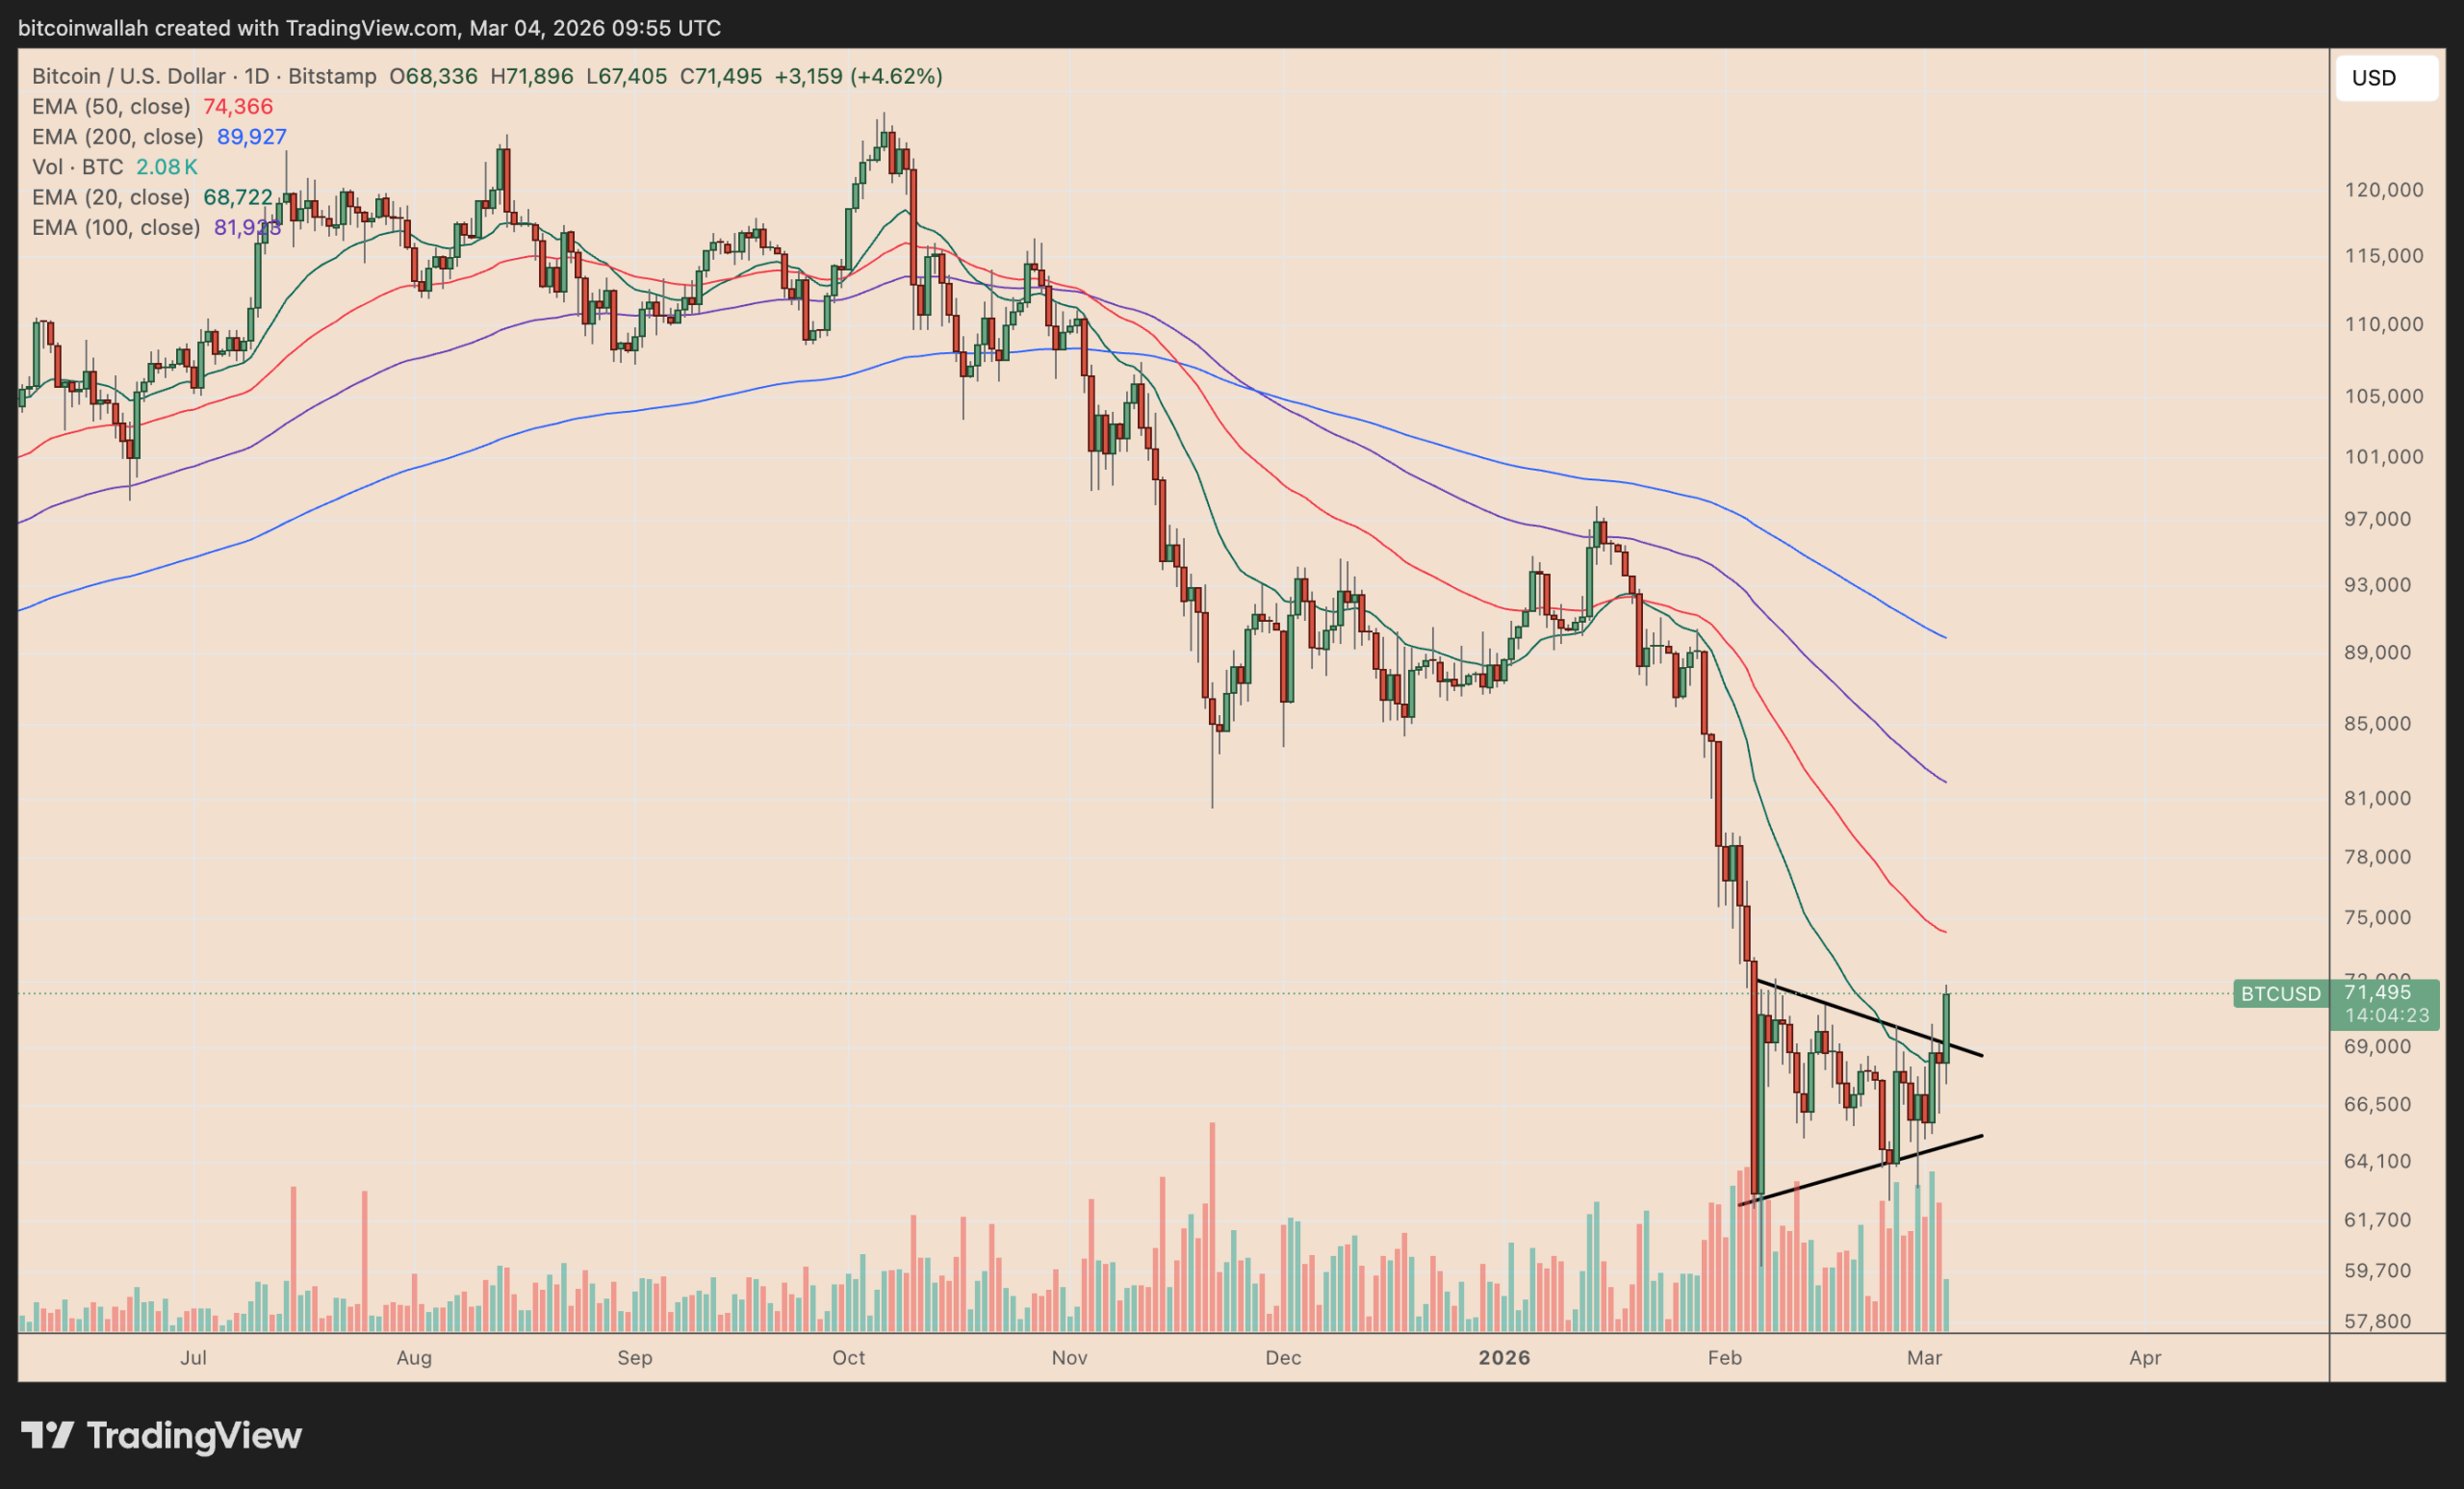
- The chart shows bitcoin’s weekly price swings in candlestick format from early 2024.
- The bounce above $71,000 has renewed focus on the $74,000 level, which acted as resistance, an area where buyers tapped out in March 2024 and later as support, where selling stalled last April.
- This level, therefore, represents an area of significant historical economic activity and could now serve as a key inflection zone: A break and hold above $74,000 may open the door to a push toward higher levels, while repeated failure there could reignite selling pressure.
Crypto Equities
- Coinbase Global (COIN): closed on Tuesday at $182.36 (–1.55%), +6.66% at $194.51 in pre-market
- Galaxy Digital (GLXY): closed at $20.68 (–4.83%), +4.01% at $21.51
- MARA Holdings (MARA): closed at $8.66 (–8.36%), +6.47% at $9.22
- Riot Platforms (RIOT): closed at $15.29 (–6.94%), +3.53% at $15.83
- Core Scientific (CORZ): closed at $15.30 (–7.22%), +2.55% at $15.69
- CleanSpark (CLSK): closed at $9.89 (–6.26%), +4.25% at $10.31
- Exodus Movement (EXOD): closed at $10.83 (+3.44%), +0.65% at $10.90
- CoinShares Bitcoin Mining ETF (WGMI): closed at $37.88 (–6.31%), +4.67% at $39.65
- Circle Internet Group (CRCL): closed at $99.63 (+3.63%), +6.15% at $105.76
- Bullish (BLSH): closed at $33.12 (–2.04%), +2.93% at $34.09
Crypto Treasury Companies
- Strategy (MSTR): closed at $132.68 (–3.61%), +7.70% at $142.89
- Upexi (UPXI): closed at $0.79 (–10.80%), +14.65% at $0.90
- Lite Strategy (LITS): closed at $1.15 (+2.68%)
- Sharplink (SBET): closed at $7.26 (–1.76%), +4.68% at $7.60
ETF Flows
Spot BTC ETFs
- Daily net flows: $225.2 million
- Cumulative net flows: $55.47 billion
- Total BTC holdings ~1.28 million
Spot ETH ETFs
- Daily net flows: -$10.8 million
- Cumulative net flows: $11.66 billion
- Total ETH holdings ~5.71 million
Source: Farside Investors
While You Were Sleeping
Bitcoin (BTC) bulls are eyeing a move back toward $80,000 in March, with at least three indicators flashing increasing upside momentum.
Key takeaways:
-
Bitcoin jumped by over 5% toward $72,000 on Wednesday.
-
Multiple indicators, including a symmetrical triangle, hint at an extended price rally toward $80,000.
Bitcoin invalidates bearish chart pattern
On Wednesday, BTC’s price showed signs of invalidating what initially appeared to be a bear pennant.
The BTC/USD pair pierced the pennant’s upper trend line after jumping 5.21% to around $71,900. Its breakout came alongside a rise in trading volume, implying stronger conviction behind the rally.

That simultaneously increased the odds of a symmetrical-triangle bullish reversal.
A symmetrical triangle forms when price makes lower highs and higher lows, compressing into a tightening range.
It resolves when the price breaks either of the trendlines and moves by as much as the pattern’s maximum height.
In BTC’s case, the triangle’s widest range is roughly $63,000 to $71,000–$72,000.

A standard measured move above the upper trend line points to about $80,000 in March if the breakout sticks. The level aligns with BTC’s 100-day exponential moving average (100-day EMA, the purple line).
Related: US spot Bitcoin ETFs add $225M as BlackRock’s IBIT offsets redemptions
BTC’s next hurdle is the 50-day EMA (red) near $74,400. A rejection there would weaken the breakout and raise the odds of a pullback toward the 20-day EMA (green) around $68,700.
BTC futures gap remains unfilled at $80,000
The triangle’s $80,000 measured target also overlaps with an unfilled CME futures gap, turning the area into a clear magnet zone for the bulls.
A CME gap happens because CME Bitcoin futures stop trading over the weekend. If Bitcoin’s spot price moves while the futures market is closed, the latter can reopen at a new level, leaving an empty price zone on the chart.

As of Wednesday, that gap has been sitting around $79,660–$81,210 since early February.
Nine of the last 10 CME gaps have been filled since August 2025, which is why traders may view the $79,660–$81,210 region as a high-priority target as spot and futures prices re-align.
Polymarket raises odds of $80,000 Bitcoin in March
Polymarket, a crypto-based prediction market where users trade contracts on real-world outcomes, is showing a clear bullish shift for BTC in March.
Traders now assign 40% odds that Bitcoin reaches $80,000 on Wednesday, up from 20% a day ago. The $75,000 target carries even stronger conviction at 70%, up from 40% yesterday.

At the same time, the odds of the BTC price reaching $65,000 and $60,000 in March are priced lower than before, suggesting the crowd is trimming downside expectations.
This article does not contain investment advice or recommendations. Every investment and trading move involves risk, and readers should conduct their own research when making a decision. While we strive to provide accurate and timely information, Cointelegraph does not guarantee the accuracy, completeness, or reliability of any information in this article. This article may contain forward-looking statements that are subject to risks and uncertainties. Cointelegraph will not be liable for any loss or damage arising from your reliance on this information.


Kraken Financial has gained direct access to US Federal Reserve’s payment systems via a Kansas City Fed approval, though without full banking privileges such as interest on reserves.
US cryptocurrency exchange Kraken has become the first company to secure a master account from the US Federal Reserve, The Wall Street Journal reported Wednesday.
Kraken Financial, the exchange’s banking unit, has gained access to the Fed’s key payment systems, allowing the platform to move money on the same rails used by banks and credit unions, according to The WSJ.
The Federal Reserve Bank of Kansas City, which oversaw its application, and Kraken, trading as Payward, are expected to announce the approval Wednesday.
The news marks a significant milestone for the crypto industry in the US, though the approval does not provide the full range of services available to banks, including payment of interest on reserves held at the central bank.
Several crypto companies in the US have been pursuing a master account with the Fed for years, with Caitlin Long’s Custodia Bank doubling down on efforts to obtain one through a court petition in late 2025.
A “historic shift” for the US crypto industry
The decision marks a “historic shift” for the crypto industry in the US, journalist Eleanor Terrett wrote in an X post, highlighting that it signals a softer tone at the Fed, which critics had previously described as hostile to crypto under the prior administration.
“The decision also impliedly recognizes that the Fed believes Kraken has sufficient anti-money laundering and sanctions compliance practices to curb illicit finance risk, and that Wyoming’s regulatory framework for special purpose depository institutions is in line with Federal banking standards,” Terrett said.
Kraken did not immediately respond to Cointelegraph’s request for comment.
Magazine: Clarity Act risks repeat of Europe’s mistakes, crypto lawyer warns

Ripple CEO Brad Garlinghouse backed President Trump’s remarks, saying they were aligned with public interest.
U.S. President Donald Trump has accused the traditional banking lobby of undermining the GENIUS Act and holding the CLARITY Act “hostage” to protect their profits, injecting himself directly into the legislative battle over stablecoin yields.
The intervention marks a significant escalation in the fight over whether crypto platforms can offer interest-like rewards on stablecoins, a practice banks argue will trigger a mass exodus from traditional deposit accounts.
Trump Fires Back at Banks Over Stablecoin Standoff
In a post on Truth Social, Trump framed the dispute as an existential threat to American innovation.
“The Genius Act is being threatened and undermined by the Banks, and that is unacceptable — We are not going to allow it,” he wrote. “The U.S. needs to get Market Structure done, ASAP. Americans should earn more money on their money.”
The GENIUS Act, signed into law in July 2025, created the first federal framework for stablecoins but barred issuers from paying interest directly to holders. It left a critical question unanswered: whether third-party platforms like Coinbase could pass yield on to customers.
Banks have since lobbied aggressively to close this “loophole” in the CLARITY Act, the broader market structure bill that would establish clear jurisdiction for digital assets.
Their stance led to disagreement with some players in the crypto industry, which reached a boiling point in January when Coinbase CEO Brian Armstrong withdrew support for the bill ahead of a scheduled Senate markup, citing proposed amendments that would ban passive yield on stablecoins.
The White House set a deadline of March 1 for stakeholders to resolve their differences, yet no public compromise had emerged by that date.
You may also like:
“The Banks should not be trying to undercut The Genius Act or hold The Clarity Act hostage,” Trump posted. “They need to make a good deal with the Crypto Industry because that’s what’s in best interest of the American People.”
Earlier in the year, Geoff Kendrick, global head of crypto research at Standard Chartered, warned that stablecoins could pull as much as $500 billion in deposits from banks by 2028, with U.S. regional lenders most exposed.
Industry Cheers While Banks Face a Cartel Accusation
Trump’s remarks drew immediate praise from crypto leaders, with Ripple CEO Brad Garlinghouse calling it “an extremely pointed message… about what’s in the best interest of the American people.”
Senator Cynthia Lummis echoed the urgency, urging Congress to move quickly to pass the act. Meanwhile, Eric Trump, the president’s son and a World Liberty Financial co-founder, accused big banks of “mass panic” over losing the “digital finance race.”
However, some, like Charles Hoskinson, have slammed the legislation, with the Cardano founder describing it as a “horrific, trash bill,” and warning that its “security by default” framework would trap new projects under SEC jurisdiction and “destroy all future American cryptocurrency projects.”
He argued that while legacy tokens like Cardano might be grandfathered in, future innovation would be forced overseas. This puts him at odds with Garlinghouse, who has argued that “clarity beats chaos” and that the industry cannot let “perfection be the enemy of progress.”
Binance Free $600 (CryptoPotato Exclusive): Use this link to register a new account and receive $600 exclusive welcome offer on Binance (full details).
LIMITED OFFER for CryptoPotato readers at Bybit: Use this link to register and open a $500 FREE position on any coin!
Crypto World
Bitcoin (BTC) price hits $71,800 as investors rotate into havens during Middle East escalation

Bitcoin rallied to a one-month high of $71,800, effectively dismissing the risk-off sentiment that has restricted upside in U.S. equities over the past week.
The largest cryptocurrency stalled just below $72,000, a level it last reached on Feb. 8 before sliding back to $65,000.
Precious metals also rallied on Wednesday, with gold and silver up 1.8% and 5.3%, respectively, since midnight UTC. Bitcoin is up by 4.8% over the same period.
The move to haven assets comes as war continues to rage in the Middle East, with Israel saying it hit several security headquarters across Iran while Iran attacked U.S. sites in Dubai and Qatar.
Equities are little changed since midnight, lagging the broader crypto market.
Derivatives positioning
- Over the past 24 hours, global crypto futures open interest (OI) has increased by 8% to nearly $103 billion. Trading volume also rose, albeit by less than OI, indicating renewed interest in holding positions rather than trading in and out. That adds credibility to the price bounce.
- Open interest in futures tied to the top 10 tokens rose. DOGE led with a 10% increase.
- Perpetual funding rates and cumulative volume delta for most major cryptocurrencies, including bitcoin and ether, are positive, a sign of buying pressure building up in another hint of a continued price recovery.
- Bitcoin and ether’s (ETH) 30-day implied volatility indexes remain steady at levels seen before the start of the Middle East conflict, a sign there is no panic in the market.
- On Deribit, BTC and ETH puts still trade notably pricier than calls in a sign of lingering downside fears.
- The $125,000 strike call expiring end-March, a bet that prices will surge beyond that level in four weeks, is the most traded option of the past 24 hours. Deribit said that the bulk of the activity represents the closing of existing short positions rather than fresh purchases (bullish bets).
- Block flows featured demand for bitcoin call spreads and call ratio spreads, a sign of moderate bullish sentiment. In ETH’s case, traders chased both call and put spreads.
Token talk
- The altcoin market is beginning to show signs of strength after almost a month of consolidation. Ether (ETH) rose by 5% since midnight UTC, with daily trading volume remaining consistent at $25 billion.
- But it was the lower-liquidity, lower-market-cap tokens that outperformed the majors; KITE, AERO, and TAO all increased by double digits in the past 24 hours, while the likes of PUMP and DCR have rallied by around 6% since midnight UTC.
- The crypto Fear and Greed index has risen from multi-year lows of 5/100 in February to 19/100, suggesting a measure of optimism is entering the broader crypto market.
- The CoinDesk Computing Select Index (CPUS) was the best-performing benchmark over the past 24 hours, rising by 7% while the BTC-weighted CoinDesk 20 (CD20) increased by around 5% over the same period.


Lightning has promised fast, cheap Bitcoin payments for years. But for most people, using it still means choosing between an easy custodial wallet or a self-custodial setup that requires extra work – managing channels, getting inbound liquidity, and staying online so payments don’t fail.
Cake Wallet says its latest release is built to remove that friction. In the newest update, the wallet is rolling out self-custodial Lightning support designed for everyday use, so people can send and receive near-instant payments on mobile without having to run Lightning like a hobby and without giving up control of funds. Users can also move BTC back on-chain at any time.
A Lightning UX for the people
At the center of the launch is an integration powered by the Breez SDK and Spark. Cake’s announcement positions this as the missing bridge between non-custodial in principle and usable in practice, removing the need for users to manage channels, inbound capacity, liquidity, or continuous uptime monitoring.
In a short statement, Cake Labs CEO Vikrant Sharma has described the point of the release as refusing to force users into “a choice between convenience and sovereignty.”
Spark’s role is also worth unpacking. It’s a Bitcoin-native layer-2 built for payments and settlement, designed to let developers build natively on Bitcoin while remaining compatible with Lightning. In other words, the infrastructure is being engineered so wallet teams can offer a smoother Lightning experience without pushing users into a purely custodial model.
Privacy-First
Cake is also leaning into a privacy-first framing. In its release, the company says users can receive over Lightning without revealing a Spark address, and that Spark transactions are not published to Spark block explorers by default, reducing unnecessary exposure of activity.
The company has been moving toward a privacy-by-default approach on Bitcoin for some time, adding tools like Silent Payments and PayJoin v2 to make on-chain activity harder to trace and group together.
Human-Readable Lightning Addresses and Spending Options Inside the App
Lightning can be fast and cheap, but it still struggles with day-to-day UX details, like having to generate a new invoice and paste it into a chat for every payment.
Cake Wallet is trying to remove that step by introducing custom Lightning addresses, allowing users to receive via an @cake.cash username instead of sharing invoices or complex payment strings. Cake says the address can be created immediately, with no minimum balance requirement.
The update also brings Lightning directly into Cake Pay, the company’s prepaid debit card and gift card service. In Cake’s documentation, Cake Pay is explained as a way to buy gift cards or add a debit card to Apple Pay or Google Pay, designed to make crypto spending more practical without turning the experience into a data trail.
All Your Bitcoin, Lightning, and Storage in One App
Many Bitcoin users still use one app for everyday payments and another for long-term storage.
Cake Wallet says this update brings those workflows into one place: on-chain Bitcoin, Lightning, privacy tools, and hardware wallet support. Users can move funds between cold storage, on-chain, and Lightning inside the app, without switching tools or manually copying addresses.
With additions like human-readable Lightning addresses and Lightning-enabled Cake Pay for gift cards and prepaid debit cards, the update is clearly pushing toward everyday usability. If it delivers on reliability in real-world conditions, it finally makes Lightning a practical payment layer you can keep on your phone.

Leopold Aschenbrenner, a former OpenAI researcher who departed the lab’s superalignment cadre to launch the San Francisco‑based hedge fund Situational Awareness LP, has steered his portfolio toward the AI compute backbone. The latest 13F filing for Q4 2025 reveals a dramatic scale‑up: the fund reports about $5.52 billion in US equity exposures across 29 positions, up from a few hundred million dollars at the start of 2025. Rather than chasing consumer AI software, the strategy bets on the infrastructure that powers the AI boom—power plants, data centers, and the hardware that underpins high‑end computation. The concentration is clear: a small cadre of AI infrastructure names and energy plays that the fund believes will capture the surge in demand for AI workloads.
Key takeaways
- The Q4 2025 13F shows Situational Awareness with roughly $5.52 billion in US equity holdings across 29 positions, signaling a deliberate tilt toward AI infrastructure and energy‑intensive compute.
- Top holdings include CoreWeave, Bloom Energy, Intel, Lumentum, and Core Scientific, reflecting a strategy anchored in data center capacity and related hardware ecosystems.
- The amended Schedule 13D reveals a 9.4% stake in Core Scientific, amounting to 28,756,478 shares with shared voting and disposition power, indicating a levered view on the company’s expansion into AI hosting and HPC environments.
- Beyond pure mining, the fund has increased exposure to Bitcoin miners and energy players such as IREN, Cipher Mining, Riot Platforms, Bitdeer, and Applied Digital, signaling a broader bets on AI compute throughput via specialized energy infrastructure.
- Aschenbrenner’s strategy also includes a noted short in Infosys, reflecting a view that large‑language model adoption and AI coding tools could pressure traditional outsourcing software services models.
Tickers mentioned: $BTC
Market context: The shift underscores a growing convergence between crypto mining and AI compute ecosystems, where megawatt‑dense sites and long‑term data‑center arrangements are increasingly treated as scarce, high‑value assets in the new compute economy.
Sentiment: Neutral
Price impact: Neutral. The moves reflect strategic positioning in a sector undergoing structural changes rather than immediate price catalysts.
Trading idea (Not Financial Advice): Hold. The cross‑section of AI infrastructure and mining assets suggests exposure to broader compute demand, but the concentration in a handful of names warrants careful risk management.
Market context: The AI compute narrative is evolving from a focus on chip supply and software models to ownership of the physical and energy assets that enable massive data‑center deployments. The post‑halving environment has encouraged miners to pivot toward hosting AI workloads, recasting megawatts and data‑center capacity as strategic assets rather than mere hash rate capacity.
Why it matters
The portfolio strategy signals a shift in how investors view AI reverberations across sectors. By placing heavy bets on AI infrastructure players like CoreWeave and Bloom Energy, the fund aligns with the premise that the next era of AI growth will be defined by the reliability and scalability of compute foundations. CoreWeave, a major AI cloud firm, has pursued long‑term HPC hosting contracts, reinforcing the idea that enterprise‑grade compute capacity will anchor AI deployment for years to come. That dynamic is echoed in the fund’s positioning around Core Scientific and other miners‑turned‑infrastructure operators, highlighting a broader trend where mining assets are repurposed as high‑density compute farms capable of supporting AI workloads.
Moreover, the mix of energy‑oriented firms with traditional chip and optics players points to a convergence of energy efficiency, power reliability, and advanced hardware as the bedrock of AI scalability. The emphasis on Bloom Energy and similar energy infrastructure names acknowledges that the economics of AI compute increasingly hinge on dependable, low‑cost power and resilient facilities. In this context, the bitcoin ecosystem—often used as a proxy for large‑scale, independent energy demand—appears intertwined with broader infrastructure plays, rather than living in its own isolated corner of markets. Bitcoin (CRYPTO: BTC) remains a barometer for how much compute demand miners can leverage, particularly as large data centers seek to optimize energy intensity and uptime amid rising competition for grid capacity.
The presence of a substantial Core Scientific stake via an amended Schedule 13D demonstrates the degree to which the fund leverages governance and ownership rights to influence a company’s expansion into AI hosting and HPC. This move aligns with a broader industry pattern where miners diversify beyond hashing to become multipurpose data‑center operators that can monetize surplus capacity across AI workloads, rendering traditional hash rate metrics less decisive in evaluating value creation.
Finally, the Infosys short reflects an acceleration of AI coding tools and large‑language models that, in the hedge fund’s view, could erode the traditional outsourcing model long relied upon by software services giants. If AI tools increasingly curtail demand for routine outsourcing tasks, equities tied to that segment may face new headwinds, even as AI infrastructure assets benefit from expanding compute demand. The net effect is a nuanced stance: bets that the core compute economy—powered by energy, data centers, and HPC—will drive durable value, tempered by selective shorts on areas perceived as vulnerable to AI displacement.
What to watch next
- Next 13F filing cycles (early 2026) to reveal whether the $5.5B positioning is sustained or expanded across additional AI infrastructure names.
- Any new or amended Schedule 13D/13G disclosures around Core Scientific or other holdings, signaling shifts in control or strategy.
- Updates on long‑term HPC contracts and data‑center expansions tied to CoreWeave and similar operators, which would validate the thesis of AI hosting as a growth engine.
- Further moves in mining‑to‑infrastructure transitions, including additional energy‑asset investments from the broader field, and how such moves interact with regulatory and grid‑capacity constraints.
- Regulatory or policy developments affecting large‑scale AI compute deployments and crypto mining operations, which could influence capital flows into AI infrastructure equities.
Sources & verification
- Situational Awareness 13F Filing, Q4 2025 — 13f.info
- Amended Schedule 13D for Core Scientific — filing PDF
- Fortune profile on Leopold Aschenbrenner and the fund’s size — fortune.com
- Hut 8 research/coverage on AI data center pivot and compute revenue — cointelegraph.com
- CoreWeave and AI data center partnerships — cointelegraph.com
Market reaction and key details
Situational Awareness has built a narrative around a recalibration of AI investment risk, moving from a focus on peak‑AI software potential to the tangible, capital‑intensive backbone that makes AI feasible at scale. The 13F results highlight how a single fund can tilt an entire sub‑sector toward a handful of strategic names, elevating the importance of long‑term contracts, energy reliability, and data‑center capacity in determining which players benefit most from the AI era. While the broader market continues to wrestle with volatility and regulatory questions, the fund’s emphasis on compute infrastructure—paired with a measured portfolio tilt toward miners pivoting to AI hosting—illustrates a disciplined approach to navigating the evolving landscape of AI, crypto, and high‑performance computing.
What to watch next


Crypto exchange Kraken has become the first digital asset company to secure access to the Federal Reserve’s core payments infrastructure.
This marks a watershed moment in the integration of crypto into the U.S. financial system, even as the exchange eyes a public listing.
Kraken Becomes First Crypto Firm to Win Access to Fed’s Core Payments System
According to a report by The Wall Street Journal, Kraken’s Wyoming-chartered banking arm, Kraken Financial, has been granted a so-called “master account” at the Federal Reserve.
The approval gives the firm direct access to the same payment rails used by thousands of U.S. banks and credit unions to move money across the financial system.
The move allows Kraken Financial to settle U.S. dollar transactions directly through the Fed’s infrastructure, rather than relying on intermediary banks.
Notably, the firm will not receive the full suite of services traditional banks enjoy, such as earning interest on reserves held at the central bank.
Still, the approval represents a significant breakthrough for an industry that has long struggled to access core banking plumbing.
“This is a watershed milestone in the history of digital assets,” WSJ reported, citing Senator Cynthia Lummis, a vocal advocate for crypto innovation.
From Wyoming Bank Charter to Fed Master Account: Kraken’s Long March Toward Wall Street Legitimacy
The development builds on groundwork laid in 2020, when Kraken became the first digital asset company in U.S. history to receive a bank charter recognized under federal and state law.
The firm obtained a Special Purpose Depository Institution (SPDI) charter from Wyoming. This enabled it to offer regulated deposit-taking, custody, and fiduciary services tailored to blockchain companies.
“Our vision is to become the world’s trusted bridge between the crypto economy of the future and today’s existing financial ecosystem,” Kraken said at the time.
Access to a Fed master account significantly advances that vision.
Direct settlement capability could allow Kraken to handle transactions more quickly and seamlessly for institutional clients and professional traders. This reduces counterparty risk and operational friction.
The approval also lands at a politically favorable moment. Under President Donald Trump, who has pledged to make the U.S. the “crypto capital of the world,” regulatory attitudes toward digital assets have shifted markedly compared to prior years.
Now, there are more industry-friendly appointments and legislative momentum around crypto frameworks.
What It Means for Kraken’s Prospective IPO
Strategically, the milestone could strengthen Kraken’s positioning ahead of a widely anticipated initial public offering.
The exchange has been expanding aggressively, completing six acquisitions in roughly a year. The company is reportedly targeting a $500 million raise at a valuation of around $15 billion.
Direct access to the Fed’s payments system enhances Kraken’s institutional credibility at a pivotal time.
For prospective IPO investors, the combination of a bank charter, expanding product suite, and now direct integration with U.S. monetary infrastructure may make the exchange’s public debut more compelling.
Still, questions remain over whether quick acquisition-driven growth translates into durable revenue momentum.
Notwithstanding, with Fed access secured, Kraken has undeniably crossed a line that crypto firms have spent years trying to reach. It has brought digital assets one step closer to the heart of the U.S. financial system.

Bitcoin price pushed back above $71,000 on Wednesday, defying geopolitical jitters tied to escalating Middle East tensions and a spike in global oil prices, as on-chain data suggests selling pressure may be drying up.
Summary
- Bitcoin rose above $71,000, gaining over 5% and challenging the upper end of its recent consolidation range.
- Exchange inflows dropped to 28,235 BTC, a level historically linked to reduced selling pressure and potential accumulation phases.
- Technical indicators such as Balance of Power turning positive suggest short-term buyer momentum is strengthening.
Bitcoin seller exhaustion? Exchange flows fall to near-cycle lows
According to analysis from CryptoQuant, the recent military intervention in Iran sent shockwaves through energy markets, with WTI crude jumping above $75 and Brent topping $82 after successive 6% gains. While the broader macro backdrop remains fragile and the bear market structure technically intact, Bitcoin has shown notable relative strength.
At the time of the CryptoQuant assessment, Bitcoin (BTC) was trading near $68,637 and approaching what analysts describe as an accumulation zone. A key metric backing that thesis is Exchange Inflow, the amount of BTC transferred to exchanges, often a precursor to selling.
Historically, readings below 40,000 BTC have coincided with weak selling pressure and market bottoms, while levels above 90,000 BTC have marked cycle tops.
On March 3, 2026, exchange inflows registered just 28,235 BTC, dramatically lower than prior cycle highs that ranged between 97,587 BTC and 134,619 BTC. The subdued inflow suggests sellers may be exhausted, even as global instability persists.
Bitcoin price action and key levels
Based on the attached daily chart, Bitcoin is currently trading around $71,795 after posting a strong green daily candle, up more than 5%. The move follows a sharp correction from late January highs near $95,000, with price finding a local bottom in early February around the $63,000–$65,000 region.
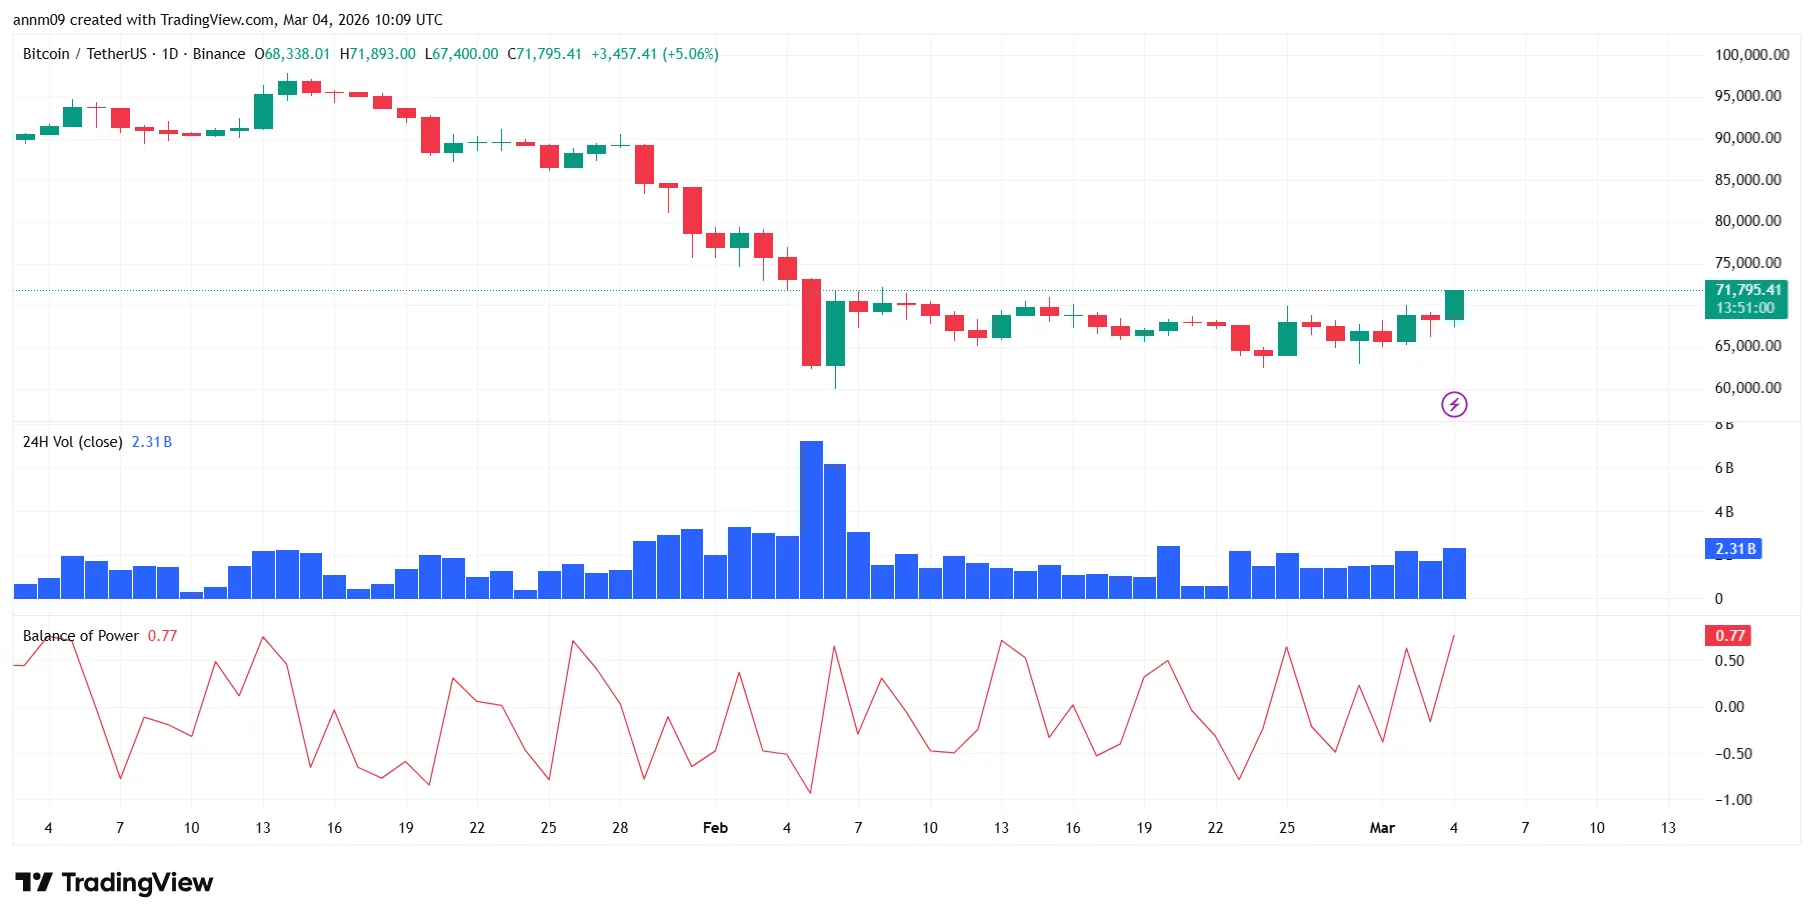
Since that capitulation-style drop, Bitcoin has been consolidating in a broad range between roughly $65,000 support and $72,000 resistance. The recent breakout attempt above $71,000 puts price back near the upper boundary of this consolidation band.
Immediate resistance now sits around $72,000–$73,000, followed by the heavier supply zone near $78,000–$80,000, where prior breakdown momentum accelerated. On the downside, first support lies at $68,000, with stronger structural support near $65,000.
A loss of that level would reopen the path toward the February low near $63,000.
Volume has picked up modestly on the recent rebound, though it remains below the spike seen during the early February sell-off.
Meanwhile, the Balance of Power indicator has turned positive, currently reading around 0.77, signaling buyers are gaining short-term control after weeks of sideways churn.
While the broader macro picture remains uncertain, Bitcoin’s ability to rally through geopolitical stress, combined with low exchange inflows, suggests the market may be transitioning from distribution to early-stage accumulation.
A decisive daily close above the $72,000–$73,000 zone would strengthen the case for a broader recovery attempt.
Peer-to-peer transfers made through self-custody crypto wallets are a key weak point in the stablecoin ecosystem because they can take place without a regulated intermediary, the Financial Action Task Force (FATF) said in a new report urging countries to tighten oversight as stablecoins spread into payments and cross-border transfers.
In its targeted report on stablecoins, unhosted wallets and P2P transactions, the global anti-money laundering watchdog said transactions conducted directly between users through unhosted wallets can occur without regulated intermediaries such as exchanges or custodians.
The FATF said this structure can create gaps in Anti-Money Laundering (AML) oversight because the transactions occur outside entities required to monitor activity and report suspicious transfers. The report highlighted growing regulatory attention on stablecoins as their use expands across trading, payments and cross-border transfers.
The watchdog called on jurisdictions to assess the risks created by stablecoin arrangements and apply “proportionate” mitigation measures, which can include enhanced monitoring when self-custody wallets interact with regulated platforms and clearer AML and counterterrorism financing obligations for entities involved in issuing and distributing stablecoins.
P2P stablecoin transfers seen as regulatory blind spot
The FATF said P2P transfers via self-custody wallets represent a “key vulnerability” because they can bypass AML controls typically enforced by regulated intermediaries.
These transfers occur directly between users without the involvement of virtual asset service providers (VASPs) or financial institutions subject to compliance obligations, potentially limiting authorities’ ability to detect suspicious activity.
Related: Stablecoins, sanctions and surveillance: Why 2025 reshaped crypto’s regulatory reality
The FATF noted that transactions on public blockchains remain traceable because activity is recorded on-chain. However, the pseudonymous nature of wallet addresses can make attribution more difficult.
Related: France arrests six suspects over crypto ransom kidnapping of magistrate
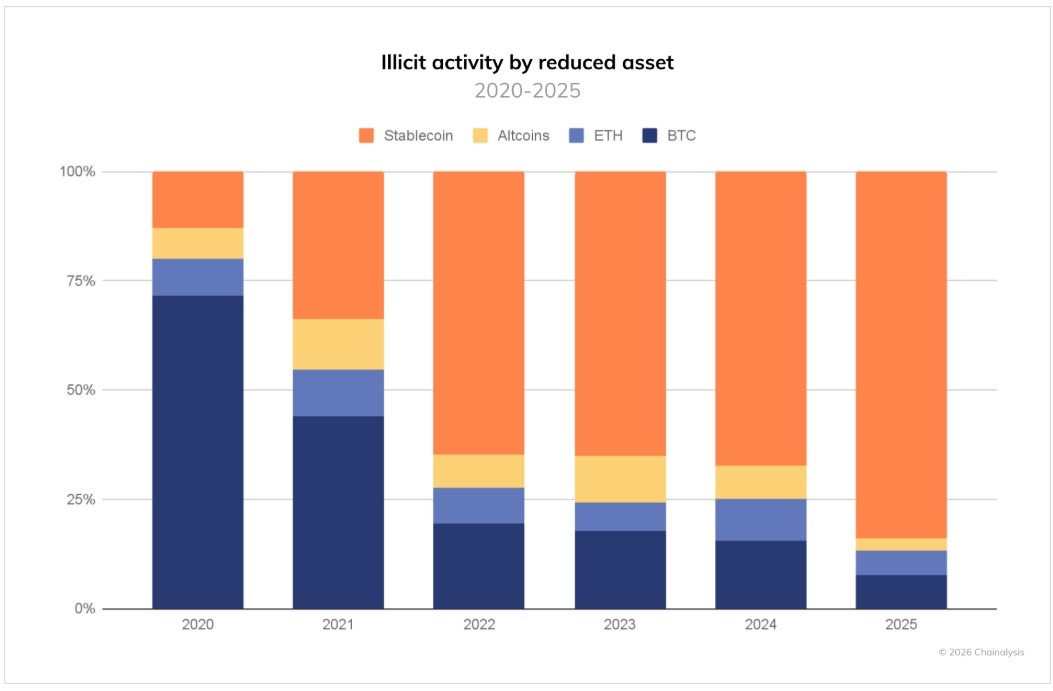
Illicit activity accounts for only 1% of the total crypto transaction volume
On Jan. 9, blockchain analytics firm Chainalysis found that illicit crypto addresses received at least $154 billion in 2025, with stablecoins accounting for 84% of illicit transaction volume.
The FATF reiterated the stat in its report, emphasizing the current usage of stablecoins in illicit transactions.

Chainalysis said illicit activity remains a small share of total on-chain volume, even as absolute dollar totals rose.
In the same report, Chainalysis said illicit transactions accounted for less than 1% of the total crypto transaction volume.
Magazine: Hong Kong stablecoins in Q1, BitConnect kidnapping arrests: Asia Express
McLaughlin: How Do Ducks Recruit HS QBs in Portal Era?

#savepunarvika clg stundents tho kalisi money collect chesam #raju #helping #yt #videos #savelife
Future of Freeview in the balance amid fears it will be ‘switched off’


-

 Politics5 days ago
ITV enters Gaza with IDF amid ongoing genocide
-

 Politics1 day ago
Alan Cumming Brands Baftas Ceremony A ‘Triggering S**tshow’
-

 Fashion5 days ago
Weekend Open Thread: Iris Top
-

 Tech3 days ago
Unihertz’s Titan 2 Elite Arrives Just as Physical Keyboards Refuse to Fade Away
-

 NewsBeat6 days ago
Cuba says its forces have killed four on US-registered speedboat | World News
-
Sports4 days ago
The Vikings Need a Duck
-
 NewsBeat4 days ago
Dubai flights cancelled as Brit told airspace closed ’10 minutes after boarding’
-
 NewsBeat7 days ago
Manchester Central Mosque issues statement as it imposes new measures ‘with immediate effect’ after armed men enter
-

 NewsBeat3 days ago
‘Significant’ damage to boarded-up Horden house after fire
-
 NewsBeat4 days ago
The empty pub on busy Cambridge road that has been boarded up for years
-

 NewsBeat4 days ago
Abusive parents will now be treated like sex offenders and placed on a ‘child cruelty register’ | News UK
-

 Business6 days ago
Discord Pushes Implementation of Global Age Checks to Second Half of 2026
-

 Entertainment2 days ago
Baby Gear Guide: Strollers, Car Seats
-

 Business6 days ago
Only 4% of women globally reside in countries that offer almost complete legal equality
-
 Tech5 days ago
NASA Reveals Identity of Astronaut Who Suffered Medical Incident Aboard ISS
-
Politics3 days ago
FIFA hypocrisy after Israel murder over 400 Palestinian footballers
-
 NewsBeat3 days ago
Emirates confirms when flights will resume amid Dubai airport chaos
-

 Crypto World6 days ago
From Crypto Treasury to RWA: ETHZilla Retreats and Relaunches as Forum Markets on Nasdaq
-

 NewsBeat2 days ago
Is it acceptable to comment on the appearance of strangers in public? Readers discuss
-

 Tech3 days ago
Viral ad shows aged Musk, Altman, and Bezos using jobless humans to power AI