
Crypto World
XRP Price Falls 30% as On-Chain Signals Point to Potential Bottom

XRP (XRP) has fallen more than 30% over the past month, pressured by a broader market downturn that intensified amid escalating geopolitical tensions and renewed tariff concerns.
At the same time, realized losses have spiked, and exchange inflows have increased sharply. These on-chain signals suggest growing market stress for the altcoin. However, with capitulation metrics rising, the question is whether a potential bottom is forming.
XRP Struggles Amid Large Holder Transfers and Rising Realized Losses
Large holder activity has heightened concern over XRP’s near-term price outlook. Analyst Darkfost noted that these holders transferred more than 31 million XRP to Binance in one day, amounting to about $45 million in potential sell pressure.
On-chain data showed that the bulk of these transfers originated from larger holder cohorts. Whale wallets holding over 1 million XRP accounted for 14.49 million XRP of the total inflow.
Wallets holding between 100,000 and 1 million XRP contributed 14.236 million XRP. Smaller cohorts contributed comparatively modest amounts, including 2.9 million XRP from wallets holding 10,000 to 100,000 tokens.
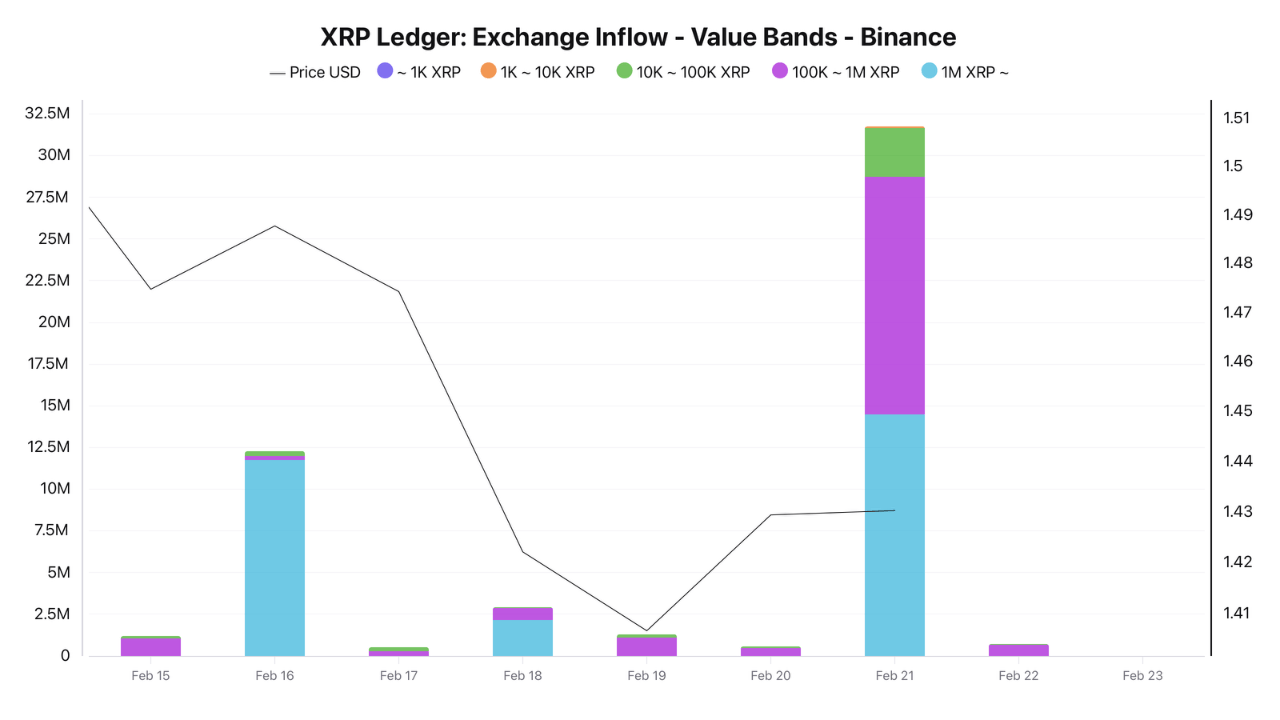
The concentration of inflows among large holders is noteworthy. Exchange flows of this size typically raise concerns about potential selling pressure, as transfers to centralized platforms may indicate that tokens are being positioned for possible liquidation.
However, it is important to note that simple transfers to exchanges do not confirm that sales will occur. Tokens can remain idle on trading platforms for extended periods, be used as collateral, or be moved for internal rebalancing purposes.
While the inflows increase the risk of near-term volatility, they do not guarantee immediate downside.
“Altogether, this represents a sudden potential sell-side pressure of nearly $45 million that warrants close monitoring. Should this selling pressure persist, XRP may struggle to recover from its ongoing correction in the near term,” the analyst wrote.
Meanwhile, the transfers coincide with growing stress among XRP holders. Data from Santiment shows that XRP’s realized losses have climbed to their highest level since 2022.
Such spikes typically occur when investors sell at prices below their cost basis, reflecting capitulation or panic-driven exits during periods of heightened volatility.
Further reinforcing the cautious outlook, institutional demand appears to be cooling. This is evidenced by the declining XRP ETF inflows.
Even with strategic expansions and ecosystem development, XRP has struggled to decouple from the wider market weakness, suggesting that macro conditions continue to outweigh project-specific progress.
Is XRP Nearing a Bottom? On-Chain Data Points to Capitulation Phase
Despite the spike in XRP realized losses, Santiment noted that such developments serve as an “important price signal.” The post added that historically, these spikes often appear near market bottoms.
Santiment explained that extreme fear tends to peak before the price. Once selling pressure becomes exhausted, even modest new demand can drive a rebound. While this does not guarantee an immediate rally, it increases the probability of a relief bounce.
“When the previous weekly milestone of -1.93B in realized losses occurred 39 months ago, $XRP proceeded to jump +114% over the next 8 months,” the post read.
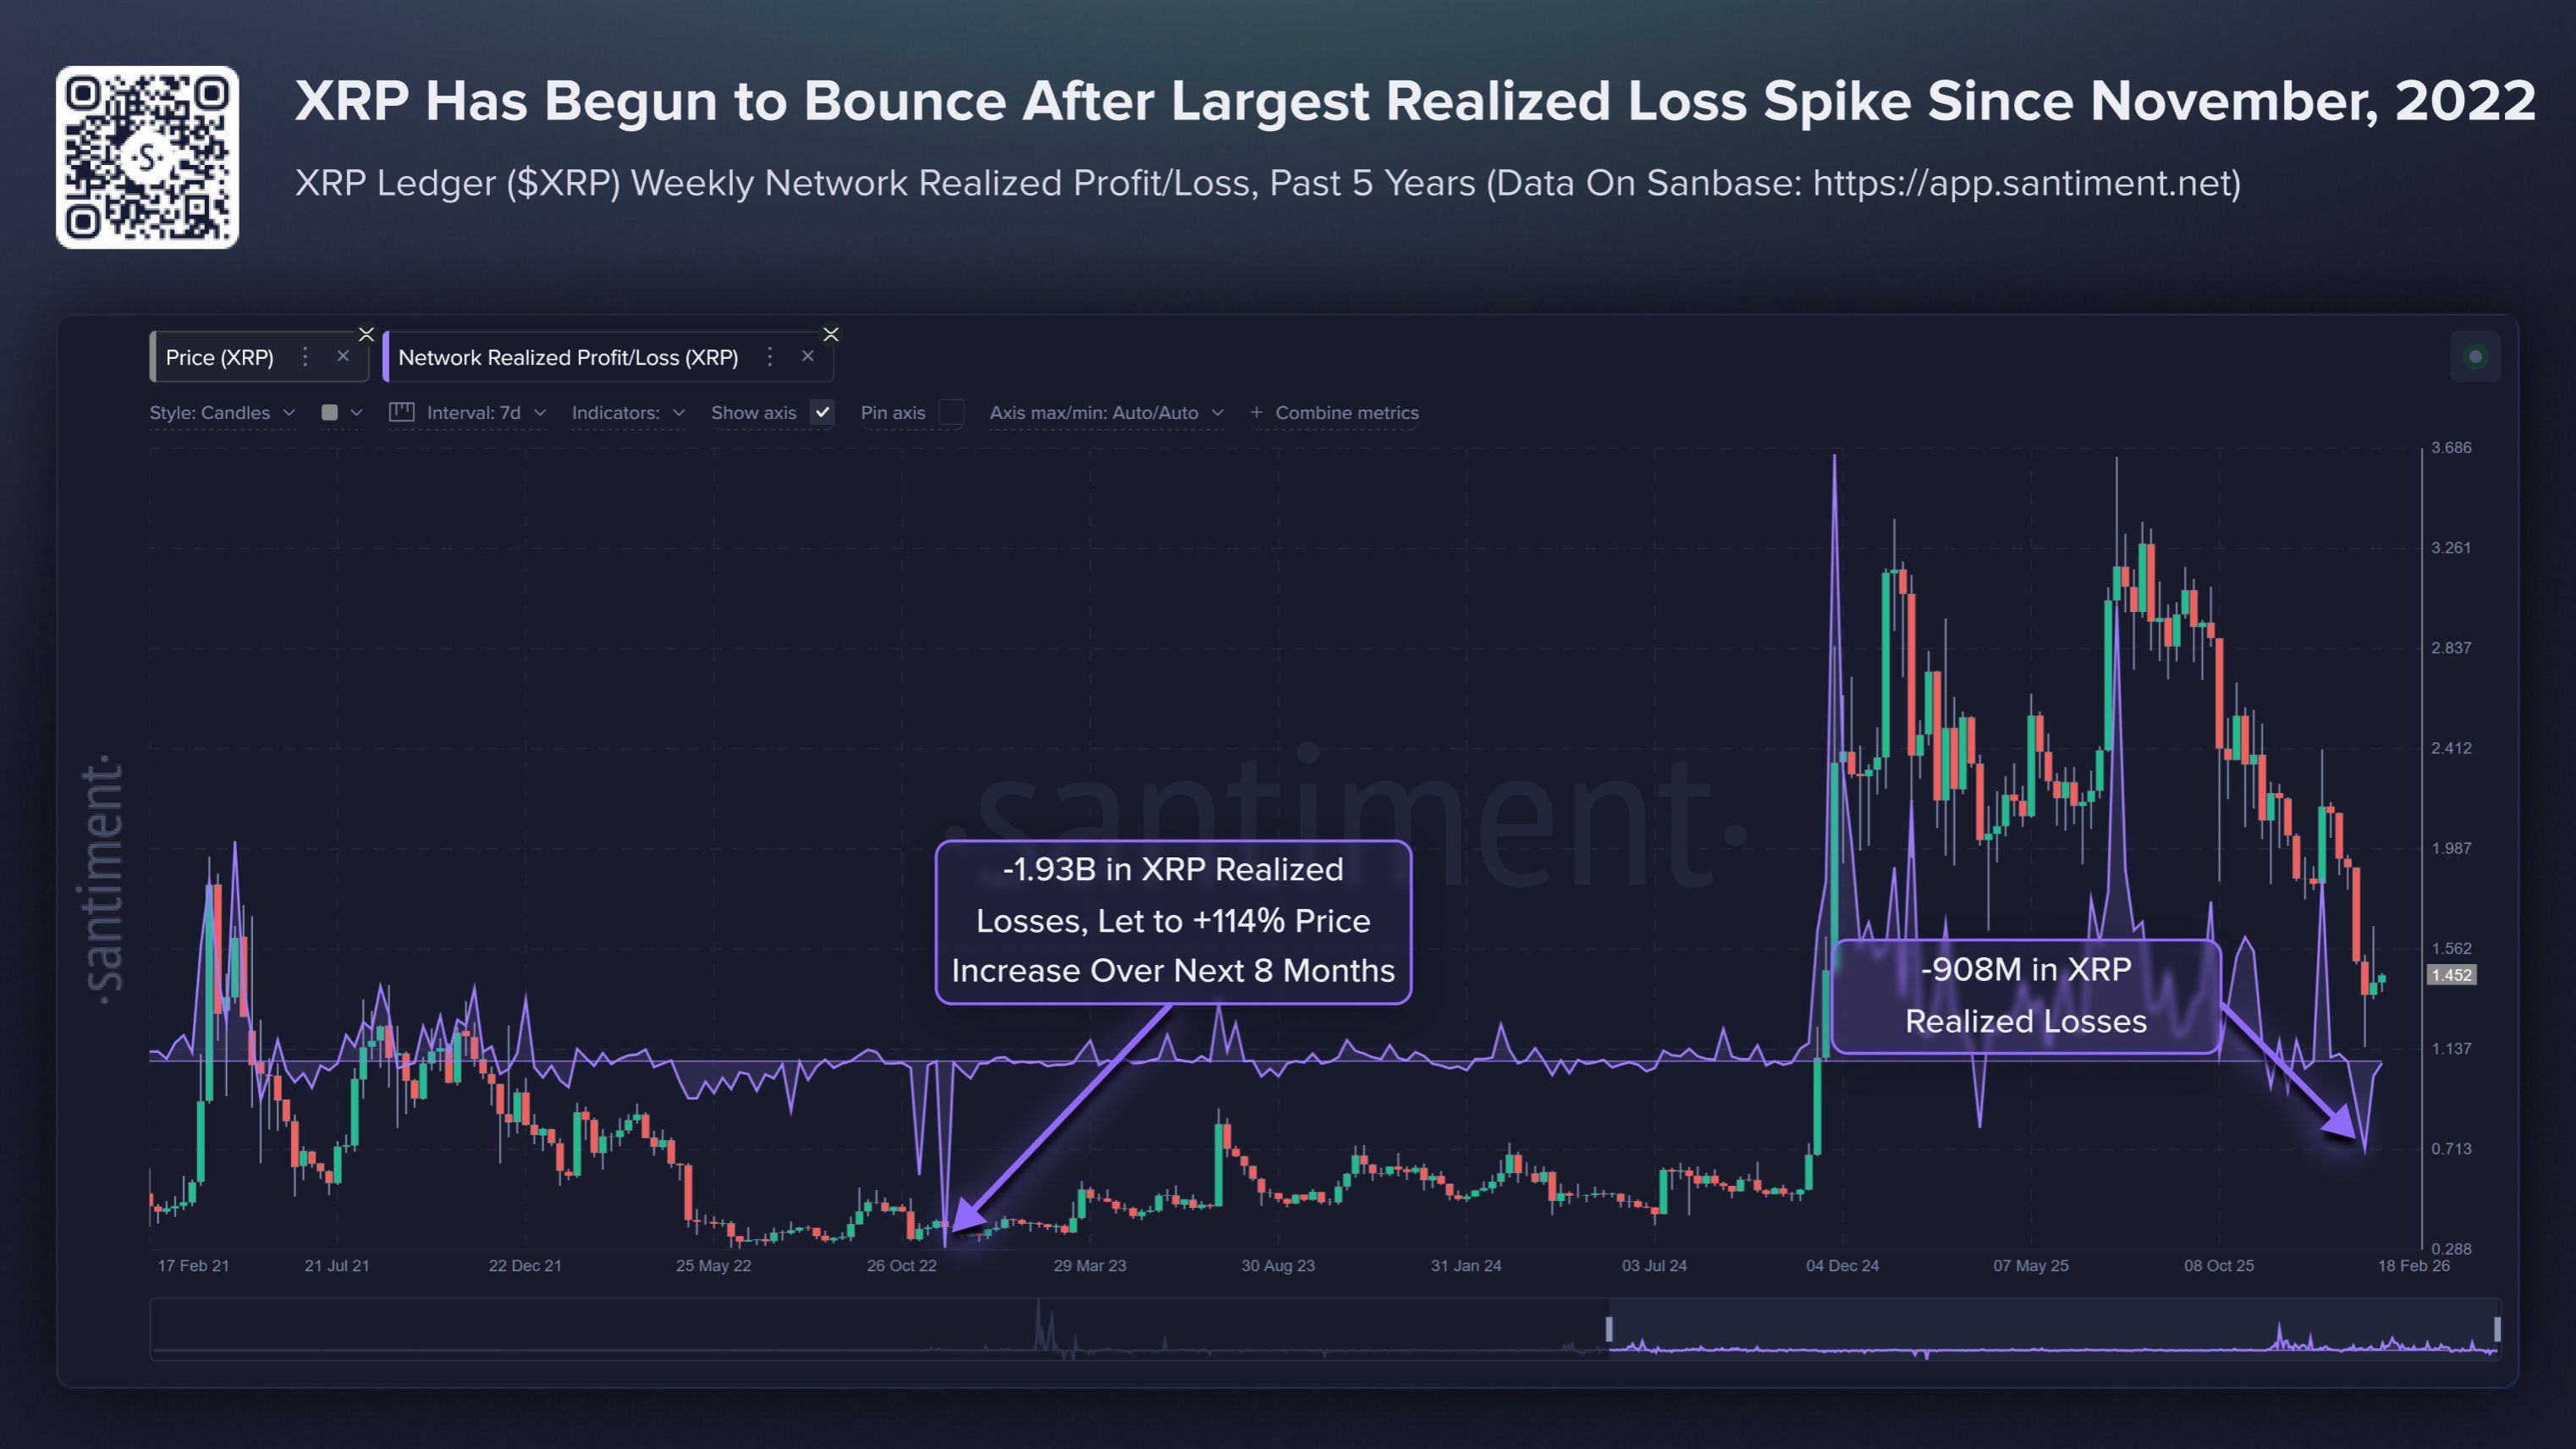
In addition, BeInCrypto recently highlighted that the Market Value to Realized Value (MVRV) is mirroring a setup last observed in July 2024. This was followed by a price rally.
That said, historical precedents should be interpreted cautiously. Market structure, liquidity conditions, and macroeconomic factors differ across cycles.

Bitcoin (BTC) stayed near a key long-term trend line at Tuesday’s Wall Street open as markets waited for US-Iran war cues.
Key points:
-
Bitcoin and US stocks attempt to shrug off claims by US President Donald Trump that a “whole civilization will die” after his Iran deadline expires.
-
Oil eyes a rematch with multiyear highs as escalation fears take control.
-
Bitcoin traders see lower levels resulting from current indecision.
Bitcoin attempts to ignore Trump Iran comments
Data from TradingView showed BTC price action focusing on its 200-week exponential moving average (EMA) near $68,300.

Volatility briefly entered prior to the US trading session as President Donald Trump said that “a whole civilization will die tonight,” referring to his 8pm Eastern time deadline for a deal with Iran.
“I don’t want that to happen, but it probably will,” he wrote in a post on Truth Social, while keeping full details sparse.

The post was accompanied by news of strikes on Iranian oil infrastructure on Kharg Island.
Despite this, US stocks managed to avoid major losses on the day, leading commentators to suggest that Iran rhetoric was all but fully priced in.
“Markets have become numb to the headlines,” trading resource The Kobeissi Letter reacted on X.

The day prior, trading company QCP Capital noted that the same geopolitical pattern had been playing out for weeks.
“While the economic and humanitarian consequences of escalation would be severe, particularly via energy market disruption, markets are increasingly discounting the immediacy of this risk,” it wrote in its latest “Market Color” analysis.
QCP described stocks as “broadly stable,” with crypto showing “resilience.”
“After several weeks of weekend escalation rhetoric followed by early-week de-escalation signals, markets are beginning to recognise and fade this pattern,” it continued.
“Despite approaching deadlines and rising rhetoric, crypto markets continue to exhibit resilience rather than panic.”

WTI crude oil nonetheless passed $116 per barrel on the day, coiling below its highest levels in nearly four years.
BTC price surfs liquidity walls
Commenting on Bitcoin and wider market trajectory, crypto trader Michaël Van de Poppe suggested that an inflection point was coming.
Related: Bitcoin RSI ‘nearly perfectly’ copying end of 2022 bear market: Analysis
“Prime question for this is likely whether there will be a ceasefire in the Middle-East or not,” he told X followers.
“From a technical standpoint, it’s more likely that markets are turning downwards as the trend is clearly in that direction and (as I’ve mentioned earlier), sweeping the lows and grabbing that liquidity strengthens a potential reversal on the markets significantly.”

Trader LP flagged overhead resistance making $72,000 a problematic hurdle to clear for bulls.
“Orderbook pressure showed strong buy pressure between 63–66K, which helped drive price toward the 70K region. However, sell pressure is now stepping in around 71–72K, acting as resistance and potentially capping price if it persists,” an X post read.

This article is produced in accordance with Cointelegraph’s Editorial Policy and is intended for informational purposes only. It does not constitute investment advice or recommendations. All investments and trades carry risk; readers are encouraged to conduct independent research before making any decisions. Cointelegraph makes no guarantees regarding the accuracy or completeness of the information presented, including forward-looking statements, and will not be liable for any loss or damage arising from reliance on this content.
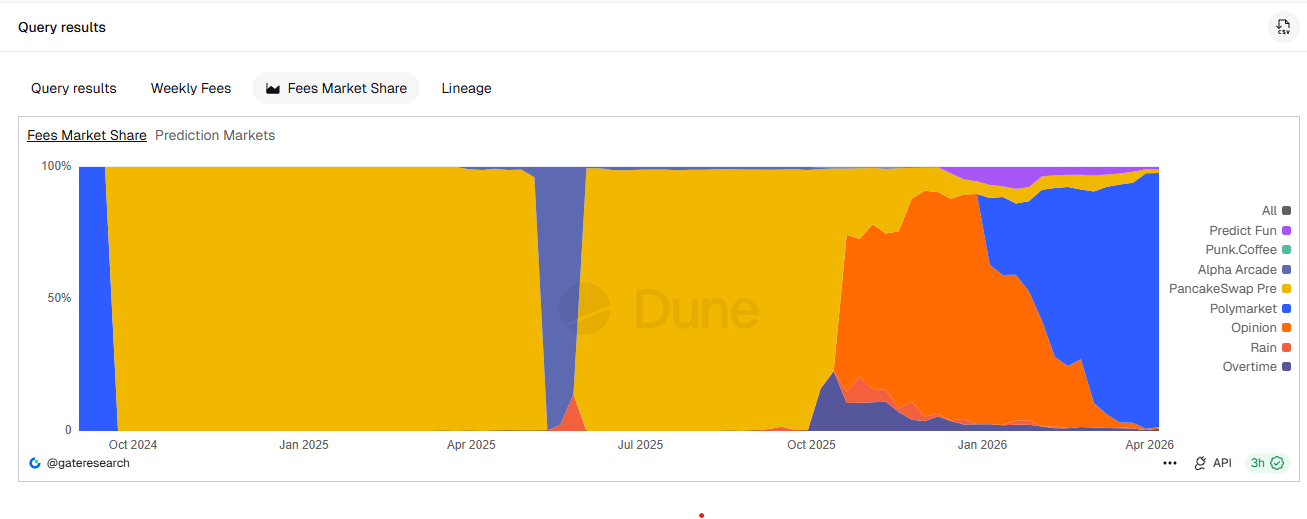
Polymarket has become one of decentralized finance’s most profitable protocols after a pricing overhaul, generating about $7.1 million in fees in the first week of the second quarter, according to new data.
That pace implies an annualized run rate of roughly $365 million if sustained, placing the onchain prediction platform among the industry’s top fee generators and giving it nearly all of the sector’s revenue, at 96.8% of onchain prediction market fees.
The gains follow a March 30 pricing change that pushed daily fees to around $1 million, a level that has largely held as trading activity remains elevated, data from DeFiLlama shows, and make Polymarket the eighth-largest DeFi protocol by fees, along with stablecoin issuers Circle (USDC) and Tether (USDT) and decentralized derivatives exchange Hyperliquid.
Onchain metrics also show Polymarket’s footprint beyond fees. Total value locked on the platform was over $432 million on Tuesday, according to DeFiLlama data, close to its November 2024 US election high of around $510 million, as its share of onchain prediction market revenue rises.

ICE backs Polymarket, but regulation uncertainty remains
Polymarket’s fee engine has started to attract more mainstream partners. Intercontinental Exchange, the owner of the New York Stock Exchange, deepened its bet on Polymarket on March 27, completing a $600 million cash investment as part of a broader $2 billion commitment that will see ICE distribute the platform’s event-driven data to institutional clients.
Related: Iran war bets turn prediction markets into real-time macro radar: Sygnum
At the infrastructure level, Polymarket announced Monday that it is replacing its bridged USDC.e collateral on Polygon with a new 1:1 USDC-backed token called Polymarket USD, which will take over as trading collateral as part of the platform’s April exchange upgrade, as it continues to spin up highly-traded markets on the US-Iran conflict, oil, inflation and equities indices.
Despite its growing revenue, regulation remains a risk. Prediction markets continue to face pushback from some US states and gambling regulators elsewhere, including recent moves by Hungary and Portugal to order local blocking, and Argentina issuing a countrywide block on Polymarket, arguing that the platform operates as an unlicensed gambling site.
Magazine: Bitcoin’s ‘biggest bull catalyst’ would be Saylor’s liquidation — Santiment founder
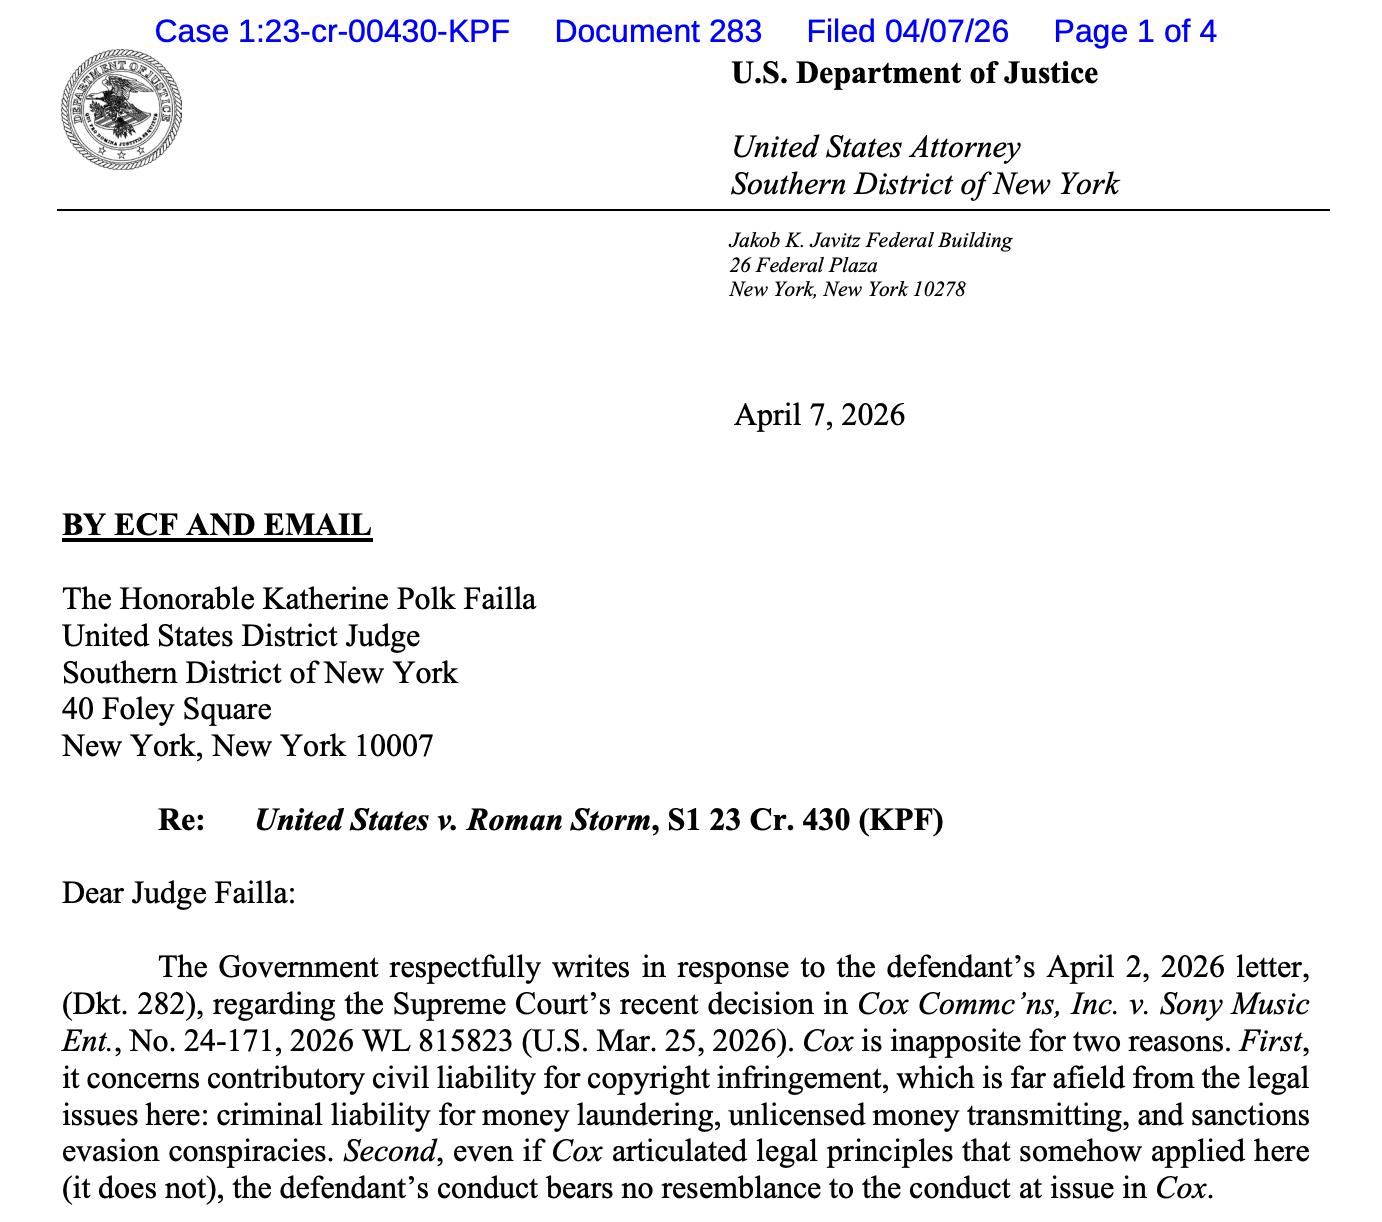
Jay Clayton, the US Attorney for the Southern District of New York (SDNY) and former chair of the Securities and Exchange Commission (SEC), has penned a response to Tornado Cash co-founder Roman Storm’s motion for acquittal, criticizing his alleged criminal behavior.
In a Tuesday filing in the US District Court for the Southern District of New York, Clayton said that Storm’s criminal use of Tornado Cash was “window dressing at best and outright misdirection at worst,” rejecting arguments that he be allowed to use a civil copyright case in his defense.
The US Attorney’s filing followed a Thursday notice from Storm’s lawyers saying they intended to use a 2026 Supreme Court case, Cox Communications, Inc. v. Sony Music Entertainment, as part of an argument about the Tornado Cash co-founder’s intent to participate in the crimes of which he is accused: conspiracy to commit money laundering and conspiracy to violate sanctions.
Clayton said that Storm’s conduct “bears no resemblance” to that in the Cox case, which involved civil liability for copyright infringement. According to the US Attorney, there was no evidence that the Tornado Cash co-founder implemented effective anti-money-laundering measures.
“The defendant’s conduct simply is not comparable to the conduct at issue in Cox,” said Clayton. “In any event, a civil copyright case has no relevance here in the first place.”

Last August, a jury convicted Storm of conspiracy to operate an unlicensed money transmitting business, but deadlocked on conspiracy to commit money laundering and conspiracy to violate sanctions charges, opening the door to a potential retrial. The case has drawn widespread attention from the crypto industry for how developers may be held responsible for their code.
Prosecutors and defense attorneys in the Storm case are scheduled to meet on Thursday.
Related: US lawmakers move to protect blockchain devs from prosecution
Attorney behind memo calling for end to crypto “regulation by prosecution” gets top DOJ job
Last week, US President Donald Trump fired Attorney General Pam Bondi, substituting Deputy AG Todd Blanche as acting head of the Justice Department until the Senate can vote on a replacement. Blanche, who previously acted as Trump’s personal attorney, also penned an April 2025 memo calling for the end of what he called “regulation by prosecution” in the Justice Department.
Although Blanche did not call out Storm by name, he did say that the department will “not pursue actions against the platforms that [criminal] enterprises utilize to conduct their illegal activities” and called for an end to cases inconsistent with that goal.
Storm cited Blanche’s memo in a March X post after prosecutors called to retry the Tornado Cash co-founder on the two deadlocked counts.
”The 2 counts = up to 40 years in federal prison,” said Storm. “For writing open-source code. For a protocol I don’t control. For transactions I never touched. A jury already couldn’t agree this was criminal. But the SDNY prosecutors want to keep trying with the hope of getting a different answer.”
It’s unclear how Blanche may use his new role to direct DOJ policy, or how long he will remain as acting AG. Clayton has asked a federal judge to consider an October retrial for Storm, but as of Tuesday, no date had been set.

Circle minted $1 billion USDC in 24 hours, extending a $4.5b year‑to‑date supply jump and signaling heavy institutional dollar demand across Solana and centralized venues.
Summary
- Circle minted $1 billion in new USDC over the past 24 hours, according to on‑chain data from Lookonchain.
- The pace and size of issuance point to institutional liquidity demand rather than retail activity.
- USDC remains the fastest‑growing major stablecoin in 2026, with net supply up about $4.5 billion year to date.
Circle has minted roughly $1 billion in new USD Coin (USDC) over the past 24 hours, a burst of issuance that signals a sharp, short‑term spike in demand for dollar liquidity across crypto rails, according to on‑chain analytics platform Lookonchain. TechFlow News, citing Lookonchain’s monitoring, reported that Circle executed two large mints totaling $500 million each, bringing 24‑hour issuance to $1 billion and adding to an already heavy minting pace on the Solana network in early 2026.
Lookonchain previously flagged similar surges, including a single‑day window where Circle minted about $1.25 billion USDC on Solana and another period where Circle and Tether together created roughly $17.25 billion in new stablecoins in the weeks following October 2025 market turbulence. OnchainLens data cited by Phemex shows Circle has minted about $3.25 billion in USDC on Solana alone over the past seven days, via repeated $250 million transactions, marking the issuer’s largest weekly stablecoin deployment on the network so far this year.
The cadence and scale of Circle’s latest $1 billion mint make it unlikely to be driven purely by fragmented retail flows. Past episodes where Circle printed $500 million to $1.25 billion in hours have typically coincided with major liquidity provisioning for centralized exchanges, ETF custodians or basis/arbitrage desks, rather than grassroots trading cycles. MEXC and KuCoin coverage of earlier Lookonchain alerts noted that fast, billion‑dollar issuance bursts often precede or accompany deeper order books and wider USDC routing across derivatives venues, lending markets and perpetual futures platforms.
More broadly, data compiled by Artemis and reported by Analytics Insight indicate that USDC has recorded the largest net stablecoin supply increase of 2026 so far, adding about $4.5 billion in circulating supply through March as rivals such as USDT saw net outflows of roughly $2 billion. A separate dashboard from MEXC shows USDC’s market cap near $73 billion, with 24‑hour trading volume around $4.48 billion and over 250 applications using USDC as base collateral or a primary trading pair, underscoring its role as regulated liquidity plumbing for both centralized and decentralized markets.
While Circle does not publicly pre‑announce client‑driven mints, the pattern fits several potential institutional use cases: ETF or centralized‑finance inventory replenishment, on‑chain basis and arbitrage strategies, or large over‑the‑counter (OTC) settlements that require immediate, programmatic dollar liquidity. CoinMarketCap’s research arm recently highlighted “massive USDC minting and inflows to exchanges like Binance,” arguing that such patterns “signal strong capital preparation for trading or deployment rather than speculative retail chasing.”
Coinfomania, covering a prior 750 million USDC mint that kicked off 2026 on Solana, framed these large issuances as “strong liquidity signals” that draw institutional attention to where fresh stablecoin capital is being parked and deployed. Combined with March data showing USDC leading all major stablecoins in net new supply, the latest $1 billion mint suggests that, at least for now, deep‑pocketed players are choosing Circle’s regulated dollar rails as their primary channel for moving size into crypto markets.
NVIDIA (NASDAQ: NVDA) stock price trades at $177.64 on the 2-day chart, up 5.31% over the past days but still down 6% year-to-date. April sits at a unique inflection for the stock. The Iran conflict could de-escalate within weeks, the FOMC meets on April 28-29 in what may be Jerome Powell’s final meeting as Chair, and pre-earnings positioning for the late May report begins building now.
The technical structure, options data, and institutional money flow each frame a different part of what April could deliver, and the causality between them narrows the range to two scenarios.
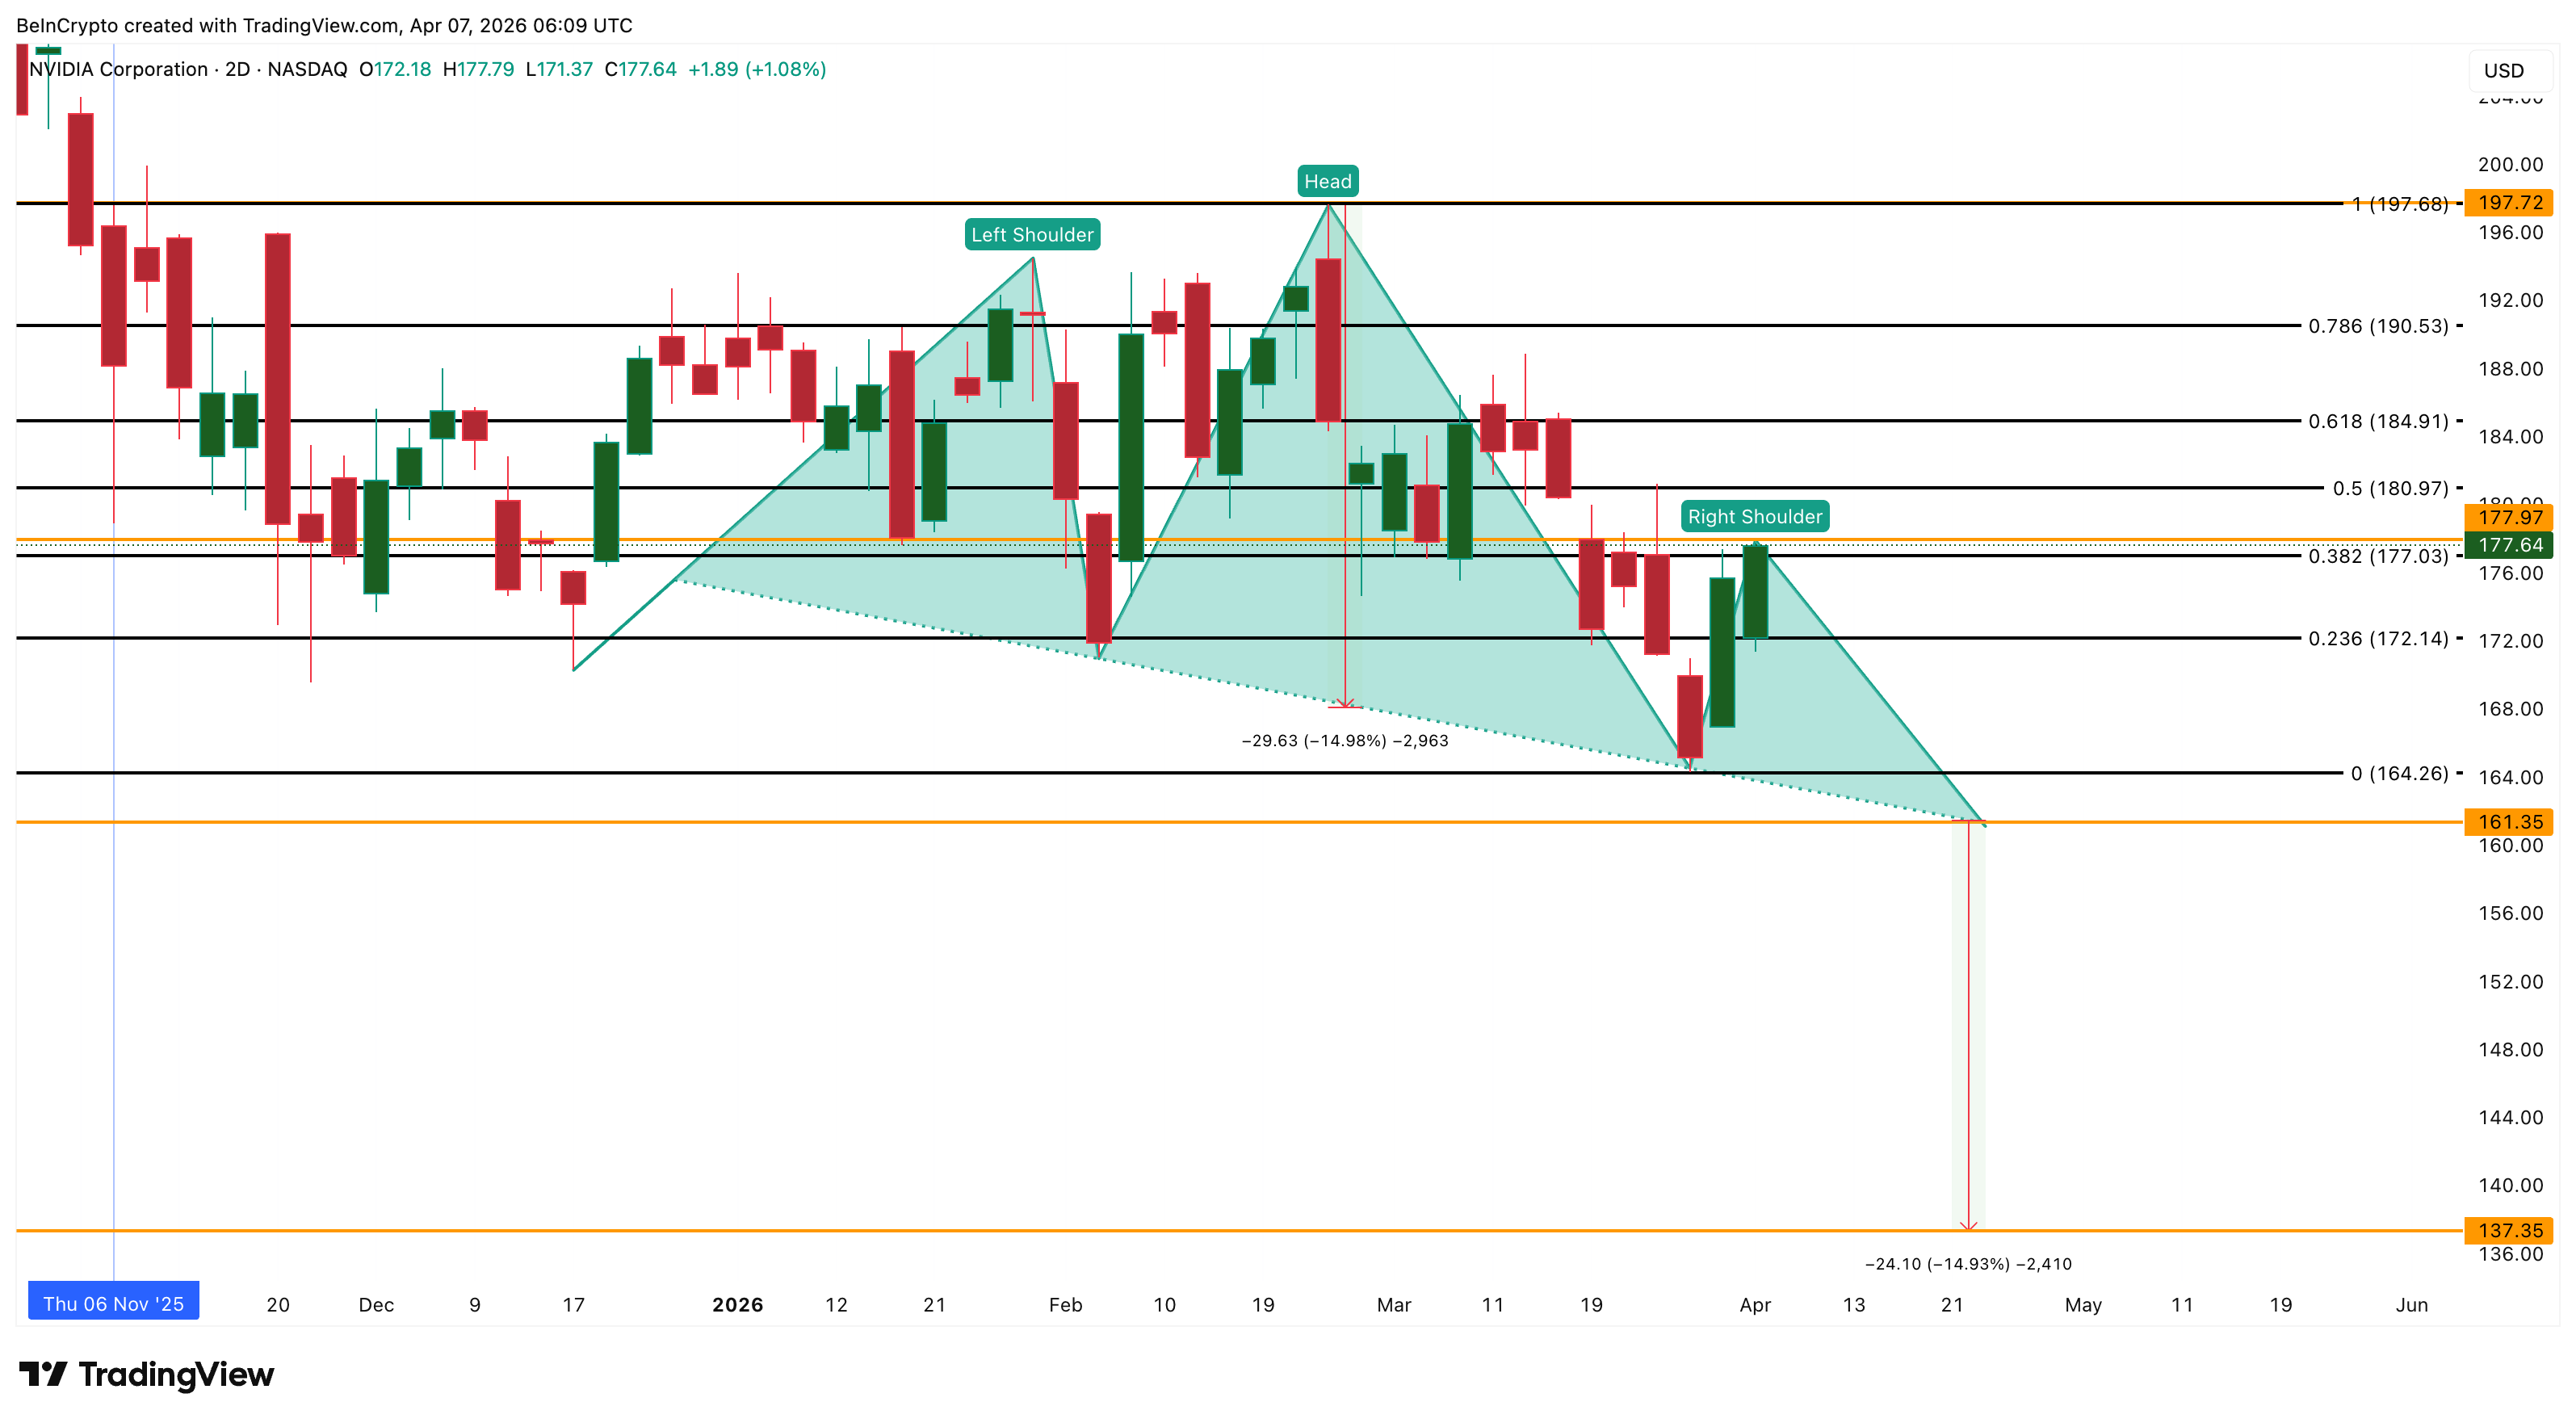
A Bearish Pattern With No Institutional Backing
The 2-day chart shows NVIDIA stock price trading inside a head and shoulders pattern. The head peaked at $197.72, a level reached on the last earnings day in late February. The right shoulder is currently building, and the pattern carries a 15% measured move if the neckline breaks.
Chaikin Money Flow (CMF), a proxy for institutional buying and selling pressure, reads -0.08. The indicator has stayed in negative territory for most of March and into April, confirming that big money has not backed the recent five-day bounce. CMF started trending upward around March 27 but has not crossed above the zero line. The last time it briefly turned positive was around the February 25 earnings release, and it quickly reversed.
Want more insights like this? Sign up for Editor Harsh Notariya’s Daily Newsletter here.
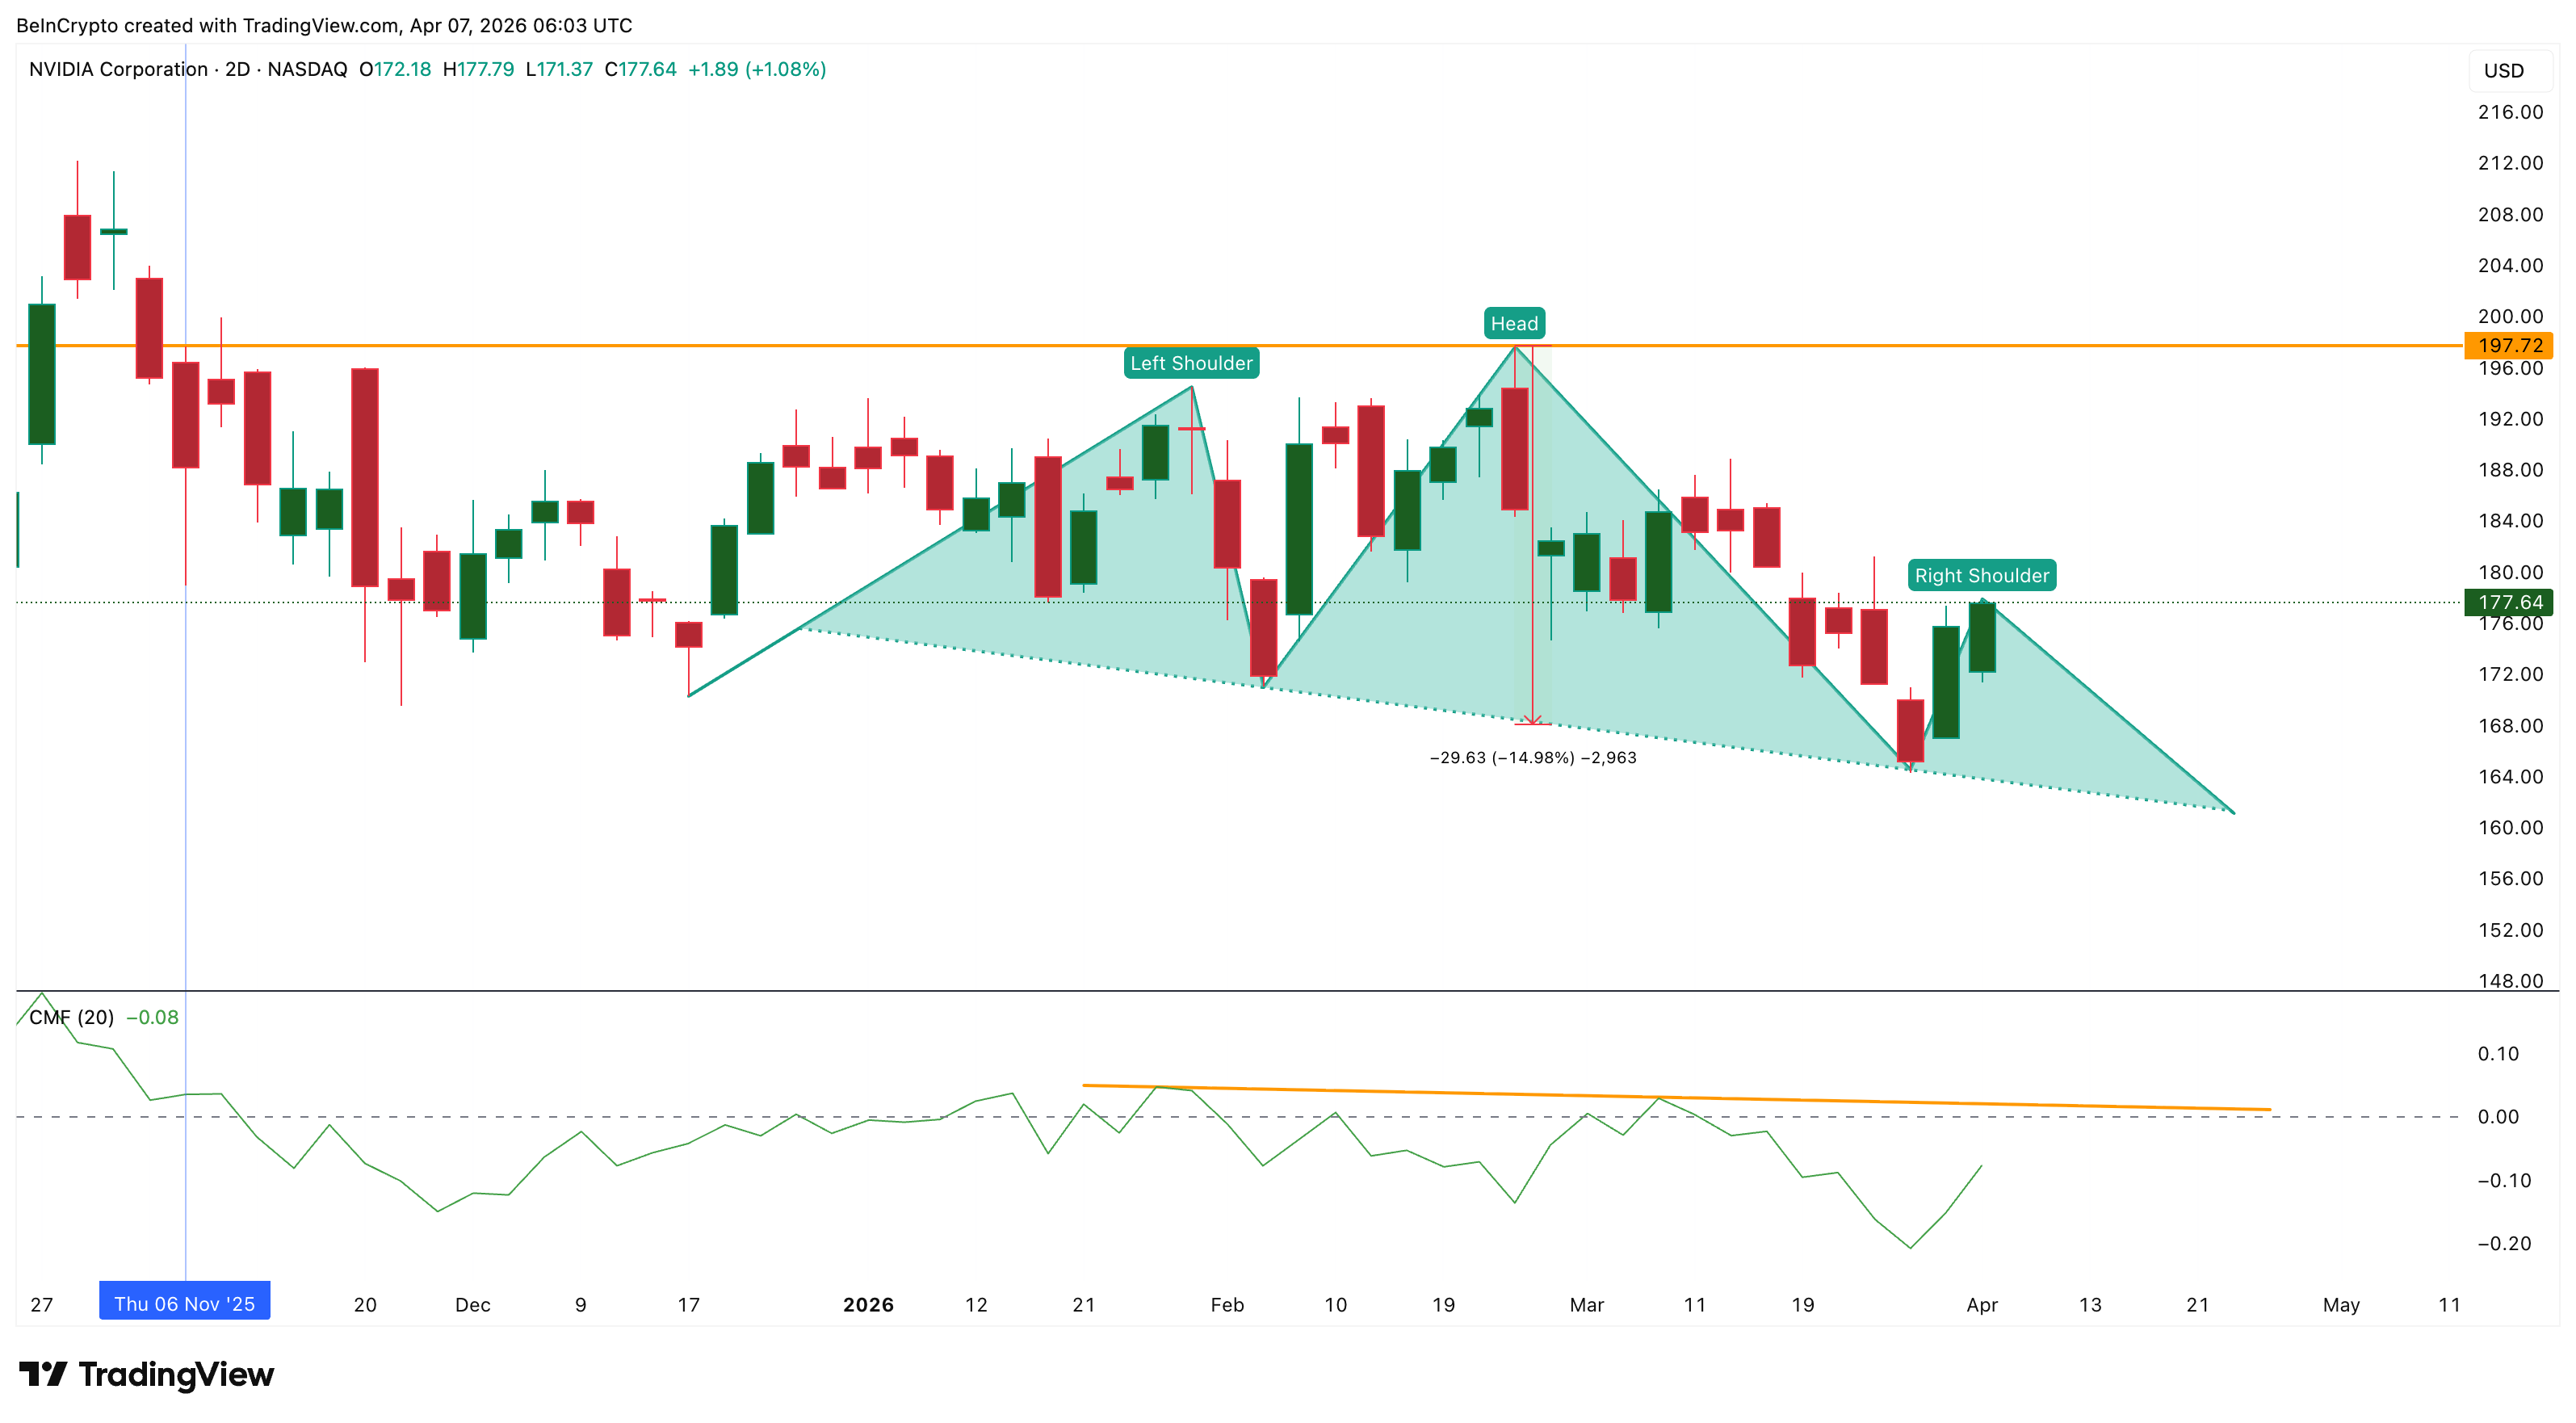
This tells a clear story. Institutional conviction has been limited to earnings events rather than the broader trend. Every bounce that happens while CMF stays negative risks building the right shoulder rather than breaking the pattern. The head at $197.72 is the invalidation level. Anything below it keeps the bearish structure alive.
The economic logic behind the negative CMF connects directly to the macro backdrop. Oil above $111 keeps inflation expectations elevated, which keeps the Fed on hold. Higher-for-longer rates compress multiples on growth stocks, including NVDA. A strengthening dollar adds further pressure on international revenue. These macro headwinds explain why institutional money has not committed despite the price bounce, and that reluctance is now visible in how options traders are positioning.
Options Traders Are Hedging More and Speculating Less
The put-call ratio data from Barchart shows a meaningful shift compared to the last pre-earnings window.
On January 7, with NVIDIA stock price at $189.11 and roughly seven weeks before the February 25 earnings, the put-call volume ratio stood at 0.53. Nearly twice as many calls as puts were trading, reflecting strong bullish conviction. The open interest ratio was 0.88.
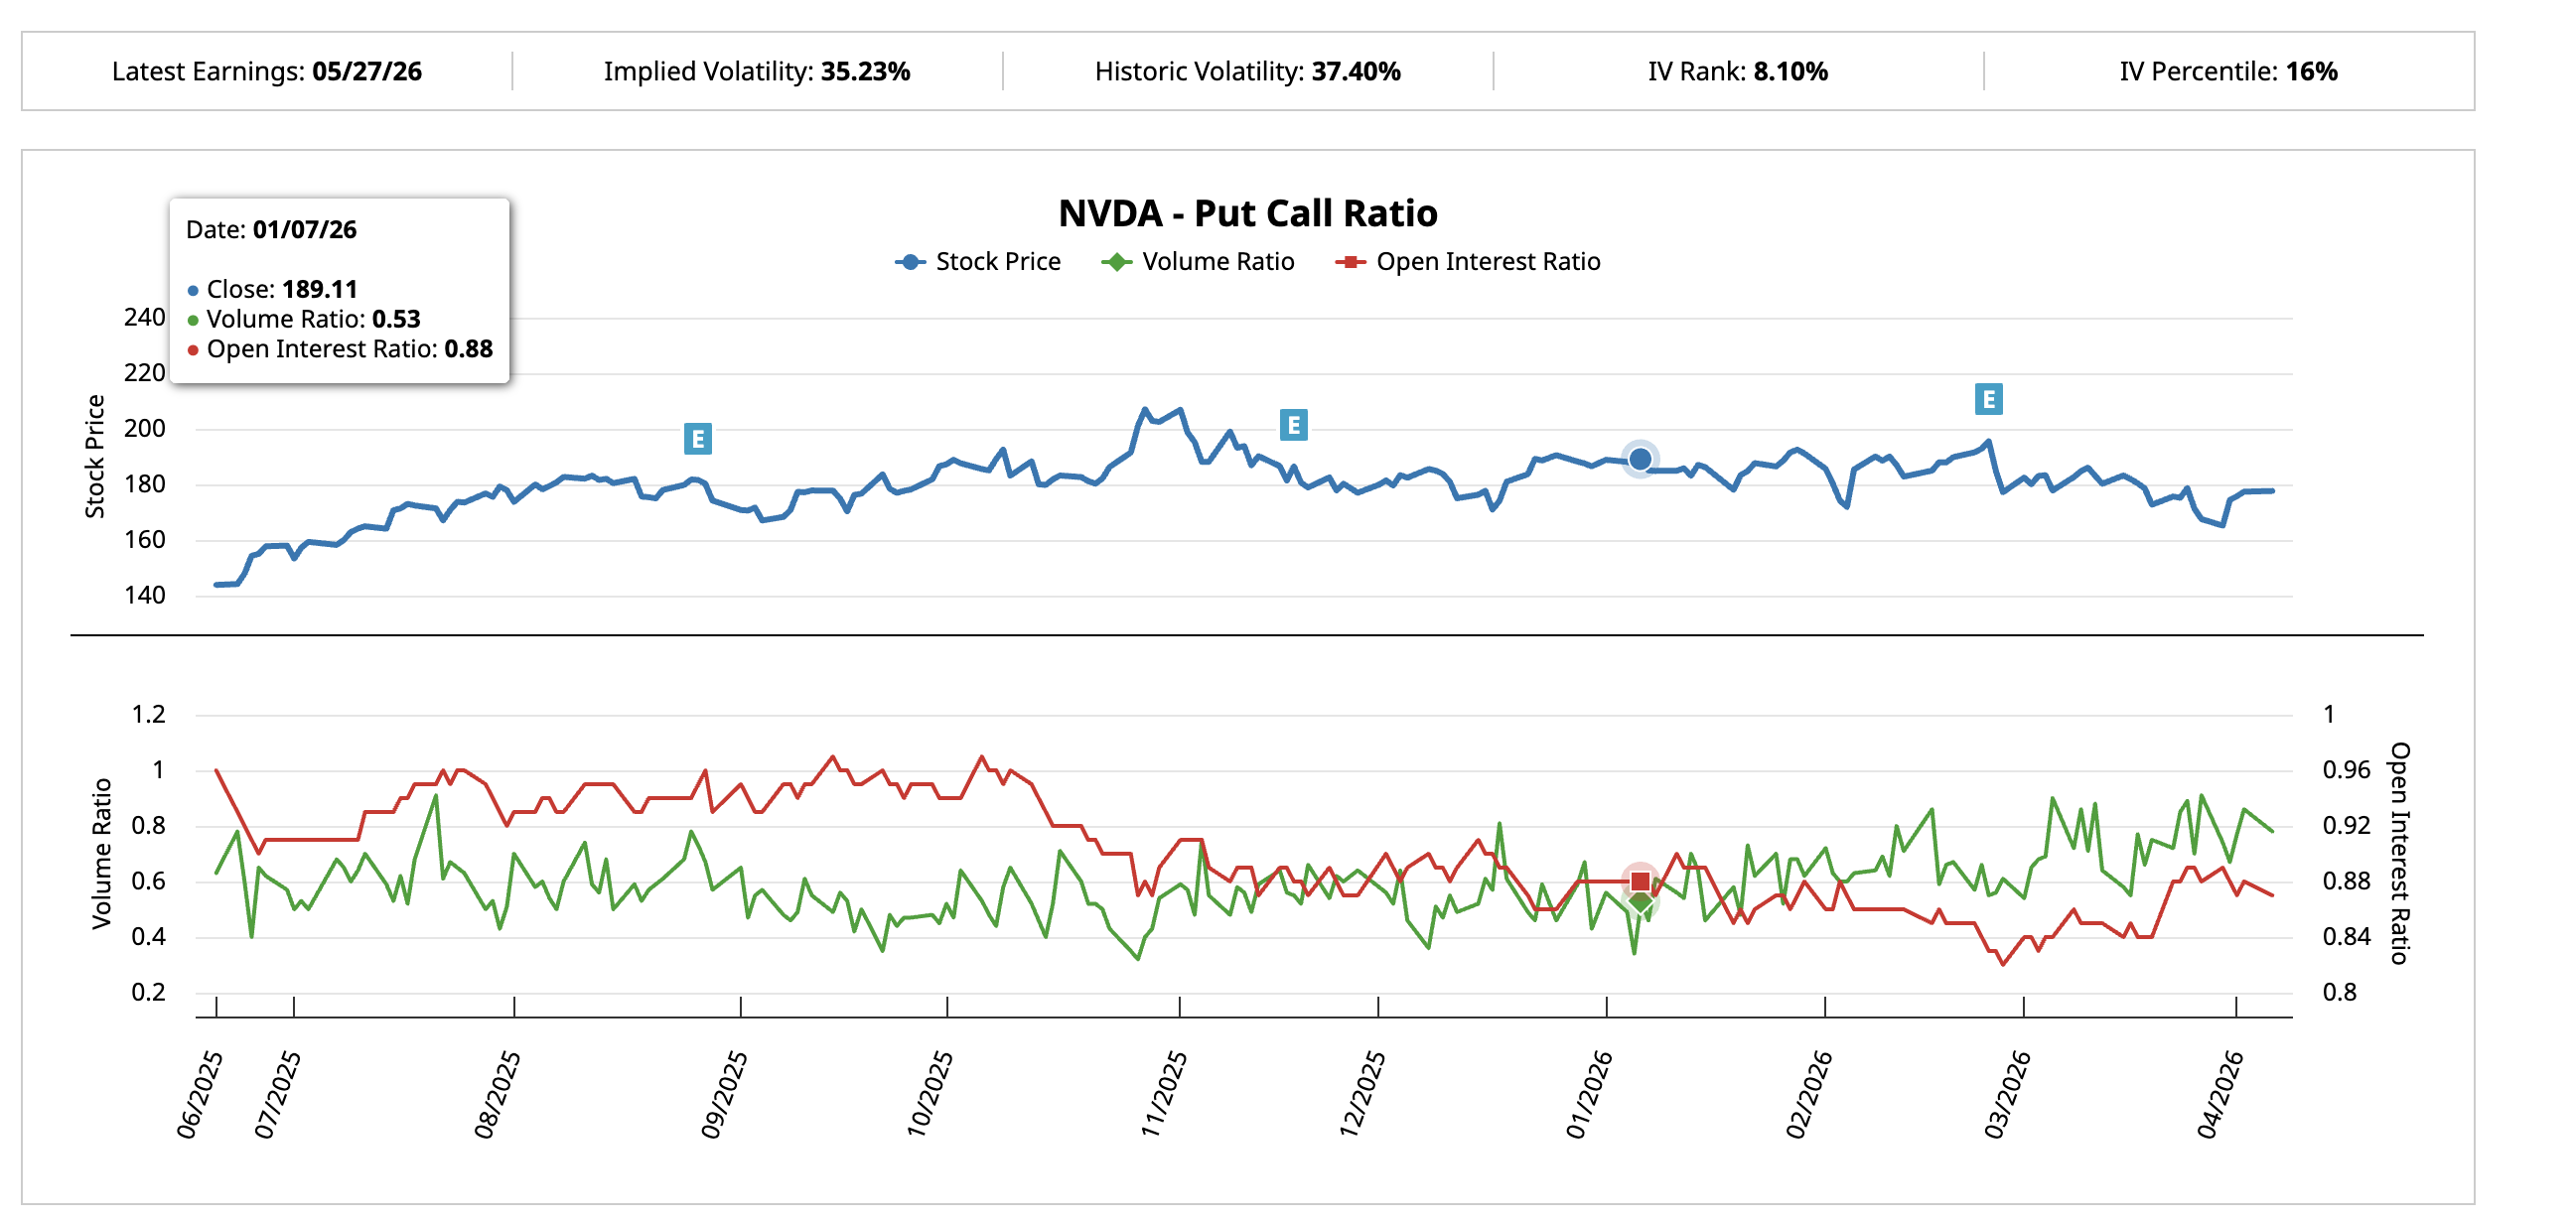
By April 6, with a similar window before the late May earnings, the volume ratio has climbed to 0.78. The gap between call and put activity has narrowed significantly. The open interest ratio barely moved at 0.87, meaning structural long positions have held, but new bullish flow has slowed while defensive bets have grown.
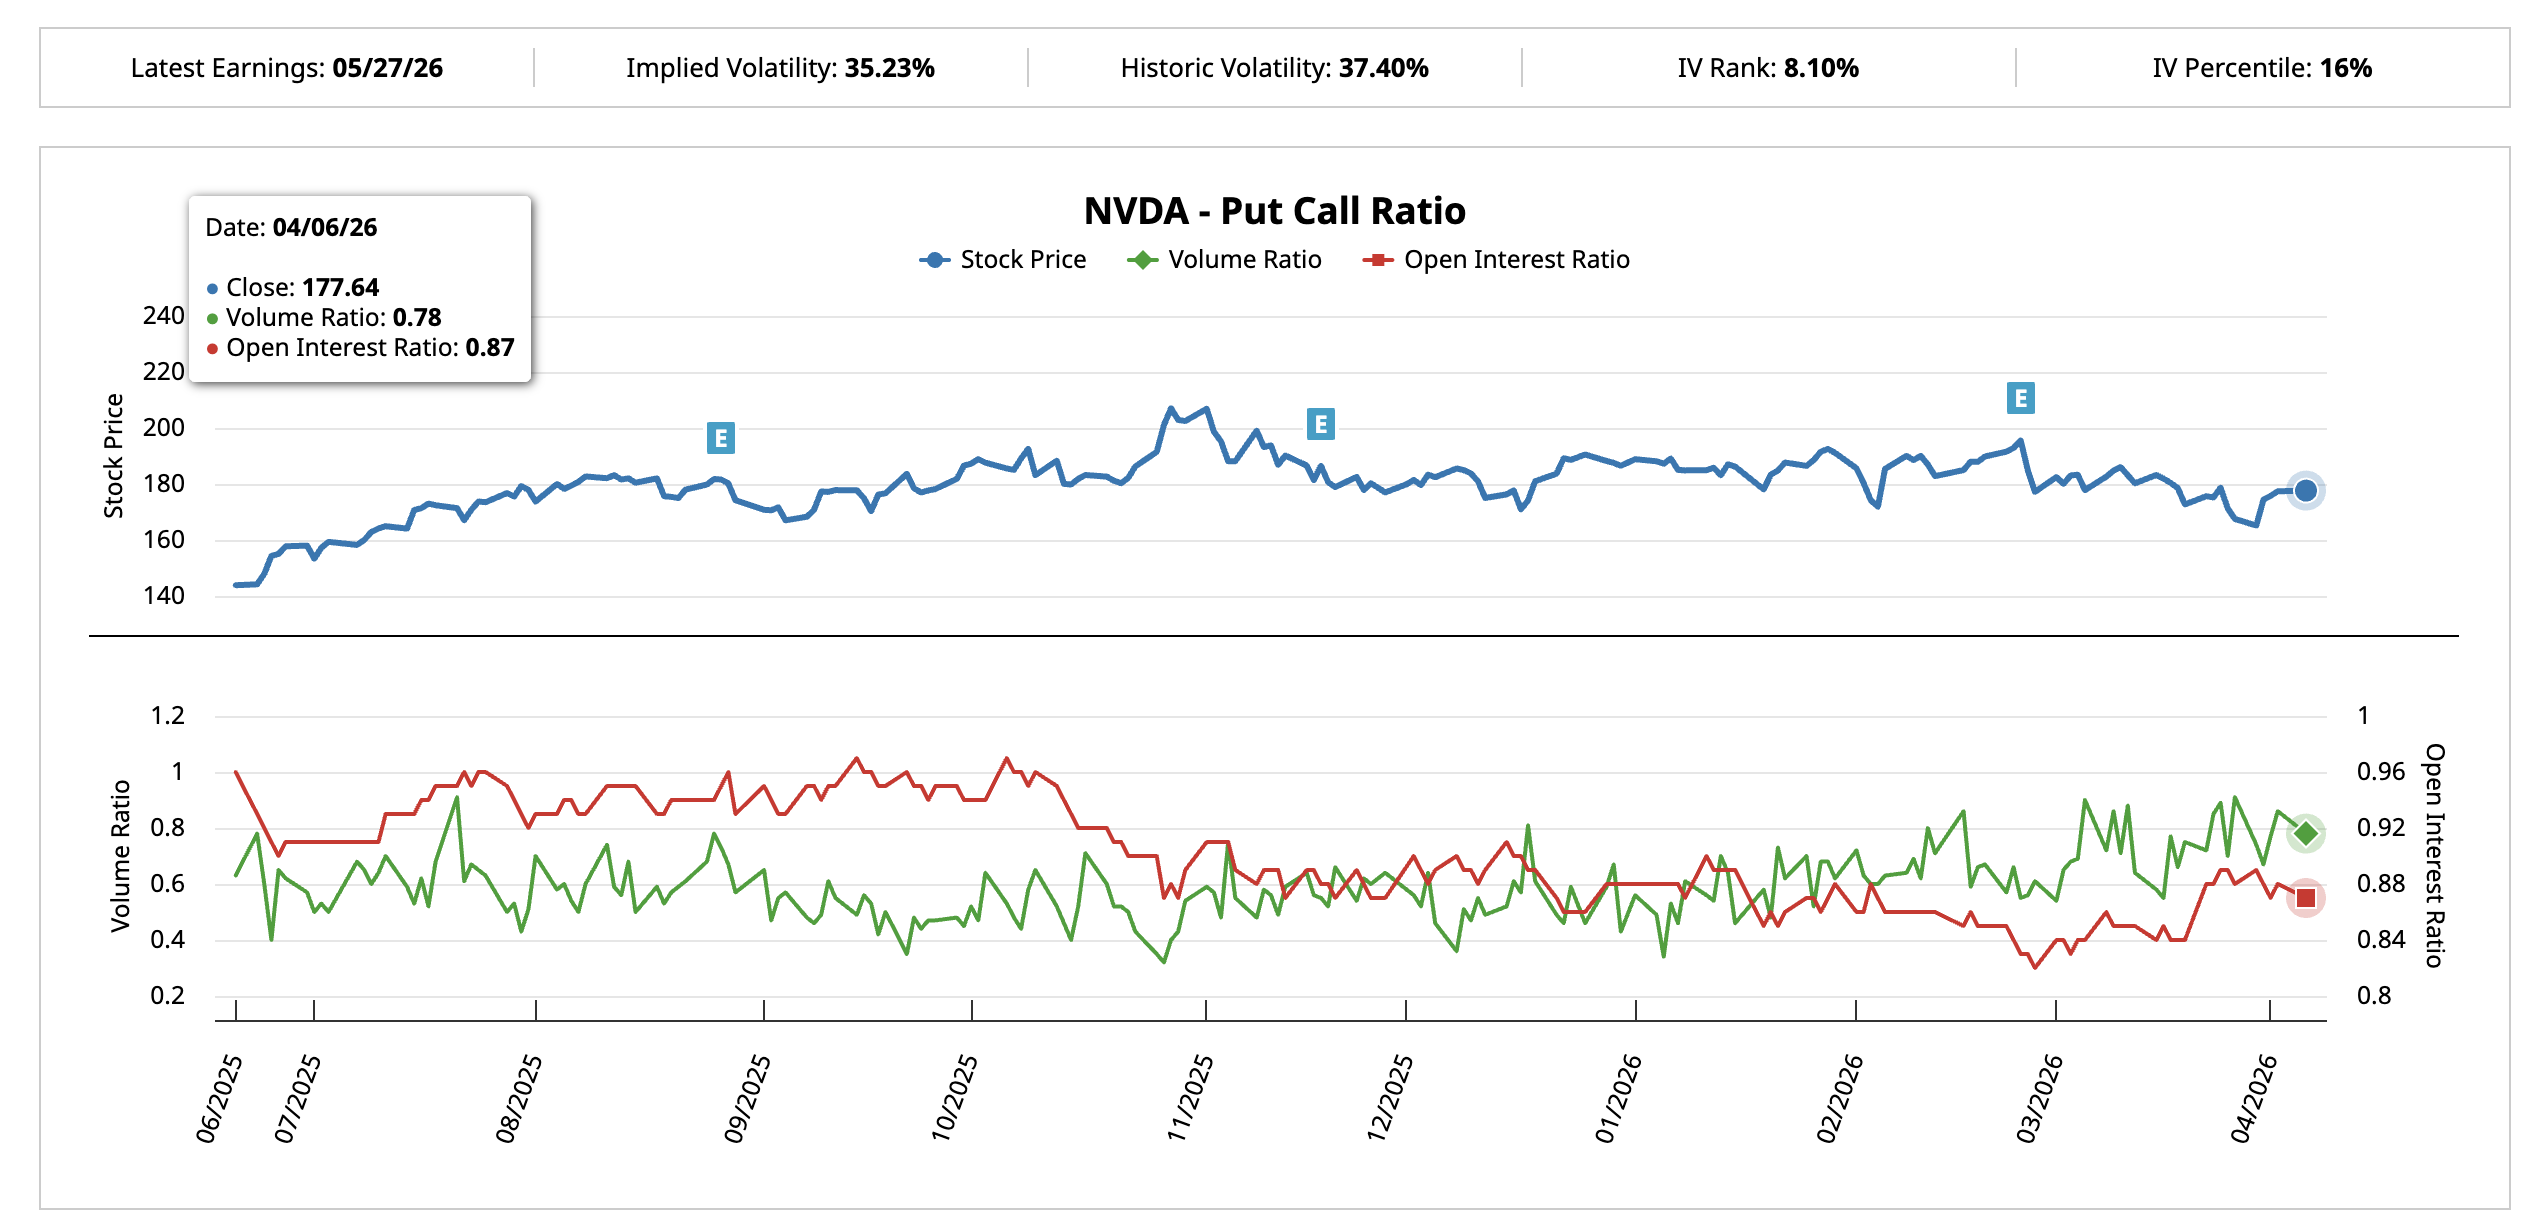
The shift from 0.53 to 0.78 does not mean the market is outright bearish. It means the easy bullishness that preceded the last cycle is gone. Traders are hedging more and speculating less, which aligns with both the negative CMF reading.
The Implied Volatility (IV) Percentile, which measures where current options volatility sits relative to the past year’s range, reads just 16%. The IV Rank, a similar measure that tracks where IV stands between its 52-week high and low, sits at 8.10%.
When IV is this compressed, the market is complacent. Any surprise, whether Iran de-escalation pushing oil lower, a tariff policy shift, or an unexpected pre-earnings development, could trigger outsized moves because options have not priced in the possibility.
The combination of cautious put-call ratios and compressed IV creates a paradox. Traders are positioning more defensively, but the options market itself is not reflecting the magnitude of catalysts that could arrive in April. That disconnect means the price levels become the deciding factor for which scenario plays out.
NVIDIA Stock Price Levels That Define April
The 2-day chart with technical levels frames the month’s range.
NVIDIA stock price sits at $177.64, almost exactly at the key technical level ($177.03). The first upside hurdle is $184.91 at the 0.618 level, one of the strongest technical zones. A move above this would represent the first real test of the upper range and could push prices toward $190.53. The head at $197.72 is the level that invalidates the pattern entirely and shifts the structure bullish.
If Iran de-escalation arrives by late April and oil drops, that scenario gains traction. Falling energy prices would ease inflation fears, bring rate cut expectations forward, and lift growth stock valuations. The compressed IV means any such catalyst would be amplified because options have not priced it in.
On the downside, losing $172.14 at the 0.236 level would suggest the right shoulder has already peaked at $177.97. The neckline sits near $161.35. A confirmed break below the neckline activates the 15% measured move, projecting a decline toward $137.35.
That bearish path becomes more likely if the war extends, oil stays above $110, and the FOMC delivers hawkish language on April 28-29. In that environment, the already-cautious options positioning would accelerate into outright bearishness, and the institutional money that CMF shows has been absent would stay on the sidelines.
April is likely to be defined by which catalyst arrives first. De-escalation and falling oil favor a push toward $184 and $197. Continued conflict and a hawkish Fed favor a drift toward $161 and the neckline test. The put-call shift and low IV confirm the market has not decided yet, making this a month where the resolution could be sharp in either direction.
The post What to Expect From NVIDIA Stock Price in April 2026? appeared first on BeInCrypto.
Crypto World
Here is what Solana Foundation’s cryptic ‘Don’t waste time with crypto’ ad really means


The Solana Foundation is taking a deliberately contrarian approach to crypto marketing in San Francisco, rolling out a billboard campaign that reads: “Don’t waste time with crypto.”
At first glance, the message may seem a bit confusing as a crypto foundation is saying not to waste time with crypto. But according to the Solana Foundation, it is a bullish bet on the future of crypto that intersects with agentic AI.
Essentially, what this means is that rather than wasting your time executing transactions with crypto, which might be cumbersome and time-consuming, let your AI agents do the hard work.
The ad directs passersby to the x402 account on X, a nod to a growing push within the Solana ecosystem to position blockchain not as a consumer-facing product, but as invisible infrastructure for the next phase of the internet.
The message reflects a broader thesis the ecosystem has been advancing: that crypto’s future lies in powering an “agentic” internet, where artificial intelligence systems, not humans, initiate and execute economic activity.
Read more: Visa is ready for AI agents. So is Coinbase. They’re building very different internets
At the center of that vision is x402, a new type of payment system built for the internet. In simple terms, it lets apps, websites or AI tools automatically charge small amounts of money when they’re used, without requiring logins, subscriptions or human involvement. For example, an AI agent could request data from a service, instantly pay a small fee, and receive the result in a single seamless step. The idea is to make online payments as easy and automatic as loading a webpage — especially for very small transactions that traditional payment systems struggle to handle.
This model enables so-called “agentic payments,” often involving fractions of a cent, which are difficult to support on traditional financial rails due to high fees and latency. Solana is betting that its high throughput and low transaction costs make it a natural settlement layer for this emerging economy.
The billboard’s tongue-in-cheek directive encapsulates that shift. If the technology succeeds, the argument goes, users won’t need to think about crypto at all.
“Crypto and Solana are well on their way to being the default way AI pays,” a Solana Foundation spokesperson said, adding that agents will gravitate toward networks where “performance wins.”
Ethereum might be down by 3% today, but a structural shift inside one of the most-watched U.S. ETF products may be building a slow-burn case for recovery. The catalyst isn’t a Trump tweet or a Fed pivot. It’s staking yield, quietly compounding inside a regulated wrapper. Grayscale introduces Ethereum ETF staking delay.
In October 2025, Grayscale activated staking for ETHE, making it the first U.S. Ethereum ETP to distribute staking rewards directly to shareholders. Shares are currently priced at $16.98, with the fund posting a 3-month return of +107.87% and a 1-year return of +11.68%. That 3-month surge reflects a period when institutional appetite quietly accelerated way before most retail participants noticed.
When staking yield embedded in a regulated ETF structure, it creates a demand floor that pure spot exposure never had. ETF dynamics in 2026 have already reshaped Bitcoin’s price behavior, Ethereum may be next in line for the same institutional re-rating.
Discover: The best pre-launch token sales
Can Ethereum Price Hit $5,700 With This New Grayscale ETF Staking?
Ethereum’s current price action is compressed. Trading just above the $2,000 support zone, well below the $2,400 resistance band that capped multiple recovery attempts in Q1 2026. Volume has been underwhelming, a characteristic of a market waiting for a macro trigger.
The staking ETF development matters technically because it introduces a yield-bearing demand component. Institutional allocators who previously avoided ETH due to zero-yield exposure now have a credible on-ramp. Buyer-seller divergence data already shows accumulation signals at current levels, suggesting patient money is positioning ahead of any breakout.

ETH could reclaim $2,400 with ETF inflows accelerating on the staking yield narrative, and price targets $3,200, then $5,700 as the cycle matures in a move that would represent 180% jump from current levels.
But ETH could lso consolidates between $1,650 and $2,400 through Q2, with staking yield providing a slow but steady ETF demand floor. Price grinds higher, but the $5,700 target extends into late 2026. Or, a break below $1,500 on heavy volume would invalidate the accumulation thesis. That level represents critical long-term support; a close beneath it reopens the $1,200 range.
The staking ETF is a structural positive. It isn’t, by itself, a price ignition event. Patient positioning appears to be the play.
Discover: The best crypto to diversify your portfolio with
Maxi Doge Targets Early Mover Upside as Ethereum Tests Key Levels
Here’s the uncomfortable truth about Ethereum: even the bull case projects +180% as a multi-quarter grind. For traders who made real money in 2021, that timeline feels like watching paint dry.
Early-stage assets with compressed entry prices and community momentum have historically offered asymmetric upside during exactly these mid-cycle consolidation windows.
Maxi Doge ($MAXI) is a meme token built on Ethereum, currently in presale at $0.0002812, with $4,7 million raised for now. The project leans hard into trading culture, with holder-only trading competitions, leaderboard rewards, and a Maxi Fund treasury backing liquidity and partnerships. Staking is also live with a high 66% APY bonus for presale participants.
Two features stand out: the Holder-Only Trading Competitions create genuine competitive utility beyond speculative holding, and the meme-first marketing strategy has a track record of generating organic viral reach that paid campaigns simply can’t replicate.
Research Maxi Doge here before the next price increase.
The post Grayscale Ethereum ETF Staking Introduces Something Fresh: The Catalyst For $5,700? appeared first on Cryptonews.

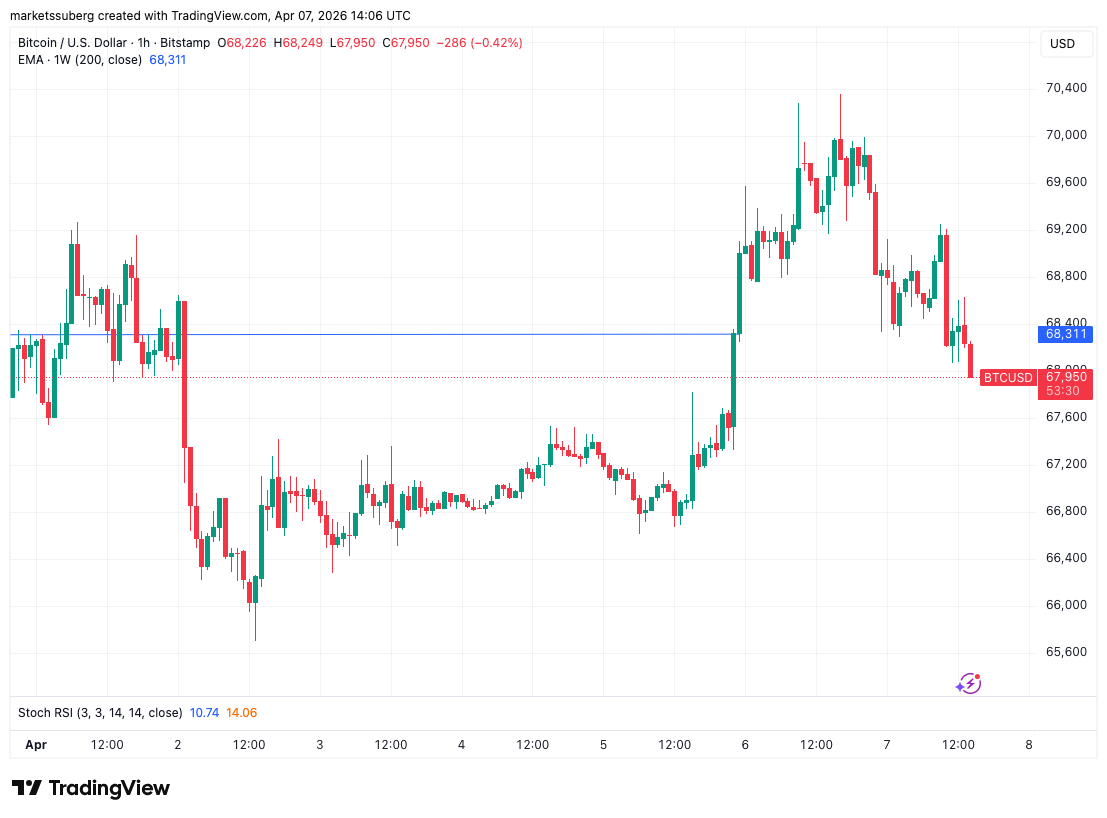
BTC USD pulled back sharply to $68,000 Tuesday after topping $70,000 less than 24 hours earlier, as the Trump 8 PM deadline looming. The catalyst is as geopolitical as it gets, and the window to act may already be closing.
President Trump posted an extraordinary message to Truth Social Tuesday morning, warning:
“A whole civilization will die tonight, never to be brought back again. I don’t want that to happen, but it probably will.”
The statement, tied to his 8 PM ET deadline for Iran to reopen the Strait of Hormuz, detonated across risk assets instantly. Nasdaq 100 futures dropped 0.65%. WTI crude spiked 1.7% to $114.22 per barrel. Bitcoin shed nearly $2,000 in a matter of hours.
— Mario Nawfal (@MarioNawfal) April 7, 2026
 BREAKING:
'There are increasing fears within Trump’s current and former advisory circle that the President may consider ordering a NUCLEAR STRIKE on Iran’
Source: The Guardian https://t.co/Yn21aIAPZl pic.twitter.com/4KKv4zdO4m
Vice President Vance offered a partial reprieve, stating military objectives in the Iran conflict had been completed, tempering the worst of the selloff. The broader damage, though, was already done. Markets are pricing in genuine overnight risk, and Bitcoin is caught directly in the crossfire.
Discover: The best pre-launch token sales
BTC USD Under Heavy Pressure from Trump Decisions
BTC USD rejection at $70,000 is technically significant. That level has served as stiff overhead resistance across multiple sessions, and Monday’s brief breach now looks like a false breakout rather than a confirmed range expansion. Price is currently consolidating around $68,000, dropping close to 3% since last night.
The immediate support zone sits between $67,500 and $66,000. A clean hold here keeps the bullish structure intact. Lose it on a closing basis, and the next meaningful demand cluster doesn’t appear until the $65,000–$65,500 region, a level that aligns with prior consolidation from late March.
Volume context matters here. The pullback has been driven by macro fear rather than structural selling, which suggests the move could reverse quickly if tonight’s geopolitical outcome is less catastrophic than Trump’s language implies. Three scenarios dominate the tape right now:
Bitcoin’s correlation with risk assets during geopolitical shocks remains frustratingly tight; the “digital gold” narrative only seems to hold once the dust settles. Watch the 8 PM deadline closely and react to BTC USD movement.
— MSB Intel (@MSBIntel) April 7, 2026
 BREAKING: Trump's 8 PM Tuesday deadline for Iran to reopen Strait of Hormuz.
Trump threatened bombing campaign against Iran's power plants and bridges if Hormuz not reopened by 8pm Eastern Time April 7. Iran rejected ceasefire, demands permanent war end and sanctions lift.
Discover: The best crypto to diversify your portfolio with
Bitcoin Hyper is Not Under Pressure
Here’s the uncomfortable truth for spot BTC holders: even in the bull case, Bitcoin’s upside from $68,000 to $74,000 represents roughly 9%, not nothing, but hardly the asymmetric return that first attracted most crypto investors to this space.
Macro-driven volatility compresses spot upside while amplifying downside risk. That calculus is pushing sophisticated allocators toward earlier-stage infrastructure plays with different return profiles.
Bitcoin Hyper ($HYPER) is currently raising in presale at just $0.0136, with $32 million already committed, a figure that signals serious demand for what the project is building.
The pitch is technically ambitious: the first-ever Bitcoin Layer 2 with Solana Virtual Machine (SVM) integration, delivering sub-second transaction finality while preserving Bitcoin’s underlying security model. That means fast smart contracts, low fees, and a decentralized canonical bridge for BTC transfers, breaking the three core limitations that have historically capped Bitcoin’s utility as a programmable asset.
High 36% APY staking bonus is live for presale participants. Research Bitcoin Hyper’s presale terms here and joing Hyper army today.
The post BTC USD In Shock Again: Trump Says Whole Civilization Will Die Tonight appeared first on Cryptonews.

Global crypto exchange-traded products drew $224 million in inflows last week after a $414 million outflow the week before, according to CoinShares.
The headline number looks like a recovery but a deeper look shows that the rebound is far narrower than it appears.
Switzerland alone accounted for roughly $157 million of the $224 million total, meaning 70% of global inflows came from a single country. Germany and the United States each contributed about $28 million. Canada added a much smaller $11 million.
The asset breakdown is similarly concentrated. XRP led all inflows at approximately $120 million, more than half the global total and its largest weekly intake since mid-December 2025.
Virtually none of the total from U.S. spot XRP ETFs. SoSoValue data shows the five U.S.-listed XRP spot ETFs recorded near-zero daily flows throughout the past two weeks, with total net assets sitting at $940 million across Canary, Bitwise, Franklin, 21Shares, and Grayscale products. The $120 million was almost entirely European and international ETP demand.
Bitcoin ETPs drew $107 million, but only $22 million came from U.S. spot ETFs, which remain in negative territory year-to-date. Strategy disclosed over the weekend that it bought 4,871 BTC for approximately $330 million in the same week, meaning a single company spent 15 times what the entire U.S. spot bitcoin ETF complex attracted.
ETFs absorbed approximately 50,000 BTC in March’s rolling 30-day window, the highest since October 2025, CoinDesk reported last week. But nearly all of the sustained institutional buying pressure is coming through two channels — spot ETFs and Strategy — and even the ETF channel is weakening on a weekly basis.
The broader ETP market, which includes leveraged products, short products, and altcoin funds across dozens of countries, is not confirming the “institutions are buying” narrative.
Ether products continued to bleed, posting $53 million in outflows after $222 million the prior week, bringing year-to-date outflows to $327 million. That stands in sharp contrast to Bitmine Immersion Technologies (BMNR), which bought 71,252 ETH last week in its largest single-week purchase since December 2025 and now holds 4.8 million tokens worth roughly $10 billion. ETH fund investors are leaving while the largest corporate ETH buyer on earth is accelerating.
CoinShares’ James Butterfill attributed the ether weakness partly to uncertainty around the CLARITY Act, the stablecoin legislation closely tied to Ethereum’s ecosystem.
The geographic concentration matters for reading where conviction actually sits. The Coinbase Premium Index, which tracks whether bitcoin trades at a premium or discount on the exchange most associated with US institutional flows, has been persistently negative since bitcoin’s all-time high above $126,000 in October 2025.
U.S. buyers are not stepping in at scale, and the ETP data confirms it. The $28 million in US inflows against $157 million from Switzerland suggests the marginal buyer right now is European, not American.
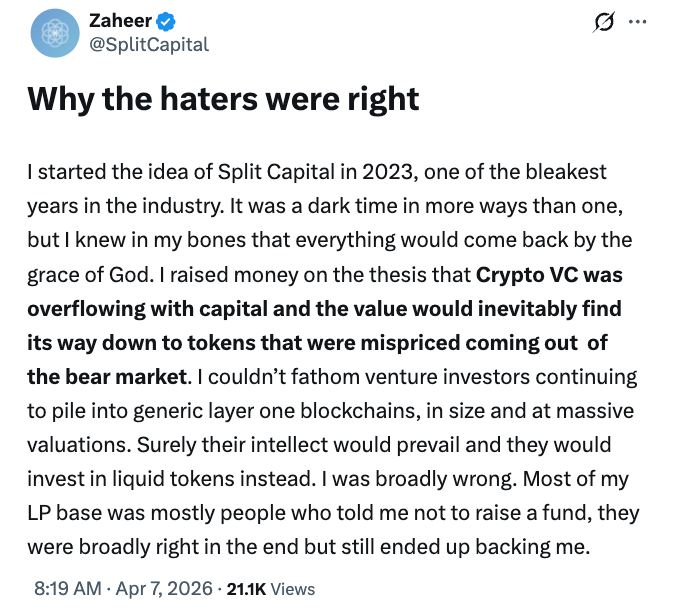
Split Capital, a digital asset hedge fund founded by investor Zaheer Ebtikar, is shutting down, with the founder joining Peter Thiel-backed stablecoin startup Plasma.
Ebtikar announced the news in an X post on Tuesday, saying Split Capital was profitable both in 2024 and 2025, and delivered over 100% in returns.
“We were a top performing fund by every mark,” Ebtikar claimed, adding that his decision to wind down the business was driven by a belief that the crypto market had shifted away from strategies that hedge funds are designed to capture.
“The hedge fund model did not make sense for crypto, in perpetuity,” he said.
Ebtikar’s decision came amid continued pressure on crypto hedge funds, which have reportedly faced more challenging market conditions since the 2022 market downturn.
Crypto industry no longer rewards traders chasing momentum, Ebtikar argues
Ebtikar described his early years in crypto as “PvP button-clicking,” where traders competed in fast-moving markets driven by momentum and narratives. But after nearly a decade, he said those conditions have changed.
“The industry no longer rewards traders chasing momentum, it has matured into a space where the only real question is ‘What does the future look like and where is the value?’” he said.
Ebtikar said that many investors, including critics, were ultimately right to question whether funds such as Split Capital were sustainable in a rapidly evolving market.

“As time went on, our conviction narrowed around a small number of founders and verticals I genuinely believed in,” Ebtikar said.
Betting on Plasma’s stablecoin vision
Ebtikar said his conviction in Plasma grew after working closely with its founding team throughout 2024 and 2025.
Plasma is focused on building infrastructure for stablecoin settlement and global financial access. The platform raised $24 million in February last year from investors such as Framework Ventures, Bitfinex, Peter Thiel and Tether CEO Paolo Ardoino.
Related: Standard Chartered says faster stablecoin turnover could curb demand
As chief strategy officer at Plasma, Ebtikar will work across partnerships, growth and go-to-market efforts, as well as engage with investors and policymakers ahead of the rollout of Plasma One and ongoing ecosystem expansion.
He framed the move as part of a larger belief that crypto is entering a new phase defined less by speculation and more by building global financial systems.
“The last dance of crypto’s old era and the hope and deep belief that our work at Plasma can get us to a new golden age for our space,” Ebtikar said.

Kanye’s UK ban forces Wireless Festival to be cancelled
Road to the Playoffs: Raptors eye crucial showdowns with Heat
The dark side of music as ‘therapy’


-

 NewsBeat5 days ago
Steven Gerrard disagrees with Gary Neville over ‘shock’ Chelsea and Arsenal claim | Football
-

 Business5 days ago
No Jackpot Winner and $194 Million Prize Rolls Over
-

 Fashion4 days ago
Weekend Open Thread: Spanx – Corporette.com
-

 Crypto World6 days ago
Gold Price Prediction: Worst Month in 17 Years fo Save Haven Rock
-

 Business2 days ago
Three Gulf funds agree to back Paramount’s $81 billion takeover of Warner, WSJ reports
-

 Business3 days ago
Expert Picks for Every Need
-

 Sports3 days ago
India men’s 4x400m and mixed 4x100m relay teams register big progress | Other Sports News
-

 Business6 days ago
Login and Checkout Issues Spark Merchant Frustration
-

 Crypto World7 days ago
Bitcoin enters the public bond market as Moody’s gives a first-of-its-kind crypto deal a rating
-
Business2 days ago
No Jackpot Winner, Prize to Climb to $231 Million
-
Crypto World7 days ago
Bitcoin stalls below key resistance as technical signals skew bearish
-

 Tech5 days ago
Commonwealth Fusion Systems leans on magnets for near-term revenue
-

 Politics7 days ago
Starmer’s centre has collapsed, and the left was right all along
-

 Crypto World6 days ago
Ripple rolls out enterprise crypto treasury platform for corporates
-

 Crypto World6 days ago
Why It’s Partnering, Not Issuing
-

 Fashion1 day ago
Massimo Dutti Offers Inspiration for Your Summer Mood Board
-
Crypto World7 days ago
AI Memory Rout Wipes 9% Off Nvidia Stock: Chart Says More Pain Ahead
-
 Sports7 days ago
How to teach yourself the perfect impact position with every club
-

 Tech7 days ago
Solo Leveling: Ranking All Sung Jinwoo Shadows by Power
-

 Tech6 days ago
Drawing Tablet Controls Laser In Real-Time
You must be logged in to post a comment Login