

Crypto World
XRP (XRP) Crashes to $1.01: Critical On-Chain Signals Reveal What’s Next
Key Takeaways
- XRP touched $1.01 on June 25, marking its lowest valuation in 2026 and matching levels not seen since November 2024
- The digital asset has declined 43% from the beginning of 2026
- Approximately 100 million XRP tokens exited Binance reserves during the last month
- Large holder accumulation stays in positive territory with 5.14 million XRP daily net average over 90 days
- XRP spot ETFs have attracted $243 million in combined inflows starting from April
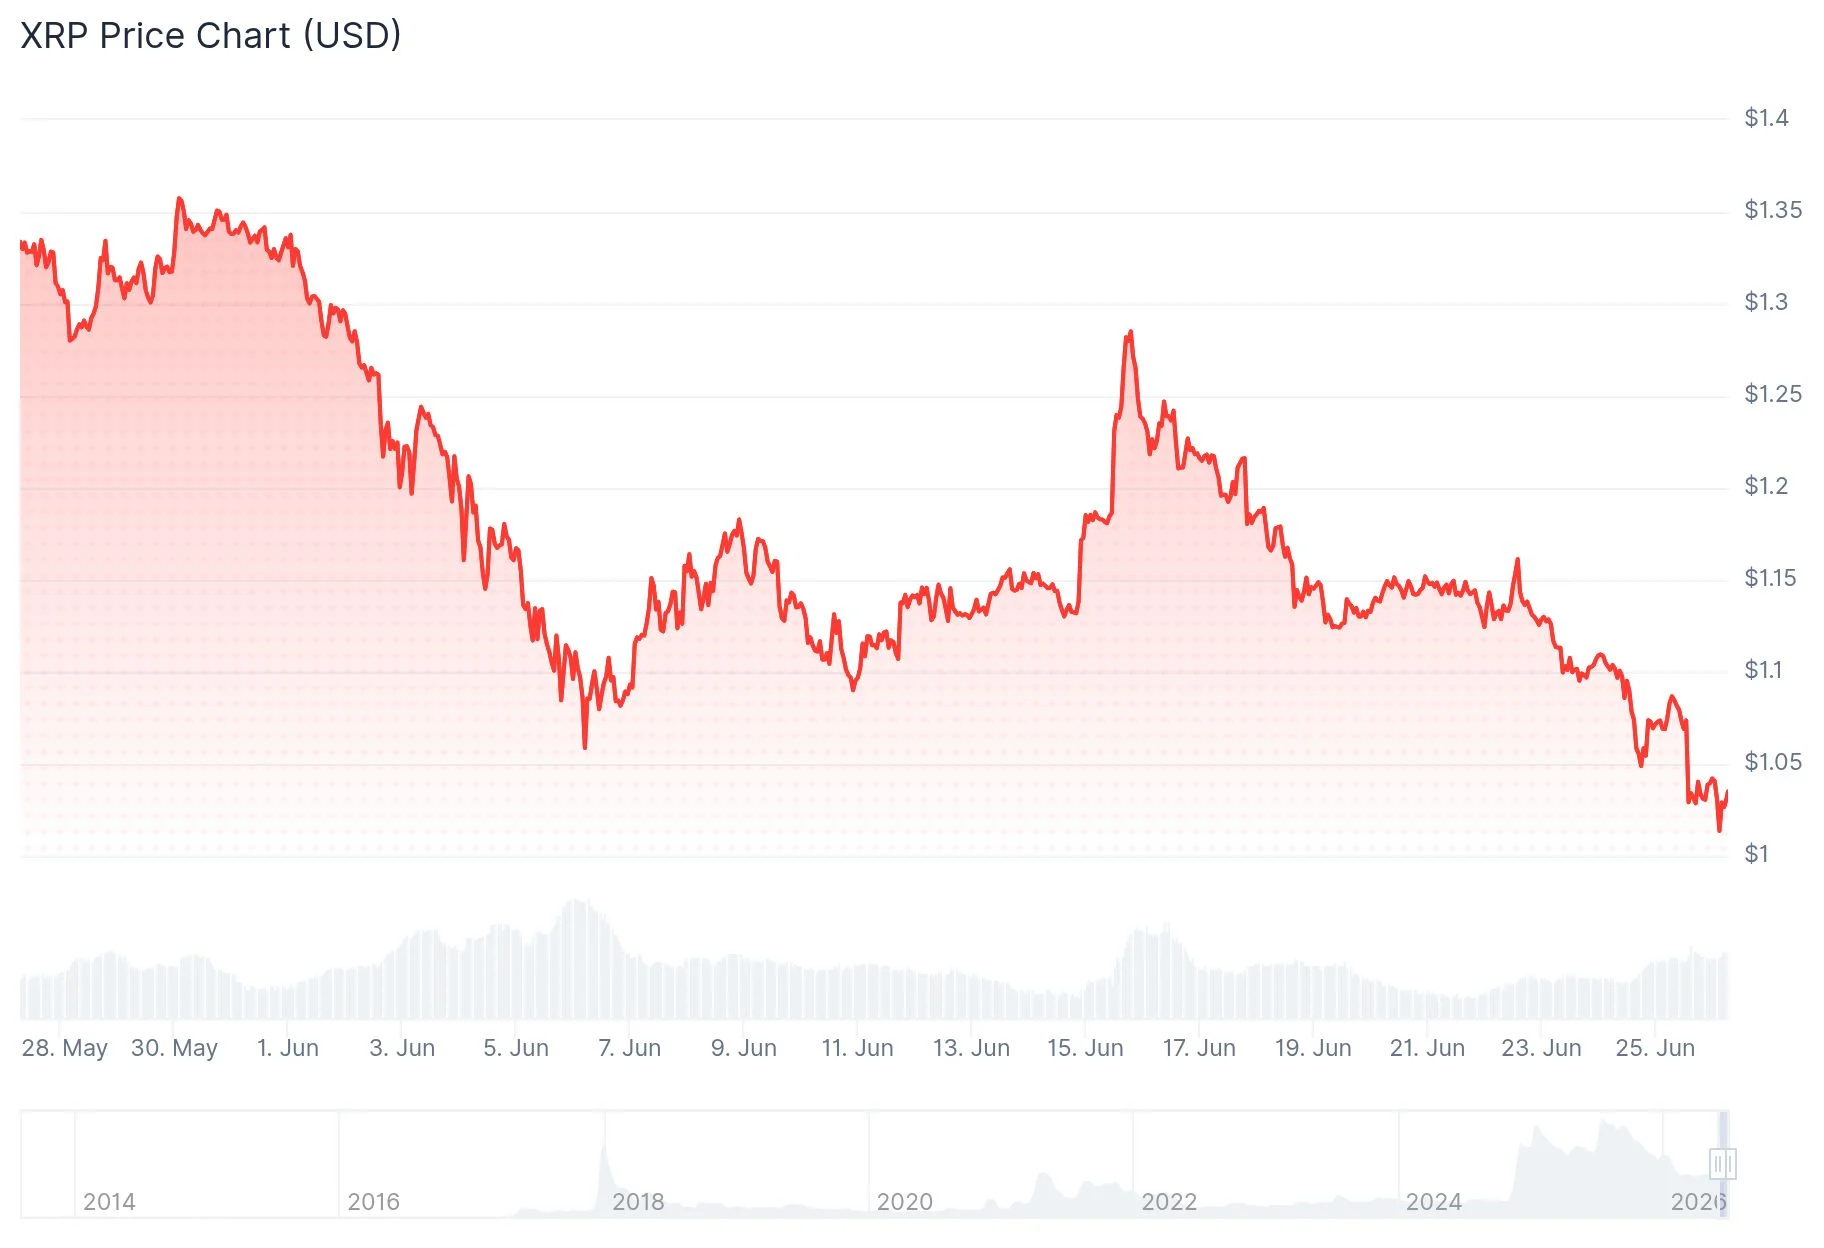
On June 25, 2026, XRP plummeted to $1.01, establishing its weakest performance for the year. This valuation brings the cryptocurrency dangerously close to breaking beneath the $1 threshold for the first time since November 2024.

The digital currency has surrendered 43% of its value since January 2026. The wider cryptocurrency sector has similarly experienced pressure, with Bitcoin sliding under $58,200 during the same trading session.
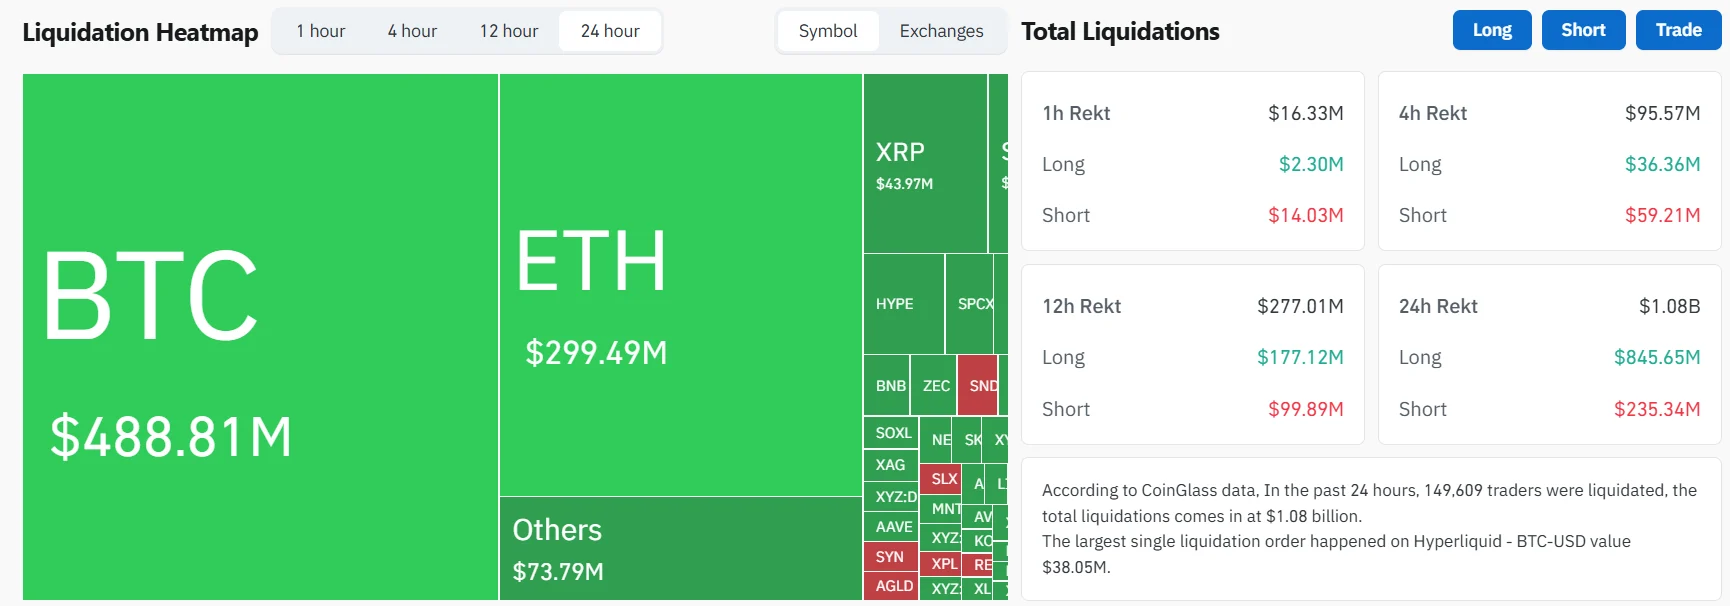
According to CoinGlass data, liquidations across the crypto market exceeded $915 million in the 24-hour window ending June 25. XRP contributed $42 million to this figure, with long positions representing $40.7 million of the total.
When XRP previously traded at comparable levels in November 2024, market dynamics were markedly different. Donald Trump’s presidential election victory had just occurred, triggering a widespread crypto market rally. During early November 2024, XRP was valued at $0.50 before experiencing a dramatic climb to $2.70 by December’s opening.
The token achieved its 2025 zenith of $3.65 during mid-July, coinciding with advancing clarity regarding its regulatory classification in the United States. The catastrophic market-wide flash crash on October 10 severely impacted prices, leaving XRP unable to recover momentum.
Market analyst Celal Kucuker published his perspective on X, projecting XRP’s floor at the $0.86–$0.87 zone, while identifying a ceiling target between $8–$9. His forecast correlates with Bitcoin stabilizing around $54,000.
Exchange Holdings Decrease Amid Rising Outflows
Blockchain metrics reveal a narrative diverging from price movements. XRP quantities stored on trading platforms have experienced consistent reductions across numerous exchanges.
Cryptocurrency researcher Amr Taha observed that Binance’s XRP holdings declined to approximately 2.68 billion tokens by June 25, down from 2.78 billion recorded on May 12. This represents roughly 100 million XRP departing the platform within a six-week timeframe.
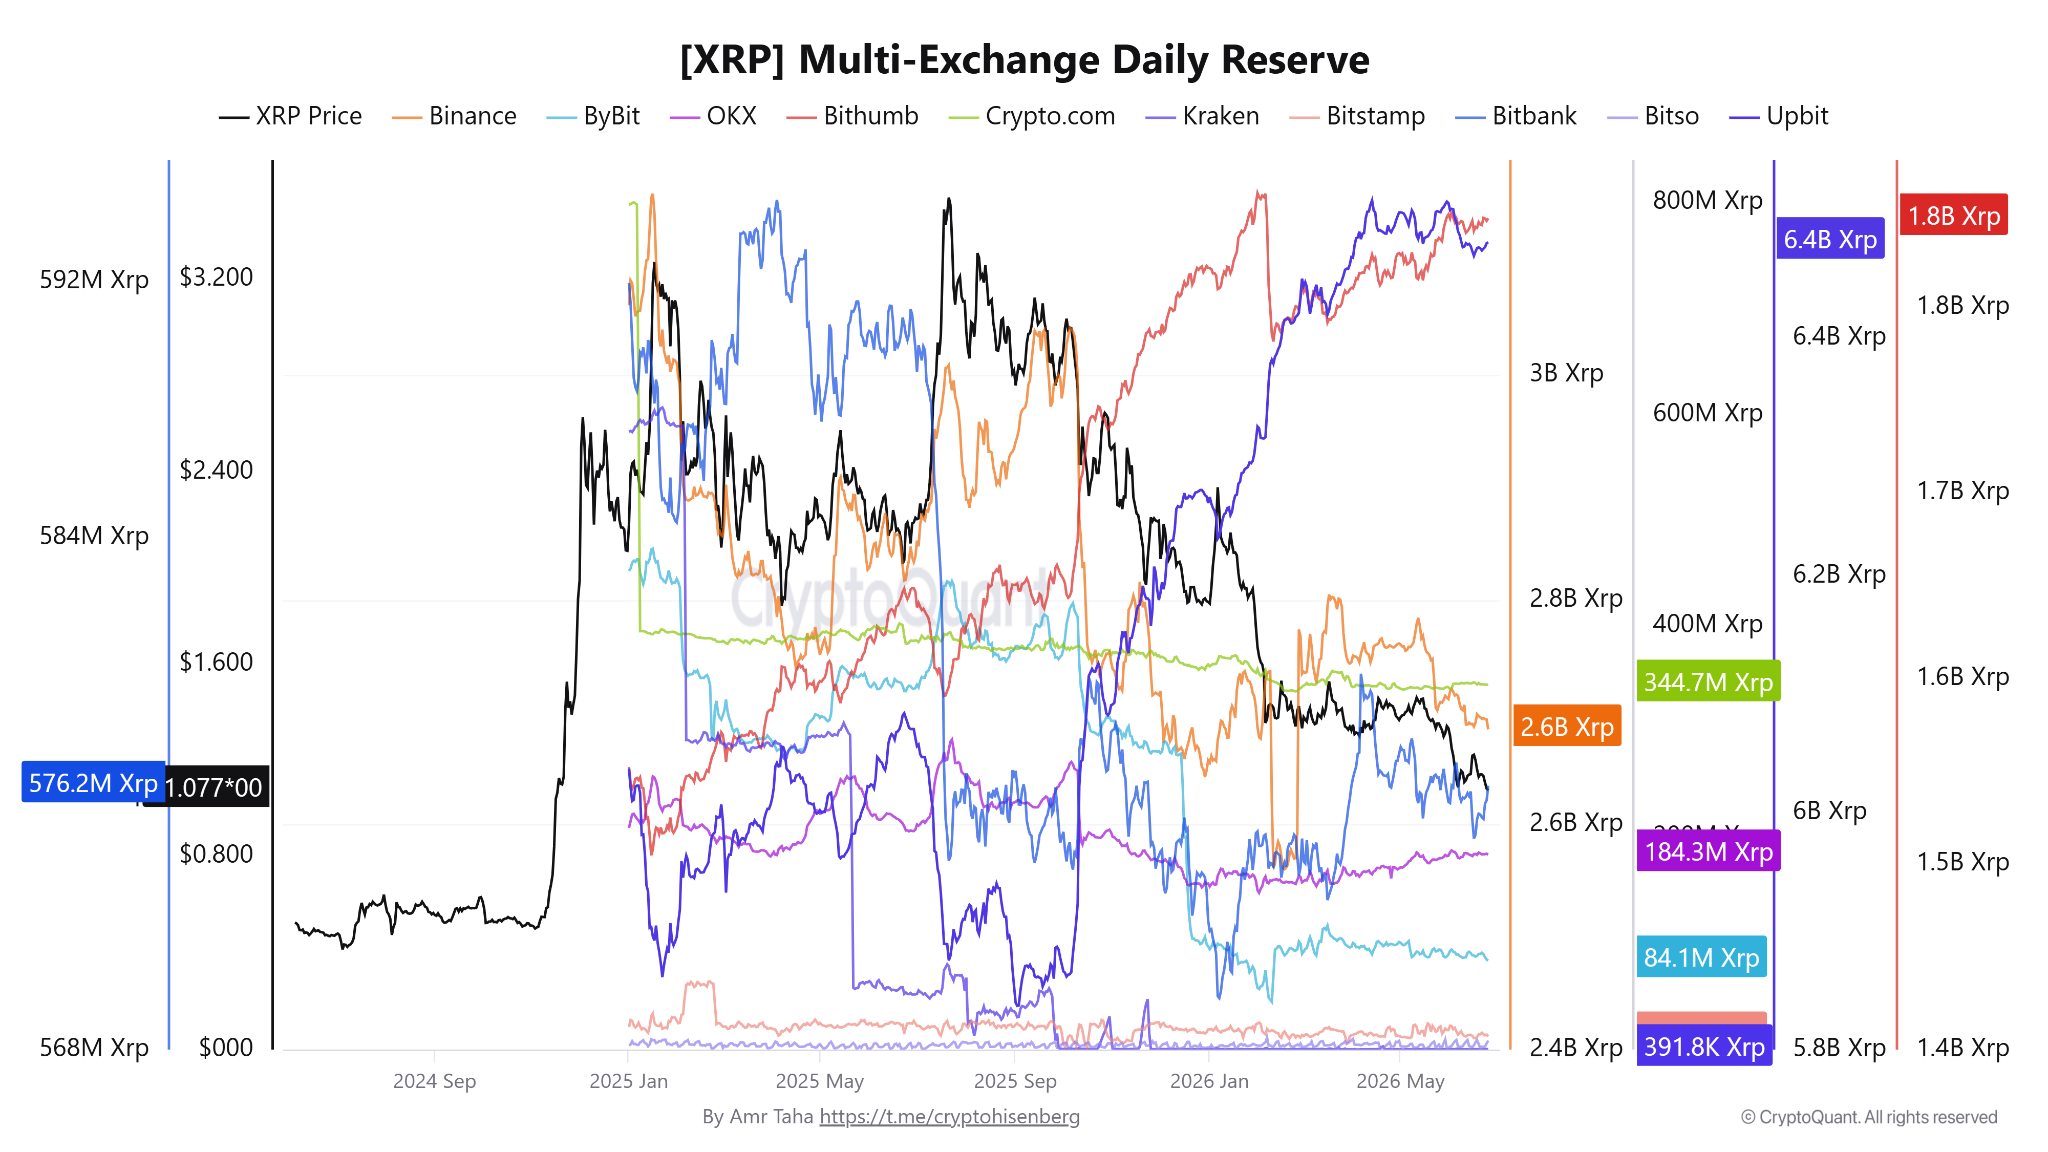
Upbit’s stockpile decreased from 2.51 billion to 2.48 billion XRP during the May 31 to June 25 period. Bybit witnessed a more pronounced percentage reduction, falling from 92 million to 82 million XRP since early June.
On Binance, withdrawal transactions have exceeded deposit activity for seven consecutive days beginning June 17. Withdrawals represented 53.8% of total flows on June 23, reaching the highest proportion since June 2024.
Major Holders and ETF Activity Show Continued Support
Significant XRP investors have maintained buying pressure. The 90-day rolling average for large holder net flows registered a positive 5.143 million XRP daily throughout the quarter.
Spot XRP ETF products recorded $2 million in net inflows on June 24, pushing June’s aggregate to $31 million. Since their April introduction, these funds have accumulated $243 million in total inflows.
ETF momentum has decelerated from initial enthusiasm. The products captured $666.61 million during November 2024 and $499.91 million in December. Throughout 2026, monthly inflows have fluctuated between $15.59 million in January and $131.94 million in May.
March remains the sole period recording negative flows, with $31 million in net outflows for the month.
At publication time, XRP was changing hands at $1.03.


US-listed spot Bitcoin exchange-traded funds saw their steepest daily net outflows of June on Thursday, extending a broader cooling in institutional demand as Bitcoin traded below $60,000.
SoSoValue data shows the ETFs collectively lost $696.3 million in net flows—above the prior monthly high of $519.2 million recorded on June 2—taking June’s total net outflows to $3.61 billion. Year-to-date, net outflows now stand at $4.6 billion.
Key takeaways
- Spot Bitcoin ETFs recorded $696.3 million in net outflows on Thursday, the largest single day of June, as Bitcoin slipped under $60,000.
- June outflows total $3.61 billion, pushing US spot ETF year-to-date net outflows to $4.6 billion, according to SoSoValue.
- Total US spot ETF assets fell below $73 billion for the first time since late 2024, down about 57% from an October 2025 peak.
- Strategy reduced its June Bitcoin buying rate to roughly 3,600 BTC so far, down sharply from May and April, with at least one small net sale reported earlier in the month.
Spot ETF outflows accelerate as Bitcoin weakens
The latest withdrawal wave underscores how quickly flows can react when price momentum turns. With Bitcoin trading below $60,000, US spot Bitcoin ETFs pulled back decisively—registering $696.3 million in net outflows on Thursday and deepening the month’s losses.
SoSoValue’s breakdown also highlights the escalation within June itself: Thursday’s figure exceeded the previous monthly high of $519.2 million set on June 2. That matters because it suggests investors’ redemption behavior is not limited to isolated days—it is broadening across the month as market conditions deteriorate.
SoSoValue further reports that June’s net outflows are now $3.61 billion, while year-to-date net outflows have reached $4.6 billion. In practice, that means ETF investors have been net sellers of exposure rather than net accumulators, even though spot ETFs were designed to provide a straightforward route into Bitcoin’s price.
ETF balance sheets shrink toward late-2024 levels
Beyond daily flows, the impact is visible in ETF balance sheets. According to SoSoValue, total net assets in US-listed spot Bitcoin ETFs dropped below $73 billion for the first time since late 2024.
SoSoValue indicates that the sector’s total net assets reached a record $169.5 billion in October 2025. As of Friday, that number had fallen to roughly $72.6 billion—an approximately 57% decline.
Separate data from WalletPilot adds another layer: the funds held a combined 1.24 million BTC as of Tuesday, and about 63,500 BTC left the products over the past 30 days. Taken together, these figures point to sustained net reductions in ETF-held Bitcoin rather than a brief drawdown.
Strategy’s June buying slows amid public pressure
ETF outflows are not the only sign of institutional appetite softening. Strategy—the largest publicly traded corporate Bitcoin holder—has reportedly reduced the pace of its purchases during June, fueling renewed debate over its approach.
Based on Strategy filings, the company bought roughly 3,600 Bitcoin in June so far. That is down from about 25,000 BTC in May and more than 50,000 BTC in April. The change is significant: it suggests Strategy is not maintaining the same monthly accumulation pace that preceded the market downturn.
The slowdown also included a notable exception earlier in the month: a net sale of 32 BTC, described as one of the few times Strategy has sold Bitcoin during its accumulation period.
Additionally, Strategy’s perpetual preferred stock (STRC) has faced pressure. The stock traded below its intended $100 level, closing at $75.69 on Thursday, down 6.37%. That has amplified scrutiny of Strategy’s capital management and timing, with CryptoQuant analysts raising concerns about the company’s risk management and purchase cadence.
Debate over timing: preserve cash vs. “self-repair” claims
The company’s reduced buying rate has split commentary in the market. Some analysts argue Strategy should pause additional Bitcoin purchases and focus on rebuilding cash reserves during a weaker period for crypto prices.
Others push back on the notion that the plan has broken down. Bitcoin advocate Samson Mow argued that STRC includes a “self-repairing mechanism” that activates when it trades below its $100 benchmark. He also noted that Strategy pauses new share issuance through its ATM program at that level, which he said helps limit additional supply.
Whether those mechanisms are sufficient to offset the near-term pressures remains a key question for observers—especially as ETF flows continue to signal demand softness.
Investors should watch whether ETF outflows stabilize in the coming sessions and whether Strategy’s purchase pace returns closer to earlier months’ levels. If redemptions persist while corporate buying remains muted, the market may struggle to reclaim the momentum that typically draws in spot ETF inflows.

Key Highlights
- Shares of AMD advanced 2.5% Thursday, reaching an intraday peak of $550.88 before closing at $532.57
- UBS increased its price objective to $670; Gartner identified AMD as “the company to beat” in the enterprise AI server CPU market
- First quarter revenue reached $10.25 billion, representing a 37.8% year-over-year increase and surpassing analyst projections
- The company’s forward P/E ratio stands at 71x compared to Nvidia’s 23x — presenting valuation considerations
- The forthcoming MI450 processor, manufactured using TSMC’s 2nm technology, aims to compete with Nvidia’s Vera Rubin architecture
Shares of Advanced Micro Devices climbed 2.5% during Thursday’s session, peaking at $550.88 before finishing at $532.57. This represented a gain from the previous day’s close of $519.74. Trading activity registered approximately 26.7 million shares, falling about 29% short of the typical daily volume of 37.7 million.
Advanced Micro Devices, Inc., AMD
The upward movement occurred on below-average volume, indicating the rally wasn’t driven by widespread market momentum. However, the catalyst behind the move was unmistakable: a series of favorable analyst assessments.
Reports indicate UBS elevated its price objective for AMD to $670. Additionally, technology research leader Gartner designated AMD as “the company to beat” in the enterprise AI server CPU sector — a designation that resonated throughout investment circles.
The broader analyst community maintains a favorable outlook on AMD. Among those monitored by MarketBeat, 28 analysts recommend Buy, 12 suggest Hold, two rate it Strong Buy, and just one recommends Sell.
The consensus price target currently rests at $440.41, although several recent revisions have elevated forecasts considerably. Mizuho increased its target to $615 while TD Cowen adjusted upward to $600, both maintaining constructive ratings.
The company’s first quarter performance, announced on May 5th, reinforced the positive sentiment. Revenue totaled $10.25 billion, exceeding the $9.90 billion projection and marking a 37.8% increase compared to the prior year period. Earnings per share reached $1.37, topping the consensus estimate of $1.29.
Valuation Questions Persist Among Investors
Notwithstanding solid operational performance, AMD’s valuation multiple has emerged as a recurring topic among market watchers. The stock currently carries a trailing P/E ratio near 171x and a forward P/E of 71x. Nvidia, in contrast, trades at a forward P/E of approximately 23x.
Several market observers have highlighted that AMD’s elevated valuation multiples provide limited margin for disappointment. Should growth projections fall short of expectations, even marginally, the stock could experience downward pressure. One analysis noted that even Micron’s robust quarterly results failed to provide uplift to AMD shares, suggesting a more discriminating market climate.
Chief Executive Lisa Su divested 125,000 shares on June 10th at an average execution price of $460.69, generating proceeds of approximately $57.6 million. The divestiture was conducted through a previously established 10b5-1 trading arrangement. Executive Vice President Mark Papermaster similarly sold 6,000 shares on June 15th at $536.33. Both transactions were pre-scheduled rather than opportunistic.
The MI450 Represents the Next Major Milestone
AMD’s upcoming significant product launch centers on the MI450 processor, which is being produced utilizing TSMC’s cutting-edge 2-nanometer manufacturing process. This represents a generational advantage over Nvidia’s 3nm Vera Rubin architecture.
The MI450 is projected to feature 432 GB of HBM4 memory capacity, substantially exceeding Vera Rubin’s 288 GB configuration. Industry analysts also anticipate AMD will deliver superior total cost of ownership economics, a consideration that carries weight in hyperscale data center procurement decisions.
AMD’s current market capitalization hovers around $868 billion, representing a small fraction of Nvidia’s $4.9 trillion valuation. This disparity forms a central component of the bullish investment thesis — significant expansion potential remains.
The company’s data center business segment now contributes 56% of total revenue. Nvidia’s comparable segment represents 92% of its revenue mix, highlighting both how much ground AMD must cover and the substantial growth opportunity that lies ahead.
Institutional investors hold 71.34% of outstanding shares. Wall Street projects full-year earnings per share of $6.15 for the current fiscal period.

Key Highlights
- Wise shares advanced 8% following FY26 results that exceeded the firm’s profit margin guidance
- Pre-tax income reached $660.4 million with a 26.4% margin — surpassing the 20–25% target corridor
- Net revenue expanded 19% annually to $2.50 billion
- The company unveiled a $500 million share buyback initiative for FY27
- Customer base expanded 21% to 19 million users; cross-border transaction volume surged 31% to $243.5 billion
Shares of Wise (WSE) climbed approximately 8% on Friday following the fintech firm’s release of annual financial results that exceeded profit margin projections, complemented by the announcement of a $500 million share repurchase initiative.
Wise Group plc Class A Ordinary Shares, WSE
The shares were changing hands at approximately 894p on the London Stock Exchange during morning trading, representing a gain of 64 points.
The payment platform reported net revenue reaching $2.50 billion for the fiscal year concluding March 31, 2026, marking a 19% year-over-year increase. Pre-tax income totaled $660.4 million, translating to a margin of 26.4%.
This profitability metric exceeded the company’s medium-term guidance corridor of 20–25%, capturing investor attention.
BofA analysts, maintaining a buy rating with a $16.40 price objective, noted that pre-tax profit exceeded their projection by 6.6% and consensus estimates by 1.3%.
The analysts identified a $70 million non-recurring U.S. GAAP foreign exchange adjustment linked to specific government bonds as the primary factor impacting operating income, which settled at $590.7 million.
The platform’s active user base expanded 21% to 19 million. Cross-border transaction volume increased 31% to $243.5 billion, while the cross-border take rate remained at 0.52%, declining six basis points year-over-year.
Card expenditure grew 37% to $43.6 billion. Customer balances increased 40% to $39.0 billion — indicating that more clients are maintaining funds on the platform for regular usage rather than solely for transfers.
Transaction-based revenue totaled $1.89 billion. Net interest income added $609.2 million to overall net revenue after distributing $196.9 million in interest payments to account holders.
CEO Kristo Käärmann emphasized that 75% of transactions in Q4 were processed in under 20 seconds worldwide — a metric the company prominently features in its competitive positioning.
Share Repurchase and Shareholder Returns
Wise announced plans to allocate over $500 million toward share buybacks during FY27. Approximately 40% of this amount will support its ongoing Employee Share Trust initiative to counterbalance dilution from equity-based compensation.
The firm separately deployed $470 million to repurchase 35.9 million shares throughout FY26.
BofA increased its FY27 diluted earnings per share forecast by 5.7% to 54.34 cents, citing improved gross profit margins and the buyback program as key contributors.
Fiscal Year 2027 Guidance
Looking ahead, Wise projected net revenue growth near the midpoint of its 15–20% medium-term target range, calculated on a constant currency basis.
This forecast assumes no significant changes in interest distributed to customers and no substantial movements in central bank policy rates.
Pre-tax income margin is anticipated to land near the upper boundary of the 20–25% range for FY27.
Wise finalized its transition to a Nasdaq primary listing on May 8, maintaining a secondary listing on the London Stock Exchange.
The firm disclosed that it established new direct payment connections in Brazil and Japan during FY26 and secured fresh regulatory approvals in South Africa, the UAE, and Thailand.
New Wise Platform collaborations launched during the period include UniCredit, Raiffeisen Bank, and MBSB Bank, with Capitec coming onboard in April 2026.

US-listed spot Bitcoin exchange-traded funds (ETFs) recorded their largest daily net outflows of June on Thursday as Bitcoin fell below $60,000.
Spot Bitcoin ETFs shed $696.3 million, surpassing the previous monthly high of $519.2 million logged on June 2, according to SoSoValue data.
The latest withdrawals pushed June’s total outflows to $3.61 billion, bringing year-to-date net outflows to $4.6 billion.
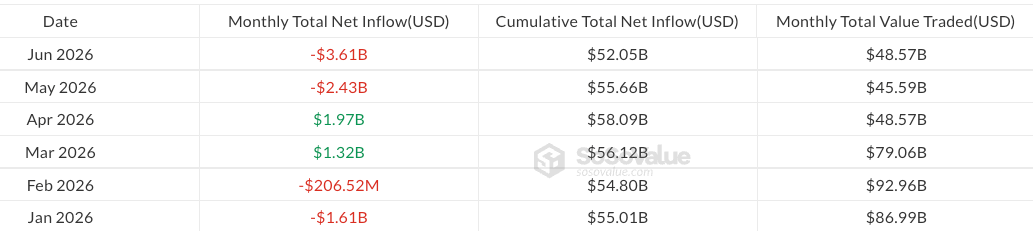
Monthly flows in US spot Bitcoin ETFs as of Friday. Source: SoSoValue
The ETF outflows coincide with signs that other large sources of institutional Bitcoin demand are also slowing. Strategy, the world’s largest corporate Bitcoin holder, has reduced its accumulation pace in June, prompting debate over whether the company should conserve cash during the market downturn.
ETF assets down 57% from 2025 peak
US-listed spot Bitcoin ETFs have seen total net assets fall below $73 billion for the first time since late 2024, as recent outflows and a roughly 50% drop in Bitcoin’s price from its October peak weigh on the sector.
According to SoSoValue, total net assets in US spot Bitcoin ETFs reached a record $169.5 billion in October 2025. As of Friday, that figure stood at about $72.6 billion, a decline of roughly 57%.
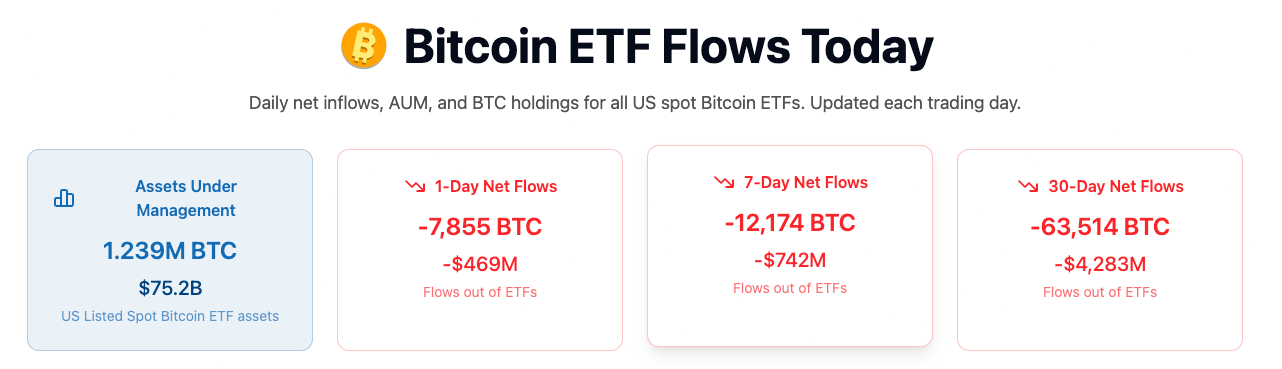
BTC holdings for US spot Bitcoin ETFs as of market close on Tuesday. Source: Wallet Pilot
Separate data from WalletPilot shows the funds held a combined 1.24 million BTC as of Tuesday, with about 63,500 BTC leaving the products over the past 30 days.
Strategy slows Bitcoin buying in June to about 3,600 BTC amid criticism
Some analysts argue that Strategy should pause BTC purchases and rebuild its cash reserves.
Saylor’s Strategy bought roughly 3,600 Bitcoin so far in June, down from about 25,000 BTC in May and more than 50,000 BTC in April, according to company filings.
The slowdown also included a net sale of 32 BTC earlier in the month, one of the few times the company has sold Bitcoin during its accumulation period.
Related: Strategy adds $300M to USD Reserve, acquires 520 BTC
Strategy’s perpetual preferred stock, STRC, has come under pressure, trading below its intended $100 level. STRC closed at $75.69 on Thursday, down 6.37%.
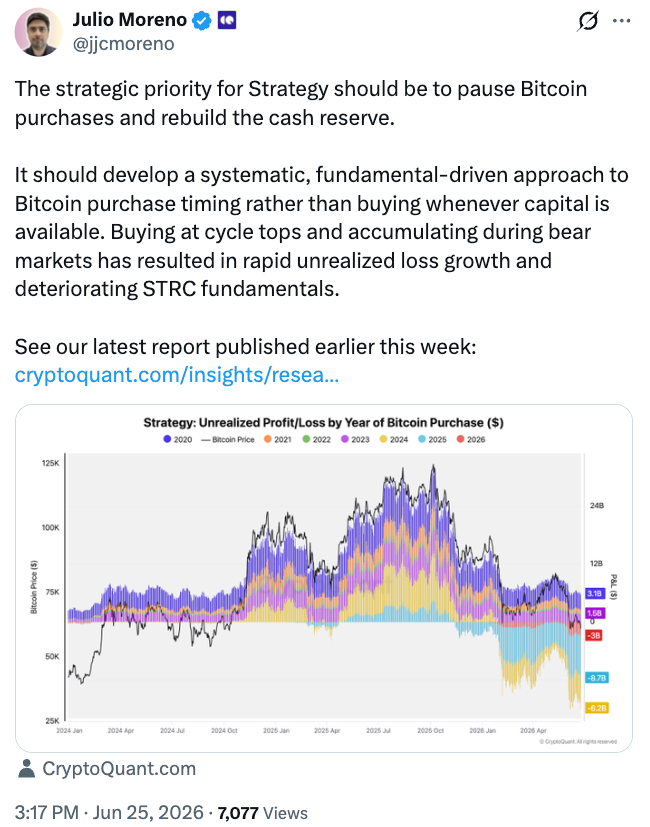
Source: Julio Moreno
The move has fueled debate over Strategy’s Bitcoin-buying model. CryptoQuant analysts have raised concerns about the company’s timing and risk management.
On the other hand, Bitcoin advocate Samson Mow said STRC has a “self-repairing mechanism” that activates when it trades below its $100 benchmark. He noted that the company pauses new share issuance through its ATM program at that level, which limits new supply.
Magazine: Bitcoin slides to $58K, XRP hits $1 but onchain data promising: Market Moves


Ondo Finance, Virtuals Protocol, and Treasures opened more than 430 tokenized stocks to over 40,000 autonomous artificial intelligence (AI) agents on Friday, letting the bots trade onchain equities.
Treasures handles the execution, while Ondo powers the tokenized equities. At launch, the service covers US stocks on Ethereum and Solana, subject to certain jurisdiction restrictions.
AI Agents Step Into Tokenized Equity Trading as Sector Tops $1.5 Billion
Tokenized stocks rank among crypto’s fastest-growing segments. Their distributed value reached about $1.5 billion, according to the data platform RWA.xyz.
That marks roughly 360% year-over-year growth. Ondo Finance leads the segment with more than 57% market share.
Virtuals noted that algorithmic systems already handle about two-thirds of US equity volume, though mostly inside large institutions. The integration opens that same direct-trading capability to any agent.
According to the latest announcement, traders can now leverage agent hedge funds, run copy-trading vaults, hand portfolios full autonomy, or set programmatic strategies that trade nonstop.
Follow us on X to get the latest news as it happens
The launch joins a wider race to make AI agents active financial participants. Mastercard launched Agent Pay for Machines (AP4M), a payment system that enables AI agents to buy and sell services.
Robinhood launched Agentic Trading on May 27. Coinbase also introduced a tool to connect AI agents to customer accounts.
However, US lawmakers have flagged concerns. House Financial Services Committee Democrats pressed the SEC this week on how it oversees AI agents trading for retail investors.
Representatives Bill Foster and Brad Sherman posed 13 questions to SEC Chair Paul Atkins. They set a July 31 deadline and warned that agents trained on similar data could herd and amplify volatility.
Subscribe to our YouTube channel to watch leaders and journalists provide expert insights
The post AI Agents Expand Into Tokenized Stocks as Agentic Finance Race Accelerates appeared first on BeInCrypto.
Crypto World
Ethereum Price Prediction: A Forgotten Bull Signal as SharpLink Loads Up on ETH After 8 Month Hiatus

SharpLink Gaming just broke an eight-month silence on Ethereum, and could likely flip its price prediction. ETH itself is currently on a downtrend, barely holding above a structural trendline break.
Just a few hours ago, SharpLink added 5,000 ETH to its treasury after an eight-month pause, resuming accumulation despite sitting on a reported $1.71 billion unrealized loss on its existing position.
It’s not pretty, but buying through a nine-figure drawdown shows conviction, and it echoes institutional treasury accumulation logic that preceded major Bitcoin re-ratings when Strategy held through similar paper losses. The move also landed while spot ETH ETF inflows remain inconsistent, which makes the corporate bid marginally more significant as a demand signal.
Not just Ethereum, derivatives activity hit record levels this week alongside the SharpLink announcement. But what’s next for ETH? Can it break its downtrend?
Discover: The Best Token Presales
Ethereum Price Prediction: Running Before the Resistance Band Breaks It?
Ethereum is trading at $1,550 after a sharp decline this month. Price remains below major resistance, while recent sessions show buyers defending the lower range. The nearest support sits around $1,500–$1,550, a zone that has attracted demand several times recently.
Meanwhile, momentum remains mixed. The market has not reached overheated conditions, leaving room for a recovery if buying pressure improves. However, bulls still need to reclaim higher resistance levels before a stronger trend reversal can be confirmed.

On the upside, immediate resistance stands near $1,700–$1,750. A sustained move above that area could target $1,850 and potentially $2,000. Until then, Ethereum remains in a recovery phase rather than a confirmed uptrend.
The bullish scenario requires Ethereum to hold above the $1,500 support zone and break through $1,750. In that case, momentum could accelerate toward higher levels. Conversely, a failure to defend support may expose the market to another test of recent lows near $1,400.
Institutional interest and long-term accumulation remain supportive factors. Even so, price action remains the key signal. A decisive close above major resistance is still needed before the market can confirm a durable trend change.
Discover: The Best Crypto to Diversify Your Portfolio
LiquidChain Targets Early-Mover Upside as Ethereum Tests Key Levels
ETH at $1,500 is structurally constructive. But for traders who’ve watched Ethereum grind through resistance for months, the upside math from current levels, even to $2,000, requires patience and tolerance for drawdowns that could touch $1,800 first. That’s not a knock on ETH; it’s just the reality of buying into a $200 billion asset at a technical decision point. Early-stage infrastructure plays offer a different risk profile entirely.
LiquidChain ($LIQUID) is a Layer 3 infrastructure project targeting the cross-chain liquidity problem directly, fusing Bitcoin, Ethereum, and Solana liquidity into a single execution environment through its Unified Liquidity Layer.
The Order prepares…
LiquidChain grows in power.⟁https://t.co/vqvBcdSQYC pic.twitter.com/uOSFmzyQ74
— LiquidChain (@getliquidchain) June 26, 2026
The architecture includes Single-Step Execution, Verifiable Settlement, and a Deploy-Once model that lets developers access all three ecosystems without rebuilding for each chain. Presale price is currently $0.01473, with $870K raised to date.
Research LiquidChain before the current presale tranche closes.
Don’t Miss Out on Our $1,000 USDT Airdrop on ByBit
The post Ethereum Price Prediction: A Forgotten Bull Signal as SharpLink Loads Up on ETH After 8 Month Hiatus appeared first on Cryptonews.


Bitget, the world’s largest Universal Exchange (UEX), has launched the third year of its Anti-Scam Month initiative with the release of its Anti-Scam Report 2026 titled “The Evolution of Fraud in the Multi-Asset Era”, developed in partnership with blockchain security firm SlowMist. As digital finance expands across cryptocurrencies, tokenized assets, stocks, CFDs, wallets, and AI-powered investment tools, the report examines how fraud is adapting to changing investor behavior and increasingly interconnected financial ecosystems.
The report finds that changes in user behavior are reshaping how fraud campaigns are designed and deployed across digital finance. According to Bitget Research, the share of active users participating across two or more asset classes grew from under 1% in mid-2025 to more than 10% by May 2026. As users move across a wider range of products and platforms, fraud campaigns are increasingly blending multiple narratives, social engineering tactics, AI-generated content, and multiple communication channels within a single operation.
Drawing on Bitget Research and investigations conducted by SlowMist, the report found that many successful scams no longer rely on a single point of compromise. Fraud operators guide victims through a sequence of interactions spanning social media platforms, messaging applications, investment communities, phishing infrastructure, and wallet activity before assets are ultimately stolen. Between July 2025 and June 2026, Bitget’s security infrastructure intercepted more than 150 million malicious requests, identified over 13,000 high-risk malicious IP addresses, handled 18,135 user protection cases, and supported the recovery of $32.3 million linked to security incidents and fraudulent activity.
“Security challenges evolve alongside markets. As more users participate across crypto, stocks, tokenized assets and AI-powered products, fraud campaigns are becoming sophisticated in how they build trust and influence decision-making. Understanding those risks is an important step toward protecting users and strengthening confidence across the broader ecosystem,” said Gracy Chen, CEO of Bitget.
The report identifies several trends shaping the current fraud environment, including AI-generated investment personas, deepfake-enabled scams, voice-cloning attacks, synthetic investment communities, wallet-draining operations, malicious smart contracts, and increasingly sophisticated phishing campaigns. Among the cases examined are a deepfake investment scam impersonating Cypriot President Nikos Christodoulides, an AI-generated investment advertising campaign that reportedly defrauded thousands of Swedish investors, the Truman Show synthetic community scam involving approximately 90 fabricated investor identities, and the Rublevka Team wallet-draining operation documented in early 2026.
Beyond examining how scams operate, the report explores victim psychology, common scam entry points, post-theft asset movement, and recovery challenges. It also outlines practical measures users can take to strengthen account security, recognize AI-enabled deception, evaluate investment opportunities more effectively, and respond to security incidents.
Since launching Anti-Scam Month in 2024, Bitget has worked with security researchers, ecosystem partners, and industry organizations to improve awareness around emerging threats and promote stronger user protection practices. Throughout June, Bitget’s Anti-Scam Month campaign will feature educational content, security awareness initiatives, and collaborations with industry partners aimed at helping users identify emerging threats and strengthen their ability to protect digital assets.
For more information, please read the report here.
About Bitget
Bitget is the world’s largest Universal Exchange (UEX), serving over 125 million users and offering access to over 2M crypto tokens, 500+ tokenized stocks, ETFs, commodities, FX, and precious metals such as gold. The ecosystem is committed to helping users trade smarter with its AI agent, which co-pilots trade execution. Bitget is driving crypto adoption through strategic partnerships with LALIGA and MotoGP™. Aligned with its global impact strategy, Bitget has joined hands with UNICEF to support blockchain education for 1.1 million people by 2027. Bitget currently leads in the tokenized TradFi market, providing the industry’s lowest fees and highest liquidity across 150 regions worldwide.
For more information, visit: Website | Twitter | Telegram | LinkedIn | Discord
The post Bitget Launches Third Year of Anti-Scam Month with New Report on Multi-Asset Fraud appeared first on BeInCrypto.
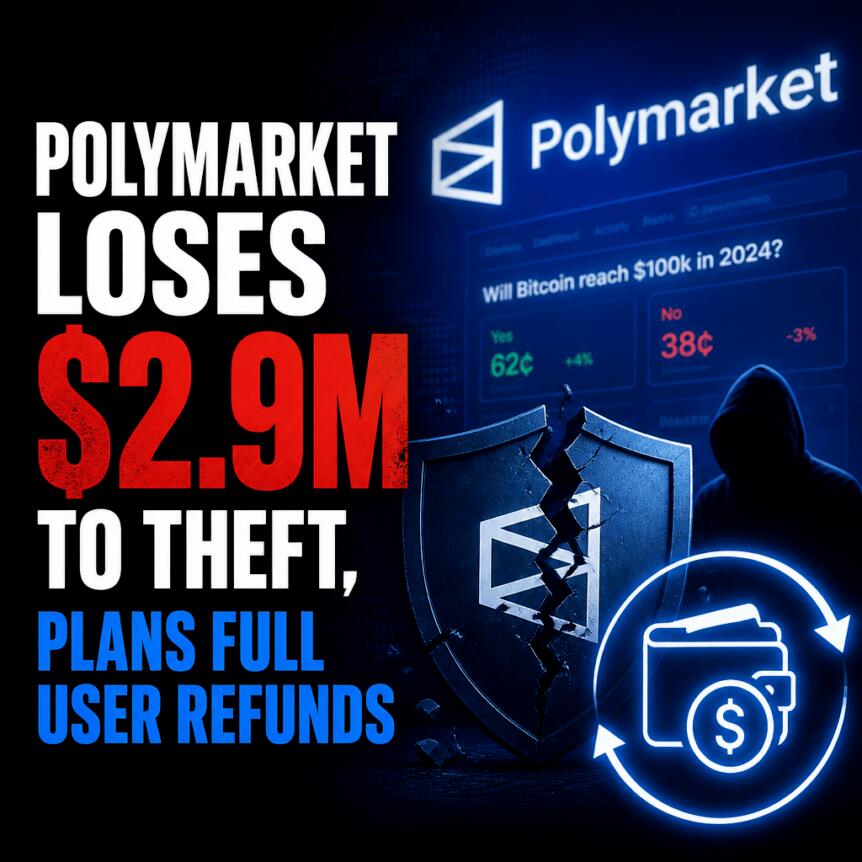
A third-party vendor compromise allowed attackers to inject malicious code into Polymarket’s frontend, leading to a phishing drain from user wallets, according to blockchain analyst Specter. The incident was discovered on Thursday and reportedly targeted at least 11 Polymarket users, with Specter estimating losses of $2.94 million.
Polymarket said on X that the issue has been contained, the affected dependency removed, and that users will be fully refunded. While Cointelegraph attempted to follow up for additional comment, no response was received before publication.
Key takeaways
- Specter attributed the Polymarket incident to malicious script injection following a vendor compromise, with an estimated $2.94 million drained from at least 11 wallets.
- Polymarket states the compromise has been contained and that the impacted dependency was removed, with full user refunds promised.
- DefiLlama data shows June exploit losses reached $74.9 million across 29 incidents—more than May’s $60.5 million, but far below April’s $644 million.
- Across the last 30 days, private key compromises accounted for 43% of reported exploit losses, making it the leading attack vector.
- DefiLlama’s breakdown points to other recurring methods, including “fake proof” exploits (10%) and reverse MEV honeypots (8%).
Polymarket: vendor compromise leads to frontend phishing
Specter said the malicious script appeared to be designed to facilitate phishing, ultimately draining funds from multiple Polymarket wallets. The key operational detail in the account is that the attacker did not need to compromise Polymarket’s core smart contracts directly; instead, the issue originated from a third-party vendor compromise that enabled code injection into the platform’s frontend.
That distinction matters for users because frontend-based attacks can succeed even when on-chain contracts remain intact. In practice, phishing scripts can trick users into approving malicious actions, entering credentials into spoofed interfaces, or signing transactions that benefit attackers.
Polymarket’s response emphasized containment and remediation: the platform said the compromise has been stopped, the problematic dependency removed, and affected users will receive full refunds. With those steps, the immediate risk of further wallet draining should decline, though users will still want to monitor their accounts and transaction history for any suspicious approvals.
Why this sits within a larger pattern of crypto incidents
The Polymarket event comes amid a sustained run of reported crypto security breaches. DefiLlama data lists the Polymarket incident as the 89th reported crypto security breach of the second quarter. That count extends what DefiLlama categorization describes as the most-hacked quarter on record by incident count.
Earlier in June, DefiLlama’s monthly totals already reflected elevated activity. June exploit losses climbed to $74.9 million across 29 reported incidents, surpassing May’s $60.5 million. However, April’s $644 million remains the standout outlier for magnitude, underscoring that while breach frequency remains high, individual months can vary dramatically based on whether large incidents occur.
June’s reported exploit losses: the biggest June incidents
DefiLlama’s aggregation highlights several of the largest June events. The most prominent was the $36 million Humanity Protocol exploit. Other notable losses included the $4.7 million Secret Network bridge exploit, two Aztec-related exploits worth $2.1 million each, and a $1.7 million bridge exploit tied to Taiko, according to the article’s cited figures and linked coverage.
Taken together, the list shows that bridge ecosystems and cross-chain integrations continue to attract high-impact attacks. While frontend phishing attacks like Polymarket’s are distinct from bridge exploits, both categories fall under the broader umbrella of “exploit losses”—the measurable outcomes when attackers successfully compromise systems or user interactions.
Attack vectors over the last month: key compromise still leads
DefiLlama data summarized in the piece indicates that the primary driver of reported exploit losses over the past 30 days was private key compromise, responsible for 43% of losses. Fake proof exploits accounted for 10%, while reverse MEV honeypots made up 8% of losses, based on DefiLlama’s breakdown.
The vector mix is useful because it shifts how defensive priorities are framed. Private key compromise suggests either user-side weakness (including wallet security practices) or operational weaknesses involving signing keys—issues that often persist across unrelated protocols. Meanwhile, fake proof and reverse MEV honeypots reflect more sophisticated adversarial tactics at the application and execution layers, targeting how systems validate claims or how trading bots execute orders.
The article also notes that roughly a month before Polymarket’s latest attack, the prediction market disclosed a separate $600,000 exploit traced to a six-year-old private key used for internal top-up operations. Polymarket leadership said at the time that user funds and contracts were safe and that permissions tied to the key had been revoked, emphasizing that the platform has dealt with operational key risks before.
Polymarket’s scale and what users should monitor next
DefiLlama data cited in the article places Polymarket’s total value locked at over $450 million, up 301% from $112 million a year earlier. As platforms grow, they often become more attractive targets—not only for contract-level attacks but also for the broader supply-chain and integration risks that can surface through third-party dependencies.
Going forward, readers should watch for two signals: confirmation from Polymarket and security analysts that the injected frontend dependency is fully removed and no similar vendor-based pathways remain, and whether wallet-level incidents prompt changes in how users interact with the platform (for example, renewed scrutiny of approvals and transaction prompts). With refunds promised, the immediate impact may be contained, but the recurrence of earlier key-related disclosures underscores that operational security remains a critical focus for both users and the platforms they rely on.

Key Takeaways
- Samsung Electronics shares plummeted 7.8% to ₩330,500 Friday amid a broad technology sector selloff across Korean exchanges
- Investor sentiment deteriorated after Apple revealed price hikes for MacBook and iPad products, casting doubt on AI hardware demand
- Amplified losses occurred through leveraged single-stock ETFs focused on Samsung and SK Hynix
- The KOSPI index tumbled over 8%, activating its fifth circuit breaker halt in 2026
- Reports emerged of Samsung preparing a ₩1,000 trillion ($646 billion) decade-long investment strategy covering chips, AI infrastructure, and more
Samsung Electronics shares collapsed 7.8% to close at ₩330,500 Friday, compounding a devastating week that witnessed a single-day decline exceeding 12% just two days earlier on June 23.
Samsung Electronics Co., Ltd., SMSD.L
The Monday session’s plunge activated the KOSPI’s fourth trading halt of 2026. Friday’s action brought a fifth suspension, with the Korea Exchange implementing a 20-minute freeze beginning around 12:10 p.m. Seoul time as the main index crashed through the 8% decline threshold.
The catalyst for Friday’s turmoil originated from Apple, which revealed significant price increases spanning its MacBook and iPad product portfolios, citing elevated memory and component expenses. The announcement shattered confidence among investors banking on a prolonged AI-fueled hardware expansion cycle.
Chip manufacturers worldwide absorbed heavy losses. SK Hynix, Samsung’s primary domestic competitor, suffered a parallel decline exceeding 8%, while leveraged ETFs tracking both semiconductor leaders plunged beyond 15%.
Leveraged Products Intensified Selling Pressure
Single-stock leveraged exchange-traded funds concentrated on Samsung and SK Hynix have emerged as a mounting worry for South Korean financial authorities. Friday’s session validated those concerns as these instruments amplified market movements far beyond what underlying business fundamentals would typically justify.
The outcome generated a self-reinforcing cycle of liquidation that punished Samsung more severely than headline developments alone warranted.
Japan’s Nikkei 225 index similarly declined in response, demonstrating the velocity at which the selloff propagated throughout the region.
Following a substantial rally during the previous twelve months, Friday’s decline partially reflects profit-taking behavior after an impressive advance. Market reversals can accelerate dramatically when investor psychology shifts.
Massive $646 Billion Capital Plan Sparks Investor Anxiety
The timing proved particularly unfortunate. Domestic media outlets disclosed this week that Samsung intends to unveil a ₩1,000 trillion ($646 billion) investment blueprint spanning the next ten years — potentially representing the largest corporate capital commitment in South Korean corporate history.
The initiative reportedly encompasses semiconductor manufacturing facilities, AI data infrastructure, battery production, and display technology. Approximately ₩300 trillion targets chip fabrication plants in the nation’s southwestern region, while more than ₩350 trillion focuses on AI data centre development.
South Korean President Lee Jae Myung plans to convene a national economic presentation on June 29, where Samsung Vice Chairman Jun Young-hyun and SK Hynix CEO Kwak Noh-jung will both outline their respective investment strategies.
Rather than embracing the announcement enthusiastically, certain investors interpreted the enormous spending obligation as problematic. Committing hundreds of trillions of won toward infrastructure development during uncertain chip demand conditions represents considerable risk exposure.
SK Hynix independently disclosed intentions to secure up to $29.4 billion through a Nasdaq listing of American Depositary Receipts, channeling proceeds toward expanded fabrication plants, advanced packaging operations, and manufacturing equipment.
Both declarations arrive as South Korea endeavors to maintain competitive positioning in the worldwide AI and semiconductor landscape amid escalating competition from the United States and China.
SK Hynix shares traded down 8.36% at press time, while Samsung recovered slightly to ₩339,500 after trimming earlier losses.
Crypto World
Critical Moment for Ripple (XRP), Important Pi Network (PI) Updates, and More: Bits Recap June 26

The cryptocurrency market just can’t catch a break, sliding into yet another sharp pullback several hours ago. Ripple’s XRP tumbled to its lowest level since late 2024, while Cardano’s ADA fared even worse.
Meanwhile, Pi Network’s team issued key announcements and hinted at major updates that could arrive later this week.
XRP on the Edge
Ripple’s cross-border token lost another 21% of its value over the past month, and several hours ago it plummeted to just north of the psychological $1 mark.
Speaking on the downturn, X user CasiTrades highlighted some key levels that could come into play if the bears remain in charge. She described $0.93 as a buying opportunity, while $0.87 was depicted as a primary target. The analyst also argued that XRP is at its “most critical moment in the market cycle.”
“Correction is approaching its final level. The fear will be LOUD! People will likely start calling for lower and lower prices as the level is reached. They’ll tell you the market is going to zero. But don’t let someone else’s fear cause you to miss your own opportunity. Every major trend begins when sentiment is at its worst. The correction is doing exactly what it should. This is a perfect market structure,” she added.
X user Gerla also gave their two cents. They claimed that XRP is nearing the end of a seven-year wedge and predicted that “the next move could be the biggest one in years.”
What Is Pi Network Preparing?
The Core Team has been quite active lately, unveiling important protocol updates and other ecosystem advancements. The community, though, expects more groundbreaking announcements that could trigger a price rally for PI, which is why it has set its attention on Pi2Day – the symbolic day celebrated each year on June 28.
Earlier this week, Pi Network added more fuel to the mounting speculation by highlighting last year’s event, which included Pi App Studio, Directory Staking, Node updates, and other releases.
“Stay tuned on June 28 for what’s to come,” it teased.
Additionally, the team reminded that Pi2Day represents the final deadline for the Vibe Coder campaign, which aims to bring AI-powered apps into the project’s distribution network via Pi App Studio. June 28 will also mark the close of the Pi Launchpad testing period, which features the debut of the SLICE test token.
ADA Bleeds Heavily
The token is no longer part of crypto’s top 20 club, and earlier today its price briefly fell below $0.14 for the first time since 2020. Some of the primary reasons behind its downfall include the broader market collapse, Charles Hoskinson’s concerning comments, and the exploit of the Cardano ecosystem project SecondFi.
The popular analyst Ali Martinez revealed that ADA’s TD Sequential indicator flashed a buy signal, which could result in a resurgence to as high as $0.176. However, the revival might be short-lived and followed by another leg down:
“While this indicator signals a near-term bounce, the broader market structure suggests caution. This localized push may act as a trap to lure in buyers before hitting immediate resistance and continuing lower.”
The post Critical Moment for Ripple (XRP), Important Pi Network (PI) Updates, and More: Bits Recap June 26 appeared first on CryptoPotato.

Factbox-International aid heads to Venezuela after deadly earthquake

Bitcoin ETF Flows Turn Negative After June’s Largest Outflows as BTC Slides Below $60K

Wimbledon 2026: How to watch on BBC TV & iPlayer plus radio and BBC Sport website coverage times

No Jackpot Winner as $257 Million Prize Rolls Over to $269 Million Monday Draw

Blockchain.com files with SEC for U.S. IPO

Weekend Open Thread: Miami – Corporette.com

BITCOIN und ALTCOINS: Wann schwappt die Euphorie-Welle von den US-Indizes zu den Kryptos?

Pakistan Lifts Ban on Crypto Trading, Banks Allowed to Open Accounts | Economy Matters

Birdman – Money To Blow (Official Music Video) ft. Lil Wayne, Drake
-
 Fashion7 days ago
Weekend Open Thread: Miami – Corporette.com
-

 Entertainment6 days ago
Renter of Home in Anne Heche Crash Denies Settlement With Son
-
 Sports3 days ago
Two goals and an assist by sheer aura: Cristiano Ronaldo just entered the World Cup chat
-

 Tech4 days ago
Microsoft accidentally kills epic Outlook email threads
-

 Business6 days ago
Soccer-U.S. defends Iran World Cup travel restrictions, says discussions ongoing
-

 Politics9 hours ago
Potential 2028er World Cup attendee leaderboard
-

 Politics6 days ago
Andy Burnham and the meaning of Makerfield
-

 Politics5 hours ago
The House | Manchesterism won’t survive the painful trade-offs unless it gets citizens on board
-

 NewsBeat7 days ago
Keir Starmer Allies Question His Chances For No 10
-

 Tech15 hours ago
A Look At A Gaggle Of Transputer Boards
-
Crypto World2 days ago
Bitcoin (BTC) Dips Below $62K, Ethereum (ETH) Plunges 6% Daily: Market Watch
-

 Crypto World2 days ago
Securitize Wraps Roubini's SEC-Registered ETF as Dubai VARA Digital Security
-
 Crypto World17 hours ago
Dell (DELL) Shares Tumble Over 5% Following Analyst Downgrade to Hold
-
Business2 days ago
Entergy settles forward sale agreements, raises $672 million in cash proceeds
-
 Business6 days ago
Wall Street Week Ahead: Investors see Micron earnings as pulse check of AI rally momentum
-
 Crypto World6 days ago
Can Charles Hoskinson Really Rescue Cardano?
-

 Entertainment6 days ago
Jose Alvarado Wants Taylor Swift at More Knicks Games
-

 Crypto World6 days ago
HIVE shares jump as $220M AI deal speeds Bitcoin mining pivot
-

 Crypto World6 days ago
Jake Chervinsky accuses CME of protecting derivatives monopoly
-

 Sports22 hours ago
India vs Bangladesh LIVE Score, Women’s T20 World Cup: Bangladesh Opt To Bat; India Enter ‘Do-Or-Die’ Stage As Semi-Final Race Heats Up
You must be logged in to post a comment Login