
Crypto World
Zoomex Deepens TradFi Push With 50+ Stock Perpetuals and Zero-Fee TradFi

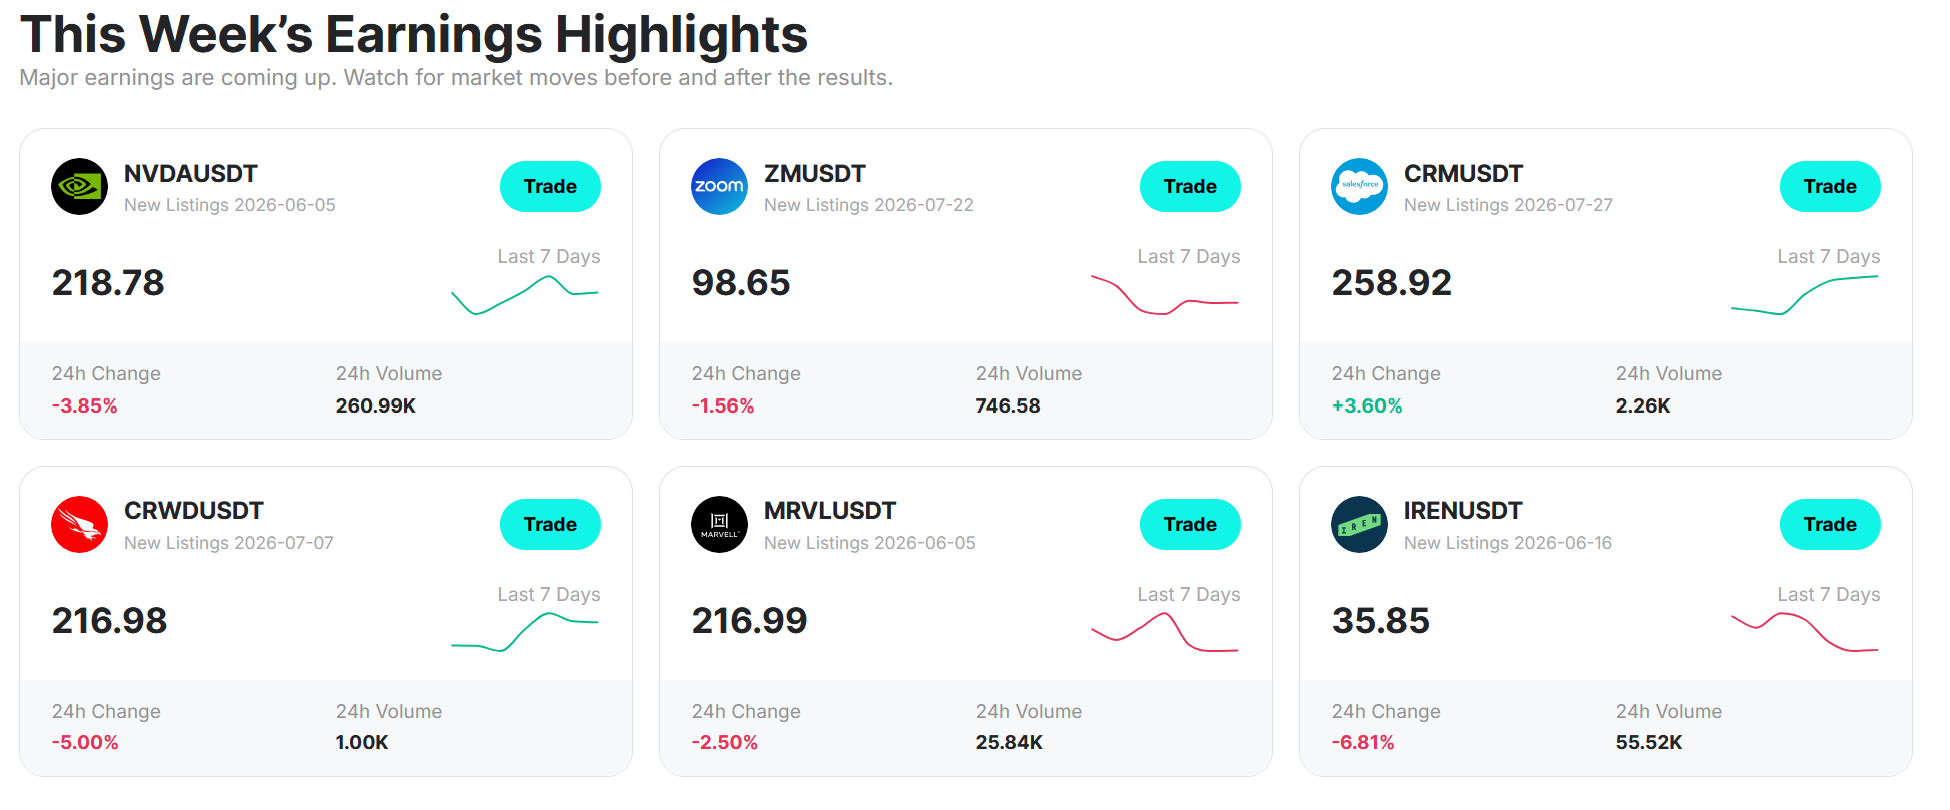
Zoomex, a global cryptocurrency trading platform focused on derivatives trading, today confirmed that its Stock Perpetuals lineup has grown past 50 contracts.
The milestone consolidates Zoomex’s position as a platform built for traders who want round-the-clock access to the world’s most closely watched equities, without ever leaving the derivatives infrastructure they already trust, and it lands just as the exchange kicks off a limited-time Zero-Fee TradFi event designed to let traders put that expanded lineup to work at no cost.

50+ Contracts Across Four Asset Categories
The expansion spans four distinct categories of U.S. and global equities, all margined and settled in USDT: established mega-cap anchors including AAPL, MSFT, GOOGL, AMZN, META, TSLA, and NVDA; a fast-growing AI and semiconductor cluster covering AMD, INTC, AVGO, ASML, ARM, MRVL, QCOM, and TXN; crypto-adjacent equities such as COIN, MSTR, MARA, RIOT, CIFR, and HOOD; and a broader healthcare, finance, and consumer segment featuring UNH, GE, JPM, GILD, REGN, AMGN, WMT, KO, PEP, MA, PYPL, and BRK.B.
Each contract trades 24/7 with leverage of up to 25x on most pairs, giving traders continuous exposure to names that traditional brokerages close off for two-thirds of every week.

Same Infrastructure, One Search Away
Easy to Use is the design principle running through the entire rollout. Rather than requiring a separate account, a different interface, or a new onboarding flow, every new Stock Perpetual contract runs on the same infrastructure as Zoomex’s existing USDT Perpetuals.
Traders simply search the ticker under the Stock category in Perpetual Trading and open a position the same way they would on any crypto pair, with no currency conversion, no international wire transfer, and no waiting for a market to reopen.

That accessibility sits inside a broader industry shift. Tokenized stock perpetuals have moved from a niche experiment to one of the fastest-growing corners of crypto derivatives in 2026, as both retail and institutional traders look for leveraged, always-on access to equities that conventional exchanges gate behind fixed trading hours.
Zoomex’s answer to that demand has been to build the category out methodically rather than opportunistically: the current 50+ contract lineup is the product of a sustained rollout throughout the year, not a single reactive listing event, and it now lives inside the exchange’s newly unified TradFi Zone alongside Commodity Contracts and Stock Tokens.
Built on Transparency and Rule-Based Execution
Transparent by Design underpins the structure of each contract. Every Stock Perpetual on Zoomex carries clearly published fee schedules, funding rates, and margin requirements, with support for both cross and isolated margin modes depending on how a trader wants to manage risk.
There are no hidden spreads and no ambiguity about how a position is priced relative to the underlying equity, an approach the exchange has extended from its crypto-native perpetuals lineup directly onto its equity products.
Fair Access & Rule-Based Execution defines the trading experience itself. Every Stock Perpetual is priced and matched through the same high-performance matching engine that underpins Zoomex’s core derivatives stack, with consistent execution logic applied whether a trader is opening a position on NVDA at 3 a.m. Seychelles time or closing one on JPM during a U.S. market holiday.
That consistency matters more for equities than for most crypto pairs, since the entire value proposition of a stock perpetual is that it behaves identically around the clock, with no gaps in liquidity or execution quality tied to when Wall Street happens to be open.
“Fifty contracts isn’t just a number, it’s a statement about where we think trading is headed,” said Fernando Lillo, Marketing Director at Zoomex. “Traders no longer want to think in terms of separate accounts for crypto and equities, or separate hours for when each market is actually open to them. Focused on Derivatives has always meant giving people one infrastructure that can price and execute both, with the same rules applying no matter what’s underneath the contract.”
That single-infrastructure approach is also what makes the expansion Focused on Derivatives rather than a departure from Zoomex’s core identity.
The exchange has not pivoted away from crypto derivatives to chase equities; it has extended the same derivatives engine, matching logic, and risk controls that already serve its crypto perpetuals to a new asset class, letting traders build cross-asset strategies inside a single account rather than splitting exposure across multiple platforms and jurisdictions.
A Trust Framework That Scales With the Lineup
Underpinning all of it is the Refined Brand & Trading Experience Zoomex has built around verifiable trust. The exchange publishes regular Proof of Reserves data, undergoes independent security audits through Hacken, and maintains security transparency and regulatory compliance disclosures that traders can check directly rather than take on faith.
As the Stock Perpetuals lineup has grown, that same trust framework has scaled with it: reserves backing the platform’s USDT-margined products are tracked and reported through the same on-chain transparency process Zoomex applies to its broader treasury, giving traders a way to verify that the infrastructure behind a 24/7 NVDA or COIN position is as accountable as the infrastructure behind its BTC or ETH pairs.
Zero-Fee TradFi Event Removes the Cost Barrier to Trying It
Timed directly to the 50-contract milestone, Zoomex has launched a TradFi Zero-Fee event running from August 28, 2026, 10:00 AM UTC through September 4, 2026, 10:00 AM UTC, giving traders a concrete, no-cost way to explore the newly consolidated TradFi Zone.
The mechanics stay true to Transparent by Design: registration is required to participate, but traders who already signed up for the earlier TradFi Early Bird event are automatically carried over, with no re-registration needed.

Once registered, any trade executed on a pair within the TradFi Zone, spanning Stock Contracts, Commodity Contracts, and Stock Tokens, including the freshly expanded Stock Perpetuals lineup, qualifies for a 100% rebate on trading fees actually paid, up to a cumulative cap of 100 USDT per user.
Rebates are calculated strictly on fees paid in real terms; amounts already covered or discounted through trial funds, fee-deduction vouchers, or other coupons don’t count toward the rebate, and for Stock Tokens, on-chain gas costs are excluded as well. Approved rebates are credited to eligible accounts within seven business days of the event’s close.
The structure reflects Fair Access & Rule-Based Execution in practice rather than just in messaging: the cap, the exclusions, and the settlement window are all published upfront, so traders know exactly what they’re eligible for before they place a single order. Paired with a lineup that has just crossed 50 Stock Perpetuals, the event functions as an invitation to test the cross-asset TradFi Zone risk-free during the exact week the category’s expansion is being announced, Easy to Use extended from product design into the promotion itself.
About Zoomex
Founded in 2021, Zoomex is a global cryptocurrency trading platform focused on derivatives trading. The platform serves over 3 million users across 35+ countries and regions, offering access to 700+ trading pairs. Built around easy to use, transparency, fairness, and speed, Zoomex provides a clear and efficient trading experience for users worldwide.
Through its high-performance matching engine, clear asset and order displays, and transparent fee and rule mechanisms, Zoomex helps users better understand their account status, order execution, trading costs, and results. Zoomex maintains registrations, licenses, and regulatory statuses across multiple jurisdictions, including the U.S. MSB, Canada MSB, U.S. NFA, and Australia AUSTRAC, and has completed security audits conducted by blockchain security firm Hacken. The platform also continues to strengthen its trust framework through Proof of Reserves, Security & Transparency, Compliance Information, and Fees / Rules Transparency initiatives.
Beyond trading, Zoomex builds a refined brand experience through elite sports partnerships, including the TGR Haas F1 Team, World Cup-winning goalkeeper Emiliano Martínez, and world-class tennis events such as Wimbledon. The values of speed, precision, discipline, fair play, and rule-based execution are closely aligned with Zoomex’s approach to derivatives trading.
At Zoomex: Easy to Use. Transparent balance. Fair access to your earnings.
Frequently Asked Questions
- What is Zoomex? Zoomex is a global crypto derivatives platform founded in 2021, serving over 3 million users across more than 35 countries and regions with 700+ trading pairs.
- How does Zoomex work? Zoomex operates through a high-performance matching engine with transparent asset and order displays, allowing users to execute trades and track outcomes with full visibility into their balances and results.
- What can you trade on Zoomex? Zoomex offers 700+ trading pairs spanning cryptocurrencies such as BTC, ETH, and SOL, as well as stock-linked contracts like NVDA and AAPL and gold exposure through XAUT.
- Where is Zoomex headquartered? Zoomex operates as a global cryptocurrency exchange with regulatory registrations including Canada MSB, U.S. MSB, U.S. NFA, and Australia AUSTRAC, reflecting its multi-jurisdictional compliance approach.
- Is Zoomex available in my country? Zoomex serves users across more than 35 countries and regions. Availability can vary by local regulation, so traders should check the official Zoomex website for country-specific access and requirements.
The post Zoomex Deepens TradFi Push With 50+ Stock Perpetuals and Zero-Fee TradFi appeared first on BeInCrypto.



A fake Claude desktop application is reportedly being used to distribute RevStealer, a Windows malware strain built to steal crypto, password and browser data.
According to a Monday report by cybersecurity company Morphisec, RevStealer was previously distributed through GitHub repositories and game-cheat-themed sites but the most notable is a fake “Claude Opus 5 Free Desktop” project that impersonates AI developer Anthropic and promises free access to Claude.
The researchers noted that the malware is designed to leave few traces and searches browser databases, cookies, password-manager records, VPN and remote-access settings, messaging data, screenshots and selected documents. RevStealer also targets over 50 cryptocurrency wallets.
The malware checks whether the machine looks like a real user device before unlocking its malicious payload, looking at available memory, the number of processor cores, hostname, username and graphics hardware. It also monitors for the debugging delays typical of malware analysis environment.
If RevStealer detects anything out of the ordinary, it does not move on to the next stages of infection and malicious activity. If the system passes those checks, the payload is decrypted, stored under a random name and covertly executed.
The report follows the discovery by Russian cybersecurity company Kaspersky of a new malware framework targeting cryptocurrency investors called OkoBot, which can harvest crypto wallet files, browser data and user credentials, inject malicious extensions and capture wallet application windows to steal assets.
Related: Microsoft warns users of ‘Crypto Clipper’ malware spread via USB drives


- KuCoin adds UTA support to its institutional lending program.
- New API clients face a lower 30-day volume requirement of 10M USDT.
- Eligible institutions can borrow up to 3M USDT across key products.
KuCoin has upgraded its Institutional Interest-Free Lending Program by integrating support for its Unified Trading Account (UTA), as the crypto platform looks to streamline capital management for institutional clients.
The upgrade reduces the qualifying external 30-day trading-volume requirement for newly registered API clients from 30 million USDT to 10 million USDT.
Eligible clients can also access 0% interest for the first two months without a trading-volume requirement.
Under the upgraded program, eligible institutional clients can borrow up to 3 million USDT.
Borrowed funds can be used across Spot, Margin, and Futures trading, while borrowing is available in USDT, USDC, Bitcoin, and Ethereum.
KuCoin integrates lending with unified accounts
The integration is designed to reduce capital fragmentation between separate trading accounts.
KuCoin said institutions operating across multiple products and strategies can face higher costs and operational friction when capital is divided between accounts.
UTA provides eligible users with a single account structure for managing capital across supported trading products.
With institutional lending integrated into the framework, borrowed funds can be deployed across Spot, Margin and Futures without requiring transfers between separate trading accounts.
The setup is intended to bring financing closer to execution and allow professional trading teams to deploy collateral and capital more efficiently.
KuCoin said the upgraded infrastructure is focused on how institutions access, manage, and deploy digital assets across different trading strategies.
Lending program expands from targeted credit
KuCoin introduced targeted interest-free credit in 2024, initially offering eligible API traders and quantitative teams access to up to 500,000 USDT alongside benefits including fee support, enhanced connectivity, higher API limits and technical assistance.
In 2025, the borrowing limit increased to 3 million USDT.
The program also added support for multiple borrowing assets and allowed clients to combine funds from sub-accounts as margin across eligible products.
The 2026 upgrade represents the latest stage of the program’s development, moving beyond targeted credit support toward a more integrated institutional capital infrastructure, according to the company.
The latest changes also lower the entry requirement for newly registered API clients, potentially expanding access to the lending program.
KuCoin highlights capital efficiency for institutions
Alison Qin, Head of KuCoin Institutional & VIP, said professional market participants require flexible and capital-efficient access to liquidity.
She added that institutional lending infrastructure needs to combine financing at scale with tailored terms and competitive pricing to support sophisticated trading strategies.
Qin said integrating lending with UTA brings capital closer to the accounts and products used for those strategies, while helping clients maintain control over execution and risk.
The company said the upgrade forms part of its broader product development strategy, connecting financing, account infrastructure and execution for institutional users participating in the digital asset market.
Founded in 2017, KuCoin said it serves more than 45 million users across more than 200 countries and regions.
The platform provides access to more than 1,500 digital assets and said it has built a compliance framework that includes AUSTRAC registration in Australia, a MiCA license in Europe, and regulatory progress in other markets.
If this playbook sounds familiar, it’s because we’ve seen this movie before. In 1996, Congress created Temporary Assistance for Needy Families, or TANF, a block grant that ended the guarantee of cash assistance for families who need it and handed states broad discretion over the money. One of us, Peter Edelman, resigned from the Clinton Administration in protest.
Thirty years later, we know the results. States diverted the funds, the block grant lost half its value to inflation, and by 2023 just 21 of every 100 families with children in poverty received cash assistance, down from 68 in 1996. TANF now reaches far fewer families and provides far less help.
Instead of going down this path again, the Trump Administration and Congress should advance an anti-poverty agenda centered on two core principles: cash and care.
Crypto World
Firelight raises $8 million, expands beyond XRP as it aims to make DeFi less scary for fintechs


The protocol aims to give fintechs and investors a faster way to recover losses from DeFi hacks, while letting XRP, bitcoin and XLM holders earn yield by backing that protection.
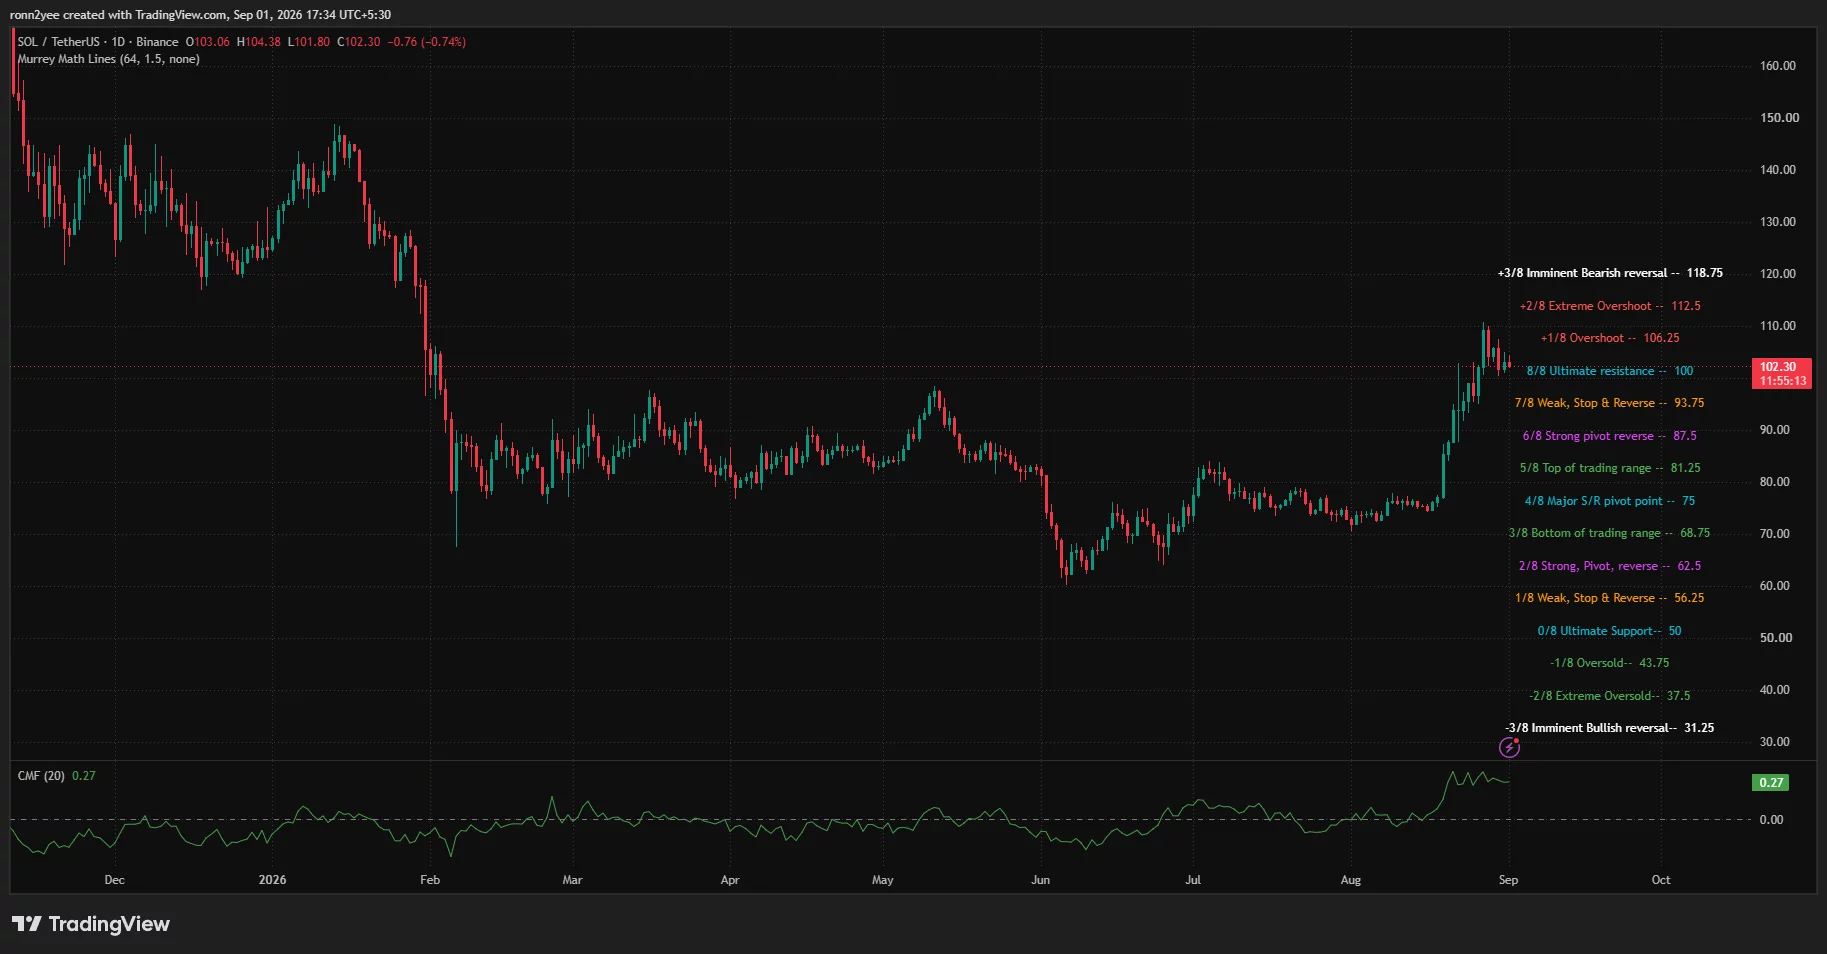
Solana price held above the key $100 level on Sept. 1 after its late-August rally stalled near $110, with weakening trend strength pointing to consolidation before the next major move.
Summary
- Solana price traded near $102.30 after retreating from its Aug. 27 high around $110.
- The daily chart places immediate resistance at $106.25, followed by $112.50.
- 4-hour ADX fell to 17.47, showing that the earlier upward trend has lost strength.
- Liquidation liquidity is concentrated near $100 and between roughly $108 and $110.
Solana price momentum weakens above $100
According to data from crypto.news, Solana (SOL) price was trading near $102.30 at the time of writing, down about 0.7% on the daily chart but still above the psychological $100 level. The token began the seven-day period near $102.17, climbed to $110.04 on Aug. 27, and then gave back most of that advance.
SOL remained up slightly for the week despite the pullback. Its ability to outperform several other large-cap cryptocurrencies followed Charles Schwab’s plan to add SOL trading alongside Avalanche and Chainlink.
The announcement helped SOL gain more than 9% in 24 hours as trading volume increased. However, the broader crypto market was also rising at the time, making it difficult to assign the full rally to the Schwab development.
Solana’s daily chart shows that the advance carried the price through the $100 Murrey Math resistance level before sellers appeared around $110. The subsequent decline has brought SOL back toward the breakout area, turning $100 into the market’s immediate test.
A daily close above that level would preserve the breakout structure. Losing it would suggest that the late-August move failed to establish a durable higher trading range.
Technical indicators point to consolidation
The 4-hour chart shows SOL trading below the Bollinger Bands’ middle line at $103.88. That level now acts as the first short-term barrier for buyers.
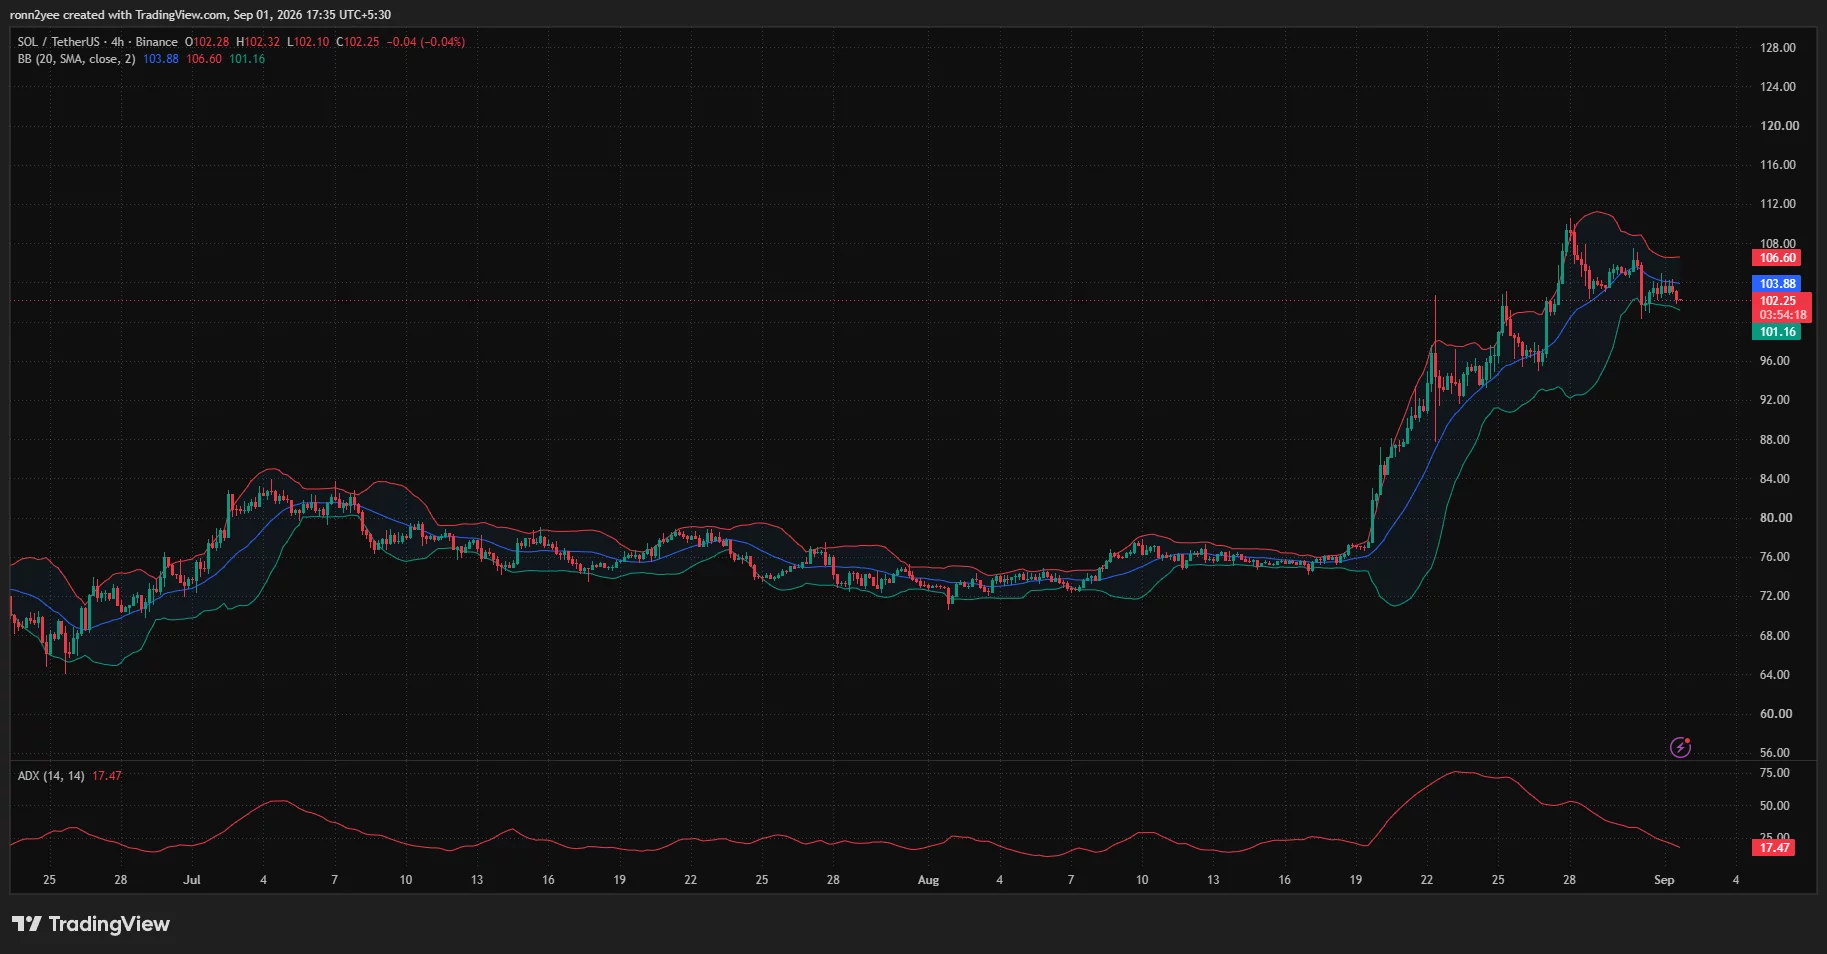
The upper Bollinger Band stands at $106.60, close to the daily Murrey Math resistance at $106.25. The overlap makes the $106.25–$106.60 region the most important nearby resistance zone.
A sustained move through that area could allow SOL to challenge $110 again. Beyond the recent high, the daily chart places the next resistance at $112.50, while $118.75 marks a higher reversal zone.
Momentum has weakened as the price contracts. The 4-hour Average Directional Index has dropped to 17.47 after rising above 70 during the breakout. An ADX reading below 20 normally reflects a market without a strong directional trend, increasing the chance of sideways trading.
The Bollinger Bands are also beginning to narrow after expanding sharply during the rally. Price is sitting close to the lower band at $101.16, leaving buyers little room to defend before the market tests $100.
Daily Chaikin Money Flow remains positive at 0.27, however. The reading shows that buying pressure has not disappeared despite the retreat from $110. Positive capital flow supports the case for consolidation above $100 rather than an immediate reversal of the entire August advance.
Liquidation heatmap places SOL between two liquidity zones
The one-week CoinGlass liquidation heatmap identifies a large concentration of leveraged positions near $100. The level has remained the brightest liquidity cluster below the current price, making it a possible short-term target if selling continues.
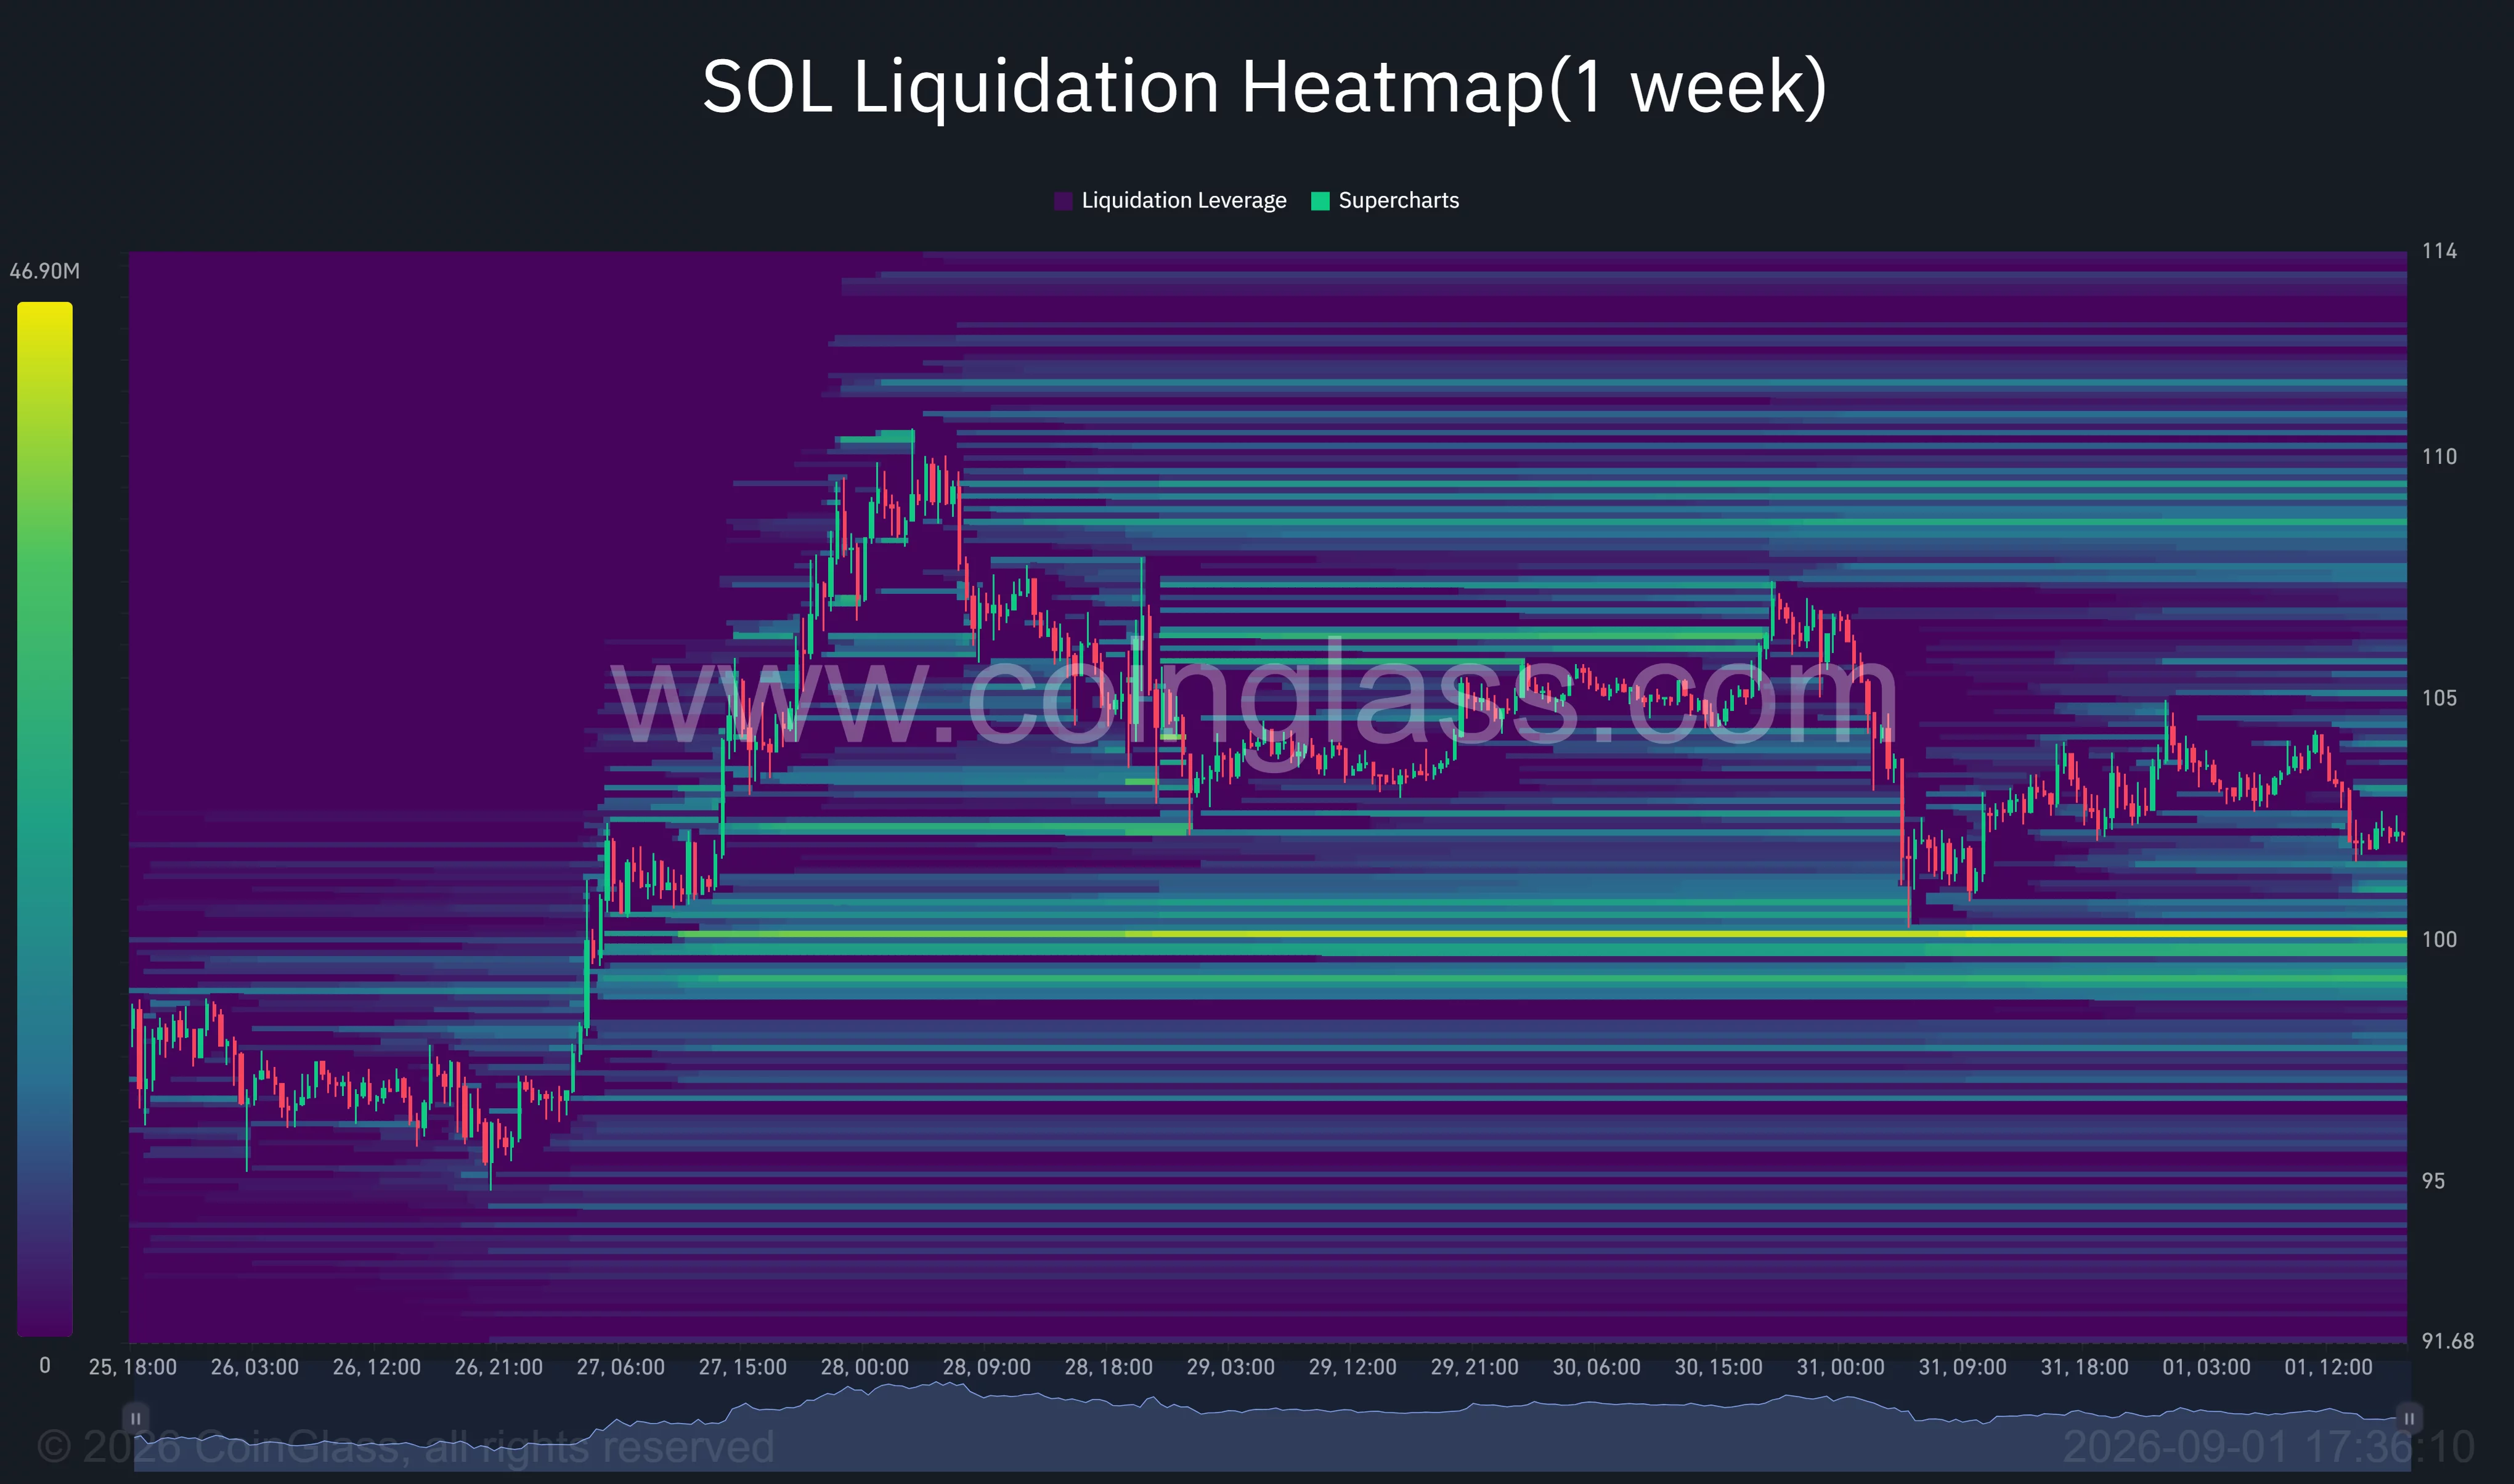
SOL already approached that zone during its Aug. 31 decline before recovering toward $103. A return to $100 could trigger another round of long liquidations, particularly if the price breaks below the level with rising volume.
Liquidity also appears above the market between approximately $108 and $110. The concentration coincides with the recent high and could attract the price if buyers reclaim the Bollinger midpoint and $106.60 resistance.
Smaller clusters are visible around $104–$106, meaning a recovery may encounter resistance before reaching the larger liquidity pool. The resulting setup leaves SOL between two competing targets: downside liquidity around $100 and short-liquidation exposure near $108–$110.
A confirmed break below $100 would place $93.75 in focus on the daily Murrey Math chart. The next major support stands at $87.50, although the token would first need to lose its current breakout structure for either level to become an immediate target.
Solana analysts track a wider breakout structure
Crypto analyst Batman said in an Aug. 31 post that SOL had broken out of a major accumulation structure. His chart identifies the $83–$85 region as the key long-term retest zone and presents a possible path toward $150 if that support holds.
The $150 projection remains a conditional, longer-term target rather than an immediate price objective. SOL would first need to reclaim the $106.25–$110 resistance region and establish a higher high above $112.50.
Solana’s price also received support from the network’s Double Disinflation proposal. Validators approved the measure with about 67% support, narrowly clearing the required two-thirds threshold. The change doubles the annual disinflation rate from 15% to 30% while retaining the network’s 1.5% long-term inflation target.
US investment products provide another source of demand. Spot Solana exchange-traded funds had recorded $1.22 billion in cumulative net inflows by late August, including their strongest daily intake of 2026.
For the short-term outlook, $100 remains the dividing line. Holding it would leave room for another test of $106.25 and $110, while a daily close below it would weaken the breakout and expose $93.75. Falling ADX readings suggest that SOL may first spend time consolidating between those levels before choosing its next direction.
Disclosure: This article does not represent investment advice. The content and materials featured on this page are for educational purposes only.


Strategy has spent $635.2 million repurchasing its STRC perpetual preferred stock as the security continues to trade below its $100 par value despite recovering from a low near $71.
Summary
- Strategy has spent $635.2 million buying back STRC, which remains below its $100 par value at around $97.
- The latest STRC repurchase totaled $151.8 million at an average price of $97.48 per share.
- Strategy returned to Bitcoin buying with a $369.7 million purchase of 4,603 BTC, taking its holdings to 845,050 BTC.
- Strive’s SATA offers a 13% annualized dividend with daily payments, compared with STRC’s 12% rate paid twice monthly.
- SATA has stayed near $100, while Strive’s ASST has gained roughly 60% this year compared with a 15% decline for MSTR.
Strategy disclosed in its latest filing that it bought back another $151.8 million of STRC during the week ended Aug. 30, paying an average $97.48 per share as part of a repurchase program designed to support the preferred stock.
The latest purchase covered 1.56 million STRC shares and came as the company returned to buying Bitcoin after a roughly two-month pause. Strategy acquired 4,603 BTC for $369.7 million at an average price of $80,318 per coin, taking its total holdings to 845,050 BTC.
STRC, known as Stretch, was trading at $97.34 on Tuesday, leaving the preferred stock below the $100 level Strategy has sought to restore through dividend increases, cash reserves and share repurchases.
Strategy STRC buybacks have reached $635.2 million
Strategy introduced a $1 billion authorization for preferred stock repurchases in late June as part of its Digital Credit Capital Framework, which set aside another $1 billion for common stock buybacks and raised STRC’s annual dividend rate to 12%. As previously covered by crypto.news, the new capital framework included a separate program allowing Strategy to sell up to $1.25 billion of Bitcoin if needed.
Since then, the company has steadily used the preferred stock authorization as STRC recovered from its June lows.
The size of Strategy’s weekly purchases has increased along with STRC’s price. During the week ended July 26, the company repurchased $25 million of STRC while the preferred shares remained well below par. At the time, Strategy had increased its dollar reserve to $3.75 billion and kept its Bitcoin holdings unchanged at 843,775 BTC.
Strategy later sold 1,638 BTC for $104.7 million between July 27 and Aug. 2, directing part of its available capital toward preferred stock dividends and repurchases. The Bitcoin sale came as the company increased its cash position and continued supporting STRC.
By the latest reporting week, Strategy was willing to pay an average $97.48 for STRC, less than $3 below its stated $100 par value.
The company funded its latest transactions by selling 4.53 million MSTR shares through its at-the-market program for net proceeds of $602.8 million. Of that amount, $369.7 million funded the Bitcoin purchase, $151.8 million went toward STRC repurchases, $50.7 million was allocated to STRC dividends and $30 million was added to Strategy’s USD Cash account.
Strategy reported $1.61 billion in USD Cash as of Aug. 30, while another $5.1 billion was held in its USD Reserve.
STRC remains short of its $100 par value
STRC has recovered considerably since falling below $75 in late June, but Strategy has yet to push the preferred stock back to $100 on a sustained basis.
Chief Executive Phong Le said in July that Strategy planned to resume issuing STRC once the security returned to par, linking the recovery directly to the company’s ability to use the preferred stock for future Bitcoin purchases.
“We’ll continue to build that. And yeah, when Stretch gets back to par, we’ll issue more. We’ll buy more Bitcoin,” Le said at the time, as crypto.news previously reported.
STRC had been trading near $87 when Le made the comments on July 16. Strategy had spent the preceding weeks building its dollar reserves after the preferred stock fell sharply during June.
The company had already changed STRC’s dividend structure in an attempt to make the security more attractive to income investors. Shareholders approved semi-monthly dividend payments in June, moving distributions to the 15th and final day of each month.
Strategy later raised the annualized dividend rate to 12% as part of its capital framework.
Institutional demand has remained significant despite STRC trading below par. By late July, the preferred stock had become the largest holding in three major U.S. preferred stock exchange-traded funds, which collectively held $756 million of STRC. Institutional holdings had increased 105%, while the retail ownership share fell from 78% to 71%.
Strive’s SATA has held closer to par
Competition from Strive’s Variable Rate Series A Perpetual Preferred Stock, SATA, has provided investors with another Bitcoin treasury-linked income product carrying a higher annualized dividend rate.
Strive has maintained SATA’s dividend rate at 13% for September, compared with STRC’s 12%. SATA pays cash dividends every business day, while STRC distributes dividends twice a month.
Strive began daily SATA distributions on June 16 after moving away from monthly payments. The company said the change made SATA the first U.S.-listed security to make cash dividend payments every business day.
For September, Strive declared daily payments of $0.0516 per share across 21 business days, equivalent to $1.0836 for the full month and a 13% annualized rate.
SATA has remained close to its $100 par value for more than a week, allowing Strive to continue selling shares through its at-the-market program and directing proceeds toward Bitcoin purchases.
The funding model has supported Strive’s Bitcoin accumulation throughout 2026. In June, the company bought 759 BTC for roughly $50 million, with SATA providing a significant portion of the capital used for the purchase.
More recently, Strive acquired another 1,800 BTC over the past week using proceeds supported by SATA issuance, while the preferred stock remained around par.
Strategy has resumed Bitcoin purchases
Strategy’s latest 4,603 BTC acquisition ended a roughly 10-week period without a net Bitcoin purchase and lifted its holdings to 845,050 BTC, worth approximately $65.9 billion at current prices.
The company had spent much of the previous two months directing capital toward cash reserves, preferred stock obligations and STRC repurchases. Its latest transaction returned Bitcoin purchases to the largest use of proceeds from its weekly MSTR issuance, with nearly $370 million of the $602.8 million raised through common stock sales going toward BTC.
Strategy still had approximately $19.09 billion of MSTR shares available for issuance under its at-the-market program as of Aug. 30.
The performance gap between the two companies has remained visible in their common shares. Strive’s ASST has gained roughly 60% since the start of 2026, while Strategy’s MSTR has fallen around 15% over the same period.
Strive reported in August that it acquired 6,236 BTC during the second quarter and 12,237 BTC during the first six months of 2026. Another 303 BTC were purchased between July 1 and Aug. 7, while the company had paid 44 consecutive daily SATA dividends by Aug. 7.
Strive had no short or long-term debt outstanding as of Aug. 7 and reported $154.9 million in cash and cash equivalents.

XRP is holding near the same consolidation zone it’s occupied since retreating from August’s $1.70 peak. The token has shed 8.2% over the past week but remains up nearly 26% on a 30-day basis, a reminder that short-term pullbacks don’t always erase medium-term structure.
Bitwise’s spot XRP ETF, on the other hand, has crossed $507 million in assets under management, with the fund holding 364.8 million XRP as of late August. August inflows into XRP ETFs more than doubled July’s total, and analyst Ali Martinez called XRP’s breakout “confirmed” with a $1.70 target, a call that aged awkwardly once price slipped back below that resistance band within days.
The tension here is straightforward: institutional demand via ETF wrappers is accelerating even as spot price cools off. That gap is exactly the kind of setup that either resolves into a squeeze or a fakeout, and the technicals below suggest which scenario is currently favored.
Discover: The Best Token Presales
Can XRP Price Hit $2 This Week?
XRP’s daily RSI sits near 60.6, or above the 50 midline, meaning momentum hasn’t flipped bearish, but it has cooled meaningfully from overbought territory reached during the August run. Price is consolidating in the $1.36–$1.38 band, a zone that previously capped rallies as resistance and now needs to hold as support.
Immediate support sits at $1.30–$1.35. A daily close below that range would break the sequence of higher lows from August and open the door to $1.27. First resistance is $1.50–$1.60; XRP needs to reclaim and hold that zone before another test of $1.70 becomes credible.

- Bull case: ETF inflows persist, support holds at $1.35, XRP reclaims $1.60 and pushes toward $1.70–$2.00.
- Base case: Range-bound chop between $1.30 and $1.50 while the market digests the September 1 escrow unlock.
- Bear case: Close below $1.30 invalidates the higher-low structure, exposing $1.27 and reviving the longer downtrend from $3.
Traders watching for confirmation before $2 becomes more than a headline number should track the $1.35 level closely, see further breakdown in this XRP price prediction analysis.
Trade XRP on Bybit and Get a Chance to Win Our $1,000 USDT Airdrop
Bitcoin Hyper Targets Early Mover Upside
XRP holders riding the ETF narrative have already captured most of the easy upside from the $1.00 to $1.70 move. At current levels, a rally back to $2 caps out around 45% from the $1.38 price point. It’s solid, but not the kind of asymmetric setup that early-stage capital tends to chase.
The above reasons are pushing a segment of traders toward presale infrastructure plays where the ceiling hasn’t been priced in yet. Enter Bitcoin Hyper ($HYPER), a Bitcoin Layer 2 integrating the Solana Virtual Machine, the first project with SVM execution speeds faster than Solana itself, layered directly onto Bitcoin’s security base.
The presale has raised $33 million at a current token price of $0.0136855, with staking rewards offered at a high 65% APY. Core features include a decentralized canonical bridge for BTC transfers and low-latency smart contract execution, solving Bitcoin’s long-standing programmability gap.
Research Bitcoin Hyper through the official presale page before deciding.
Discover: The Best Crypto to Diversify Your Portfolio
The post XRP Targets $2 as Bitwise ETF Records 500 Million appeared first on Cryptonews.

BYD keeps confirming its latest sales plan is paying off: Push headfirst into overseas market, to make up for the drastic declines back home in China. August sales for Tesla’s erstwhile rival rose 18%, entirely on the back of international markets. Last month, BYD sold 440,293 new energy vehicles, which includes both battery electric cars and plug-in hybrids, according to…
Copyright ©2026 Investor’s Business Daily, LLC. All rights reserved. 87990cbe856818d5eddac44c7b1cdeb8


The Cardano Foundation and Brazilian technology company Blockforce announced on Aug. 31 that Cardano now operates as the public verification layer for an enterprise supply chain platform.
Summary
- Cardano now anchors cryptographic proofs for more than 500,000 supply chain records already in production.
- Confidential records remain permissioned while public Cardano proofs allow independent verification without exposing underlying data.
- Joint engineering reduced public anchoring costs per record by 92%, according to the project partners.
- Azzas 2154 uses the system to trace leather using supplier, fiscal and government database records.
- Signed contracts cover 6.5 million certified records through 2030, with expansion planned across additional industries.
The system has anchored cryptographic proofs for more than 500,000 records, according to the partners’ announcement. It is already operating with major Brazilian fashion companies, including Azzas 2154.
The companies described the deployment as a dual-ledger architecture. Commercial records remain on a restricted network, while corresponding proofs are recorded on Cardano’s public blockchain.
Cardano separates confidential records from public proof
Blockforce stores information about individual supply chain events on a permissioned network. Access remains limited to approved companies, suppliers and other participating parties.
The platform then generates a cryptographic proof for each record and anchors that proof to Cardano. An auditor or regulator can compare a supplied record against its public proof to establish whether the record has changed since anchoring.
This design seeks to resolve a common problem in enterprise blockchain deployments. Companies may need independent verification but cannot publish supplier identities, prices, contracts or other commercially sensitive information on a public ledger.
The architecture does not establish whether the information entered into the private system was accurate. It provides evidence that a particular record existed and has not subsequently been altered. Data quality still depends on source documents, validation procedures and participating organizations.
Azzas 2154 applies the system to leather traceability
Azzas 2154, described by the partners as Latin America’s largest fashion group, is using the platform across its leather supply chain. The company combines fiscal documents, supplier information and official public databases to create an auditable product history.
The fashion group has set a target of tracing 100% of the leather used across its brands by 2030. That remains a future corporate goal rather than a completed result.
European supply chain requirements provide a commercial reason for exporters to improve product records. The European Union’s Ecodesign for Sustainable Products Regulation is establishing Digital Product Passports for priority product categories, including textiles and apparel.
The European Commission expects those passports to store and share information about products’ sustainability and environmental characteristics. The Cardano-Blockforce system could support record verification, but neither company said that using the platform automatically satisfies any particular European regulation.
In related coverage, crypto.news reported that Volvo tested blockchain infrastructure for supplier transactions, component traceability and compliance records. Volvo’s experiment used a closed environment, while Blockforce combines a restricted network with public Cardano proofs.
Batching reduced Cardano anchoring costs by 92%
Publishing an individual blockchain transaction for every supply chain event can become expensive at enterprise volumes. The Cardano Foundation and Blockforce said their engineering work reduced the public anchoring cost per record by 92%.
The partners achieved the reduction by batching certificates before anchoring them to Cardano. Their published architecture uses Blockforce’s uVerify system and configurable batching parameters to combine multiple records into fewer public transactions.
The 92% figure comes from the project partners and has not been supported by a publicly disclosed independent audit. The announcement also did not provide the original cost, the resulting cost per certificate or the network conditions used for the comparison.
Even so, the reported 500,000-record deployment moves the project beyond a limited prototype. It provides an operating example of a hybrid design intended to preserve confidential business data while using a public blockchain as a shared verification layer.
Contracts target 6.5 million records through 2030
The two companies said signed contracts cover 6.5 million certified records through 2030. That figure represents contracted future activity, not records already processed. The confirmed production total currently exceeds 500,000.
Blockforce plans to apply the architecture beyond fashion. The partners identified automotive manufacturing, agribusiness, pharmaceuticals and cosmetics as possible expansion areas. They did not disclose additional customers or deployment dates.
Execution will depend on companies supplying consistent source data and integrating existing documentation systems with the permissioned network. Auditors and regulators must also receive suitable tools for retrieving records and comparing them with Cardano proofs.
Public transaction identifiers, a verification dashboard or an independent system audit would provide more evidence about throughput, costs and reliability as deployment grows. The next measurable milestone will be progress from the current 500,000 records toward the contracted 6.5 million total.
Ethereum price remained trapped between $2,400 support and $2,500 resistance on Sept. 1, with weak trend strength and fading momentum raising the risk of another liquidity-driven pullback.
Summary
- Ethereum price traded near $2,460 after falling roughly 1% over the past seven days.
- The 4-hour ADX dropped to 18.58, showing little strength behind the current price trend.
- Liquidity is concentrated near $2,410 below price and between $2,540 and $2,550 above it.
- US spot Ethereum ETFs attracted $87.68 million on Aug. 31 despite ETH’s muted performance.
According to data from crypto.news, Ethereum (ETH) price was trading near $2,460 at press time, little changed over the previous 24 hours and down about 1% over the past week. The token had retreated from an Aug. 27 high near $2,564 after buyers failed to extend its late-August breakout.
Trading activity has also cooled. CoinGecko data showed that Ethereum’s 24-hour volume had fallen by about 21% to approximately $11.35 billion, indicating lower participation as the price consolidated.
ETH remains caught between support around $2,400 and resistance extending from $2,500 to $2,565. A break from that range could determine whether the August rally resumes or gives way to a deeper correction.
Ethereum price loses momentum below $2,500
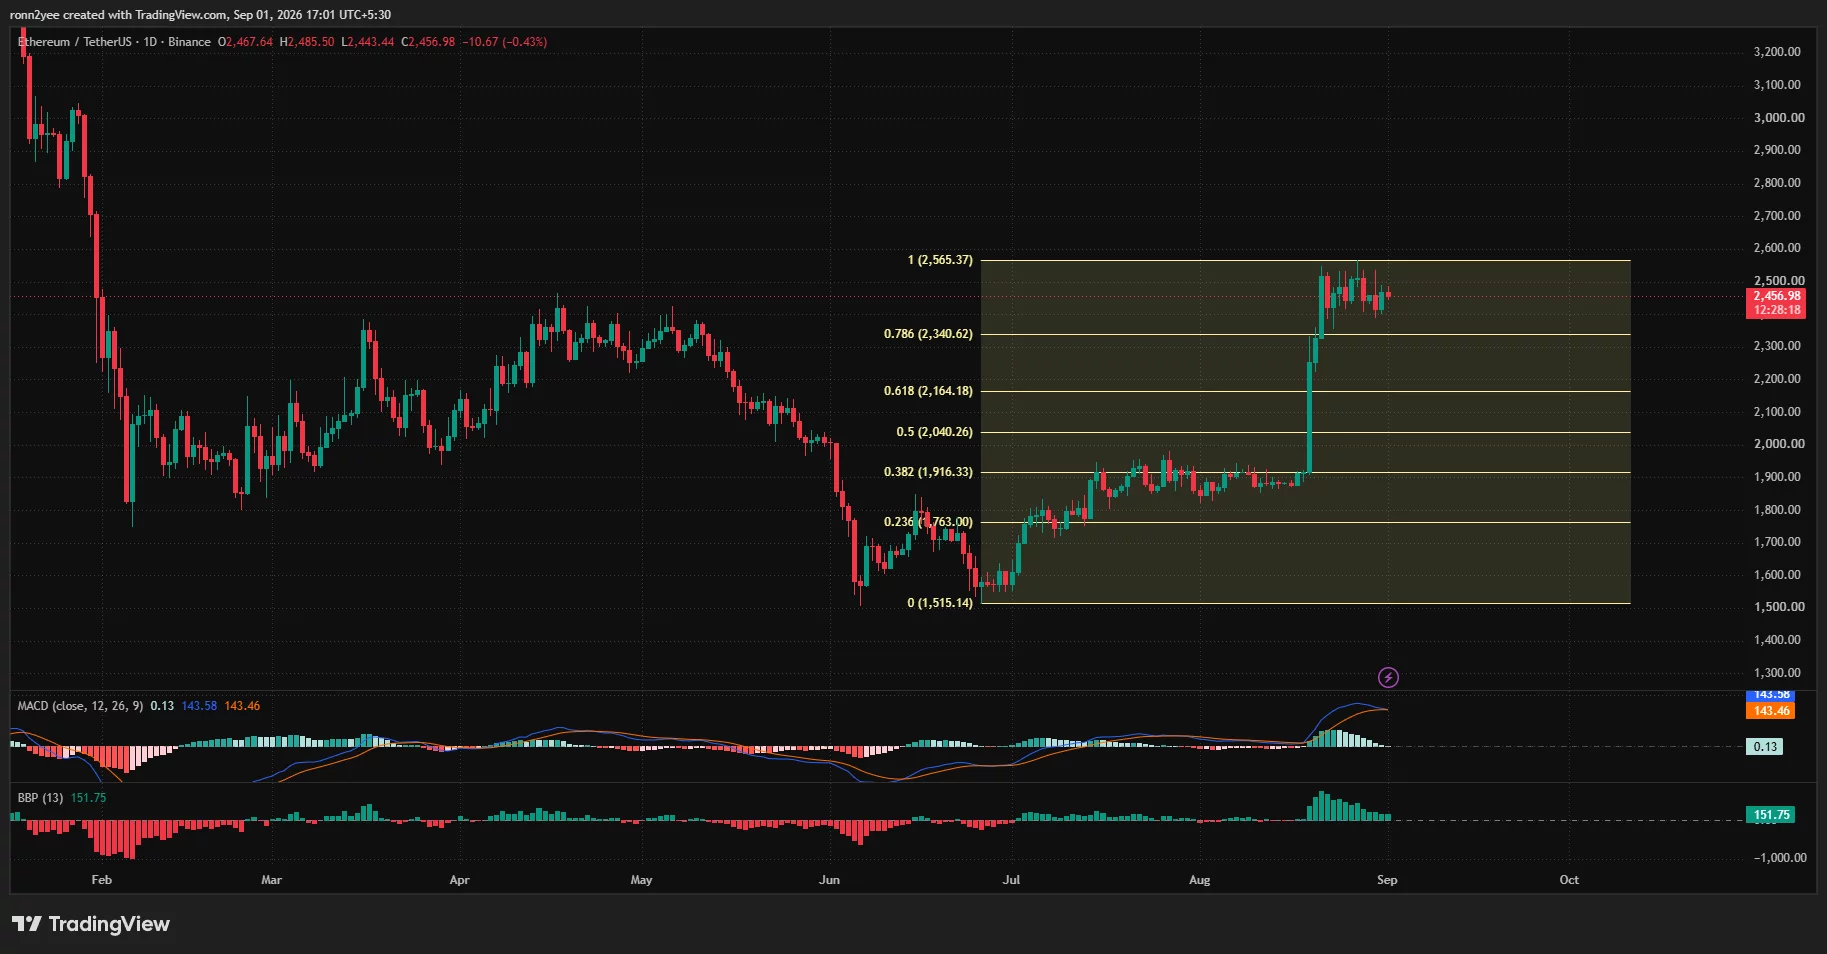
The daily chart shows Ethereum consolidating near the upper end of the advance from its June low of $1,515 to the August high of $2,565.
ETH remains above the 78.6% Fibonacci retracement level at $2,340, which now serves as the main higher-timeframe support. Holding above that level would preserve most of the structure created by the August breakout.
However, momentum has weakened considerably. The daily moving average convergence divergence indicator is close to producing a bearish crossover. The MACD line stands at 143.58, only slightly above the signal line at 143.46, while its histogram has narrowed to almost zero.
Bull-bear power remains positive at 151.75, suggesting buyers have not lost full control. Its bars have nevertheless declined since the initial breakout, showing that bullish pressure is fading as ETH struggles to clear $2,500.
A daily close above $2,565 would invalidate the short-term consolidation and open a path toward $2,600. Continued rejection beneath that area would leave $2,340 exposed, followed by the 61.8% Fibonacci level at $2,164.
4-hour indicators point to range-bound trading
Ethereum’s 4-hour chart provides a more neutral outlook. ETH is trading almost directly on the Bollinger Bands’ middle line at $2,456.53, reflecting a balance between buyers and sellers.
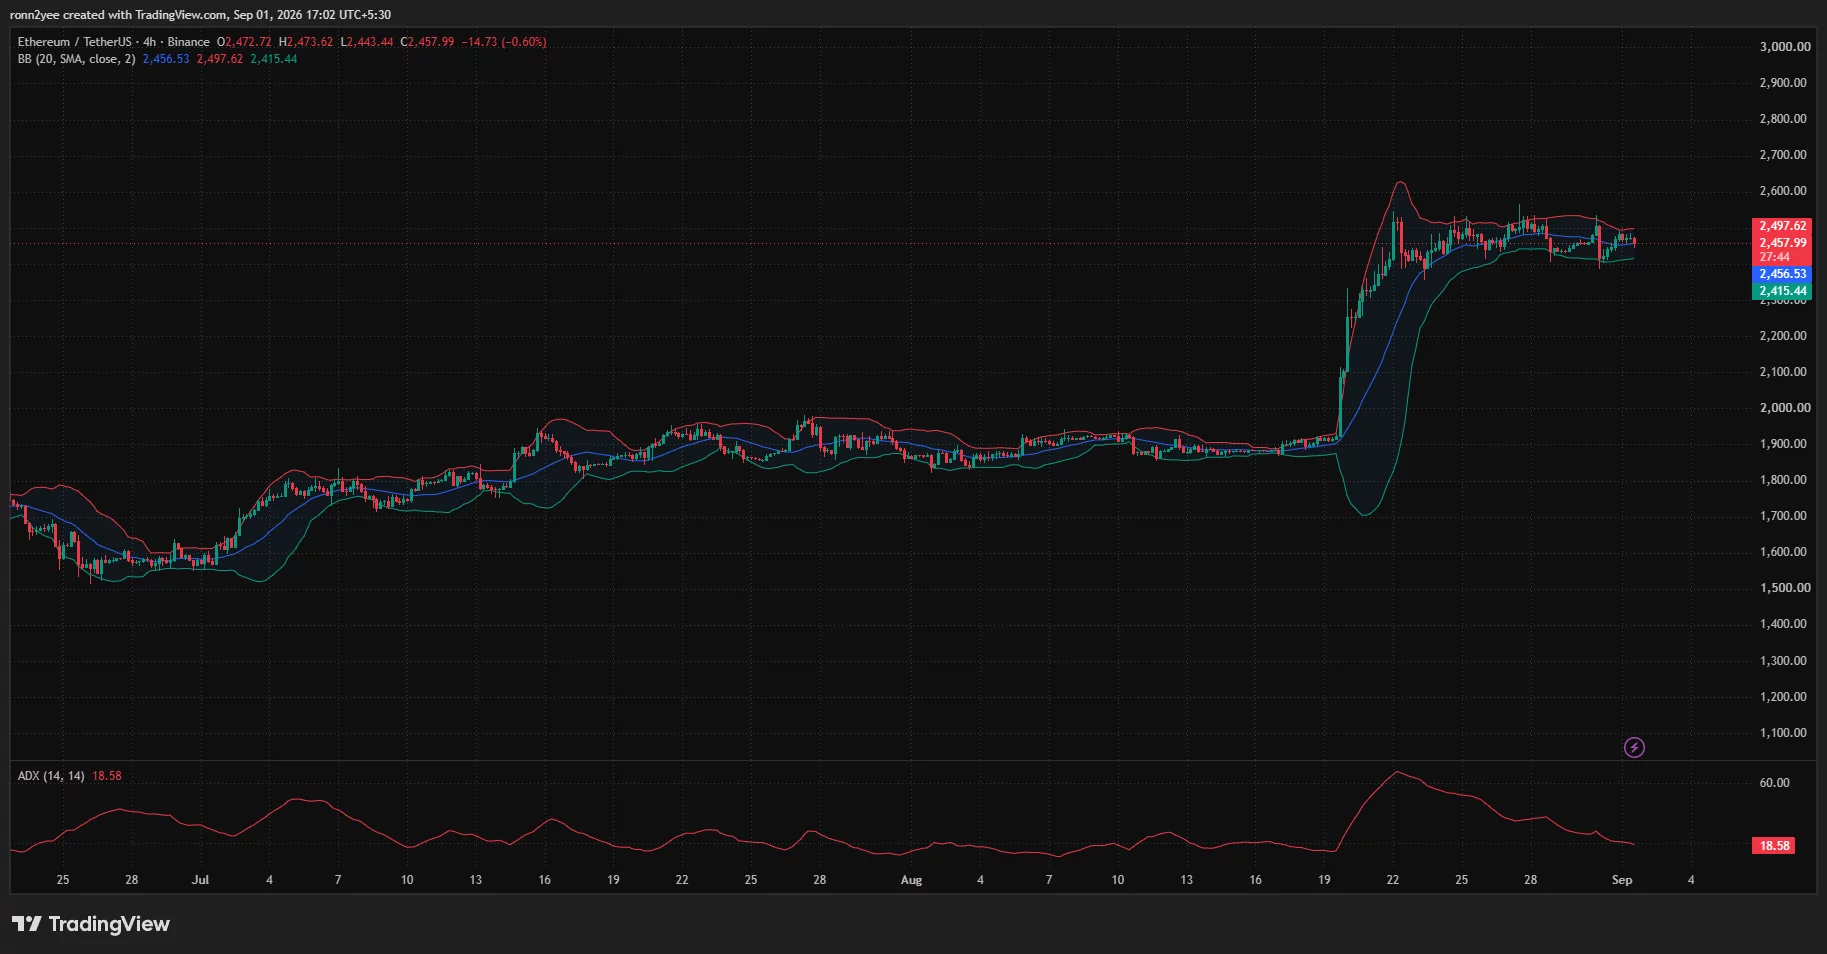
The upper band sits at $2,497.62, making $2,500 the first resistance that bulls must reclaim. The lower band at $2,415.44 aligns with the broader $2,400 support area.
The bands have narrowed after expanding sharply during the Aug. 20 breakout. Such compression often precedes a larger move, although it does not indicate which direction the price will take.
The average directional index has fallen to 18.58 from above 60 following the rally. An ADX reading below 20 generally signals that the market lacks a strong directional trend, supporting the case for continued consolidation until ETH moves outside the Bollinger Bands.
Crypto trader Daan Crypto Trades said ETH was trading in a tight area between its weekly 200-day simple and exponential moving averages and a horizontal price level.
The analyst identified $2,400 and $2,500 as the levels to monitor on daily closes, noting that Ethereum has spent roughly 11 days between them. Under that setup, a sustained close above $2,500 would favor buyers, while a loss of $2,400 would weaken the breakout structure.
Liquidation clusters surround Ethereum price
CoinGlass’s one-week liquidation heatmap shows leveraged positions building on both sides of Ethereum’s current price.
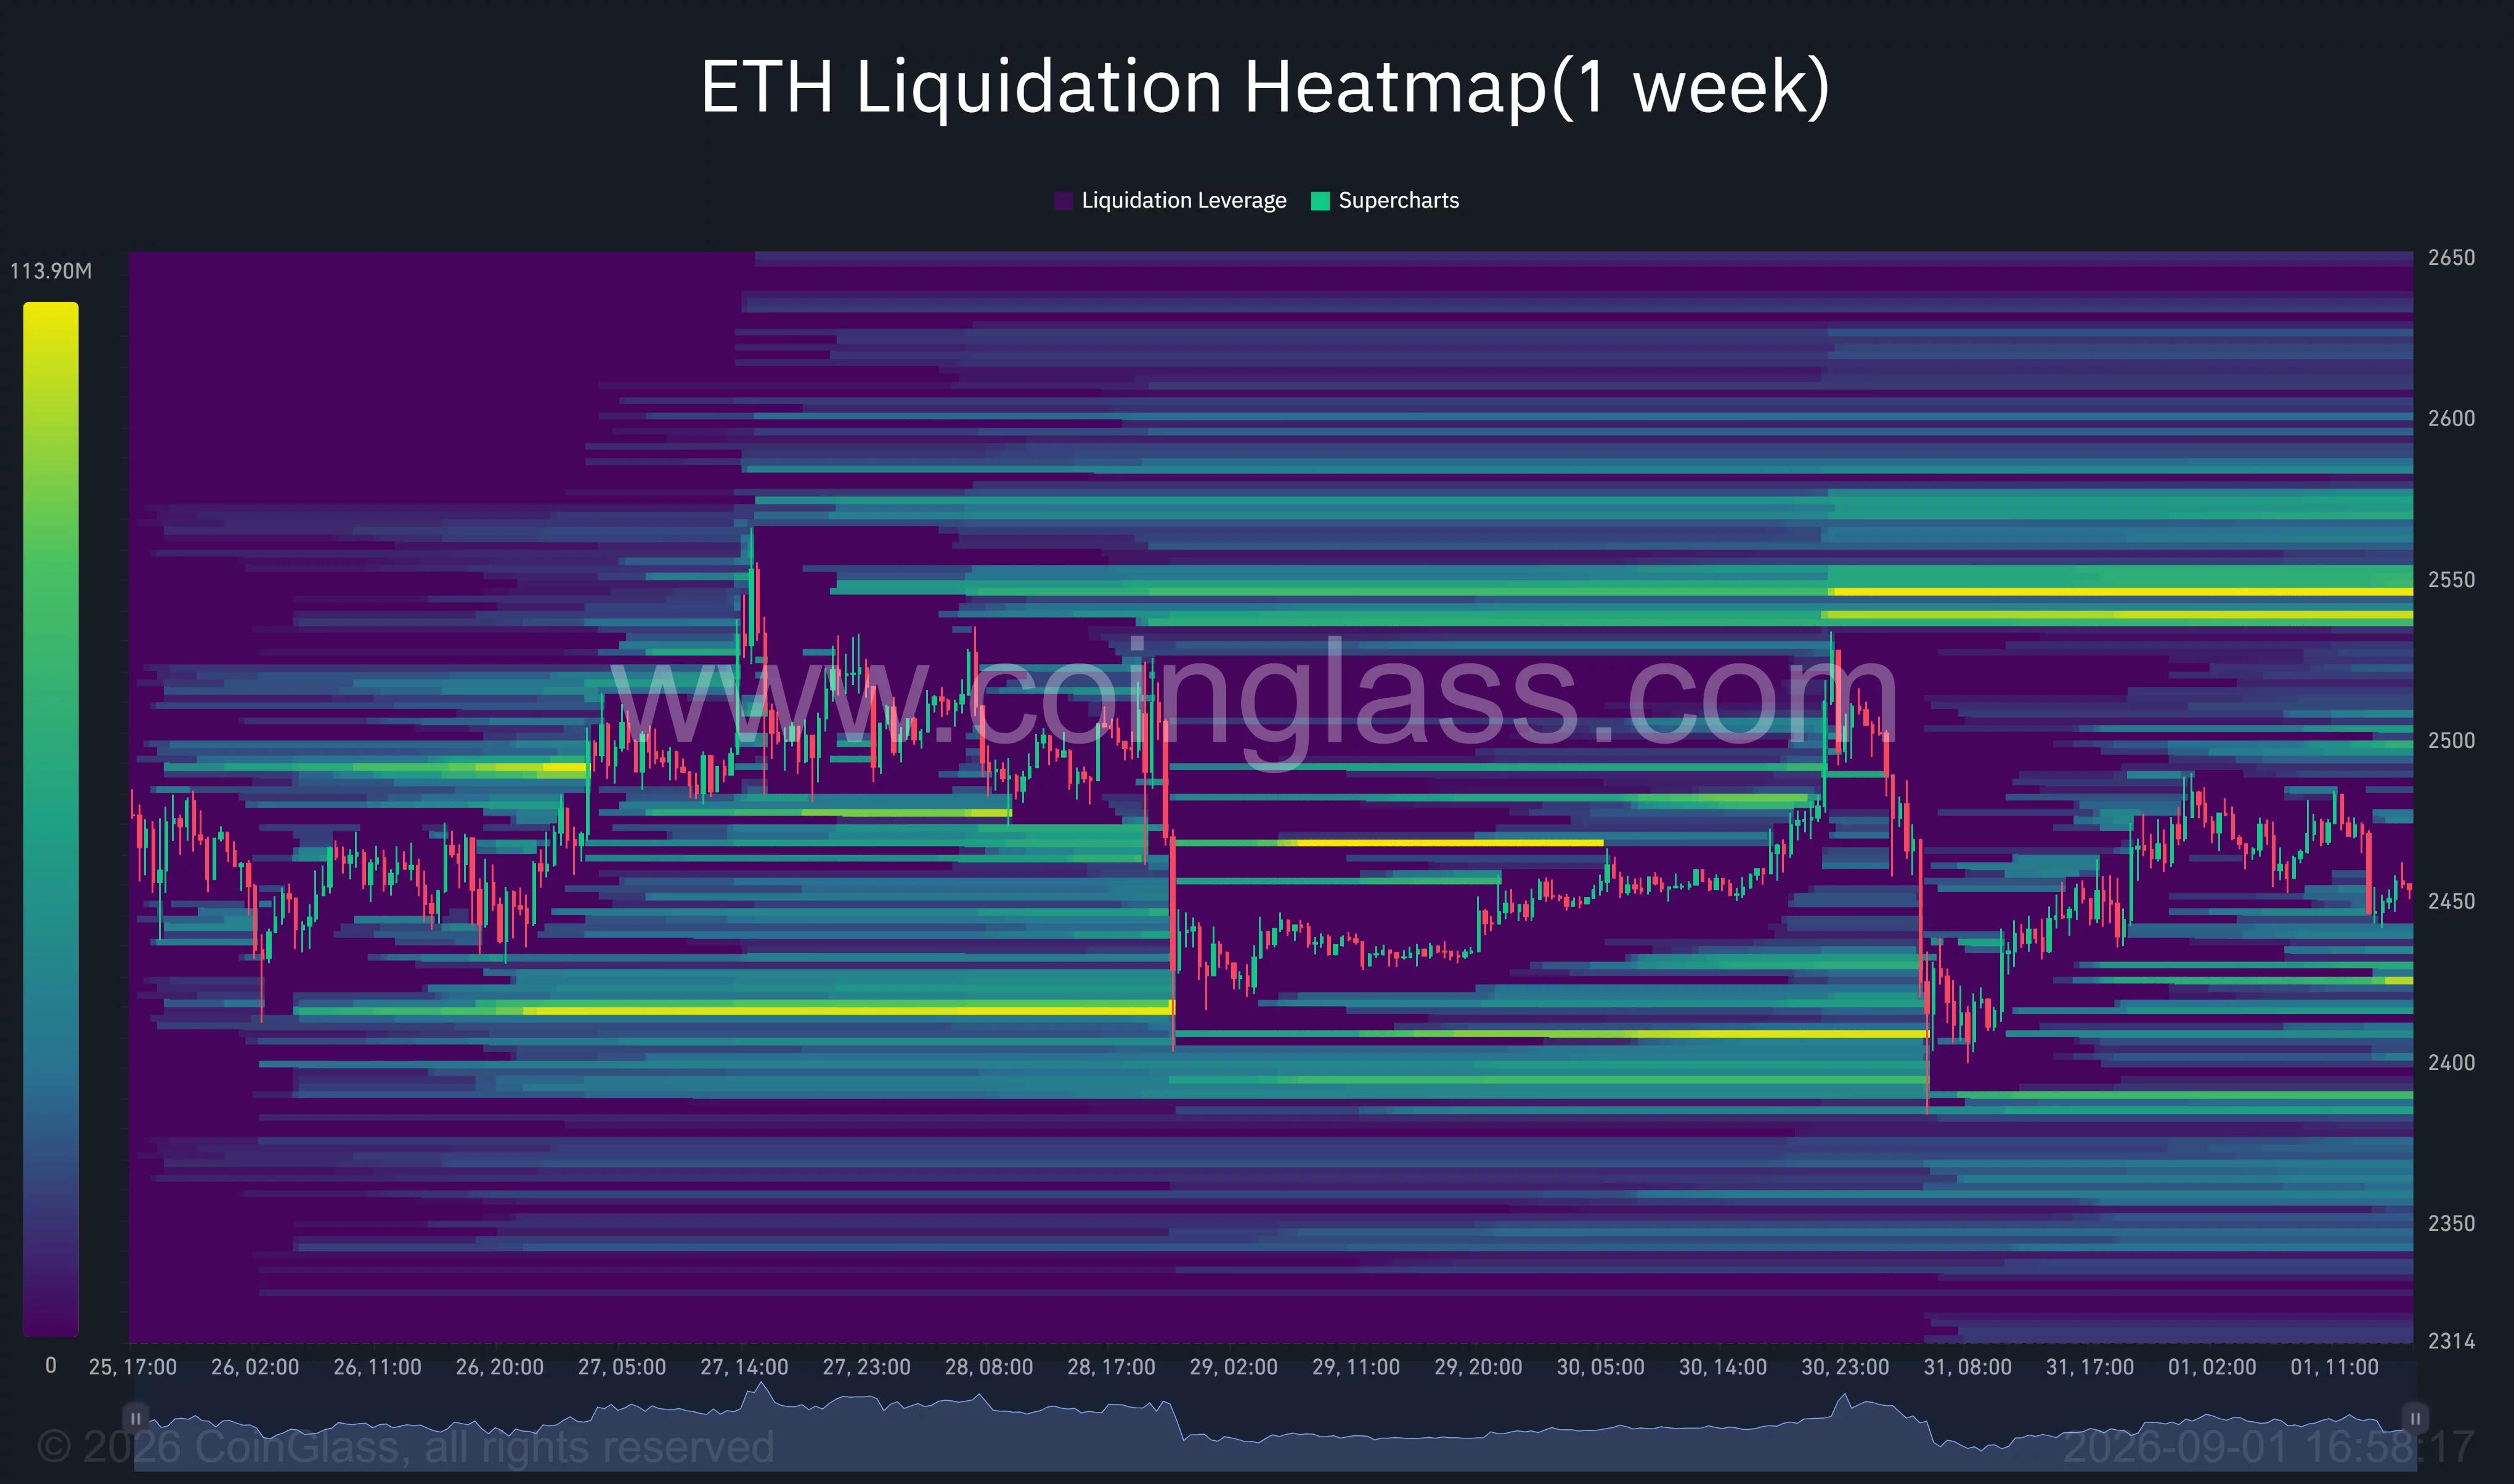
The largest nearby overhead concentration appears between approximately $2,540 and $2,550. A move into that area could force short positions to close, potentially accelerating an upside test of the $2,565 August high.
Additional liquidity rests around $2,495 to $2,505, reinforcing $2,500 as the first barrier.
On the downside, notable clusters appear around $2,420 to $2,410, followed by another concentration close to $2,390. A break below $2,400 could therefore trigger long liquidations and pull ETH toward the lower liquidity zone.
Liquidation maps identify areas where leveraged positions may be forced to close, but they do not guarantee that the price will reach those levels.
Trader Gerla compared Ethereum’s current position with a former support zone that became resistance during the previous market cycle. The analyst said a repeat of that structure could produce more range trading and a sweep toward $1,900–$2,000 before a larger advance.
The comparison represents a long-term scenario rather than a confirmed target. ETH must first lose $2,340 and $2,164 before the $2,000 area becomes a more immediate technical risk.
US Ethereum ETF inflows offer support
Demand through regulated US investment products remains a counterweight to the weak price momentum.
US spot Ethereum ETFs recorded $87.68 million in combined net inflows on Aug. 31, according to SoSoValue data. The session reportedly extended its positive flow streak to 11 trading days.
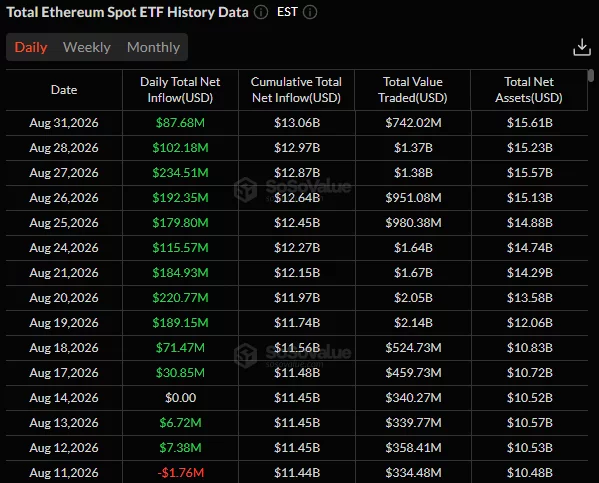
BlackRock’s iShares Ethereum Trust led the daily total with approximately $59.94 million, while the Grayscale Ethereum Mini Trust added about $13.50 million. The products collectively held approximately $15.61 billion in net assets, equal to 5.23% of Ethereum’s market capitalization.
Persistent ETF inflows suggest US investors are adding exposure despite Ethereum’s failure to move above $2,500. However, price confirmation remains absent while trading volume declines and momentum indicators flatten.
Ethereum’s next directional signal will likely come from a daily close outside the $2,400–$2,500 range. A close above the upper boundary would bring $2,550–$2,565 into focus, while a loss of $2,400 would expose $2,340 and increase the risk of a broader retracement.
Disclosure: This article does not represent investment advice. The content and materials featured on this page are for educational purposes only.

John Ternus starts his first day as Apple CEO with a foldable iPhone on deck and a long list of problems to solve

How much do finance jobs pay? #salarytransparentstreet #financejobs #bankingjobs

Holcombe Moor rewetting peat scheme to provide fire resilience

Weekend Open Thread – Corporette.com

Weekend Open Thread: Brooks Brothers

London Mayor Sadiq Khan handed a peerage by Keir Starmer alongside 15 other Labour figures… just days before the PM leaves No10
How much do finance jobs pay? #salarytransparentstreet #financejobs #bankingjobs

‘Largest Ponzi scheme in history’: Ben McKenzie on his crusade against crypto

The Most INSUFFERABLE Woman In Financial Audit History | Caleb Hammer Clips
-

 Crypto World7 days ago
SpaceX stock could rise 75% to $240, JPMorgan says
-

 Fashion4 days ago
Weekend Open Thread: Maeve – Corporette.com
-

 Crypto World5 days ago
Bitcoin’s 22% rally now needs real demand to outlast Treasury liquidity boost
-

 Crypto World6 days ago
Warsh Jackson Hole keynote puts financial innovation first
-

 Business5 days ago
Salesforce Stock Soars 19% as Blowout Earnings and Agentforce AI Growth Silence Software Skeptics
-

 Business5 days ago
Apple Confirms September 9 Keynote and Reveals Its Full Pre-Order Schedule
-

 Crypto World6 days ago
Elon Musk Grok Bot Promise: We Will Make You Whole if AI Loses Your Money
-
 Crypto World6 days ago
Did Trump Just Move SpaceX Stock With One Truth Social Post?
-

 Business4 days ago
Onto Innovation Stock: AI’s Next Bottleneck Is Yield (NYSE:ONTO)
-
 NewsBeat6 days ago
Lindsay Clancy jury braces for closing arguments as judge tells court: ‘You’ve heard all the evidence’ – Live updates
-

 Business6 days ago
Walmart takes aim at younger shoppers with new fashion brand
-

 Crypto World4 days ago
Bitcoin price tests $82K resistance as Brandt stays long
-
 Crypto World5 days ago
NVIDIA revenue hits $96.2B as AI demand doubles
-

 Business7 days ago
Thailand’s Eastern Economic Corridor Capital City (EECiti): Key Developments and Investment Opportunities
-

 Business4 days ago
iPhone 18 Pro Pre-Orders Could Shift to Saturday as Apple Reportedly Avoids September 11 Anniversary
-

 NewsBeat7 days ago
Trump’s trade truce with China faces test with Iran effort
-
 Crypto World6 days ago
Nvidia Q2 Earnings Reveal $96.2 Billion Beat, So Why Is NVDA Falling?
-
 Tech3 days ago
Hugging Face built a $4.5 billion empire on free AI models. Now Nvidia is buying it for $12.9 billion
-

 Tech5 days ago
Claude Cowork gets its own browser that doesn’t touch your tabs, bookmarks, or saved passwords
-

 Crypto World5 days ago
Truflation calls for Fed rate cut after PCE forecast
You must be logged in to post a comment Login