

Crypto World
Bitcoin Price Prediction: Michael Saylor Strategy Stops Buying?

Bitcoin price is trading at $67,500, up 1.5% in the last 24 hours, a soft jump that, on its own, means little, especially for those believing at 200K prediction. But combine it with radio silence from Michael Saylor’s Strategy and suddenly the question writes itself.
Has the most aggressive institutional buyer in crypto history finally tapped out?
— That Martini Guy ₿ (@MartiniGuyYT) March 29, 2026
 LATEST
MICHAEL SAYLOR HAS NOT POSTED THE SAYLOR TRACKER TODAY
IT SUGGESTS STRATEGY BOUGHT NO BITCOIN AFTER 13 STRAIGHT WEEKS OF BUYING pic.twitter.com/wpjUrVq39e
No fresh Strategy purchase announcement has emerged in the last 48 hours, an unusual silence from a firm that conditioned markets to expect near-weekly BTC accumulation disclosures. Profit-taking talk has intensified alongside it.
Still, with U.S. economic data releases imminent and ETF flow reports due, the next 72 hours carry outsized weight. Recent BTC price action analysis suggests the market is coiled, not broken.
Discover: The best crypto to diversify your portfolio with
Bitcoin Price Prediction: Can BTC USD Break $72,000 Resistance This Week?
Bitcoin’s current technical picture is a study in controlled tension. Price sits at just above $67,000, wedged between primary support at $65,000 (recent swing lows) and immediate resistance at $72,000 as the “now” ceiling.
The yearly trend remains bearish at 17% drop, and the 30-day base has held without a serious test. March opened at $65,000 leve; before staging the run, which was invalidated last week.
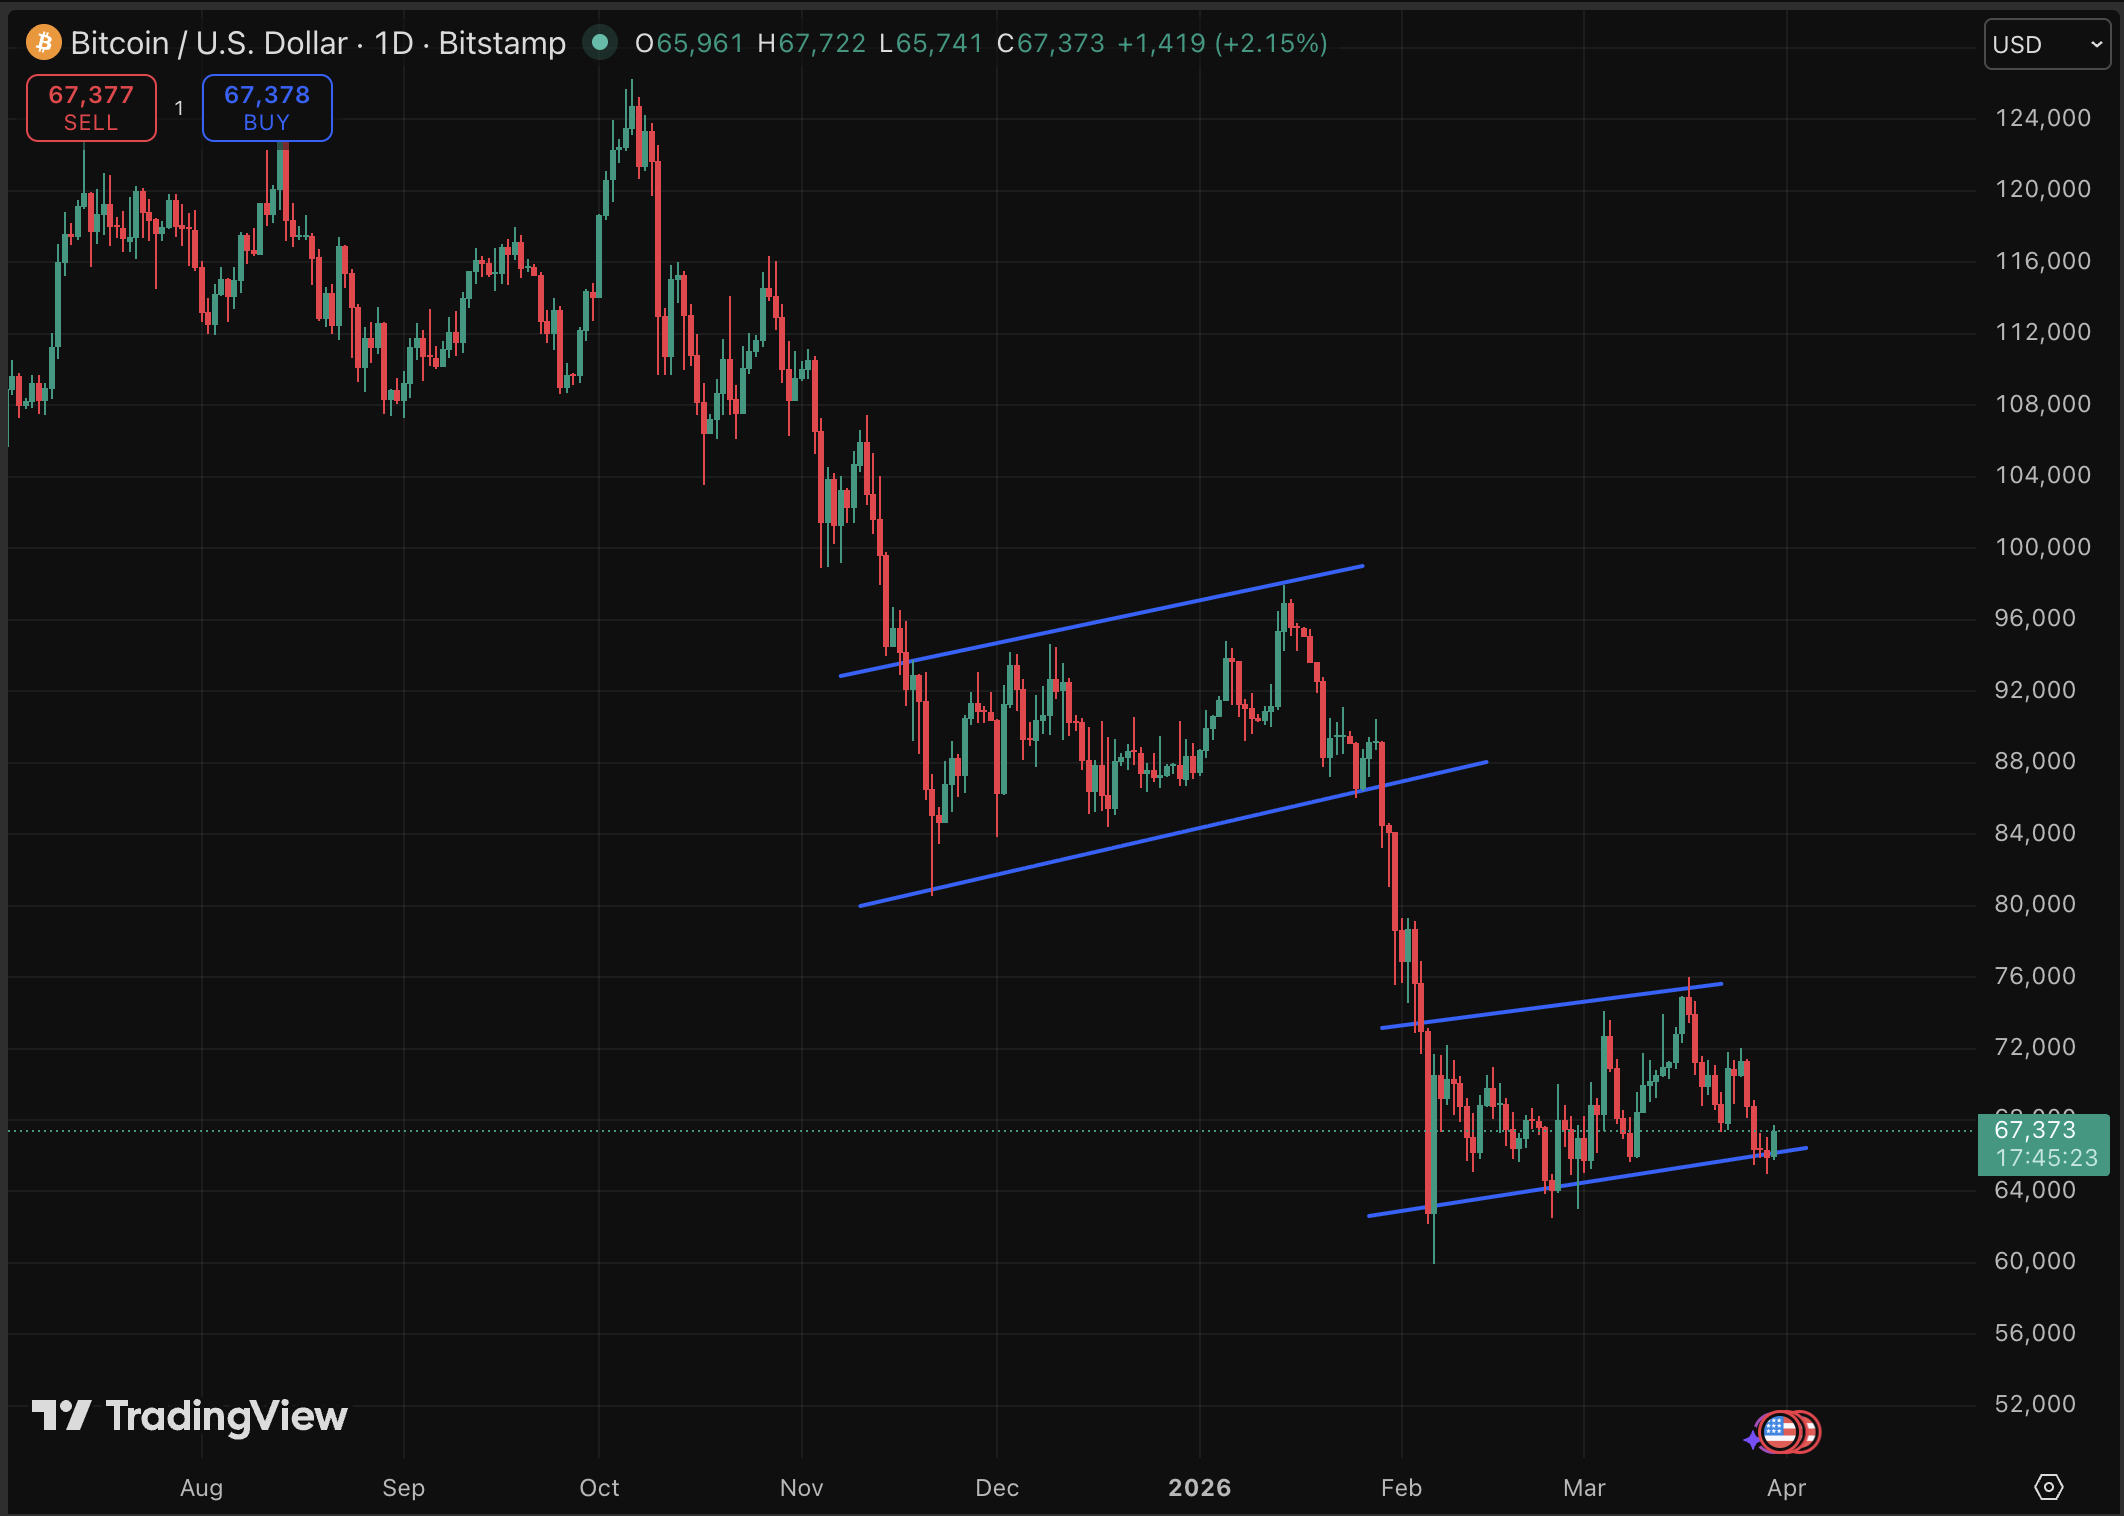
Three scenarios deserve equal attention right now:
- Volume returns, Strategy resumes buying (or another institutional name steps in), and BTC clears $72,000 on a daily close, opening a path toward the $75,000 area.
- Consolidation persists between $65,000 and $72,000 through early April as markets digest U.S. macro data; no breakdown, no breakout, just accumulation.
- A confirmed close below $65,000, however, would shift momentum, with $63,000 the next meaningful floor.
The Saylor silence is worth watching. GameStop’s recent 4,710 BTC treasury move hints corporate demand hasn’t evaporated; it may simply be rotating to new buyers. If ETF flow data due this week confirms continued institutional inflows, the $72,000 resistance test looks more likely than not.
Discover: The best pre-launch token sales
Bitcoin Hyper Targets Early Mover Upside as Bitcoin Tests Key Levels
Here’s the uncomfortable truth for late-cycle BTC buyers: at $67K, the asymmetric upside that early institutional adopters captured simply doesn’t exist anymore. Bitcoin’s risk-reward at current levels demands patience, possibly years of it. For traders who want Bitcoin-ecosystem exposure with early-stage return potential, the calculus looks different.
Bitcoin Hyper ($HYPER) is making a credible case for attention. It’s positioned as the first Bitcoin Layer 2 with Solana Virtual Machine (SVM) integration, a genuinely novel architecture that is faster transaction performance than Solana itself while preserving Bitcoin’s security layer.
The presale has raised over $32 million at a current price of $0.0136, with high-APY staking already live for participants.
This article is not financial advice. Crypto investments carry significant risk. Always conduct your own research before investing.
The post Bitcoin Price Prediction: Michael Saylor Strategy Stops Buying? appeared first on Cryptonews.


Key Points
- Security expert “0xflorent” successfully freed approximately 1,003 ETH (valued at roughly $2 million) from a 2016 HongCoin ICO smart contract after nine years
- An error in the contract’s refund mechanism prevented investors from withdrawing their ETH when the ICO failed to meet its fundraising target
- The researcher collaborated with HongCoin’s team to leverage an integer overflow flaw in an administrative function to release the locked assets
- 48 initial investors are now able to retrieve their ETH; two participants have already withdrawn 96.5 ETH (approximately $193,000)
- The researcher accepted no compensation — only voluntary “whitehat rewards” from grateful investors
A cybersecurity expert has successfully released approximately 1,003 Ether valued at around $2 million that remained trapped in a 2016 ICO smart contract for almost ten years.
The cryptocurrency belonged to participants in HongCoin, an Ethereum-based token offering marketed as a community-driven investment vehicle. The ICO operated from August 29 through October 28, 2016, but ultimately fell short of its fundraising target.
Following the unsuccessful sale, the smart contract should have automatically returned funds to investors. However, a coding error in the refund mechanism silently prevented this from occurring.
The cybersecurity professional, identified online as “0xflorent” or Florent, detailed the technical problem in a social media post on X. The refund mechanism would decline any token holder whose balance exceeded a global tracking variable. Through years of partial withdrawals, this counter had decreased to 356, effectively limiting total refunds to merely 3.56 ETH — significantly less than what most participants were entitled to receive.
The contract was developed using an outdated version of Solidity, the coding language for Ethereum smart contracts. It lacked safeguards against integer overflow vulnerabilities — a defect where numerical values increase beyond their maximum limit and reset to zero or one. The blockchain industry subsequently addressed this weakness through SafeMath, a protective library.
The Recovery Process
Florent discovered a solution by utilizing the HongCoin team’s administrative function. Executing it with a particular input value reset a participant’s token balance to one, enabling the refund verification to succeed and releasing the ETH.
This wasn’t an independent exploit. The administrative function required authorization from the HongCoin team’s multisignature wallet, necessitating team approval for each transaction. Florent contacted the team via email, validated the solution on a test network, and the team subsequently approved 41 transactions — one for each affected investor. The entire operation required approximately one week.
Among the 48 qualified investors, 41 required the balance adjustment. The remaining seven held sufficiently small amounts to receive direct refunds.
Two participants have already withdrawn a total of 96.5 ETH, worth approximately $193,000. Both voluntarily compensated Florent with whitehat rewards, though no payment was obligatory. “There were no fees, no cut, no commission,” Florent stated to The Block.
Ongoing Recovery Efforts
This isn’t Florent’s inaugural recovery operation. On May 24, he documented liberating 19.33 Ethereum from two different legacy contracts — a defunct 2018 ICO and a Liquality Wallet account whose assets were stuck in expired atomic swaps.
Florent explained that he recently deployed his own Ethereum node and developed a scanning tool to identify contracts holding over 100 ETH. He then systematically reviewed candidates searching for exploitable weaknesses.
He also utilized Claude Code to assist with sorting and categorizing contracts, though he acknowledged the AI platform has limitations when directly analyzing smart contract security flaws.
Florent expressed his hope to see more individuals working to safeguard funds rather than exploit them. “It’s more rewarding morally, and it can also pay well,” he remarked.

Crypto World
Ethereum (ETH) Price: Historical Trends Signal Potential Decline to $1,800 Before Recovery

Key Takeaways
- Ethereum has declined 12.5% over the last 30 days, underperforming the top 5 cryptocurrencies
- Historical data shows June has brought negative returns for ETH in 7 out of the past 10 years
- ETH faces difficulty maintaining the $2,000 level, with $1,800 identified as critical support
- Futures open interest reached an unprecedented peak of 15.98 million ETH on May 27
- Technical analyst Ali Charts identifies $1,825 as a strategic entry zone with targets at $2,073 and $2,360
Ethereum has experienced significant downward pressure recently. Over the past month, ETH has shed 12.5% of its value, positioning it as the weakest performer among the five largest cryptocurrencies by market capitalization.

As competing assets such as BNB and Hyperliquid capture market interest through fresh ETF product launches in the United States, Ethereum has found itself lagging behind.
Currently, the asset trades marginally under the $2,010 mark, positioned beneath the 100-hour Simple Moving Average. Technical charts reveal that a bullish trend line previously supporting the price at $2,015 has been compromised on the hourly timeframe.
A recent intraday low touched $1,965 before buyers attempted a modest bounce. Nevertheless, selling pressure reasserted itself above $2,020, keeping bearish momentum intact.
The Relative Strength Index on the daily chart has declined to 32, approaching oversold conditions without fully entering that territory. Should the price definitively breach $2,000, additional downside could materialize.
Historical Trends Suggest Further Weakness
Seasonal analysis presents a concerning outlook for Ethereum this month. Data from CoinGlass reveals that June has concluded negatively for ETH in 7 of the previous 10 years. These declines have varied between 1.5% and 45%.
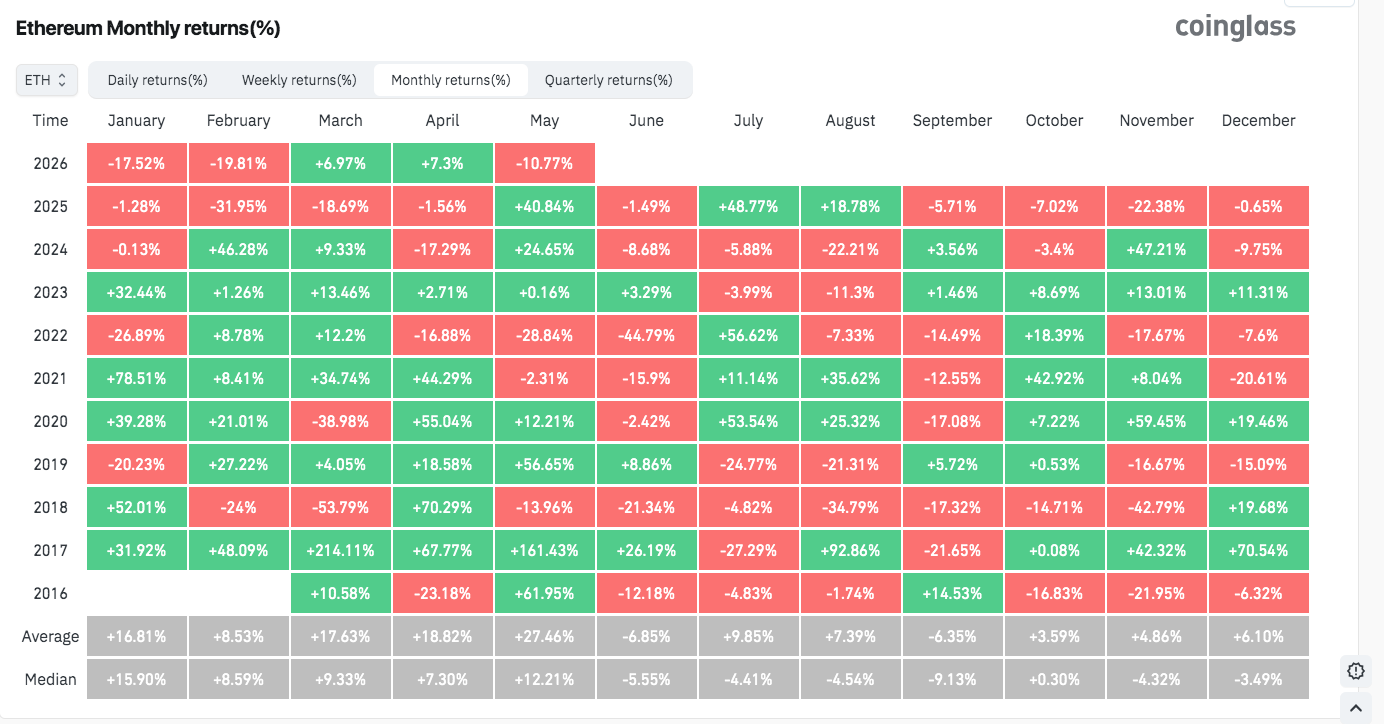
Given these historical precedents, a descent toward $1,800 appears increasingly plausible should the $2,000 support fail to hold.
Critical downside levels include $1,965 as the immediate support, followed by $1,920 and $1,850. The primary demand zone is located around $1,780.
On social platform X, analyst Ali Charts observed that ETH is nearing the lower boundary of its prevailing channel structure around $1,825. According to his assessment, this level presents an attractive risk-reward opportunity for entry, with projected upside targets at $2,073 and $2,360, contingent upon maintaining above $1,750 on daily closing basis.
Futures Activity Reaches Unprecedented Levels
Despite declining prices, activity in ETH futures markets surged to an all-time record. Open interest peaked at 15.98 million ETH on May 27, as reported by CoinGlass.
When calculated in ETH rather than dollar value, this metric eliminates price fluctuation distortions. The elevated reading indicates that market participants are actively establishing positions in anticipation of significant price movement.
Additionally, the weekly RSI has fallen beneath the 30 threshold. Historical analysis shows that the previous three occasions when this occurred preceded substantial price appreciation over the subsequent 6 to 12 months.
For bullish sentiment to regain dominance in the near term, Ethereum must reclaim the $2,050 resistance level. Successfully surpassing that barrier could trigger advances toward $2,085, followed by $2,120, and potentially extending to $2,150.
Presently, ETH continues trading beneath $2,010, with immediate focus centered on whether the $1,965 support level will hold against persistent selling pressure.
Key Points
- Cardano Foundation withdraws plans for 2026 summit following unsuccessful treasury funding vote that missed supermajority requirement
- Modified funding request for 7.8 million ADA (approximately $2 million) achieved 65.21% approval, falling 1.46% below the mandatory 66.67% threshold
- Initial funding proposal sought 14 million ADA (roughly $3.66 million) but faced rejection in May, prompting a reduced resubmission
- EMURGO’s independent TOKEN2049 Singapore conference proposal successfully passed, ensuring Cardano representation at the October gathering
- The outcome highlights growing resistance among Cardano’s delegated representatives toward treasury expenditures by founding entities
The Cardano Foundation has officially withdrawn its 2026 annual summit following a governance vote that came agonizingly close but ultimately failed to authorize necessary treasury funding.
Scheduled for October 5-6 in Singapore, the summit required 7.8 million Cardano tokens—valued at approximately $2 million—to proceed. The voting period concluded on Friday, May 29.
Approval Falls Fractionally Below Supermajority
Cardano’s governance framework mandates that treasury fund releases achieve a two-thirds supermajority from delegated representative (DRep) stake. The proposal garnered 65.21% backing—missing the mark by a mere 1.46 percentage points.
When examining individual votes, 135 delegates supported the measure, 61 opposed it, and 24 chose to abstain. Despite receiving Constitutional Committee endorsement, the proposal couldn’t overcome the network’s stringent voting requirements.
Following the vote’s conclusion, the Cardano Foundation shared on X: “Governance requires not only participation, but also a commitment to accept collective decisions. The Cardano community has spoken and we respect the outcome.”
The organization confirmed it would immediately begin discontinuing summit preparations.
Second Rejection Following Budget Reduction
This marked the proposal’s second unsuccessful attempt. The original May submission requested 14 million ADA—worth approximately $3.66 million—and combined summit funding with an EMURGO-led TOKEN2049 sponsorship. That consolidated proposal secured just 10% DRep backing.
Responding to the rejection, the foundation separated both events, reduced the budget by over 20%, and incorporated audited financial management, milestone-based payment releases, and an independent oversight committee.
Cardano creator Charles Hoskinson and foundation CEO Frederik Gregaard both publicly campaigned for DReps to support the modified proposal in the final hours before voting ended. Notably, the foundation refrained from casting votes on its own request, stating it wanted to avoid influencing the decision.
The separation strategy yielded one positive outcome. EMURGO’s standalone TOKEN2049 proposal received approval independently, guaranteeing Cardano participation at the Singapore cryptocurrency conference on October 7-8. The foundation supported EMURGO’s proposal.
Hoskinson has indicated he’s considering expanding the TOKEN2049 booth presence and potentially organizing a smaller embedded MiniSummit alongside it.
Escalating Treasury Spending Disputes Within Cardano Ecosystem
This unsuccessful vote represents a broader 2026 trend. Cardano’s delegated representatives have consistently rejected multiple treasury requests associated with Hoskinson, EMURGO, and Input Output Global, including reduced funding allocations connected to the Leios mainnet advancement.
Cardano’s token maintains an $8.8 billion market capitalization. The network currently holds under $129 million in total value locked, positioning it 28th among blockchain platforms.
Throughout 2026, the network has produced $356,400 in fees, compared with $8.35 million across the entire 2022 calendar year.
As of Sunday, Cardano’s token traded near $0.233, reflecting approximately 5% decline over the preceding month.
Key Takeaways
- Spot Bitcoin ETFs in the United States experienced $1.42 billion in net redemptions over the past week — marking the third-largest weekly outflow in history.
- BlackRock’s IBIT fund dominated the exodus with approximately $966 million in outflows, including a single-day withdrawal of $448 million.
- ETF issuers liquidated roughly 19,021 BTC within seven days — equivalent to 42 days’ worth of fresh mining production.
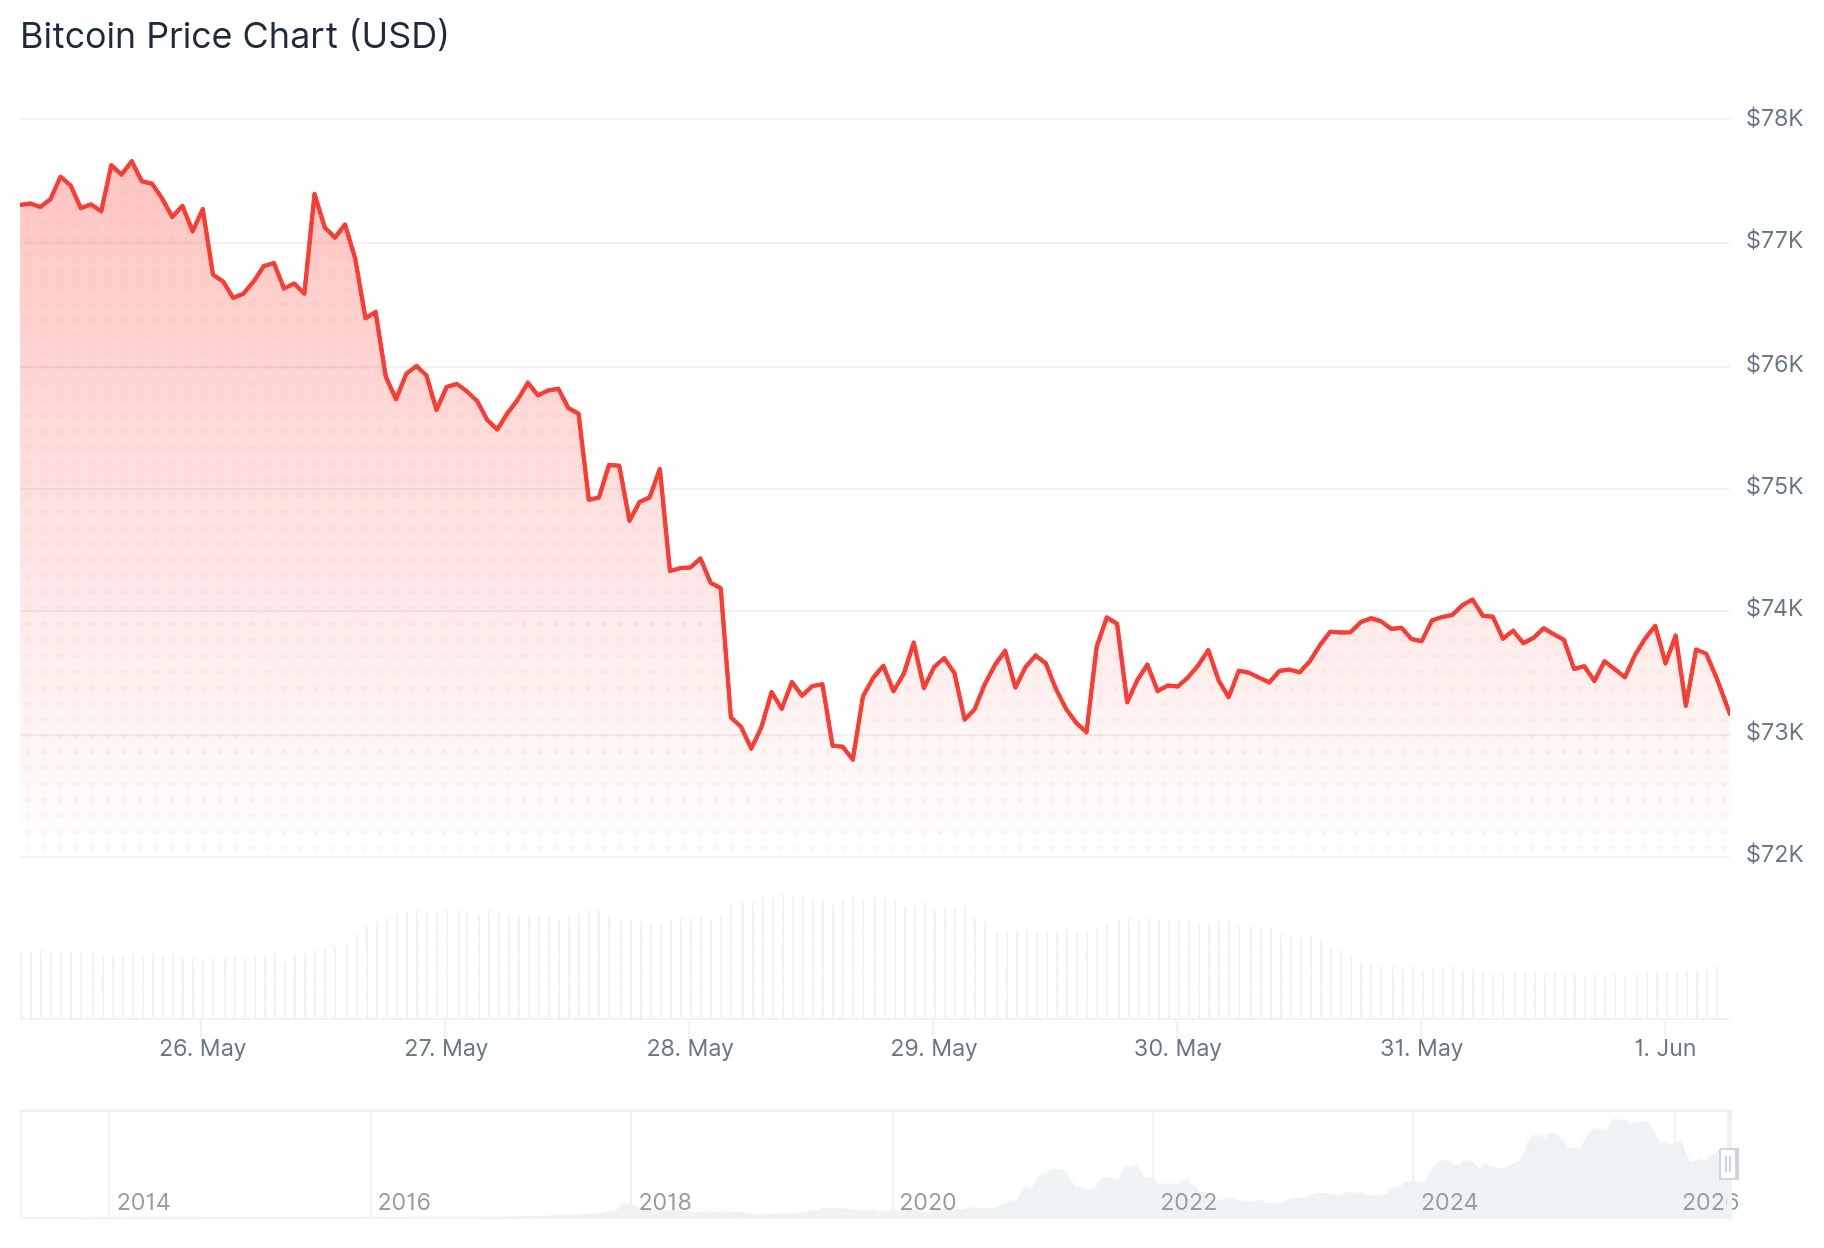
- Bitcoin’s value declined more than 4% over the week, settling near the $73,000 mark.
- Broader economic factors — persistent inflation data, climbing Treasury yields, and international tensions — continue fueling investor retreat.
Bitcoin retreated more than 4% during the past week, settling around the $73,000 level after temporarily climbing back above $82,000 in May. This downturn coincided with substantial capital flight from US spot Bitcoin ETFs, which registered $1.42 billion in net redemptions — representing the third-heaviest weekly withdrawal since these investment vehicles debuted, based on current market data.

This marks the third consecutive week of significant investor withdrawals. Cumulative outflows across this three-week period have now surpassed $3.5 billion.
BlackRock’s IBIT Dominates Redemption Activity
BlackRock’s IBIT, which commands the largest asset base among spot Bitcoin ETFs, spearheaded the selloff. The fund recorded approximately $966 million in weekly exits. During its most severe single-day period, redemptions reached $448 million.
When investors redeem ETF shares, fund managers must liquidate equivalent Bitcoin holdings to fulfill those requests. Collectively, spot ETFs dumped approximately 19,021 BTC into the market last week — a volume matching 42 days of blockchain mining rewards.
Cryptocurrency analyst Ali Charts (@alicharts) identified a crucial price threshold, noting: “I’m monitoring $72,650 carefully on Bitcoin, as the MVRV Pricing Bands persistently flag it as a vital support threshold. Should this level break, the subsequent significant demand area spans between $54,300 and $51,000.” This price point hovers slightly beneath Bitcoin’s current valuation.
Root Causes Behind the Exodus
Macroeconomic conditions represent the primary catalyst. Recent inflation statistics published in May diminished market expectations for Federal Reserve interest rate reductions. Elevated rates enhance the attractiveness of risk-free instruments like Treasury securities, consequently diminishing investor appetite for volatile assets such as Bitcoin.
International instability — including possible renewed escalation in US-Iran relations — has intensified downward pressure. Petroleum price increases connected to these tensions threaten to elevate inflation further, making rate cuts increasingly improbable.
Analyst AlphaBTC (@mark_cullen) outlined a short-term projection, indicating he’s monitoring for a potential rebound toward $79,000 before an eventual decline to the lower $60,000 range during late summer.
The Crypto Fear & Greed Index maintained readings in “fear” territory throughout the entire week.
One encouraging signal: the market’s ability to absorb 19,021 BTC of selling pressure without triggering a steeper price collapse indicates residual demand exists at present valuation levels.
Bitcoin was changing hands near $73,000 according to the most recent market data, with the $72,650 MVRV support threshold under intense analyst scrutiny.


More than 1,003 Ether, worth roughly $2 million, have been recovered from a failed 2016 ICO dubbed Hong Coin after a white hat hacker found a way to unlock funds that had remained trapped in a faulty smart contract for nearly 10 years.
Summary
- A white hat hacker helped recover 1,003 ETH worth about $2 million from a failed 2016 Hong Coin ICO contract.
- The funds remained locked for nearly a decade after a bug prevented investors from receiving automatic refunds.
- Recovery became possible after the hacker identified an integer overflow flaw and worked with the project’s creators to unlock the refund mechanism.
According to a Sunday post on X by pseudonymous white hat hacker 0xflorent, the recovered ETH belonged to 48 investors who participated in the Hong Coin (HONG) token sale, a decentralized venture capital project that never launched after failing to meet its fundraising target.
As explained by 0xflorent, the ICO contract was designed to automatically return investors’ ETH if the funding goal was not reached. A flaw in the refund function prevented that process from working, leaving the funds permanently locked despite the sale ending without success.
Blockchain records from Etherscan show refunds have already started. One investor received 96 ETH, currently valued at about $192,500, while another wallet recovered 0.5 ETH.
Hong Coin was introduced in 2016 as a decentralized autonomous organization focused on venture capital investing. A promotional video published at the time described a structure where token holders would vote on projects that could receive funding from the community-managed pool.
The ICO opened on Aug. 29, 2016, and concluded on Oct. 28, 2016. Participants who contributed ETH were expected to receive a share of 250 million HONG tokens distributed across multiple funding stages. Because the project did not achieve its fundraising target, investors became eligible for refunds under the smart contract’s rules.
Integer overflow bug provided path to recovery
Detailing the recovery process, 0xflorent said the solution emerged from an overlooked administrative function that contained an integer overflow vulnerability.
According to the white hat, invoking the function with a specific input reset a token holder’s balance and allowed the contract’s refund conditions to execute correctly. Working alongside the original HONG creators, 0xflorent demonstrated how the flaw could be used to release the trapped ETH without moving funds outside the contract.
“The way out was an admin function with an integer overflow vulnerability,” 0xflorent wrote on X. “Calling it with a specific input resets a holder’s balance and unblocks the refund check.”
The recovery adds to a growing list of cases where white hat hackers have intervened to secure or return cryptocurrency funds after identifying vulnerabilities in smart contracts and protocol infrastructure.
Earlier in May, blockchain security firm Blockaid reported that a white hat attacker exploited a vulnerability in Renegade.fi’s Arbitrum-based dark pool, temporarily draining about $209,000 before returning more than 90% of the assets.
According to Blockaid, the issue stemmed from deployment and migration errors that allowed unauthorized modification of a smart contract connected to the protocol’s V1 dark pool.
In messages published on-chain following that incident, the Renegade exploiter argued that exposing the weakness was the safest way to protect user funds and pointed to the simplicity of the vulnerability as evidence that more malicious attackers could have caused far greater losses.
Separately, 0xflorent disclosed on May 24 that they had also recovered a combined 19.33 ETH, worth roughly $40,600 at the time, from a failed January 2018 ICO project and from a Liquality Wallet user whose funds became trapped in a cross-chain transfer protocol.


CertiK has reported that crypto losses from hacks and exploits have fallen to $68.3 million in May, nearly 90% lower than the roughly $650 million stolen in April.
Summary
- Crypto losses fell to $68.3 million in May, nearly 90% lower than the roughly $650 million recorded in April, according to CertiK.
- Verus Protocol and THORChain suffered the two largest exploits of the month, with combined losses exceeding $21 million.
- CertiK reported a rise in AI-assisted malware activity as attackers targeted code repositories and AI coding tools.
According to blockchain security firm CertiK, May became the third month of 2026 to record less than $100 million in crypto-related losses after attackers stole $68.3 million through exploits, scams, and security breaches.
The figure comes after a difficult April, when losses surged to around $650 million. CertiK noted that, excluding the $1.5 billion Bybit hack in February 2025, April recorded the highest monthly losses since March 2022. A $291 million exploit targeting Kelp DAO accounted for the largest incident that month.
While losses declined sharply in May, several major attacks still affected the sector. Data from CertiK shows that an exploit targeting Verus Protocol’s cross-chain bridge on May 18 resulted in $11.5 million in losses, making it the largest incident of the month. An attack on THORChain followed with roughly $10.1 million stolen from the protocol.
A breakdown of the data shows that code vulnerabilities remained the most expensive attack vector. CertiK reported that flaws in protocol code accounted for approximately $45 million in losses, representing about 66% of the month’s total. Wallet and private key compromises ranked second, with attackers stealing $13.7 million through those incidents.
Cross-chain infrastructure continued to attract significant attention from attackers. According to CertiK, cross-chain bridge exploits caused $28.6 million in losses during May, or roughly 42% of the monthly total, placing them ahead of decentralized finance protocols among the most targeted sectors.
Data from DeFiLlama recorded 29 security incidents during the month, including seven cases involving compromised private keys.
Among the most recent attacks were exploits affecting Alephium Bridge and Gravity Bridge on May 30. Data shows that the incidents led to losses of approximately $815,000 and $5.4 million, respectively, after attackers gained access to private keys.
AI-powered attacks add to security concerns
Even as total losses declined, security researchers continue to warn about changes in attacker tactics.
In April, CertiK senior blockchain investigator Natalie Newson warned that threat actors were increasingly combining social engineering, phishing campaigns, supply-chain compromises, and cross-chain vulnerabilities to execute large-scale attacks. Newson also warned that artificial intelligence tools were making cybercrime operations more sophisticated and easier to scale.
CertiK’s latest findings suggest that trend is continuing. The company reported that AI-assisted malware activity increased in May, with attackers targeting both crypto developers and AI developers by compromising code repositories and manipulating AI coding assistants.
Newson previously said that tools capable of creating realistic deepfakes, autonomous attack agents, and software that can identify vulnerabilities and generate exploit code are becoming more accessible.
According to CertiK, such capabilities are adding new risks at a time when attackers are already exploiting weaknesses in cross-chain systems and private key management.
In the meantime, CertiK has advised users to remain cautious of phishing attempts, verify the authenticity of websites and smart contracts, and consider using cold wallets to reduce exposure of private keys during everyday operations.

Artificial intelligence is rapidly changing the way music is created, produced and distributed. What once required a studio, a team of professionals and months of work can now be tested, refined and released in a much shorter time through AI-assisted creative tools.
A new example of this shift is Lunayah, a virtual music project that has released its second single, “New Beginning”, now available across major streaming platforms.
The track follows Lunayah’s first release, “Money Magnet,” but marks a more mature and emotional direction for the project. While the debut focused on abundance and affirmation-based music, “New Beginning” explores personal transformation, self-discipline, freedom and the process of becoming a stronger version of oneself.
A Virtual Artist Built Around AI, Music and Identity
Lunayah is not presented as a traditional artist, but as a virtual music identity created through a combination of human direction, digital storytelling and AI-assisted production. The project was developed by Vincenzo Stefanini, entrepreneur and founder of Web3 Digital, a Dubai-based digital agency focused on branding, online growth and emerging technologies.
The idea behind Lunayah is to explore how artificial intelligence can support the creation of a complete music project, from concept and lyrics to visual identity, storytelling and distribution.
“AI didn’t replace creativity. It amplified it,” Stefanini said. “New Beginning is not just a song. It represents a personal transformation.”
“New Beginning” and the Sound of Reinvention
“New Beginning” is built as an energetic pop-dance track with a motivational message. The song speaks about breaking old routines, rebuilding discipline, taking control and moving toward a new phase of life.
Rather than being a sad or nostalgic song, the track carries a sense of momentum. It is about leaving behind limiting patterns while keeping the lessons of the past and using them as fuel for growth.
The chorus is designed around a clear emotional message: the moment has arrived to stop playing small, take back control and build something bigger.
This makes the track especially relevant within the growing self-improvement and motivational music space, where listeners use songs not only for entertainment, but also for energy, focus and emotional reinforcement.
AI as a Creative Accelerator
The release highlights a broader trend: AI is lowering the barrier to entry for music production. Independent creators, entrepreneurs and digital brands can now test concepts that would previously have required significantly more time, budget and technical resources.
At the same time, the project keeps human input at the center. The concept, message, direction, final selection and branding decisions remain human-led, while AI tools help accelerate execution.
“Technology is changing music, but human emotion still remains at the center,” Stefanini added. “This project started as an experiment, but quickly evolved into something much bigger.”
Available Now
“New Beginning” is now available through the official Lunayah project page at lunayah.com.
Listeners can also access the release directly through:
As AI continues to reshape creative industries, projects like Lunayah show how virtual artists, digital storytelling and AI-assisted music production may become a growing part of the future music landscape.
Hyperliquid’s native cryptocurrency, HYPE, has become one of the strongest performers in the crypto markets over the past few weeks. Just today, it exploded to a fresh all-time high above $73.
The move comes amid a broader wave of institutional interest, strong ETF inflows, and continued momentum in the platform’s position as a leading on-chain derivatives ecosystem.
HYPE Hits New Record After 20% Weekly Rally
HYPE has extended its impressive uptrend over the last 24 hours, climbing more than 5% and pushing above $73 to mark a new all-time high at the time of this writing.

The latest move caps a very powerful five-day rally for the cryptocurrency. HYPE had already been gaining traction last week (and the weeks before that) as buyers defended higher lows and pushed the token through several key resistance zones.
Over the past seven days, it has increased by more than 20%, while its 30-day gains have reached more than 75%.
This has pushed HYPE into the top 10 by market cap, allowing it to surpass the likes of DOGE.
ETF Inflows and Grayscale Buzz Fuel the Rally
Beyond improving fundamentals and overall trading volume, another major reason for the rally appears to be the growing demand for HYPE-linked exchange-traded products.
According to data from SoSoValue, US spot HYPE ETFs recorded more than $9 million in one-day net inflows on May 29th, bringing total net assets above $135 million.

Grayscale has also added another layer to the bullish narrative. The asset manager is reportedly in talks with Hyper Holdings Global LP for a seed investment of approximately 2 million HYPE tokens, which are currently worth well over $140 million, for its proposed Grayscale Hyperliquid Staking ETF.
The fund itself is expected to trade on Nasdaq under the ticker HYPG, which further strengthens expectations that institutional access to HYPE could continue growing.
The post Hyperliquid’s HYPE Price Soars to New ATH Above $73: Here’s Why appeared first on CryptoPotato.


A new feature shipped in Sui’s v1.72 release exposed an edge case in the Layer-1 blockchain’s gas-charging logic that halted mainnet three separate times across May 28 and May 29, with each fix either triggering or exposing the next failure, the Sui Foundation said in a post-mortem published Sunday.
The first outage began at roughly 7 a.m. PT on Thursday and lasted close to seven hours.
According to the foundation, it stemmed from a rare issue in how the network charged gas for transactions paying with a mix of the new address-balance feature and traditional coin objects. The bug caused validators to crash with an underflow error when a transaction was canceled for insufficient funds, but the gas-smashing routine still tried to spend those same funds.
Think of a coin object as a digital banknote. A user’s SUI balance isn’t a single number — it’s a stack of distinct “notes,” each with its own ID, that can be moved or combined. The wallet might hold three coin objects worth 60, 30, and 10 SUI rather than a single 100-SUI balance. To pay for something, the network combines the notes it needs.
Validators are computers (and the operators behind them) that run the network by processing transactions, voting on which ones are valid, and keeping the chain alive.
The core team brought the network back up around 1:30 p.m. PT with what it called an “interim fix” that addressed the most common version of the bug but carried “a known issue with a low probability of causing a halt.” The team accepted that risk to restore the mainnet quickly while a more robust fix was developed.
The known risk materialized the next morning. A second outage began around 5 a.m. PT on Friday, when a transaction triggered a masked variant of the same bug, in which the insufficient-funds error was overridden by another cancellation reason, bypassing the interim patch. The core team finished a more robust fix, and validators adopted it by about 9:40 a.m. PT.
The third halt was a knock-on from the second. When validators restarted to install the robust fix, validator participation in the protocol that bootstraps the network’s on-chain randomness fell below the required threshold, and randomness disabled itself as designed.
(On-chain randomness is a protocol the network uses to produce a number nobody can predict or fake, even though every validator has to agree on the same value. Apps that depend on chance — lotteries, certain games, random NFT mints — can’t run without it.)
A latent bug then failed to persist that disabled state to disk, leaving validators unaware on the next restart that randomness had been turned off. The next epoch change stalled for close to six hours as randomness-dependent transactions piled up in a paused queue.
No user funds were at risk during any of the outages, and no committed transactions were reverted, the foundation said.
SUI dropped roughly 8% during the cascade to a low of $0.90 and was trading near $0.90 on Monday, leaving the token down about 19% on the week, per CoinDesk data.
The events represent Sui’s third major reliability incident since its 2023 mainnet launch, following a two-hour transaction scheduling bug in November 2024 and a six-hour consensus divergence in January 2026.


The most expensive DeFi attack of 2026 began with KelpDAO’s restaked ether (rsETH) bridge, not a bug in Aave’s code. That, the lending protocol argues in an official postmortem published this week, is precisely why the industry needs to rethink how it measures risk.
Aave said it is launching a review of every asset listed on V3 and rewriting its listing standards after April’s $230 restaked ETH exploit exposed a new class of DeFi risk.
The protocol’s postmortem traced the attack not to a flaw in Aave’s smart contracts but to a LayerZero bridge verification failure, where a single verifier approved a forged cross-chain message that released 116,500 unbacked rsETH.
Going forward, Aave says collateral assessments will weigh bridges, oracle dependencies, custodians and operational security alongside the financial and smart-contract risks it has traditionally screened for.
KelpDAO is a “restaking” service, which lets users take their ether that is already locked into Ethereum to earn staking rewards and reuse it as collateral to earn additional yield from other protocols. The token rsETH represents a user’s claim on that restaked ether. To move rsETH between blockchains, KelpDAO uses LayerZero, a piece of infrastructure called a cross-chain bridge that passes messages between networks so a token issued on one chain can show up on another.
Bridges rely on a set of independent verifiers who confirm each message is real before the receiving chain releases the equivalent tokens.
In April’s attack, just one of those verifiers approved a fake message, which let the attacker mint 116,500 rsETH on the receiving chain with no actual ether backing it.
Those tokens were then deposited into Aave, a lending protocol where users borrow against collateral they post, and used to take out loans Aave could not recover once the rsETH was revealed as worthless. Aave’s own code worked exactly as designed. The collateral it accepted turned out to be fake because the bridge that delivered it had been compromised.
While LayerZero acknowledged earlier this month that it “made a mistake” by allowing its own verification system to secure high-value assets in a one-of-one configuration, Aave’s postmortem goes further by using the incident to justify a broader overhaul of DeFi risk management.
The protocol argues that traditional reviews focused on volatility, liquidity and smart contract audits failed to capture the risks created by bridges, verification networks and other infrastructure that sits outside application code.
Beyond smart contract audits and financial risk analysis, Aave said it will now evaluate bridge infrastructure, oracle dependencies, third-party contracts, custodial arrangements, operational security practices, and secondary-market liquidity before approving or expanding collateral listings.
The protocol is also building new automated defenses designed to react faster when collateral assets show signs of distress. Among the proposals outlined in the postmortem is a system that would automatically reduce an asset’s loan-to-value ratio to zero once predefined risk thresholds are breached, removing its borrowing power before losses can spread through the broader market.
Since the exploit, Aave says its risk managers have already executed roughly 295 parameter changes across V3 markets, including 168 supply-cap reductions and 66 borrow-cap reductions aimed at limiting exposure to individual assets.
As DeFi protocols become more interconnected, Aave’s postmortem suggests the industry may need to scrutinize not only the assets it lists, but also the infrastructure those assets depend on

Established Star Holds Edge in Global Reach
Ethical Hacker Frees $2M in Ethereum Trapped Since 2016 ICO Failure

How Much XRP Do You ACTUALLY Need?


-

 NewsBeat5 days ago
Israel says it has killed new Hamas military leader in Gaza City airstrikes
-

 Tech5 days ago
NASA taps Blue Origin to deliver lunar rovers for Moon Base initiative
-

 Politics7 days ago
Bridgerton Season 5: Cast, Release Date And Everything We Know So Far
-

 Sports6 days ago
2026 NBA Finals schedule, odds: Knicks await Thunder or Spurs after winning East
-

 News Videos5 days ago
XRP *JUST* SUCCEEDED!!!! CLARITY ACT EXPOSED!!! (SHE EXPOSED IT)
-

 News Videos3 days ago
This is BROKEN! INSANE 5x MONEY CAR WASH WEEK! The NEW GTA Online UPDATE Today! (GTA5 New Update)
-
Crypto World5 days ago
Micron Crosses $1 Trillion Market Cap as AI Demand Reshapes Memory Sector
-

 Business5 days ago
Selena Gomez Reportedly Upset Over Benny Blanco’s Comments on Her ‘Terrible’ Diet
-
 NewsBeat7 days ago
Hottest May day ever as London hits 34.8C in 2C leap from previous records
-

 Business7 days ago
BTS Sells Out Four Las Vegas Shows at Allegiant Stadium for ARIRANG World Tour
-
 Tech6 days ago
China assigns ID codes to 28,000+ humanoid robots
-

 Business6 days ago
Nikkei 225 Surges Past 65,000 for First Time as Iran Peace Hopes Fuel Record Rally
-

 Tech7 days ago
Microsoft’s quiet Claude Code retreat and the real cost of enterprise AI
-

 Tech3 days ago
Waymo dominates autonomous vehicle registrations as Tesla trails behind
-
 Entertainment6 days ago
‘Breaking Bad’ Star’s Easy-to-Binge 6-Part Crime Series Spin-Off Is Finally Heading to Free Streaming
-

 NewsBeat7 days ago
Crowds find riverside shade in York as temperatures soar
-
Tech5 days ago
The Samsung pay deal is the moment Korean unions changed register
-

 Tech7 days ago
Westone Audio and Etymotic Acquired by Fidelity Collective in Major IEM Market Move
-

 Tech5 days ago
Millions of AI agents imperiled by critical vulnerability in open source package
-
Crypto World5 days ago
SpaceX’s $2 Trillion IPO: Why Tech Giants Nvidia (NVDA), Apple (AAPL), and Microsoft (MSFT) May Face Pressure
You must be logged in to post a comment Login