
Crypto World
Will ETH Inevitably Drop Below $2K This Month?
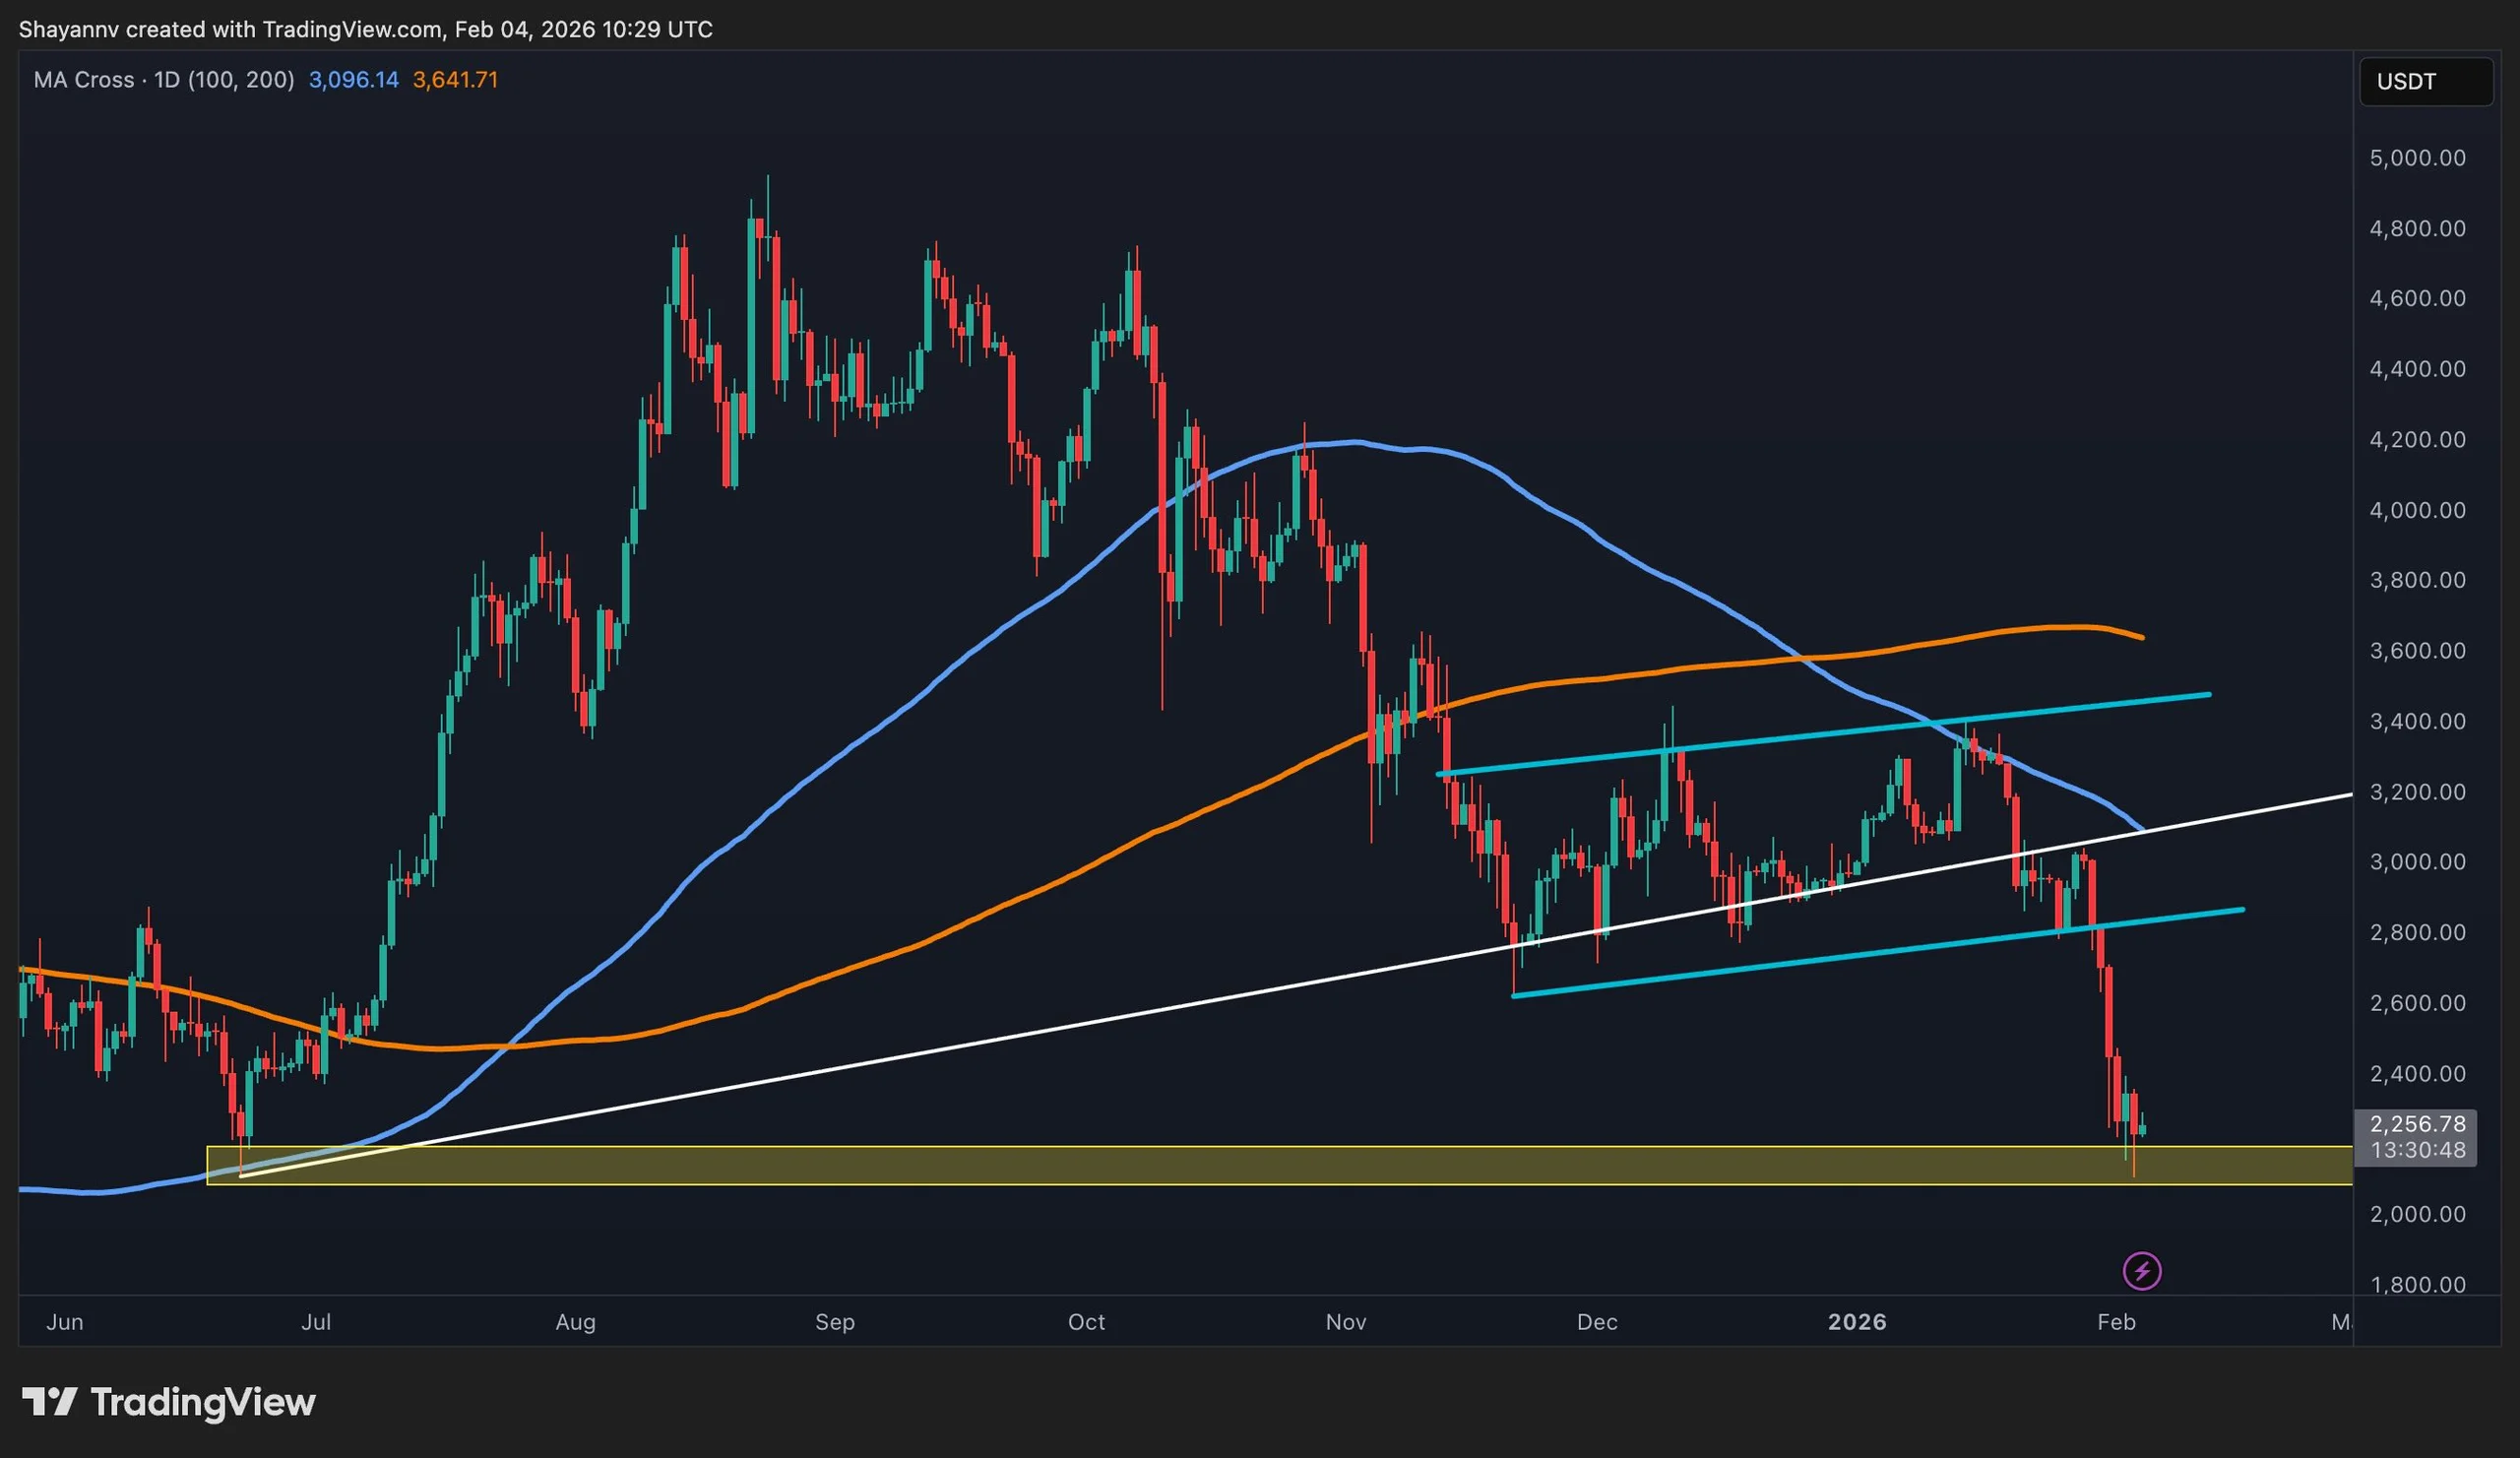
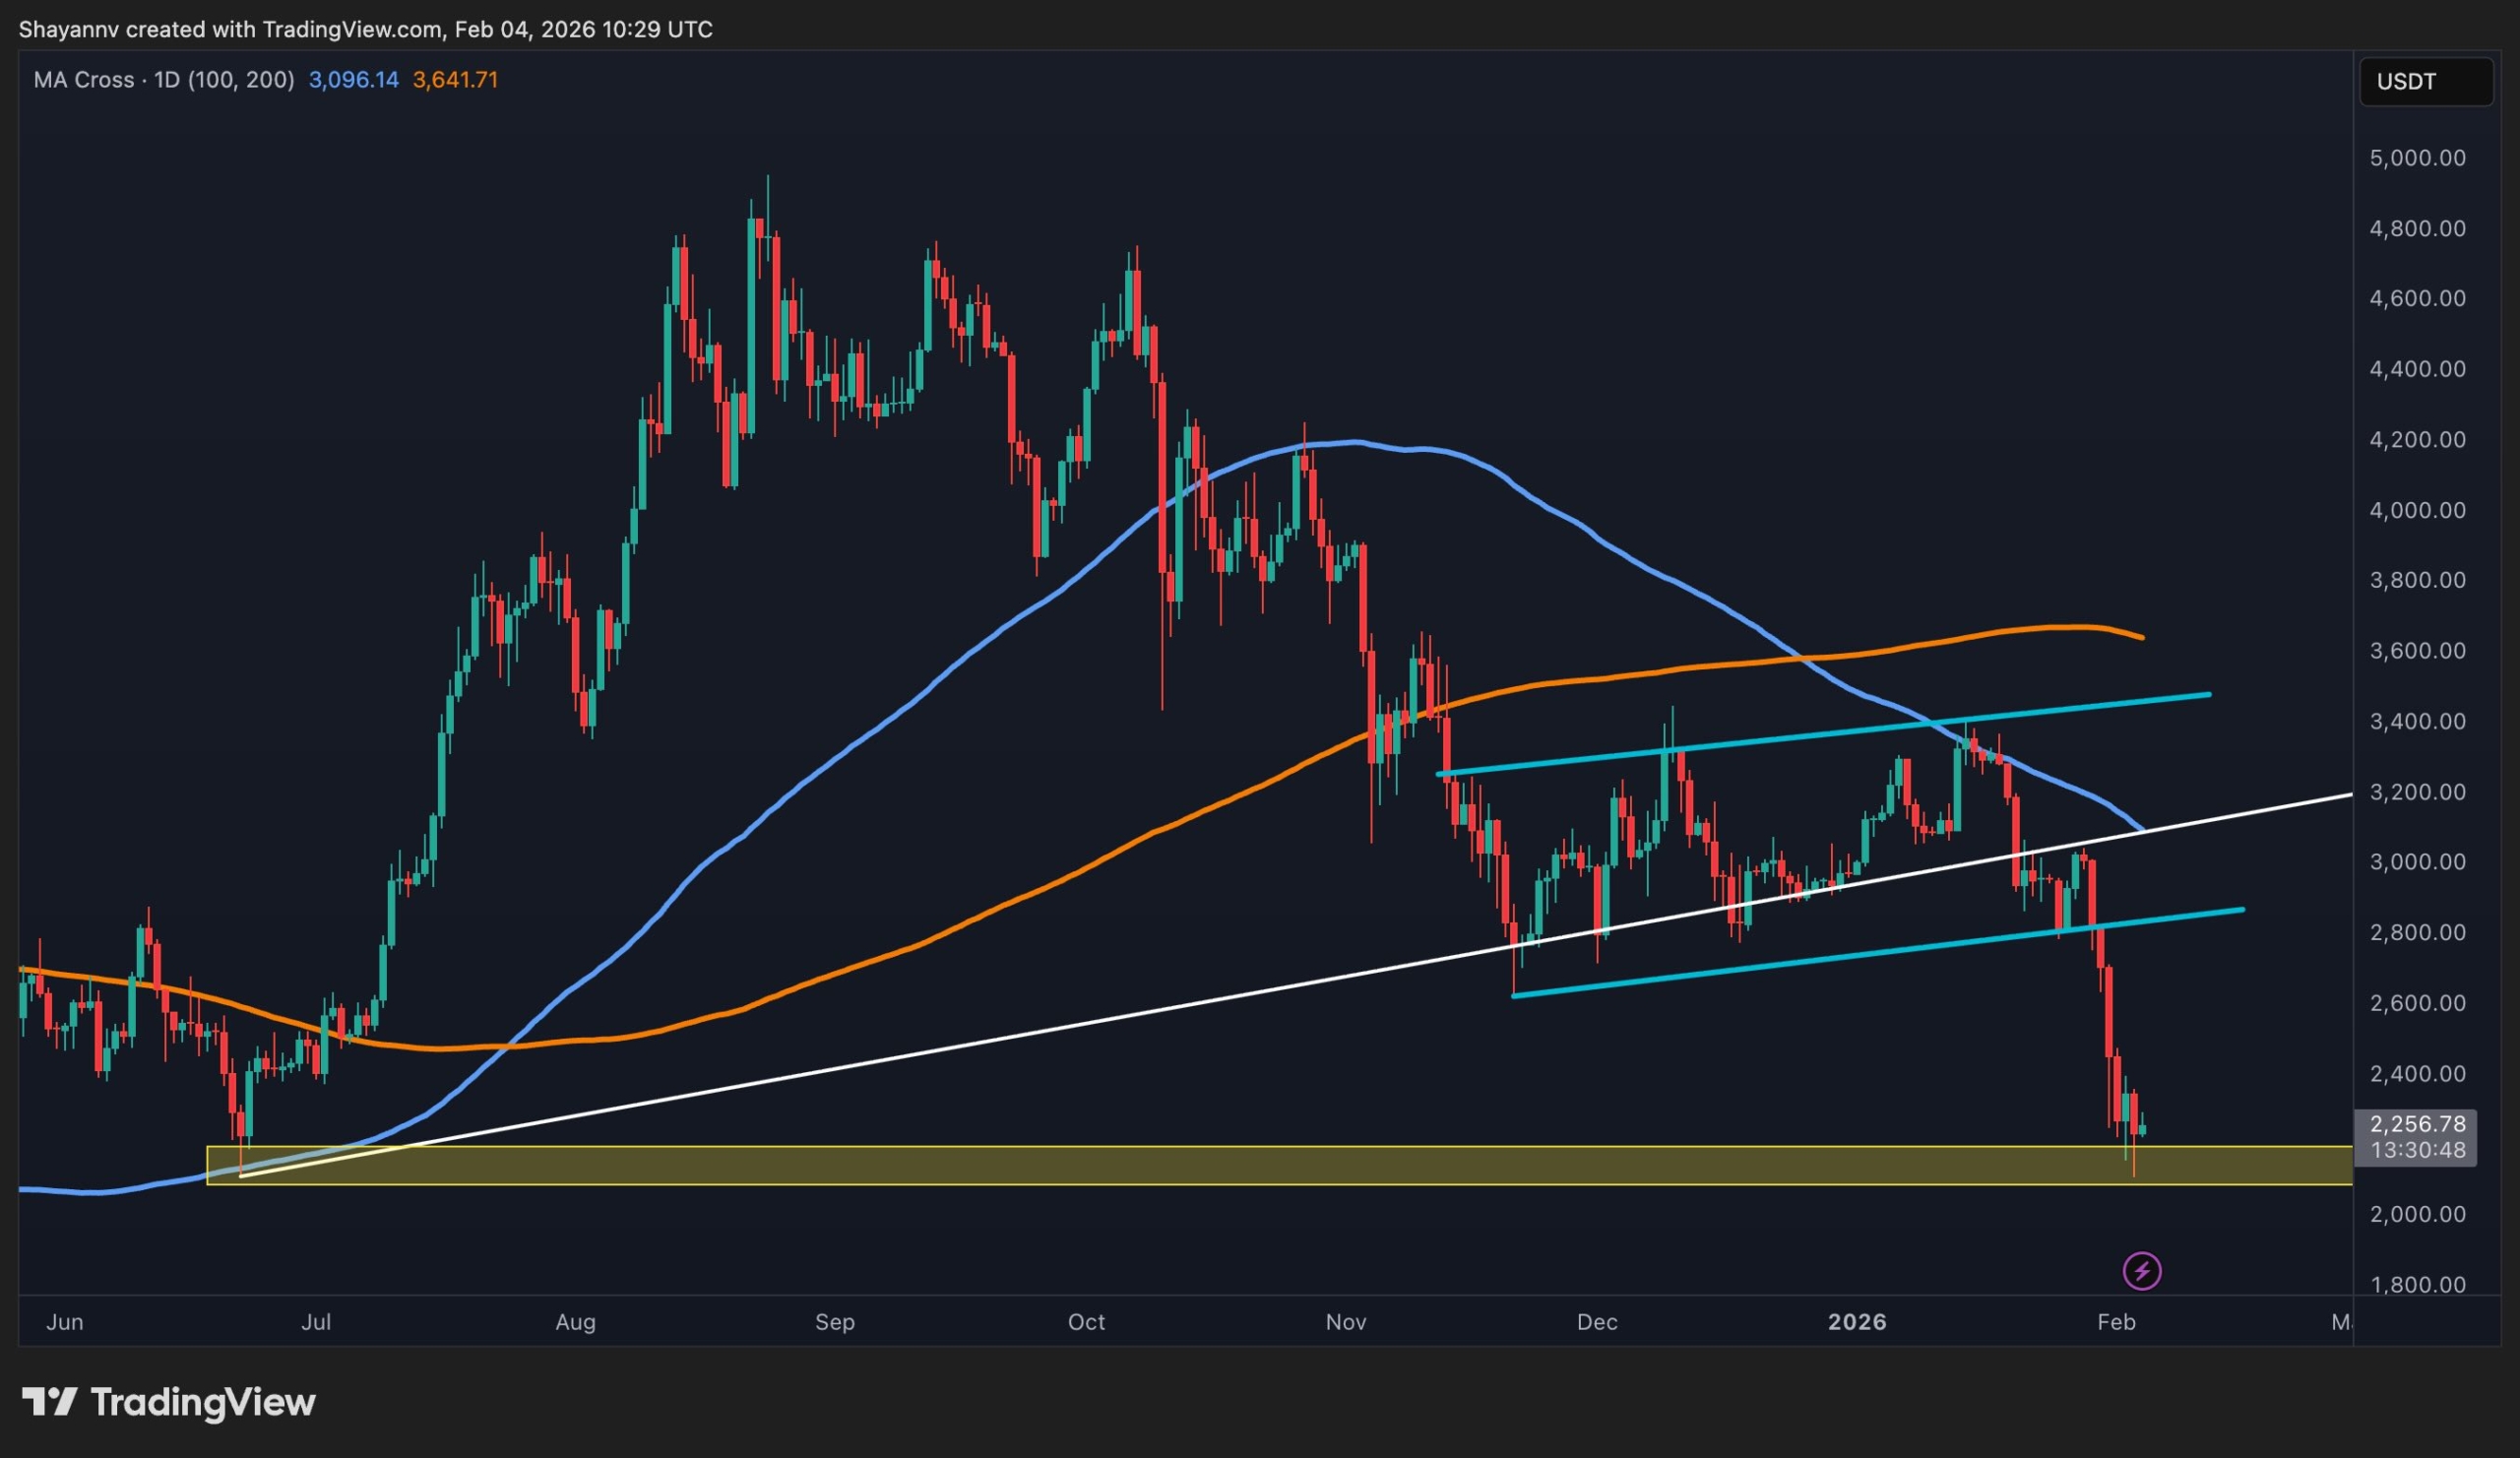
Ethereum has extended its corrective phase and is now trading at a technically decisive area, where higher-timeframe demand and market structure intersect. The price behaviour around this zone is critical in determining whether ETH stabilizes in a broader range or resumes its downside momentum.
Ethereum Price Analysis: The Daily Chart
On the daily timeframe, Ethereum has reached a crucial support zone around the $2K area, which aligns with a major prior yearly low and a historically significant demand region. This level has previously acted as a strong base for accumulation, and the market’s reaction here suggests growing sensitivity among participants.
The sharp sell-off into this zone reflects aggressive bearish momentum, but the absence of immediate continuation lower indicates that selling pressure may be temporarily exhausting. From a structural perspective, this area represents a decision point where sustained acceptance below it could open the door to deeper downside, while stabilization above it increases the probability of consolidation.
At this stage, the most likely outcome on the daily chart is a consolidation and range-bound phase as the market digests recent losses and awaits fresh demand or a clear macro catalyst.
ETH/USDT 4-Hour Chart
On the 4-hour timeframe, the price action shows a descending fluctuation while holding within the critical $2K support range. The market is compressing after the impulsive sell-off, with lower highs forming against relatively stable lows, a behaviour often seen near short-term exhaustion points.
This structure leaves room for a temporary bullish rebound, driven by short-covering or reactive demand, particularly after the steep downside move. However, this potential rebound should be viewed as corrective rather than trend-reversing.
The dominant scenario remains an expanded range environment, where Ethereum oscillates within a defined structure, bounded by $2K and $3K threhsolds, until meaningful demand enters the market or a new supply zone forms above, reasserting directional bias.

Sentiment Analysis
The Ethereum Coinbase Premium Index is currently deeply negative and has dropped to levels last seen around the previous year’s major market lows, signalling a clear bearish state in market sentiment. This persistent negative premium reflects sustained selling pressure from US-based investors, with Ethereum trading at a discount on Coinbase relative to offshore exchanges.
Historically, such conditions indicate weak spot demand from institutional and high-conviction buyers, reinforcing the broader corrective structure seen on price charts.
However, it is also important to note that in past cycles, Ethereum has consistently shifted into a bullish phase only after this indicator recovered and turned positive, signalling the return of strong spot demand. As long as the premium remains negative, downside risk and range continuation dominate, leaving the market in a bearish state.

SECRET PARTNERSHIP BONUS for CryptoPotato readers: Use this link to register and unlock $1,500 in exclusive BingX Exchange rewards (limited time offer).
Disclaimer: Information found on CryptoPotato is those of writers quoted. It does not represent the opinions of CryptoPotato on whether to buy, sell, or hold any investments. You are advised to conduct your own research before making any investment decisions. Use provided information at your own risk. See Disclaimer for more information.


Key takeaways
- Pi Network’s PI token holds steady at $0.1730, up 4.5% from the previous day.
- The Pi Core Team’s upgrade to enable smart contracts, with a deadline set for April 27, is a potential catalyst.
Pi Network’s PI token has managed to hold steady around $0.1770 as of Friday, adding a 4.5% gain from the previous day.
The Pi Core Team (PCT) is driving momentum with the impending upgrade to the mainnet, which will enable smart contract functionality—expected to be a key catalyst for price movement.
PI rallies ahead of the Protocol 22 upgrade
PI is up 4.5% in the last 24 hours, outperforming the broader cryptocurrency market. The rally comes after the Pi Core Team announced that April 27 is the final deadline for all mainnet nodes to complete necessary steps for remaining connected to the network, as part of the Stellar Protocol version 22 upgrade.
While this upgrade will cause a brief 15-minute downtime during internal data transfer, it lays the groundwork for future improvements. Additionally, the full upgrade to version 26 is slated for June 22, ahead of Pi2Day on June 28.
Will PI rally higher in the near term?
The PI/USD 4-hour chart is bearish and efficient, trading above the $0.1770 level. However, Pi Network remains in a bearish posture, with the token still trading below the 50-, 100-, and 200-day Exponential Moving Averages (EMAs).
The immediate resistance level is marked at $0.1785, corresponding to the 50-day EMA, followed by stronger resistance at $0.1865 (100-day EMA) and $0.2334 (200-day EMA).
However, momentum indicators present mixed signals. The Relative Strength Index (RSI) at 71 is above the neutral 50 line, and is heading into the overbought region.

The Moving Average Convergence Divergence (MACD) crossing above its signal line indicates growing bullish momentum.
On the downside, key support is found at $0.1556, near the February 23 low, with further weakness potentially exposing $0.1310 if the market slips below this level.
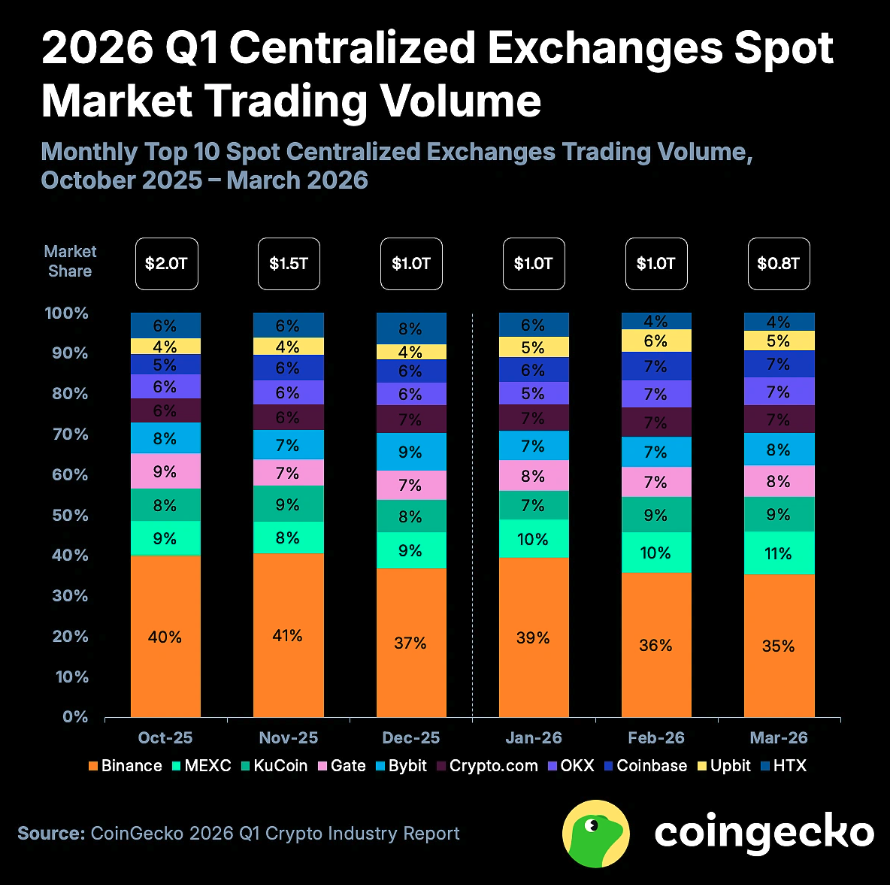
The cryptocurrency market has entered a “sustained crypto winter,” according to CoinGecko, as spot trading volumes on centralized crypto exchanges rapidly fell over the first quarter of 2026.
Crypto market capitalization fell by more than 20% during the first quarter as “bearish momentum from late 2025 collided with global geopolitical instability,” CoinGecko said in a report on Thursday.
That caused the top 10 centralized exchanges by spot volume to record a 39% decrease in trading volume over the quarter ended in March, dropping to $2.7 trillion from $4.5 trillion in the fourth quarter of 2025.
The drop comes as the crypto market has struggled to maintain positive momentum after Bitcoin (BTC) hit a record high of more than $126,000 six months ago, as the wider market reacted to fears of an economic slowdown and uncertainty over the fallout from US-Israeli strikes on Iran in February.

March was the “weakest month,” according to CoinGecko, with $800 billion in trading volume, the lowest since November 2023.
CoinGecko said that the contraction in crypto markets was worsened by Kevin Warsh’s nomination as US Federal Reserve chair, which signaled “a potential hawkish shift in US monetary policy.”
Related: Three things Bitcoin must do to hold highs above $76K: Analysts
It added that daily trading activity across the crypto market saw “a significant decline” over the first quarter, with average daily trading volumes at $117.8 billion, a drop of 27% compared to the fourth quarter of 2025.
All of the top 10 spot centralized exchanges recorded declining volumes in the first quarter, CoinGecko said, with HTX, formerly Huobi, seeing “the biggest slump” quarter-on-quarter as volumes dipped 55% to $133.6 billion.
It said that Bitcoin fell 22% over the first quarter, “continuing to underperform all assets, despite US equity indexes such as NASDAQ and S&P 500 falling -7.1% and -4.8% respectively, their worst quarterly returns since 2022.”
Big Questions: Should you sell your Bitcoin for nickels for a 43% profit?
Crypto World
Federal Authorities Transfer Bitcoin (BTC) From Bitfinex Hack to Coinbase Prime Custody

Key Takeaways
- Federal authorities transferred approximately $606,000 worth of Bitcoin (8 BTC) connected to the 2016 Bitfinex security breach to Coinbase Prime
- The cryptocurrency is associated with Ilya Lichtenstein, responsible for stealing 119,756 BTC from Bitfinex in 2016, valued at roughly $72M during the theft
- Legal statutes mandate the confiscated Bitcoin must be returned directly to Bitfinex rather than liquidated for government revenue
- Bitfinex has outlined plans to utilize recovered assets for redeeming Recovery Right Tokens and burning LEO tokens
- Federal wallets currently contain 328,361 BTC with an estimated value approaching $24 billion
Federal authorities executed a transfer of roughly $606,000 in Bitcoin to Coinbase Prime this past Thursday. On-chain records verified the movement of 8 BTC, with the assets directly traceable to cryptocurrency stolen during the 2016 Bitfinex security incident.
Blockchain intelligence provider Arkham detected and reported the transaction, establishing a connection between the coins and Ilya Lichtenstein, the individual responsible for orchestrating one of the digital currency industry’s first significant exchange compromises.
When government-held cryptocurrency moves to trading platforms, it typically sparks speculation about possible liquidation. However, this particular situation differs significantly—legal requirements explicitly mandate the coins be restored to Bitfinex rather than converted to cash.
This transaction represents the third such movement from government wallets, following similar transfers documented on March 3 and April 10, both relating to distinct cryptocurrency enforcement actions.
On August 2, 2016, Lichtenstein leveraged a security flaw in Bitfinex’s multi-signature wallet infrastructure. Through fraudulent authorization of more than 2,000 separate transactions, he successfully diverted 119,756 Bitcoin into a wallet under his exclusive control.
The stolen Bitcoin represented approximately $72 million in value when the breach occurred. With current market prices hovering around $74,000 per unit, that identical quantity now carries a valuation of roughly $8.9 billion.
Following the security breach, Lichtenstein collaborated with his spouse, Heather Morgan, in an extensive five-year operation attempting to obscure the funds’ origins. Their methods included utilizing cryptocurrency mixing services, darknet marketplace transactions, cross-chain transfers, and physical gold acquisitions.
During February 2022, FBI investigators successfully decrypted archived files within Lichtenstein’s cloud storage infrastructure. The breakthrough revealed a detailed spreadsheet cataloging more than 2,000 private cryptographic keys, providing law enforcement complete access to virtually all stolen assets. Officials ultimately seized approximately 94,636 Bitcoin, representing $3.6 billion at that time.
Disposition of Recovered Cryptocurrency Assets
Early in 2025, federal judicial proceedings established definitively that confiscated coins require in-kind restoration to Bitfinex. Government agencies lack authorization to liquidate the cryptocurrency and redirect revenues to federal coffers.
Bitfinex has publicly outlined its strategy for handling returned assets. The platform commits to completely redeeming all outstanding Recovery Right Tokens, which represent digital instruments issued to account holders who sustained losses during the breach.
No less than 80% of any surplus net proceeds will fund the repurchase and permanent removal of its UNUS SED LEO token from circulation, adhering to previously established whitepaper obligations.
Lichtenstein received a five-year federal prison sentence in November 2024. Morgan was assigned 18 months.
Federal Cryptocurrency Portfolio Overview
Lichtenstein secured release in January 2026 through provisions of the First Step Act. He publicly expressed gratitude to President Donald Trump via X platform following his release.
Federal authorities presently maintain custody of 328,361 Bitcoin distributed across various government wallets, representing approximately $24 billion in current valuation. Additional holdings include roughly $146 million in Ethereum alongside diverse alternative cryptocurrencies.
Government officials announced previously that confiscated Bitcoin reserves would contribute toward establishing a national strategic Bitcoin reserve program.

A Texas man found guilty of helping orchestrate a cryptocurrency scam project that defrauded $20 million from nearly 1,000 investors has been sentenced to 23 years behind bars by a US judge on Tuesday.
US District Judge LaShonda Hunt sentenced Robert Dunlap, who served as a trustee of the project that sold the fictional token Meta-1 Coin, to prison and ordered him to pay restitution to victims of the fraud, according to the Illinois US Attorney’s office.
Assistant US attorneys Jared Hasten and Paige Nutini said in the government’s sentencing memorandum that Dunlap was “unrepentant” and that his lies grew “over the years.”
“Would-be criminals planning to engage in similar conduct need to know that such actions will be met with a serious repercussion that includes loss of one’s liberty for an extended period of time,” they added.

Regulators and authorities are turning up the heat on crypto scammers. In March, a man accused of hacking defunct DeFi platform Uranium Finance was charged with one count of computer fraud and one count of money laundering.
Token backed by $44 billion in gold, rare artworks
A federal jury in the Northern District of Illinois convicted Dunlap in November on two counts of mail fraud, each carrying a possible sentence of up to 20 years in federal prison.
He was accused of conspiring with others to market and sell Meta-1 Coin through a Meta-1 Coin Trust from 2018 to 2023, making false and misleading statements to investors, including that the token was backed by a $1 billion art collection made up of works by Pablo Picasso and Vincent van Gogh and $44 billion in gold.
Related: There’s more to crypto crime than meets the eye: What you need to know
Dunlap and his co-conspirators used automated trading bots to artificially inflate the market price and trading volume of the Meta-1 Coin on the Meta Exchange, a website Dunlap created, according to authorities.
In March 2020, the US Securities and Exchange Commission (SEC) ordered an asset freeze and other emergency relief orders to stop Dunlap, another alleged accomplice, Nicole Bowdler and former Washington state Senator David Schmidt from marketing and selling Meta-1 Coin.
The defendants allegedly told investors that Meta-1 Coin was risk-free and could offer returns of up to 224,923%. Instead, the coins were never distributed and the funds were used to cover personal expenses and buy luxury cars, including a Ferrari, according to the SEC.
Magazine: Forget stablecoin yield, how does the CLARITY Act treat DeFi?
Crypto World
Bitcoin (BTC) Surges Past $76K as Ceasefire Optimism Fuels Rally and Short Squeeze Potential

Key Takeaways
- Bitcoin surged to approximately $76,000 this week, marking its strongest performance in several months, propelled by diplomatic progress between the United States and Iran.
- President Trump’s announcement of a 10-day Israel-Lebanon truce provided additional momentum, briefly pushing BTC toward the $75,000 threshold.
- Technical analysts emphasize that a decisive weekly close above $76,000 is essential to validate a genuine trend reversal, with subsequent price objectives ranging from $84,000 to $96,000.
- Perpetual funding rates for Bitcoin have plunged into deeply negative territory, indicating heavy short positioning that could catalyze a violent short squeeze.
- Spot Bitcoin exchange-traded funds recorded $451 million in net inflows on Tuesday, though market watchers stress the need for sustained daily flows to maintain upward momentum.
Bitcoin has emerged as one of the most closely monitored assets over the past several days, reaching a multi-month peak near $76,000 before moderating to approximately $74,700 by Friday morning Asian trading hours. The upward movement reflects a combination of easing geopolitical tensions and renewed appetite from institutional capital.
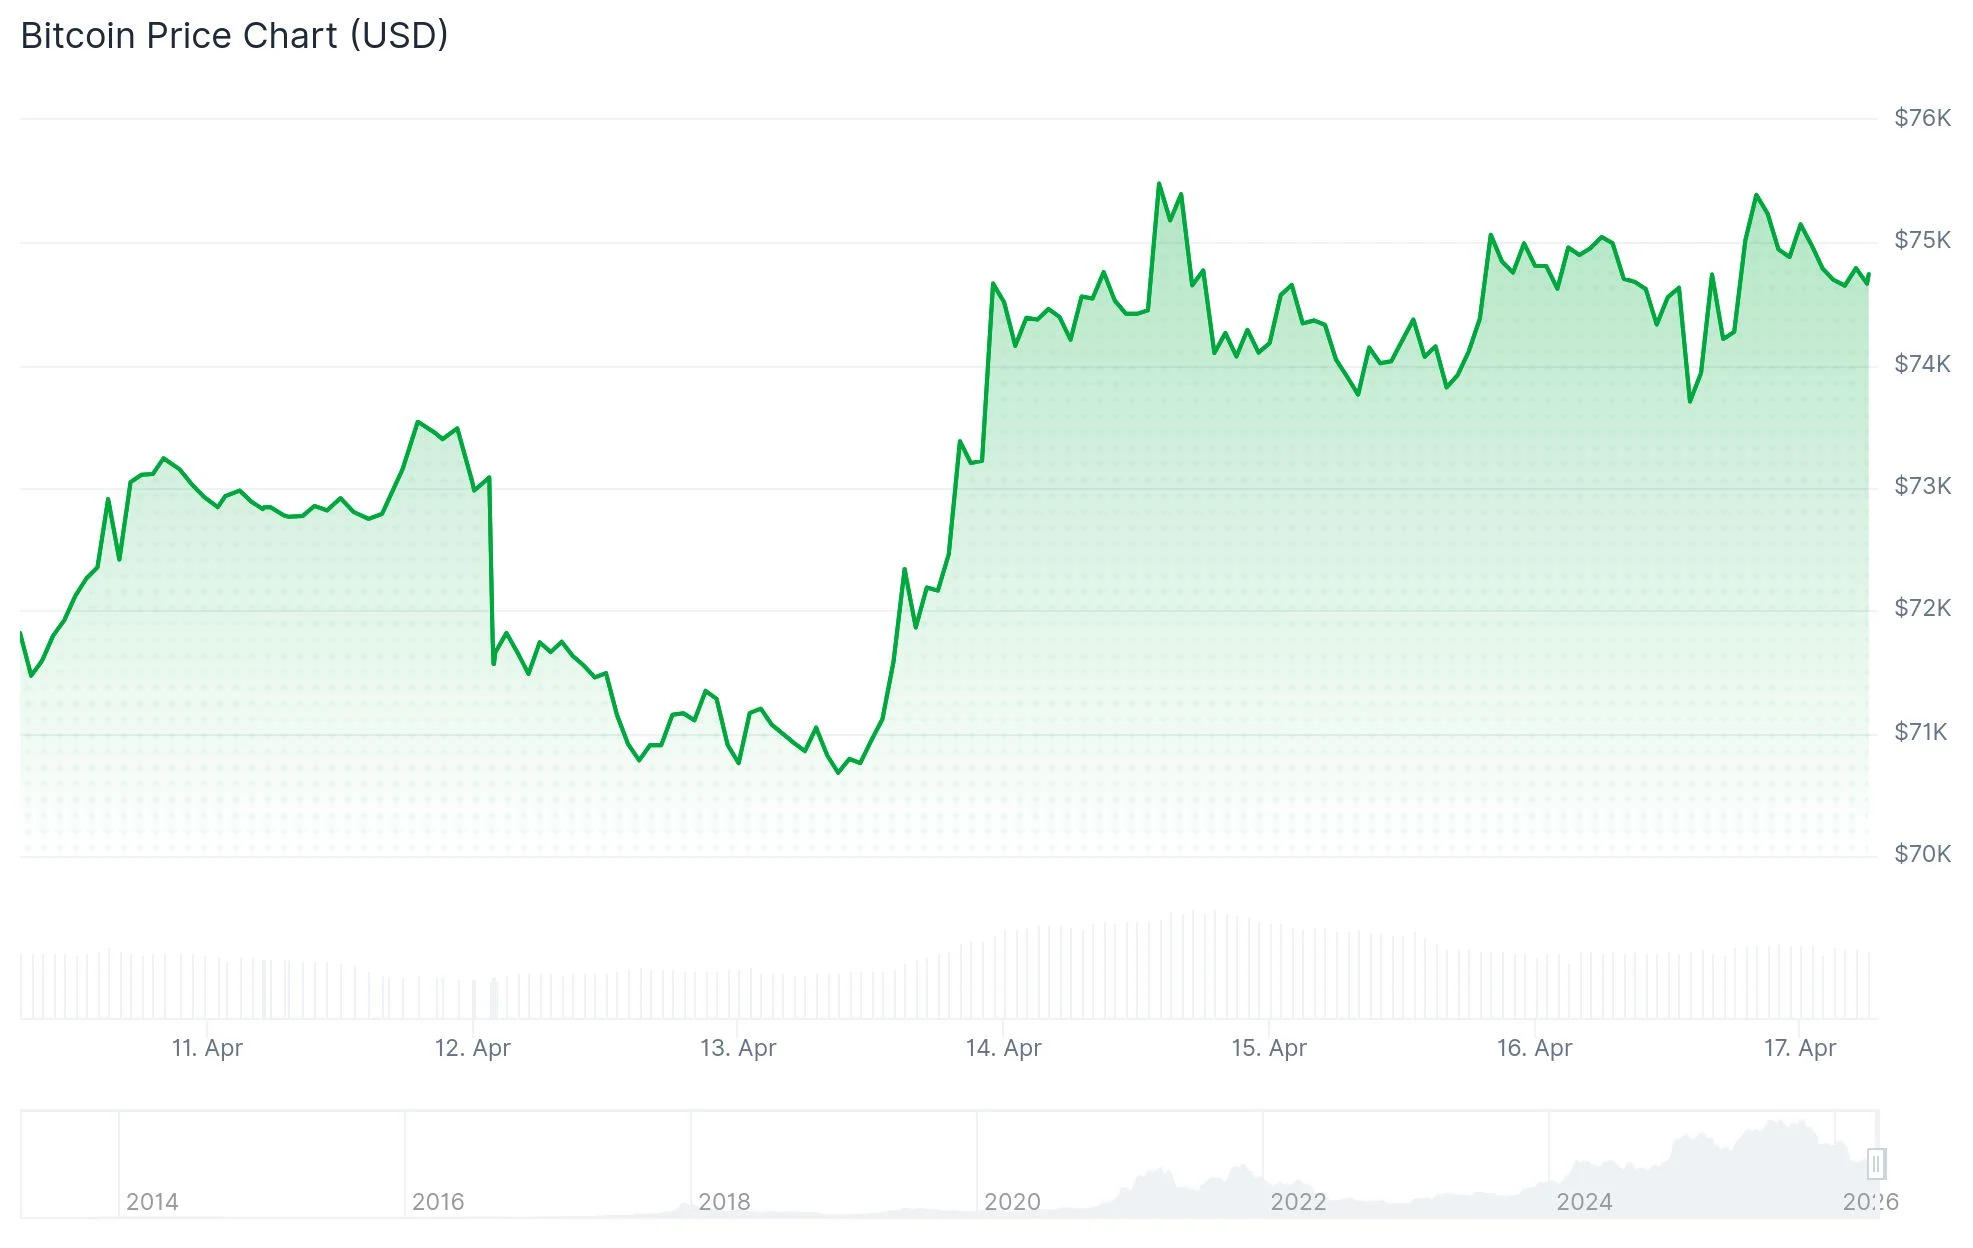
The principal driver behind this rally has been growing confidence surrounding the U.S.-Iran ceasefire agreement, which has influenced pricing across various risk-sensitive assets. An additional 10-day cessation of hostilities between Israel and Lebanon, unveiled by President Trump, further bolstered market sentiment. Bitcoin’s price advanced from an intraday bottom near $73,000 to peak at $74,800 in the immediate aftermath of Trump’s statement.
According to Polymarket prediction market data, traders are assigning an 87% likelihood that the U.S.-Iran ceasefire will be prolonged beyond its April 21 deadline. Pakistani officials quoted by Al Jazeera referenced a “major breakthrough” in discussions concerning Iran’s nuclear ambitions, which had represented the primary obstacle during initial negotiation rounds.
Global equity markets participated in the rally, with the MSCI All Country World Index recording a fresh all-time high on Thursday. The S&P 500 similarly achieved a historic peak. This broad risk-on environment provided tailwind support to cryptocurrency markets, with Ether posting weekly gains of 6%, XRP advancing 6.4%, and Dogecoin climbing 5.6%.
Critical Levels According to Market Experts
Analyst Crypto Patel identified “$76K as the level that decides everything,” noting that a higher-timeframe candle close beyond this zone would clear the path toward the $84,000–$96,000 price range. Glassnode data reveals that over 2 million BTC were accumulated within that zone throughout the previous six months.
Trading analytics platform Material Indicators highlighted several layers of technical resistance, including the yearly opening price at $87,500 and the 50-week moving average positioned at $97,000. Analyst Rekt Capital emphasized that BTC requires a weekly close above $72,800 simply to “confirm a breakout.”
The bull score index, a composite measure of overall Bitcoin market strength, climbed to 40 on April 15—its most elevated reading since late October 2025. CryptoQuant analyst Arab Chain observed that the index remains within neutral territory and must breach the 60 threshold to indicate robust bullish conditions.
Extreme Short Positioning Creates Squeeze Scenario
Bitcoin perpetual funding rates have collapsed into deeply negative territory during recent trading sessions, touching levels not observed since 2023. Negative funding rates indicate that short position holders are compensating long position holders—a clear signal of heavy bearish positioning.
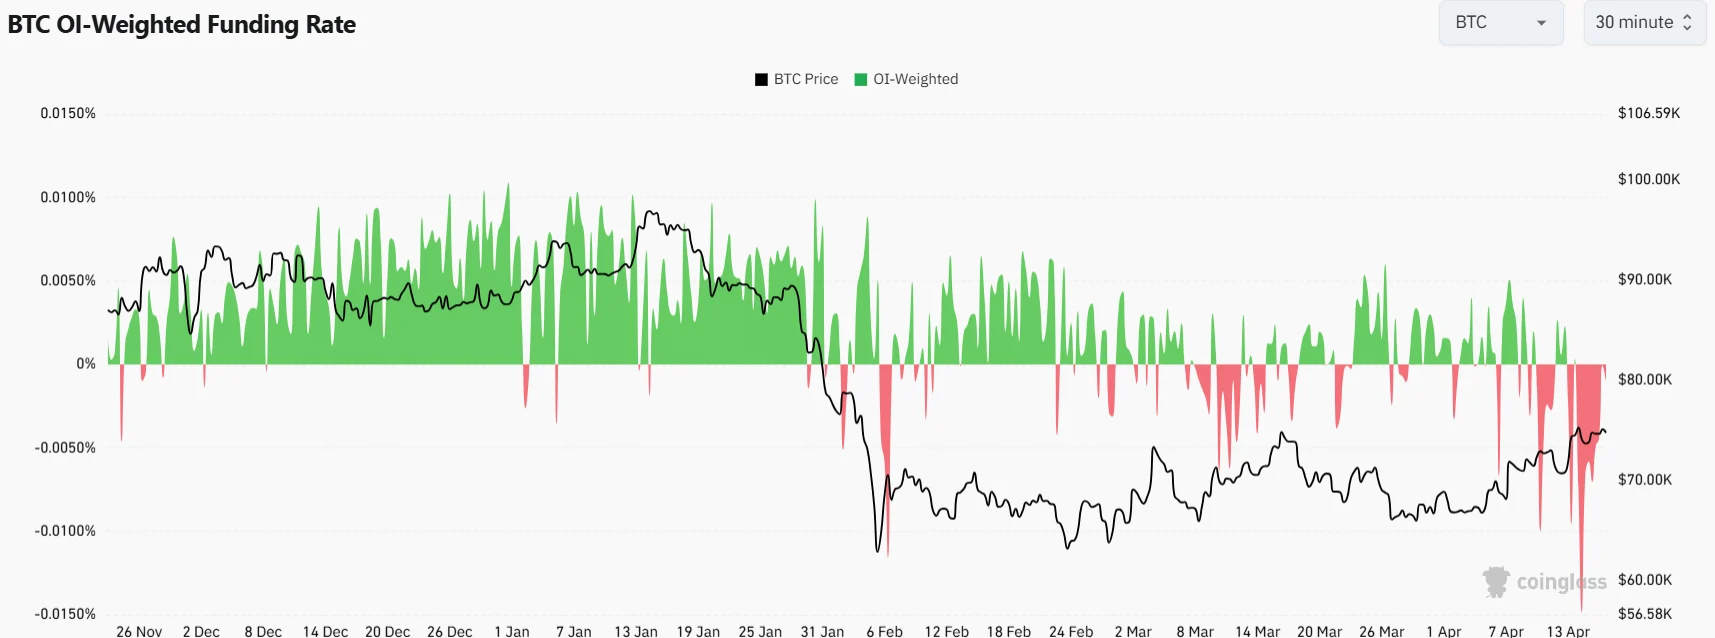
Daniel Reis-Faria, CEO of ZeroStack, explained to CoinDesk: “Funding rates this negative tell you the market is heavily short. If Bitcoin continues to move higher despite that, a lot of those positions could get liquidated, and the move can accelerate quickly.” Reis-Faria projected that BTC could climb to $125,000 within the next 30 to 60 days if short positions face forced liquidation.
On-chain analyst CryptoVizArt presented an alternative perspective, observing that Bitcoin’s “True Market Mean” indicates the average active holder is currently holding unrealized losses. Historically, prolonged periods trading beneath this metric have aligned with Bitcoin’s most severe downturns.
Spot Bitcoin ETF activity shows mixed signals, with Tuesday’s trading session producing $451 million in net inflows. Bitcoin’s daily transaction volume recently touched 17-month peaks.


Hyperbridge has revised losses from its April 13 exploit to roughly $2.5 million. That is about 10 times the original estimate of $237,000.
The team disclosed the new figure in a post-incident update on April 16. The revision adds losses from associated incentive pools. It also reflects forensic work across four EVM chains.
What the Revised Figure Includes
According to initial reports, an attacker minted 1 billion bridged DOT tokens and liquidated the entire amount in a single transaction, generating 108.2 ETH (roughly $237,000).
However, the team noted that the figure did not reflect the complete situation.
“Following reconciliation of attacker activity across each of the four chains, the two-phase nature of the attack, and losses from the associated incentive pools, the revised total realized loss is approximately $2.5 million, denominated in ETH and DOT at the time of the exploit,” the blog read.
Follow us on X to get the latest news as it happens
The analysis also clarified the sequence of events leading to the breach. What looked like a single exploit was in fact two linked events about an hour apart.
The attacker initially extracted approximately 245 ETH from the Token Gateway contract. Roughly an hour later, they carried out unauthorized minting of nearly 1 billion bridged DOT tokens.
These were subsequently offloaded into available liquidity across decentralized exchanges.
“On April 13, 2026, an attacker exploited a vulnerability in the Merkle Mountain Range (MMR) proof verification logic, allowing the culprit to mint assets and drain escrowed assets on Token Gateway. This affected DOT token pools on connected EVM networks: Ethereum, Base, BNB Chain, and Arbitrum,” the team explained.
The team emphasized that the exploit remains contained within the Token Gateway and the impacted bridged token contracts on the EVM networks.
Hyperbridge Recovery Path and Compensation
The blog revealed that a significant portion of stolen funds has been traced to Binance. Hyperbridge said it is working with the exchange’s compliance team and law enforcement on asset freezes. The team cautioned that meaningful recovery could take months to a year.
If recovery falls short, affected users will be made whole in BRIDGE tokens, the native asset of the Hyperbridge network. The compensation mechanism and disbursement schedule will be shared on April 13, 2027, exactly one year after the exploit.
“Pursuing recovery first, before any token-based compensation, is in service of affected users. Issuing token compensation prematurely, before on-chain tracing, exchange compliance processes, and law enforcement coordination have been given the time they need to produce results, would dilute the very asset we are committing to affected users and reduce the real value they ultimately receive,” Hyperbridge mentioned.
The team added that the Token Gateway remains paused and will not resume operations until the vulnerability is fully patched, the fix has undergone an independent audit with the report made public, and additional safeguards are implemented and operational. The coming months will test whether Hyperbridge can recover a meaningful share of the stolen funds.
The post Hyperbridge Confirms Bridged Polkadot Exploit Was 10x Worse Than First Reported appeared first on BeInCrypto.
TLDR:
- Public miners sold over 32,000 BTC in Q1 2026, breaking the previous record set during the 2022 Terra-Luna collapse..
- Hashprice sits near $33/PH/s/day, below the ~$35 breakeven, leaving roughly 20% of miners operating at a loss.
- American Bitcoin holds 7,000+ BTC with $25/PH/s production costs, choosing accumulation over selling amid the downturn.
- New West Data pays under $0.02/kWh using flared gas power, keeping older mining hardware profitable at current hashprice levels.
Public bitcoin miners have unloaded over 32,000 BTC in Q1 2026, setting a new quarterly record. This figure already surpasses total net sales for all of 2025.
Major operators including MARA, CleanSpark, Riot, Cango, Core Scientific, and Bitdeer contributed to the tally. Hashprice currently sits around $33 per PH/s per day, below the estimated $35 breakeven.
Roughly 20% of miners are now operating at a loss amid rising network difficulty and reduced block rewards.
Record Liquidations Reflect Deepening Mining Pressures
The Q1 2026 sell-off exceeds even the roughly 20,000 BTC liquidated during Q2 2022. That quarter saw market turmoil triggered by the Terra-Luna collapse.
The scale of current selling marks a sharp reversal from just over a year ago. Miners ended 2024 with a net addition of 17,593 BTC, pushing combined reserves above 100,000 BTC.
Network difficulty today stands approximately ten times higher than it did in 2021. Block rewards were also cut in half following the 2024 halving event.
Bitcoin’s price remains above its previous cycle peak despite retreating from all-time highs above $120,000. Even so, compressed margins are forcing many operators to liquidate holdings to fund daily operations.
For many miners, selling bitcoin remains the fastest way to shore up balance sheets. Meeting debt obligations in a selective financing environment has become a pressing priority.
Hashprice hovering near all-time lows leaves little room for operators with older, less efficient fleets. Those paying higher electricity costs face the sharpest margin compression.
Total BTC holdings across miners have slipped from roughly 1.86 million in 2023 to around 1.8 million today. The trend points to sustained selling pressure rather than a one-time event.
Aggressive hashrate expansion following China’s 2021 mining ban laid the groundwork for today’s difficult economics. The industry is now absorbing the consequences of that rapid, unchecked growth.
Diverging Strategies Emerge Across the Mining Sector
Not all miners are responding to the downturn by selling. American Bitcoin, the proprietary mining arm of Hut 8, has been actively accumulating.
The company held more than 7,000 BTC as of early April, up from zero a year earlier. Its all-in cash production cost was around $55,000 per bitcoin in Q4 2025, or roughly $25 per PH/s.
Meanwhile, operators with ultra-low power costs maintain a structural edge. New West Data, a Canadian firm mining with flared natural gas, pays below $0.02 per kilowatt-hour for power.
That cost level keeps even older hardware profitable at current hashprice levels. The company tripled its compute capacity in 2025 and plans to do so again this year.
Software optimization is also gaining traction as an alternative to hardware upgrades. Luxor recently launched Commander, a fleet management tool that adjusts power settings every five minutes.
The platform reportedly delivers 8% to 14% profitability gains over traditional curtailment methods. It currently manages about 5 EH/s of customer hashrate since its recent launch.
The broader industry is no longer operating as a uniform block. Power economics, balance sheet strength, and operational sophistication now separate survivors from those under strain.
What was once a scale-driven business is fragmenting into distinct strategic camps. That divergence is likely to grow more pronounced as hashprice pressure continues through 2026.

Police in Zanzibar are reportedly holding Joe McCann, the founder of crypto hedge fund Asymmetric, for questioning after the death of his fiancée, Ashly Robinson, during a vacation in the archipelago. Robinson, 31, died in hospital on April 9, after staff at a Zanzibar hotel found the couple the day before, according to a statement cited by NBC News.
Authorities have ruled the death a suicide but continue to question McCann. CBS News reported that police are holding McCann’s passport until autopsy results are complete. Hotel staff told investigators the pair had a “misunderstanding” and had been separated, with McCann moved to a different room.
Robinson’s family has disputed that account. Her sister, Alyssa Endres, told NBC News that “none of this makes sense” and that Robinson had been in good spirits after celebrating her birthday and engagement to McCann, which occurred only days before her death.
McCann is the founder of Asymmetric, a crypto venture and hedge fund that has weathered a volatile market cycle. The firm pivoted its trading strategy in July after investor backlash stemming from underperformance amid broad crypto market volatility. A plan for McCann to lead a Solana-based treasury company public in a merger was reportedly called off in August for unknown reasons. The report also notes that McCann had indicated his fund had lost about 80% so far that year. McCann could not be reached for comment.
Key takeaways
- Authorities in Zanzibar say the death of Ashly Robinson, 31, has been ruled a suicide, but Joe McCann remains in custody for questioning as investigations proceed.
- McCann’s passport has been held by police pending autopsy results, while hotel staff described a separation between the couple following a reported misunderstanding.
- Robinson’s family disputes the official account, with relatives saying the narrative doesn’t fit their understanding of her state of mind before the death.
- Asymmetric, McCann’s crypto venture, has faced performance challenges and strategic shifts, including a July pivot after investor backlash and a previously announced but scrapped merger involving a Solana treasury vehicle.
- Readers should monitor autopsy results, official statements from Tanzanian authorities, and any response from Asymmetric as the case unfolds.
Investigation and official statements
The sequence of events, as publicly described, centers on a hotel incident in which Robinson was found unresponsive and later died in hospital. Tanzanian police cited by NBC News said the death was ruled a suicide, but the investigation persists and McCann is being questioned. CBS News reported that authorities have retained McCann’s passport until autopsy results are finalized, a routine step in some investigations to ensure cooperation and to verify timelines.
Hotel staff reportedly told investigators that the couple had a misunderstanding and had been separated at one point, with McCann moved to a different room. This detail, while publicly acknowledged, remains part of a broader inquiry that is still awaiting a formal autopsy outcome and other corrobations. As with many such cases, the evolving narrative will depend on official findings and how they align with testimony from those involved.
Asymmetric and the founder’s trajectory
McCann’s role as founder of Asymmetric places the case in a broader context of crypto market activity and the pressures on fund management in a highly volatile era. Asymmetric has publicly navigated a choppy cycle, including a strategic pivot in July after investor backlash over underperformance in a year marked by sharp price swings across digital assets. The pivot, described in retrospective coverage, signaled a shift in trading approach amid ongoing volatility.
The firm’s public narrative also touched on a potential merger involving a Solana-based treasury vehicle that would have seen McCann in a leading role. Reports indicate that this merger plan was called off in August for reasons not disclosed publicly. The timing followed earlier disclosures by McCann that the fund had experienced significant losses—reported at around 80% for the year up to that point—underscoring the stressors that can accompany active crypto trading and venture strategies in unsettled markets.
While these milestones help frame McCann’s professional backdrop, they also illuminate the tensions between visibility and risk in high-profile crypto ventures. For investors, traders, and users following the space, the episode reinforces how personal events surrounding founders can intersect with firm-level risk—and how regulatory and due-diligence considerations can intersect with reputational factors in fund management.
Family perspective and unanswered questions
Beyond the police timeline and corporate background, family members have challenged the official account of events. Robinson’s sister, Alyssa Endres, told NBC News that “none of this makes sense” and emphasized that her sister had celebrated milestones in the days leading up to her death, including her birthday and engagement to McCann. The disparity between the family’s understanding and the authorities’ narrative highlights a wider quest for clarity as autopsy results and investigative conclusions emerge.
The case sits at the intersection of personal tragedy and a highly scrutinized industry. Crypto markets, regulatory scrutiny, and high-profile fund managers have all faced intense public attention in recent years, and incidents like this amplify the challenge of maintaining public trust when the personal and professional lines blur. As investigators work to piece together timelines and corroborate details, the crypto community will be watching for any new statements from Tanzanian authorities, as well as responses from Asymmetric and McCann’s representatives.
In the meantime, the broader market will be tracking how this developing story affects perceptions of crypto investment firms operating in frontier jurisdictions and how such cases might influence governance, due-diligence standards, and risk management practices among hedge funds and family offices active in digital assets.
As the case evolves, the key questions remain: what will autopsy findings reveal, what additional testimony will emerge from the investigation, and how will Asymmetric address concerns raised by investors and counterparties in light of these events?
Readers should stay tuned to official updates from Tanzanian authorities and credible media outlets for new information as autopsy results are released and the investigation progresses. The coming days and weeks will likely determine not only the outcome of the case but also the broader narrative around founder-centered risk in crypto ventures.
At least 12 DeFi protocols and crypto businesses have been attacked in just over two weeks since the $280 million Drift Protocol exploit on April 1.
Attacks aimed at crypto protocols or companies since the start of April include CoW Swap, Hyperbridge, Bybit, Dango, Silo Finance, BSC TMM, Aethir, MONA, Zerion and, most recently, Rhea Finance and the Grinex exchange.
The Drift Protocol was hit with one of the largest exploits this year on April 1, losing around $280 million in a long-running social engineering attack suspected to involve North Korean-affiliated actors.
The attacks also come amid growing concerns this month that advancing AI models, such as Anthropic’s Claude Mythos and equivalent models, could eventually make it even easier for cyberattackers in the future.
Rhea Finance exploited for $7.6 million
DeFi protocol Rhea Finance reported on Thursday that an attacker “leveraged a vulnerability in Rhea’s Margin Trading feature to execute a coordinated pool manipulation attack,” impacting the Rhea Lend smart contract.

Around $7.6 million was extracted, according to blockchain security firm CertiK.
“The attacker created fake token contracts and added liquidity in fresh pools, likely misleading the oracle and validation layer,” it explained.
Meanwhile, the Russia-linked Grinex exchange suspended operations after a $13.7 million hack on Thursday, blaming “unfriendly states” for the incursion.
Related: Stablecoin issuer Circle faces lawsuit over $280M Drift Protocol hack
Another attack this month was aimed at the Binance Smart Chain TMM/USDT liquidity pool, which suffered a reserve manipulation attack, resulting in the loss of around $1.67 million in early April, R3ACH Network analyst Jussy said on Thursday.
It followed just days after bridge aggregator Dango lost $410,000 from a smart contract bug on April 13.
In the same month, lending protocol Silo Finance lost $392,000 on April 3 from a misconfigured oracle exploit and decentralized GPU cloud computing platform Aethir lost $423,000 in an access control exploit on April 9.
DPRK ups AI social engineering attacks
The Drift Protocol and Zerion wallet exploits were two examples of Democratic People’s Republic of Korea-affiliated groups using AI and social engineering to infiltrate crypto companies to steal credentials and funds.
Malicious actors pilfered over $168.6 million in cryptocurrency from 34 DeFi protocols in the first quarter of 2026, according to data from DefiLlama.
Magazine: Forget stablecoin yield, how does the CLARITY Act treat DeFi?


South Korea is moving toward a more transparent public ledger by testing tokenized deposits for day-to-day government spending in a new regulatory sandbox trial.
Summary
- South Korea will launch a blockchain-based pilot in Sejong City to handle daily government operational spending through tokenized deposits.
- The Ministry of Economy and Finance plans to replace traditional government credit cards with programmable digital payments that feature predefined limits on timing and usage categories.
- The initiative targets a full rollout by the final quarter of 2026 and forms part of a strategy to digitize one-quarter of all treasury fund executions by 2030.
According to the Ministry of Economy and Finance (MOEF), the government has selected a pilot project that uses blockchain-based deposits to handle operational expenses, with a full rollout scheduled for the fourth quarter of 2026.
This initiative will initially launch in Sejong City, replacing the current system where officials use government-issued credit and debit cards for official business.
Unlike traditional payments that rely on post-use reporting to catch errors, this digital framework allows authorities to pre-set spending conditions, such as specific time windows and permitted categories, to ensure funds are used exactly as intended.
These tokenized deposits act as digital versions of standard bank deposits held on a distributed ledger. Because they remain liabilities of participating commercial banks and operate within existing financial systems, they offer more stability than private stablecoins.
The MOEF confirmed that nine major banks—including KB Kookmin, Shinhan, Woori, and Hana—are participating in the experiment to issue and manage these tokens. This infrastructure effectively links the government’s Digital Budget and Accounting System (dBrain) with the blockchain, creating a traceable path for every won spent.
By moving beyond one-off subsidies and into recurring operational costs, the ministry expects to see a significant reduction in the misuse of public funds and a decrease in settlement times.
The sandbox environment provides a legal carve-out for this trial, as current regulations typically mandate that such expenses be processed through specific physical cards.
Moving to a programmable system allows for a level of oversight that traditional banking cannot match, potentially lowering transaction fees for small businesses receiving government payments by removing traditional card network intermediaries.
“The trial will serve as a basis for evaluating new payment and settlement methods, with potential implications for fiscal operations if the model proves viable,” the ministry stated.
Integrating distributed ledger technology (DLT) aligns with a long-term strategy to digitize South Korea’s treasury. The MOEF previously disclosed a target to convert 25% of all treasury fund executions to digital currency by 2030.
Success in Sejong City will likely lead to legislative updates intended to scale this model across all branches of the national government.
The initiative builds on a previous project launched in March involving the Environment Ministry and the Bank of Korea, which utilized tokenized deposits to manage 30 billion won in subsidies for electric vehicle charging stations.

WWE Hall of Fame 2026: UK start time, where to watch and who are the inductees

Nancy Guthrie Health Fears Intensify as DNA Analysis Advances in Kidnapping Case

PI steadies at $0.1770 amid core team’s mainnet upgrade plans

Why Israel is blocking foreign journalists from entering

Bitcoin: We’re Entering The Most Dangerous Phase

Alan Cumming Brands Baftas Ceremony A ‘Triggering S**tshow’

Live Gold, Crypto Trading | 16 April | #goldtrading #cryptotrading #bitcoin – MANSI

XRP – It’s Falling Apart?! Coinbase CEO Just Shocked Everyone! Clarity Act Confirmed?!

Money vs age… #lifelessons #timeismoney #lifetruth #funnydrama
-

 Politics7 days ago
US brings back mandatory military draft registration
-
 Sports7 days ago
Man United discover Nico Schlotterbeck transfer fee as defender reaches Dortmund agreement
-

 Fashion7 days ago
Weekend Open Thread: Veronica Beard
-

 Politics5 days ago
World Cup exit makes Italy enter crisis mode
-

 Business6 days ago
Tesla Model Y Tops China Auto Sales in March 2026 With 39,827 Registrations, Beating Cheaper EVs and Gas Cars
-

 Crypto World4 days ago
The SEC Conditionalises DeFi Platforms to Be Avoided for Broker Registration
-

 Crypto World3 days ago
SEC Signals Exemption for Crypto Interfaces From Broker Registration
-

 News Videos2 days ago
Secure crypto trading starts with an FIU-registered
-
 NewsBeat4 days ago
Pep Guardiola and Gary Neville agree over Arsenal title problem that benefits Man City
-

 Business6 days ago
Ireland Fuel Protests Enter Day 5 as Blockades Spark Shortages and Government Prepares Support Package
-

 Business7 days ago
OpenAI Halts Stargate UK Data Centre Project Over Energy Costs and Copyright Row
-

 Crypto World6 days ago
Federal judge blocks Arizona from bringing criminal charges against Kalshi
-

 NewsBeat3 days ago
Trump and Pope Leo: Behind their disagreement over Iran war
-

 Crypto World3 days ago
SEC Proposes Certain Crypto Interfaces Don’t Need to Register as Brokers
-
 NewsBeat5 days ago
JD Vance announces ‘no agreement’ with Iran over nuclear weapons fear
-

 Business6 days ago
IMF retains floor for precautionary balances at SDR 20 billion
-

 Business6 days ago
Former Liverpool CEO eviscerates FIFA for World Cup ticket pricing
-
Crypto World4 days ago
Sei Network Enters Quiet Reset Phase as On-Chain Metrics Signal a Slowdown in 2026
-
Business6 days ago
Coreweave CSO Venturo sells $5.5m in class a common stock
-
Sports6 days ago
1st-Round WR Enters Vikings Mock Draft Orbit
You must be logged in to post a comment Login