
Crypto World
Big Tech’s AI Spending Eclipses Global Oil and Gas Production Investment


Spending by major tech firms on artificial intelligence (AI) infrastructure has surpassed investment in oil and natural gas production.
The shift comes as these companies drive an unprecedented surge in data centre funding in 2025, according to the International Energy Agency.
AI Becomes a Bigger Capital Story Than Oil and Gas
Combined capital expenditure of five tech firms topped $400 billion last year. Moreover, the IEA estimates that this could climb another 75% in 2026, signaling that AI infrastructure has become a dominant force in global capital flows.
Follow us on X to get the latest news as it happens
On the demand side, the expansion appears equally strong. Major AI model providers reported a 3x increase in active users and a 5x surge in revenue over the past year, metrics that help explain the investor positioning around the sector.
However, the scale of investment is beginning to outpace what companies can fund internally. Data centre development has grown too capital-intensive to rely solely on corporate balance sheets, making external financing from capital markets increasingly essential.
Debt markets are already reflecting this shift. AI-related debt has climbed to $1.4 trillion, making it the largest segment within US investment-grade credit markets.
Nonetheless, this reliance means that the pace of data centre expansion and the corresponding rise in energy consumption are expected to remain highly sensitive to market sentiment.
Investor expectations around returns on AI infrastructure, alongside broader macroeconomic and financing conditions, will likely determine how quickly the sector continues to scale.
“Understanding the energy implications of AI therefore, also means following closely the technology’s economic trajectory,” the IEA added.
The influence of AI is also becoming more pronounced in equities. BeInCrypto recently reported that AI-linked companies now account for a record 45% of the S&P 500’s total market capitalization.
Together, the capex surge, debt market footprint, and equity concentration suggest AI has become not just a technology story but a defining force in global capital allocation.
Subscribe to our YouTube channel to watch leaders and journalists provide expert insights
The post Big Tech’s AI Spending Eclipses Global Oil and Gas Production Investment appeared first on BeInCrypto.

The crypto market has staged a recovery following the US–Israeli strikes on Iran. While the market remains below its early 2026 highs, total capitalization has rebounded by over 14% since February 28.
Amid this recovery, three data points show investors are stepping back into crypto markets after months of risk-off positioning.
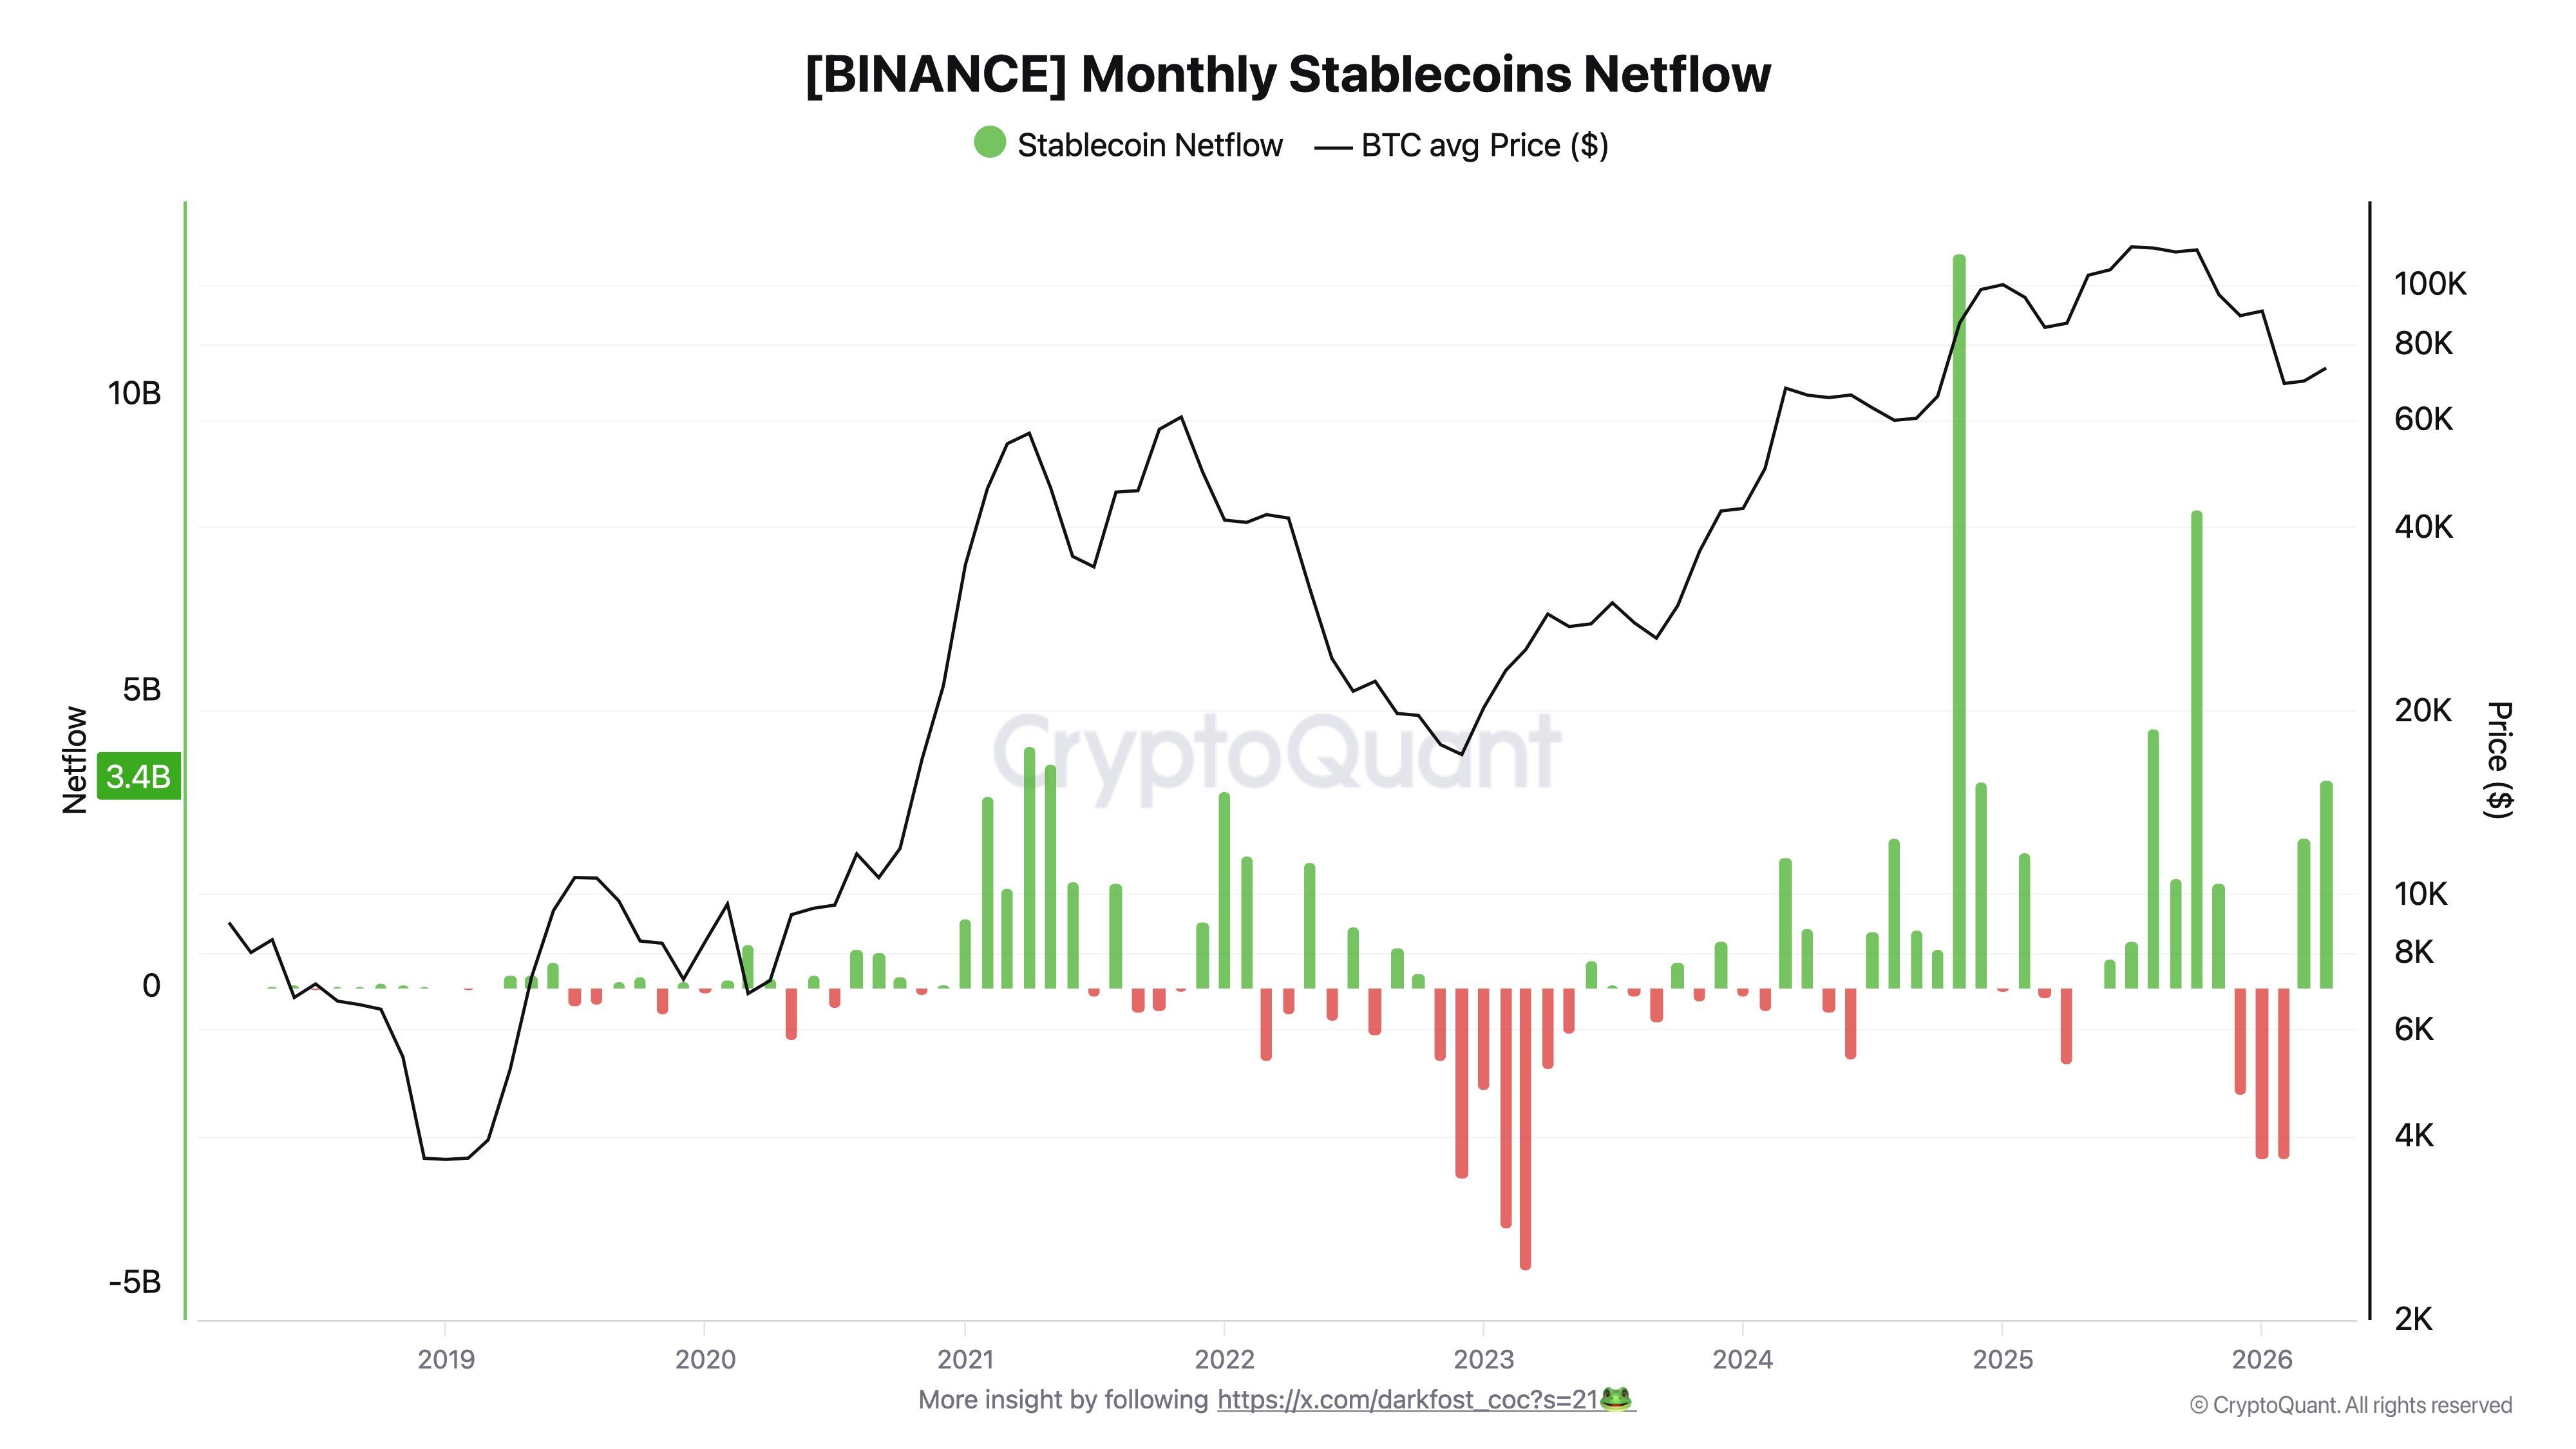
Binance Stablecoin Reserves Swell by $6 Billion
In a post on X, on-chain analyst Darkfost flagged nearly $6 billion in net stablecoin inflows to Binance across March and April. The figure marks a clear directional shift.
April alone accounted for roughly $3.5 billion of that total. In contrast, the prior period had recorded approximately $7.6 billion in net outflows from the same exchange.
Stablecoin inflows are often interpreted as “dry powder.” They represent capital that has already entered the crypto ecosystem but has not yet been deployed into assets such as Bitcoin (BTC) or Ethereum (ETH).
“When inflows exceed outflows on a major exchange, it suggests that part of the market is beginning to reposition in order to participate in the gradual recovery that has been underway for nearly two months,” the analyst said.
Follow us on X to get the latest news as it happens
While stablecoin inflows can precede rallies, not all translate into immediate purchases, as investor sentiment, market conditions, and risk appetite ultimately determine whether this capital is deployed or remains sidelined
Sentiment and Institutional Demand Reinforce the Signal
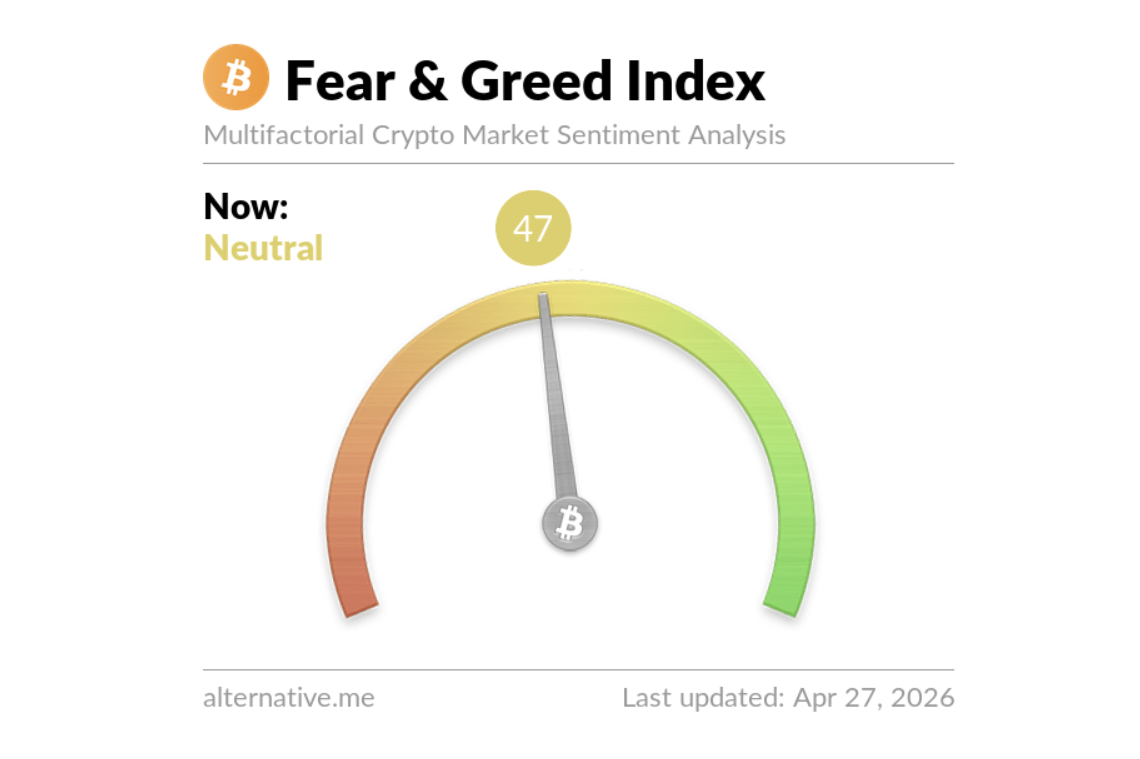
Notably, the Crypto Fear and Greed Index has climbed to 47, marking a shift into neutral territory after languishing at 12 just a month ago. The sharp improvement highlights a steady recovery in market sentiment, moving away from extreme fear toward a more balanced outlook.
At the same time, institutional capital appears to be returning. Spot crypto exchange-traded funds recorded their strongest weekly inflows since mid-January in the week ending April 17, reinforcing signs of renewed confidence among large investors.
The positive trend has extended across major assets: Bitcoin ETFs have posted four consecutive weeks of inflows in April, followed by three-week inflow streaks for Ethereum, XRP, and Chainlink, while Solana ETFs have recorded two straight weeks of net inflows.
Taken together, rising stablecoin reserves, improving sentiment, and sustained ETF inflows suggest a measured return of capital to crypto markets. While conditions point to rebuilding confidence, the recovery remains tentative, with broader macro trends and investor conviction likely to determine whether this momentum translates into a sustained uptrend.
Subscribe to our YouTube channel to watch leaders and journalists provide expert insights
The post 3 Signs Smart Money Is Repositioning in Crypto Right Now appeared first on BeInCrypto.
Quick Overview
- SOL maintains stability around $87–$88, positioned above its 50-day EMA with critical resistance forming at $90–$94
- Crypto analyst Ali Martinez identified a compressed Bollinger Band pattern spanning $77 to $94 on the 3-day timeframe
- SOL-focused ETFs attracted $9.44 million in weekly net inflows, contributing to a five-day streak totaling roughly $1.45 billion
- Goldman Sachs revealed exposure of approximately $108 million in SOL holdings
- Breaking decisively above $94 could trigger a rally toward $100; falling beneath $77 may signal extended downside
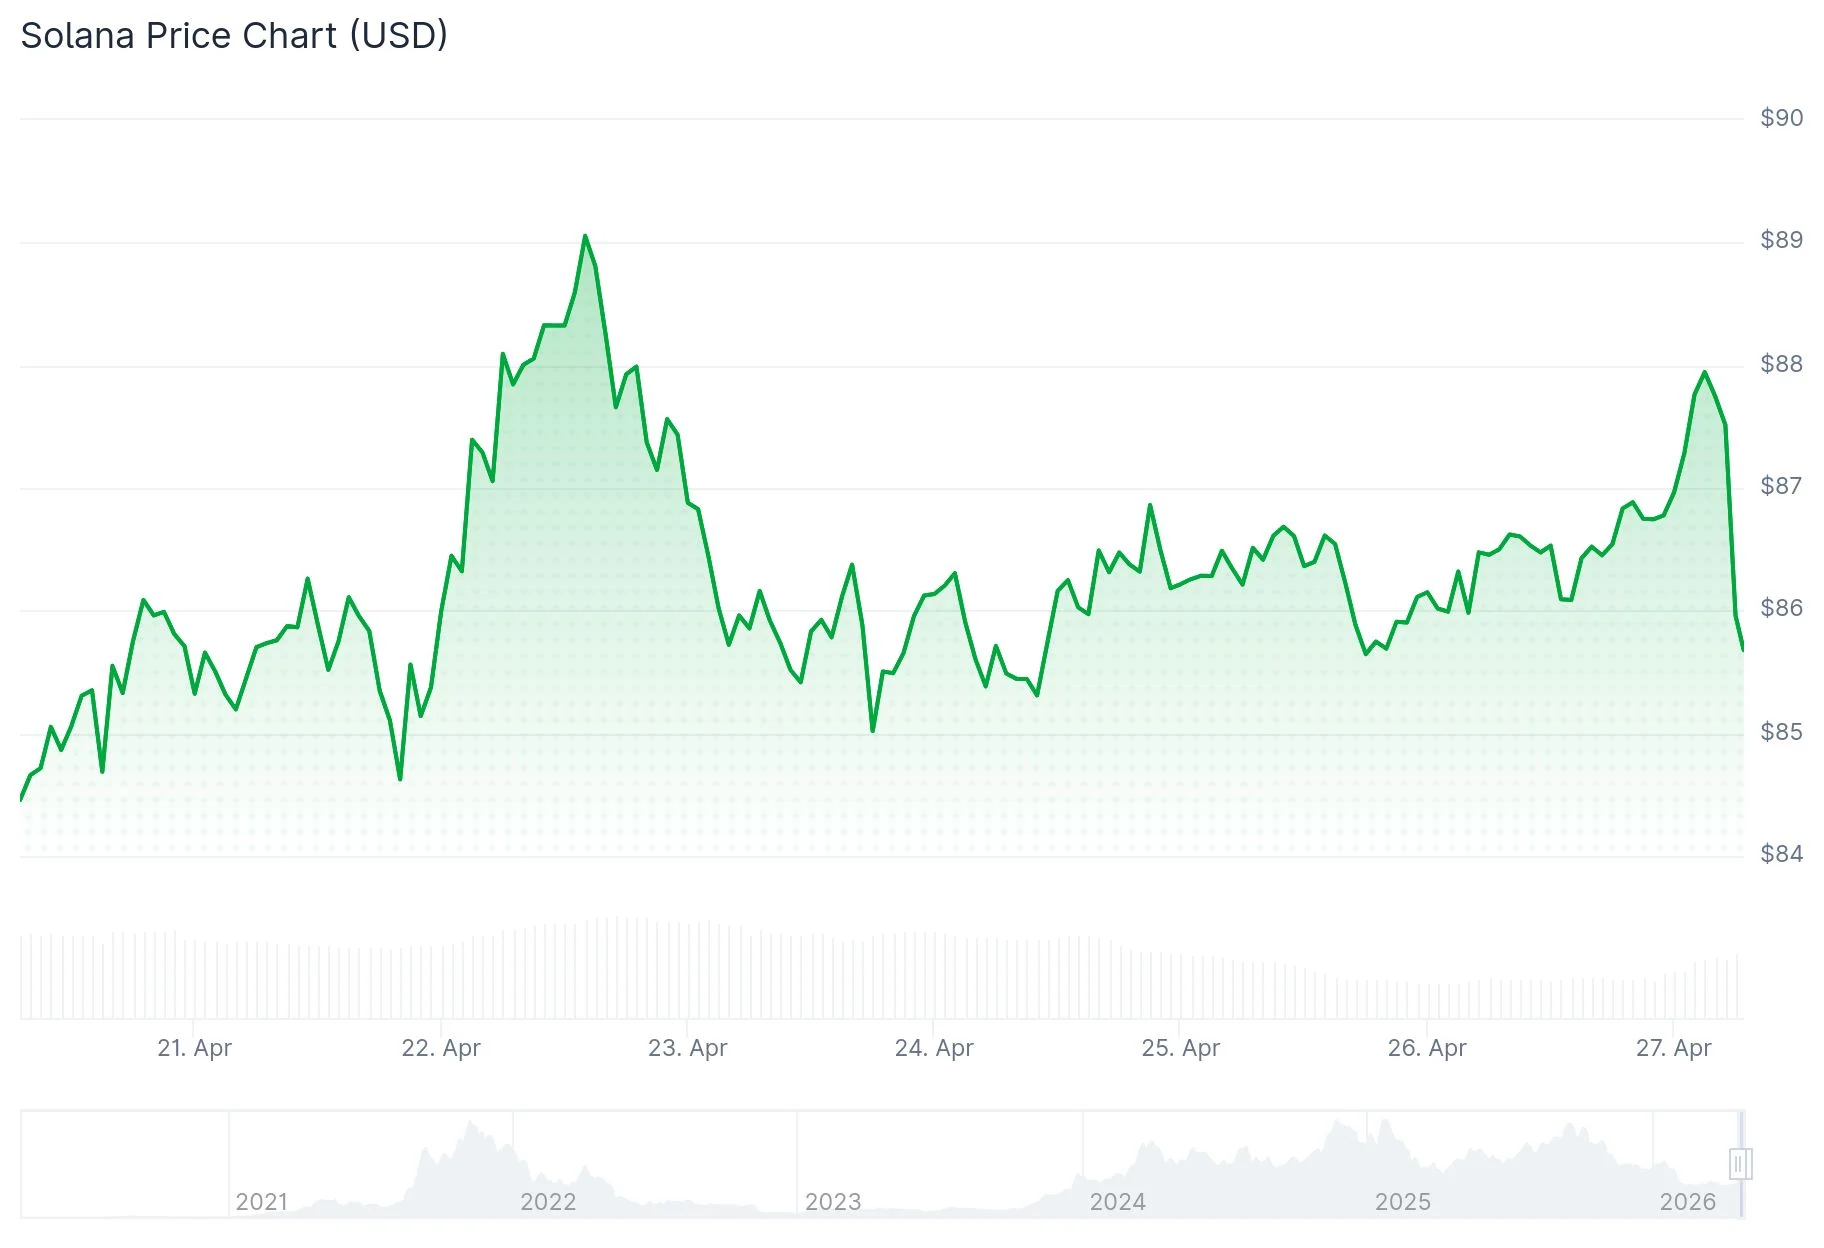
Solana (SOL) is currently exchanging hands around the $87–$88 range on Monday, maintaining ground above its 50-day Exponential Moving Average (EMA) positioned at $87.04. Following a rebound from recent lows near $84.55, the asset is now challenging a significant resistance area.

The digital asset has pushed past the 50% Fibonacci retracement mark derived from its latest decline between $89.34 and $84.55. Technical charts reveal a developing bullish trend line providing support around $86.50 on the hourly timeframe.
Near-term resistance appears at $88.20, corresponding with the 76.4% Fibonacci threshold. Beyond this, major obstacles emerge at $90, with additional resistance waiting at $92.
Crypto market analyst Ali Martinez pointed out that SOL is currently confined within a compressed Bollinger Band corridor on the 3-day chart, spanning from $77 to $94. He characterized this region as a “no-trade zone,” cautioning that attempting to trade within this confined range often results in whipsaw losses. Martinez emphasized that traders should wait for a definitive 3-day candle closure beyond these bands before considering any directional move as legitimate.
Trading volume has declined by over 23% throughout this consolidation period. While reduced volume during lateral price movement is typical, any breakout attempt above $94 will require significantly stronger trading activity to validate a push toward the $100 milestone.
Technical Indicators Show Emerging Bullish Bias
The Relative Strength Index (RSI) currently stands at 55, climbing above the neutral 50 mark on the daily timeframe. Both the MACD and its corresponding signal line have crossed into positive territory, indicating that buying pressure is presently dominant.
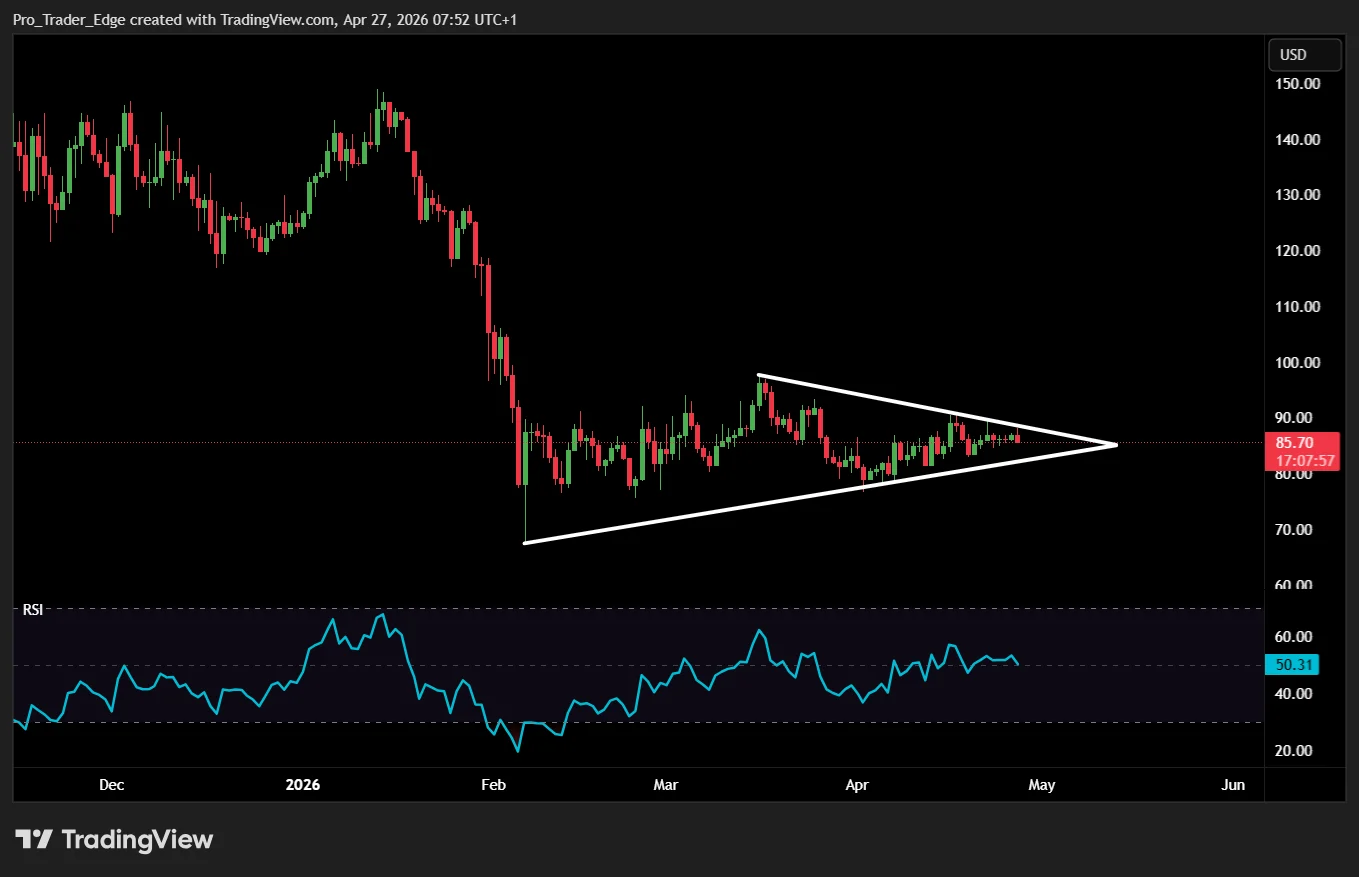
SOL is testing the upper boundary of a symmetrical triangle formation near $89.00 on the daily chart. A convincing breakthrough above this threshold would open the door to the psychologically important $100 level, followed by the 200-day EMA stationed at $113.
Regarding downside scenarios, the 50-day EMA at $87.04 represents the initial support layer. A daily closure underneath the ascending trendline around $85.99 would compromise the current bullish framework.
Institutional Capital and ETF Activity
Solana-focused exchange-traded funds captured $9.44 million in net weekly inflows, down from $35.17 million during the previous week. Despite the weekly decline, five straight days of positive net inflows have accumulated to approximately $1.45 billion.
Goldman Sachs made headlines by revealing a stake valued at nearly $108 million in Solana, representing another significant institutional validation that market participants are monitoring closely.
SOL futures Open Interest climbed more than 2% within 24 hours to reach $5.23 billion. Meanwhile, the funding rate jumped to 0.0095%, demonstrating that traders are willing to pay elevated premiums to maintain long exposure.
Should SOL prove unable to penetrate the $90–$94 resistance band, immediate support levels lie at $86.50, followed by $85. A decisive close beneath $78 could accelerate selling pressure toward the $72 zone.


Long-time Bitcoin developer Paul Sztorc has been trying to overhaul Bitcoin’s architecture since 2015, but the broader community hasn’t budged.
So now he has proposed a dramatic step, called eCash hardfork, that involves copying Bitcoin’s code to launch a separate version in August, while giving existing bitcoin holders equivalent tokens in the new network for free.
The community, however, is criticizing the funding part, which involves reassigning coins linked to Bitcoin’s missing founder, Satoshi Nakamoto.
What is a hard fork?
Think of a hard fork like a railway line splitting into two. Trains start from the same station, but at some point the line splits, helping trains reach completely different destinations.
When a group of developers cannot reach consensus on a proposed change to Bitcoin’s code, they copy the existing blockchain and launch it as a separate chain, which shares Bitcoin’s entire history up to the point of the split, but diverges after the split, moving forward with its own rules, features, token and direction.
That’s precisely what happened in 2017 when the debate over Bitcoin’s block size reached a tipping point, culminating in a chain split and the creation of the Bitcoin Cash blockchain with its native token, BCH.
The technical dispute centered on Bitcoin’s 1MB block size limit, which caps the number of transactions that can be processed every 10 minutes when new blocks are added to the blockchain. Hence, some favoured increasing the block size, but the community remained divided, eventually leading to a chain split.
Sztorc’s eCash hard fork
The proposed hard fork will create a new chain called eCash with native eCash tokens. “Hold 4.19 BTC at the time of the fork, get 4.19 eCash. You can sell it, keep it, or ignore it entirely,” he said on X.
The fork is scheduled for Bitcoin block height 964,000 in August 2026. A coin-splitter tool will be released to help holders cleanly separate their BTC from their new eCash.
The new chain will be a near-copy of Bitcoin’s existing blockchain, with one critical addition called Drivechains, a scaling architecture Sztorc first proposed in 2015 and formally submitted to Bitcoin developers as BIP300 and BIP301 in 2017 and 2019, respectively.
Drivechains are sidechains tethered to the Bitcoin blockchain, allowing seamless movement of BTC between the main chain and sidechains without changing Bitcoin’s base layer. Each sidechain can operate under its own rules and features, essentially allowing developers to build new capabilities on top of Bitcoin without requiring the entire network to adopt those changes.
Think of Drivechains as service roads attached to the main highway. When the highway is congested, drivers can exit the highway and travel on the service road at different speed limits, then re-enter the highway when it’s clear. This way, the highway never changes, yet more traffic is handled more efficiently, and the journey becomes more flexible for everyone.
Seven Drivechains are already in development, Sztorc said on X, including a privacy chain modelled on Zcash, a prediction market called Truthcoin, a decentralised exchange called CoinShift, and a quantum-resistant chain called Photon.
The controversial part linked to Satoshi coins
Sztorc wants to use coins that would have gone to Satoshi Nakamoto’s equivalent addresses on the new eCash chain to bring investors on board before the fork goes live, a decision he calls necessary but which has riled the community, with some calling it outright theft.
A potential hard fork would bring Bitcoin’s entire transaction history to the new chain. So every bitcoin balance, including Satoshi’s 1.1 million bitcoin, sitting untouched in wallets that have noved moved these coins, would show up as an equivalent eCash balance on the new chain.
As per the plan, fewer than half of the Satoshi-equivalent eCash coins will be assigned to investors today. The precise mechanism of how it’s being done remains unclear. But since eCash doesn’t yet exist, the pre-hard fork assign seems to be a promised credit following a successful hard fork.
The plan, he argues, will ensure collaborators have a tangible incentive to get involved early, building momentum and completing work ahead of launch. Without this mechanism, the project can turn into a “zombie project” that ships unfinished. Worse, it could become a centralized project, where a small group of developers gains outsized control over the chain’s direction.
The industry response, however, has been negative.
“Taking Satoshi coins is theft and disrespectful, and eCash is already used for Lightning payments with Cashu and Fedi. Those are poor choices,” Bitcoin advocate Peter McCormack said.
Josh Ellithorpe, chief technology officer at Pixelated Ink, expressed concerns about the precedent it sets and how it could eventually be a risk to everyone’s BTC holdings.
“eCash, setting the precedent that they can and will steal coins. Now it’s Satoshi, but it could be anyone later. Also misrepresenting the BCH fork, stealing another project’s name, and not having replay protection,” Ellithorpe said.

Key Takeaways
- Ethereum has corrected approximately 50% from its October 2025 peak of $4,700 to current levels around $2,300, yet accumulation patterns suggest institutional buying
- The taker buy/sell ratio climbed to levels not seen since January 2023, indicating strong demand pressure
- Network activity shows smart contract deployments hit an all-time high on a 180-day moving average basis
- Spot Ethereum ETFs recorded $155 million in net inflows last week, marking the third consecutive week of positive flows
- Critical price zones: $2,400 represents overhead resistance while $2,200 serves as downside support
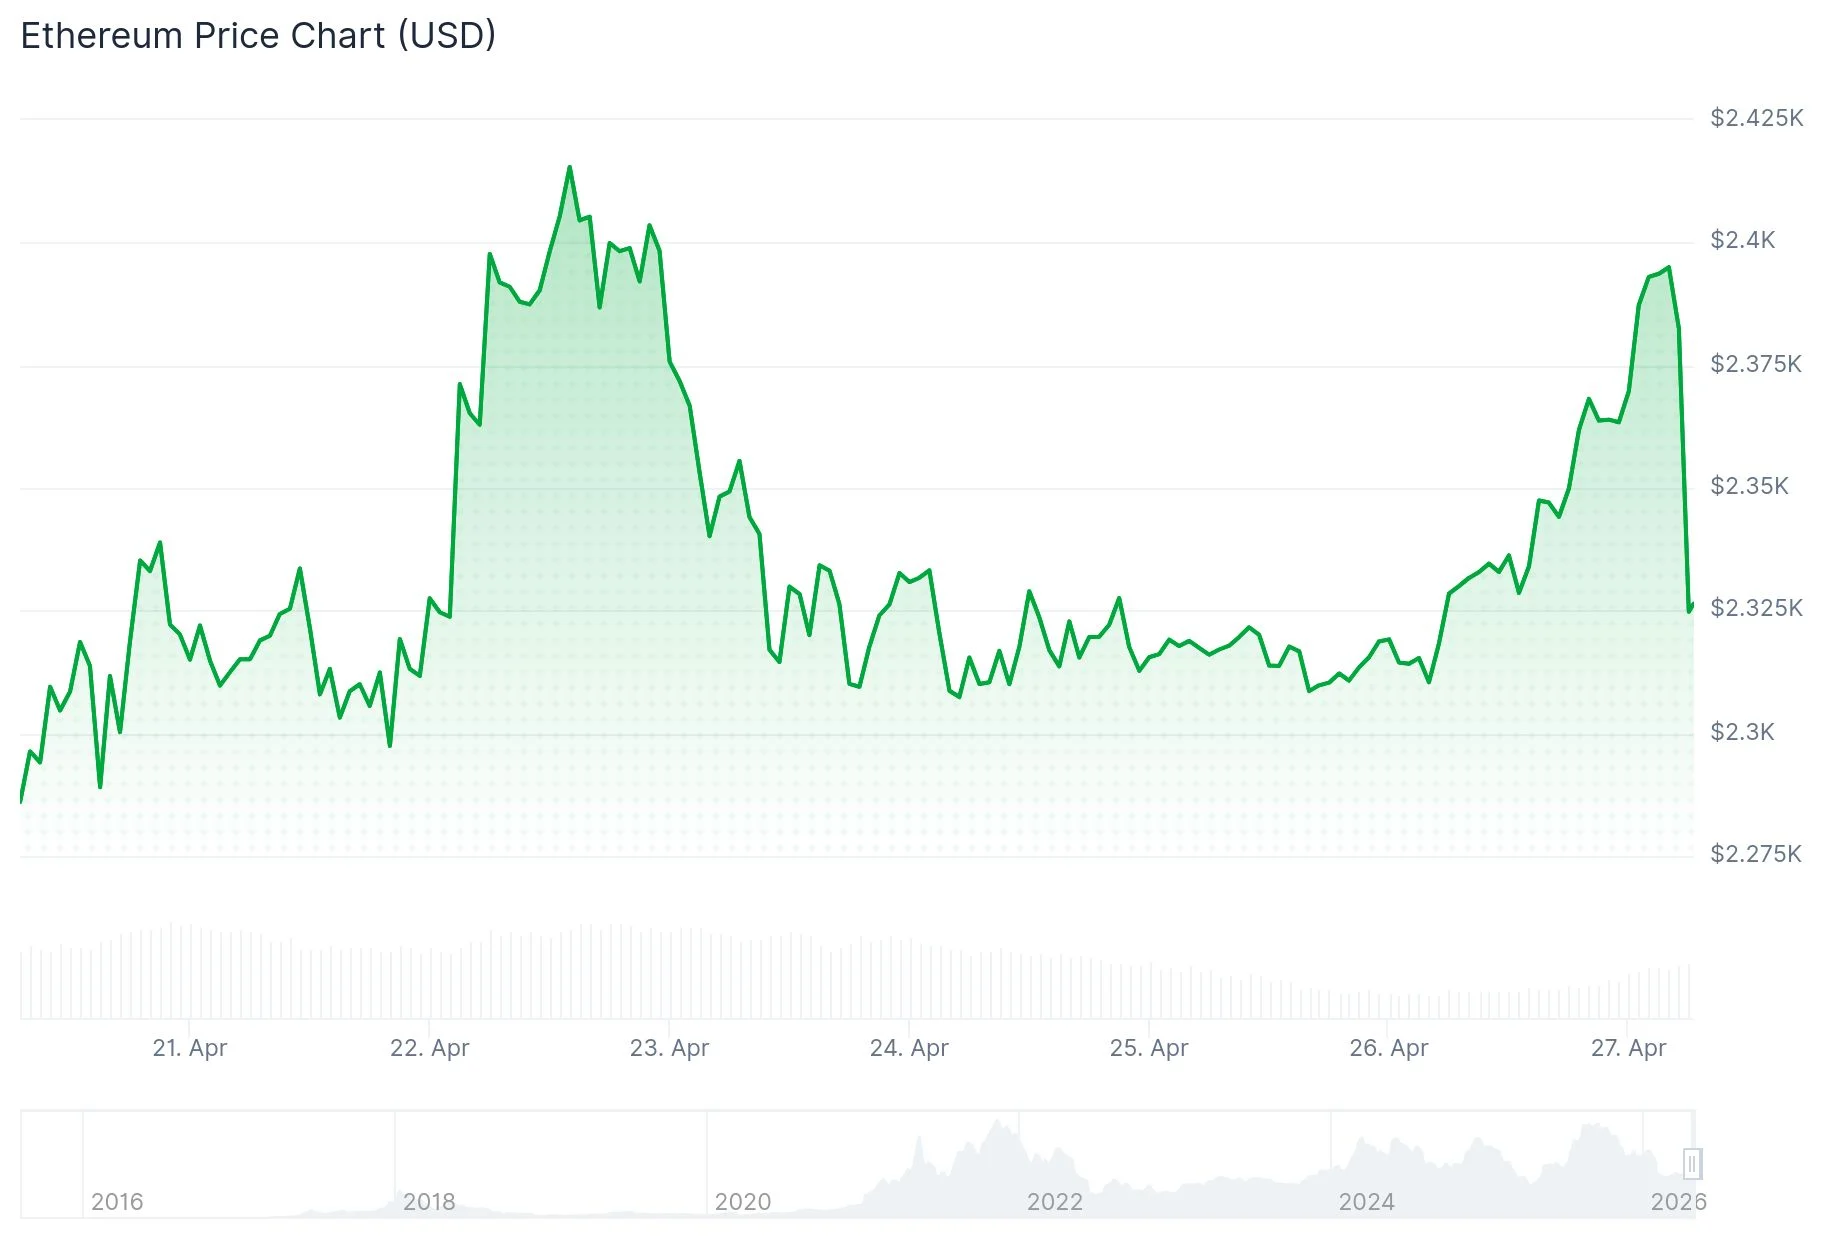
Ethereum’s price has experienced a significant downturn, shedding approximately half its value from the October 2025 peak near $4,700 to trade around $2,300 today. However, beneath the surface volatility, blockchain metrics reveal a different narrative—one of strategic accumulation.
According to metrics from CryptoQuant, the 30-day moving average of the taker buy/sell ratio has climbed to its most elevated reading since the beginning of 2023. This indicator measures the intensity of market orders on the buy side relative to sell-side pressure.
The data suggests that market participants are aggressively acquiring ETH even as downward price momentum persists. Such patterns typically indicate sophisticated investors methodically building positions during periods of market weakness.
Network Growth Contradicts Price Weakness
Additional analysis from CryptoQuant reveals that the 180-day moving average for newly deployed smart contracts has reached an unprecedented peak. This demonstrates that developer engagement continues to expand despite bearish price action.
Historical patterns show that surges in smart contract deployment activity have frequently foreshadowed price reversals. The current disconnect between robust network utilization and suppressed token valuation indicates that fundamental strength may not yet be reflected in market pricing.
According to SoSoValue data reported by Odaily, Ethereum spot exchange-traded funds attracted $155 million in net new capital during the week spanning April 20–24. This represents the third consecutive week of positive institutional flows.
BlackRock’s ETHA dominated inflows with $138 million for the period, pushing its cumulative net inflow to $11.97 billion. BlackRock’s ETHB contributed an additional $60.9 million. Conversely, Grayscale’s ETHE experienced the largest outflow at $49.2 million. Combined net assets across all Ethereum spot ETF products currently total $13.79 billion.
Market analyst Ted (@TedPillows) observed that ETH remains range-bound and cautioned that the collapse of US-Iran peace negotiations could introduce heightened volatility in the coming days. He highlighted that a successful reclaim of $2,400 could unlock the $2,470–$2,500 liquidity region, whereas a breakdown below $2,300 might trigger a retest of the $2,150–$2,200 zone.
Technical Outlook and Critical Zones
Examining the hourly timeframe, Ethereum successfully breached a descending triangle formation with resistance positioned at $2,320. The rally extended to $2,404 before entering a consolidation phase. Currently, ETH maintains its position above both $2,370 and the 100-hour simple moving average.
The nearest resistance barrier stands at $2,400, followed by $2,420 and $2,450. A decisive break above $2,450 could catalyze momentum toward $2,500 and potentially extend to the $2,550–$2,565 range.
For downside protection, $2,330 represents the initial support level. Below that threshold, $2,285 and $2,200 emerge as critical defensive zones.
In a notable development, Bitmine Immersion Technologies, linked to market strategist Tom Lee, disclosed plans to purchase 10,000 ETH directly from the Ethereum Foundation through an over-the-counter transaction valued at $23.9 million. This acquisition would elevate the firm’s total Ethereum holdings to 4.98 million ETH.

Key Takeaways
- Republican Senator Thom Tillis has withdrawn his opposition to Kevin Warsh’s Federal Reserve chair nomination following the conclusion of a DOJ investigation into Jerome Powell
- The Senate Banking Committee is set to vote on Warsh’s confirmation on April 29, with a full Senate floor vote potentially occurring the week of May 11
- Jerome Powell’s term as Fed chair concludes May 15; Warsh may assume the role shortly after Senate approval
- Financial markets indicate a 99% likelihood the Federal Reserve maintains interest rates at 3.50%–3.75% during the April 28–29 policy meeting
- Market projections suggest no rate reductions until September 2027, based on CME FedWatch analysis
The path to Federal Reserve leadership has cleared significantly for Kevin Warsh after a critical Republican lawmaker withdrew his opposition to the nomination.
North Carolina Senator Thom Tillis announced Sunday that he would no longer obstruct Warsh’s confirmation proceedings. The senator had previously stalled the nomination due to an ongoing Department of Justice inquiry into current Federal Reserve Chair Jerome Powell concerning a multibillion-dollar headquarters renovation project.
With the DOJ having concluded its three-month investigation, Tillis felt comfortable moving forward. In a statement posted on X, the senator described the investigation as “a serious threat to the Fed’s independence” and emphasized that its resolution was necessary before he could support the nomination.
As a member of the Senate Banking Committee, Tillis’s support carries significant weight. The committee has scheduled its confirmation vote for April 29.
Following committee approval, the nomination will advance to the full Senate chamber. While no official date has been announced, sources indicate a floor vote could take place during the week of May 11.
Powell’s tenure as Federal Reserve chair officially ends on May 15. Should Warsh receive Senate confirmation, he could be sworn in within days of Powell’s departure.
While Powell retains eligibility to serve on the Federal Reserve’s Board of Governors through 2028, historical patterns suggest he may opt for retirement once his chairmanship concludes.
Federal Reserve Rate Expectations
The upcoming April 28–29 Federal Open Market Committee meeting will mark Powell’s final gathering as chair. Market participants anticipate a steady course.
According to CME Group FedWatch data, there is a 99% probability that the Federal Reserve will maintain its current rate range of 3.50%–3.75%. The likelihood of a rate increase stands at merely 1%.
Matthew Luzzetti, Chief Economist at Deutsche Bank, anticipates the Fed will maintain its current messaging, signaling policymakers’ intention to hold rates steady for a considerable duration.
Market pricing does not reflect anticipated rate cuts until September 2027. At that juncture, there exists a 38.6% probability of rates declining to the 3.25%–3.50% range.
Global tensions, particularly developments involving Iran, are creating additional economic headwinds. Rising energy prices are fueling inflationary pressures, while economic uncertainty is dampening corporate investment appetite.
Warsh’s Views on Cryptocurrency and Monetary Policy
Warsh has traditionally been characterized as hawkish regarding monetary policy. This orientation generally favors maintaining elevated interest rates for extended periods, which tends to negatively impact risk-oriented assets such as cryptocurrencies.
Nevertheless, Warsh has recently emphasized his commitment to Federal Reserve independence, stating that President Trump has not attempted to influence his views on interest rate policy.
Regarding digital assets, Warsh disclosed holdings in over 30 cryptocurrency projects, including notable positions in Solana and the decentralized trading platform dYdX.
Warsh has also expressed skepticism about the Federal Reserve’s substantial holdings of Treasury securities and mortgage-backed securities, a portfolio expansion that originated from the 2008 financial crisis response.
The April 29 Senate Banking Committee vote represents the initial formal milestone in his confirmation journey.
Crypto World
XRP Price Prediction Tightens Toward $3 With Spot ETFs Booking Best Month of 2026, While Pepeto Charts a 100x Path

The xrp price prediction just picked up a fresh signal. Spot XRP ETFs have pulled in $75.6 million across April, the strongest month since launch, and GraniteShares debuted 3x long and short XRP ETFs on Nasdaq on April 23, lifting cumulative XRP fund flows past $1.28 billion as XRP holds $1.42 with no outflows since April 9 per The Market Periodical.
The xrp price prediction has wind behind it, but Pepeto is the vehicle putting smaller wallets on the same side as institutional flow before the wider market catches the signal. With $9.45 million already raised and analysts calling for 100x, the presale closes the moment the Binance listing opens.
Spot XRP ETF flows climbed from sub-$10 million daily reads to $75.6 million across April, the strongest stretch since launch, signaling capital rotating from Bitcoin dominance back into Ripple’s token per The Market Periodical. Confirming the trend takes a clean weekly close above $1.50, but the direction is running. Cumulative XRP ETF flows now top $1.28 billion, and GraniteShares’ 3x products on Nasdaq just opened a fresh derivatives lane for institutions on April 23.
Ripple unveiled a four-phase roadmap to make the XRP Ledger quantum-resistant by 2028, with emergency migration tools and post-quantum cryptography rolling in across stages. The Ripple plan removes a long-tail security risk that has weighed on long-term holders for years.
Lower overhang opens the ceiling, but the exchange still priced at presale levels and built to absorb volume as institutional capital keeps flowing on chain is where the return math really shifts before the listing arrives.
XRP Price Prediction Meets the Presale Entry Before the Listing Lands
Pepeto Price at $0.0000001866 as Binance Listing Nears and $9.45M Already Raised
When institutional flow at this size moves into smaller cap tokens, fresh launches grow faster than any solo trader can track. Pepeto was built for this market, handing every holder the tools to sort live setups from noise before the crowd catches up.
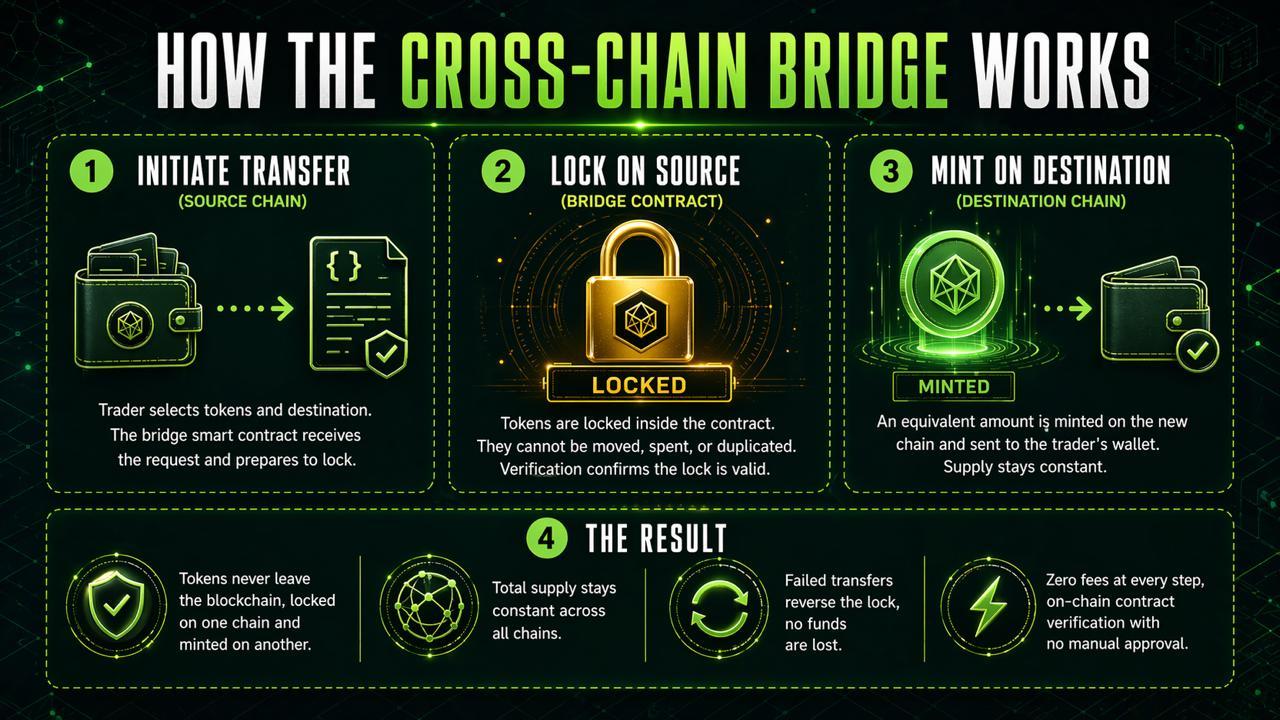
$9.45 million raised at $0.0000001866 with 100x projected by analysts strengthens the case as every round closes. The Binance listing unlocks the contract scanner, an in-house swap router that fires every trade for free, and a multi-chain bridge that hops tokens between ETH, BNB, and SOL with no gas at all.
While XRP climbs the ETF inflow chart, Pepeto hands smaller wallets the same setup the big holders already run. Staking at 178% APY pulls tokens off supply daily as rounds close. SolidProof cleared every contract, a senior Binance developer built the platform, and the founder behind Pepe’s $11 billion market cap on 420 trillion tokens is leading this build.
The cleanest wins in every bull run land in the wallet that grabbed the entry while everyone else hesitated, and Pepeto at $0.0000001866 is that entry while the listing window stays open. The moment trading goes live, the presale price disappears and market pricing takes over.
XRP Price Prediction: Can XRP Clear $1.50 and Push $3?
XRP Holds $1.42 With ETF Rotation Pointing Toward a $3 Reclaim
XRP trades at $1.42, around 58% under its $3.40 peak from January 2018 per CoinMarketCap. Resistance sits at $1.50 and $1.65, with support at $1.30. Standard Chartered carries a $5.50 year-end call.
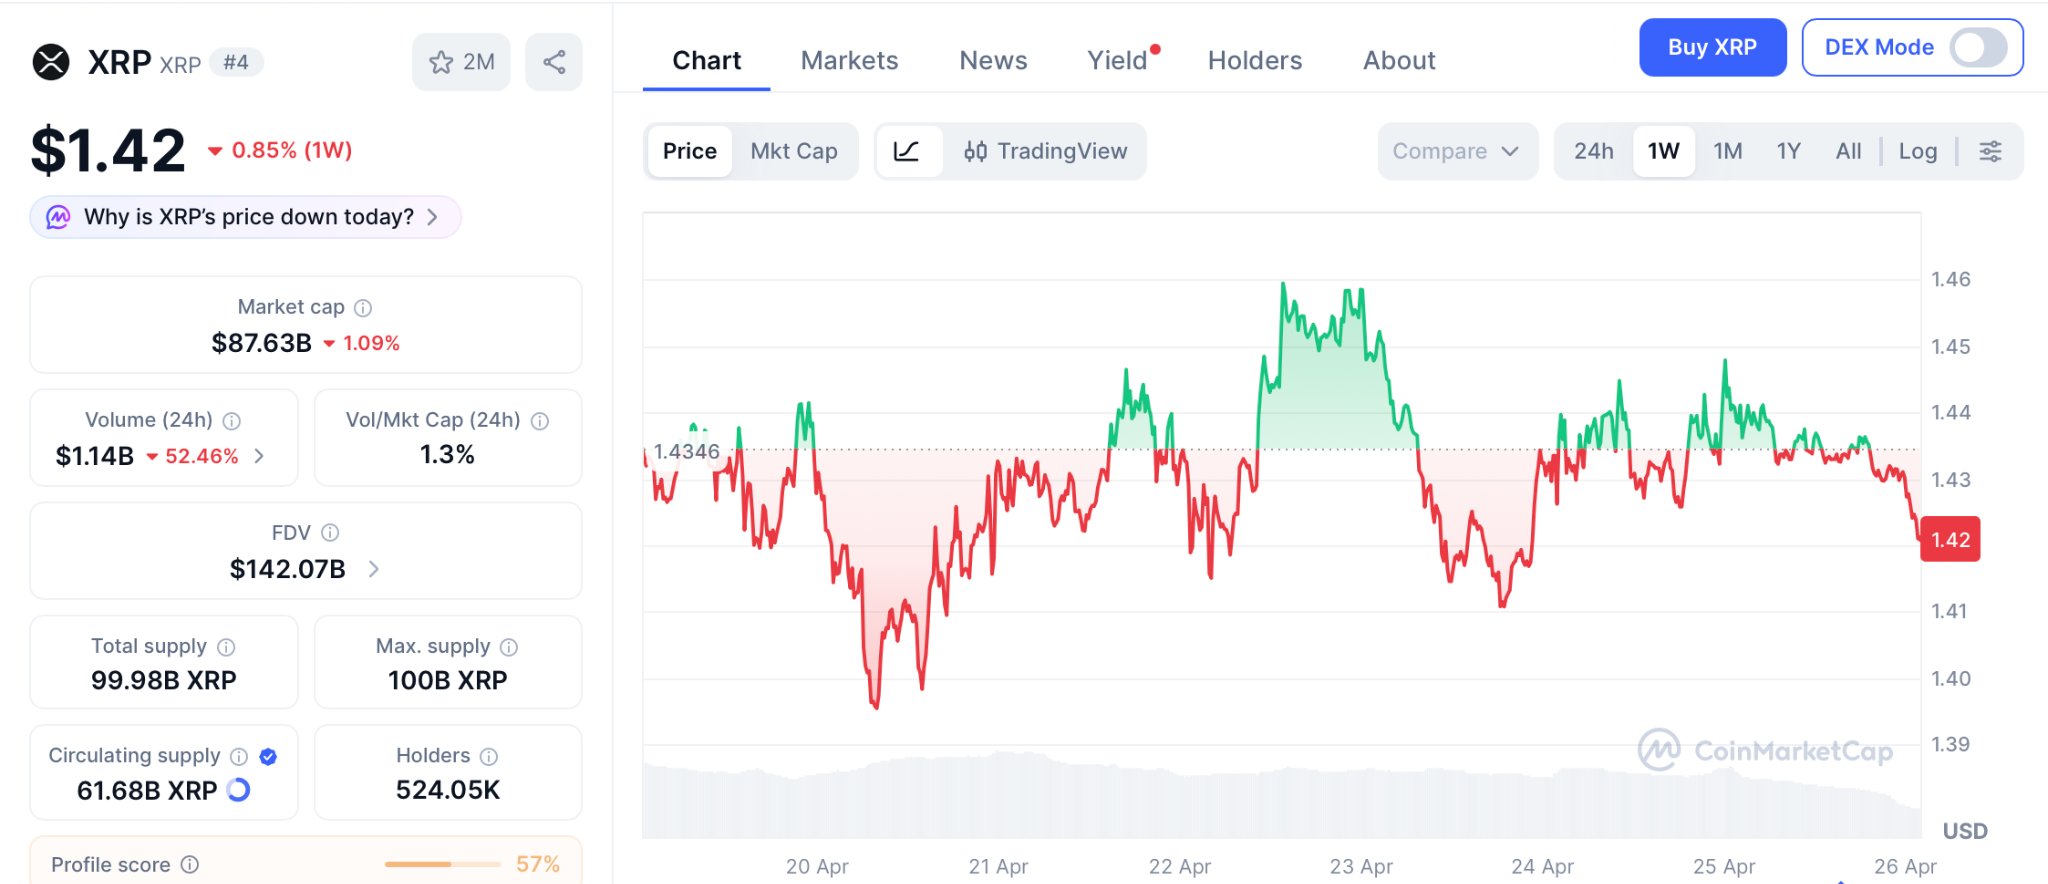
Clearing $1.50 opens $1.65 and puts $3 within reach based on the zones that preceded the last two major XRP runs. The quantum-resistant roadmap rolls out in stages through 2028, and roughly $1.28 billion locked in spot ETFs keeps sell pressure at multi-year lows.
The xrp price prediction reads strong for patient holders, but $1.42 to $3 is roughly 110% across months. The presale compresses what that climb pays into one listing event.
Conclusion
XRP just printed its best ETF month of 2026. Cumulative spot flows cleared $1.28 billion. GraniteShares opened a 3x derivatives lane. When that base grows instead of bleeding, the ceiling lifts across the whole XRP ecosystem.
But here is the part most traders are missing. The same wallets driving the XRP rotation are loading Pepeto ahead of the Binance debut. They are reading what the crowd has yet to register, and tracking that move before the listing is how every prior cycle paid the buyers who watched closely. The Pepe cofounder steering a live exchange at presale levels with a listing already booked is not something crypto hands out often.
The Pepeto official website is where that entry still sits, but the listing draws closer and once it opens, this price is gone for good.
Click To Visit Pepeto Website To Enter The Presale

FAQs
Can XRP (XRP) reach $3 based on the latest xrp price prediction?
XRP at $1.42 targets $3 for roughly 110% upside, on the path to Standard Chartered’s $5.50 call. Resistance at $1.50 is the first gate, with the quantum-resistant roadmap and $1.28 billion in spot ETF holdings backing that trajectory.
What drives Pepeto (PEPETO) returns beyond the xrp price prediction?
Five live exchange tools scale with on-chain growth as institutional capital rotates into XRP. The Binance listing compresses what months of XRP recovery deliver into one event at $0.0000001866.
Disclaimer: This is a Press Release provided by a third party who is responsible for the content. Please conduct your own research before taking any action based on the content.
Onyxcoin (XCN) climbed to a 3-month high after South Korean exchange Upbit confirmed it will list the token today.
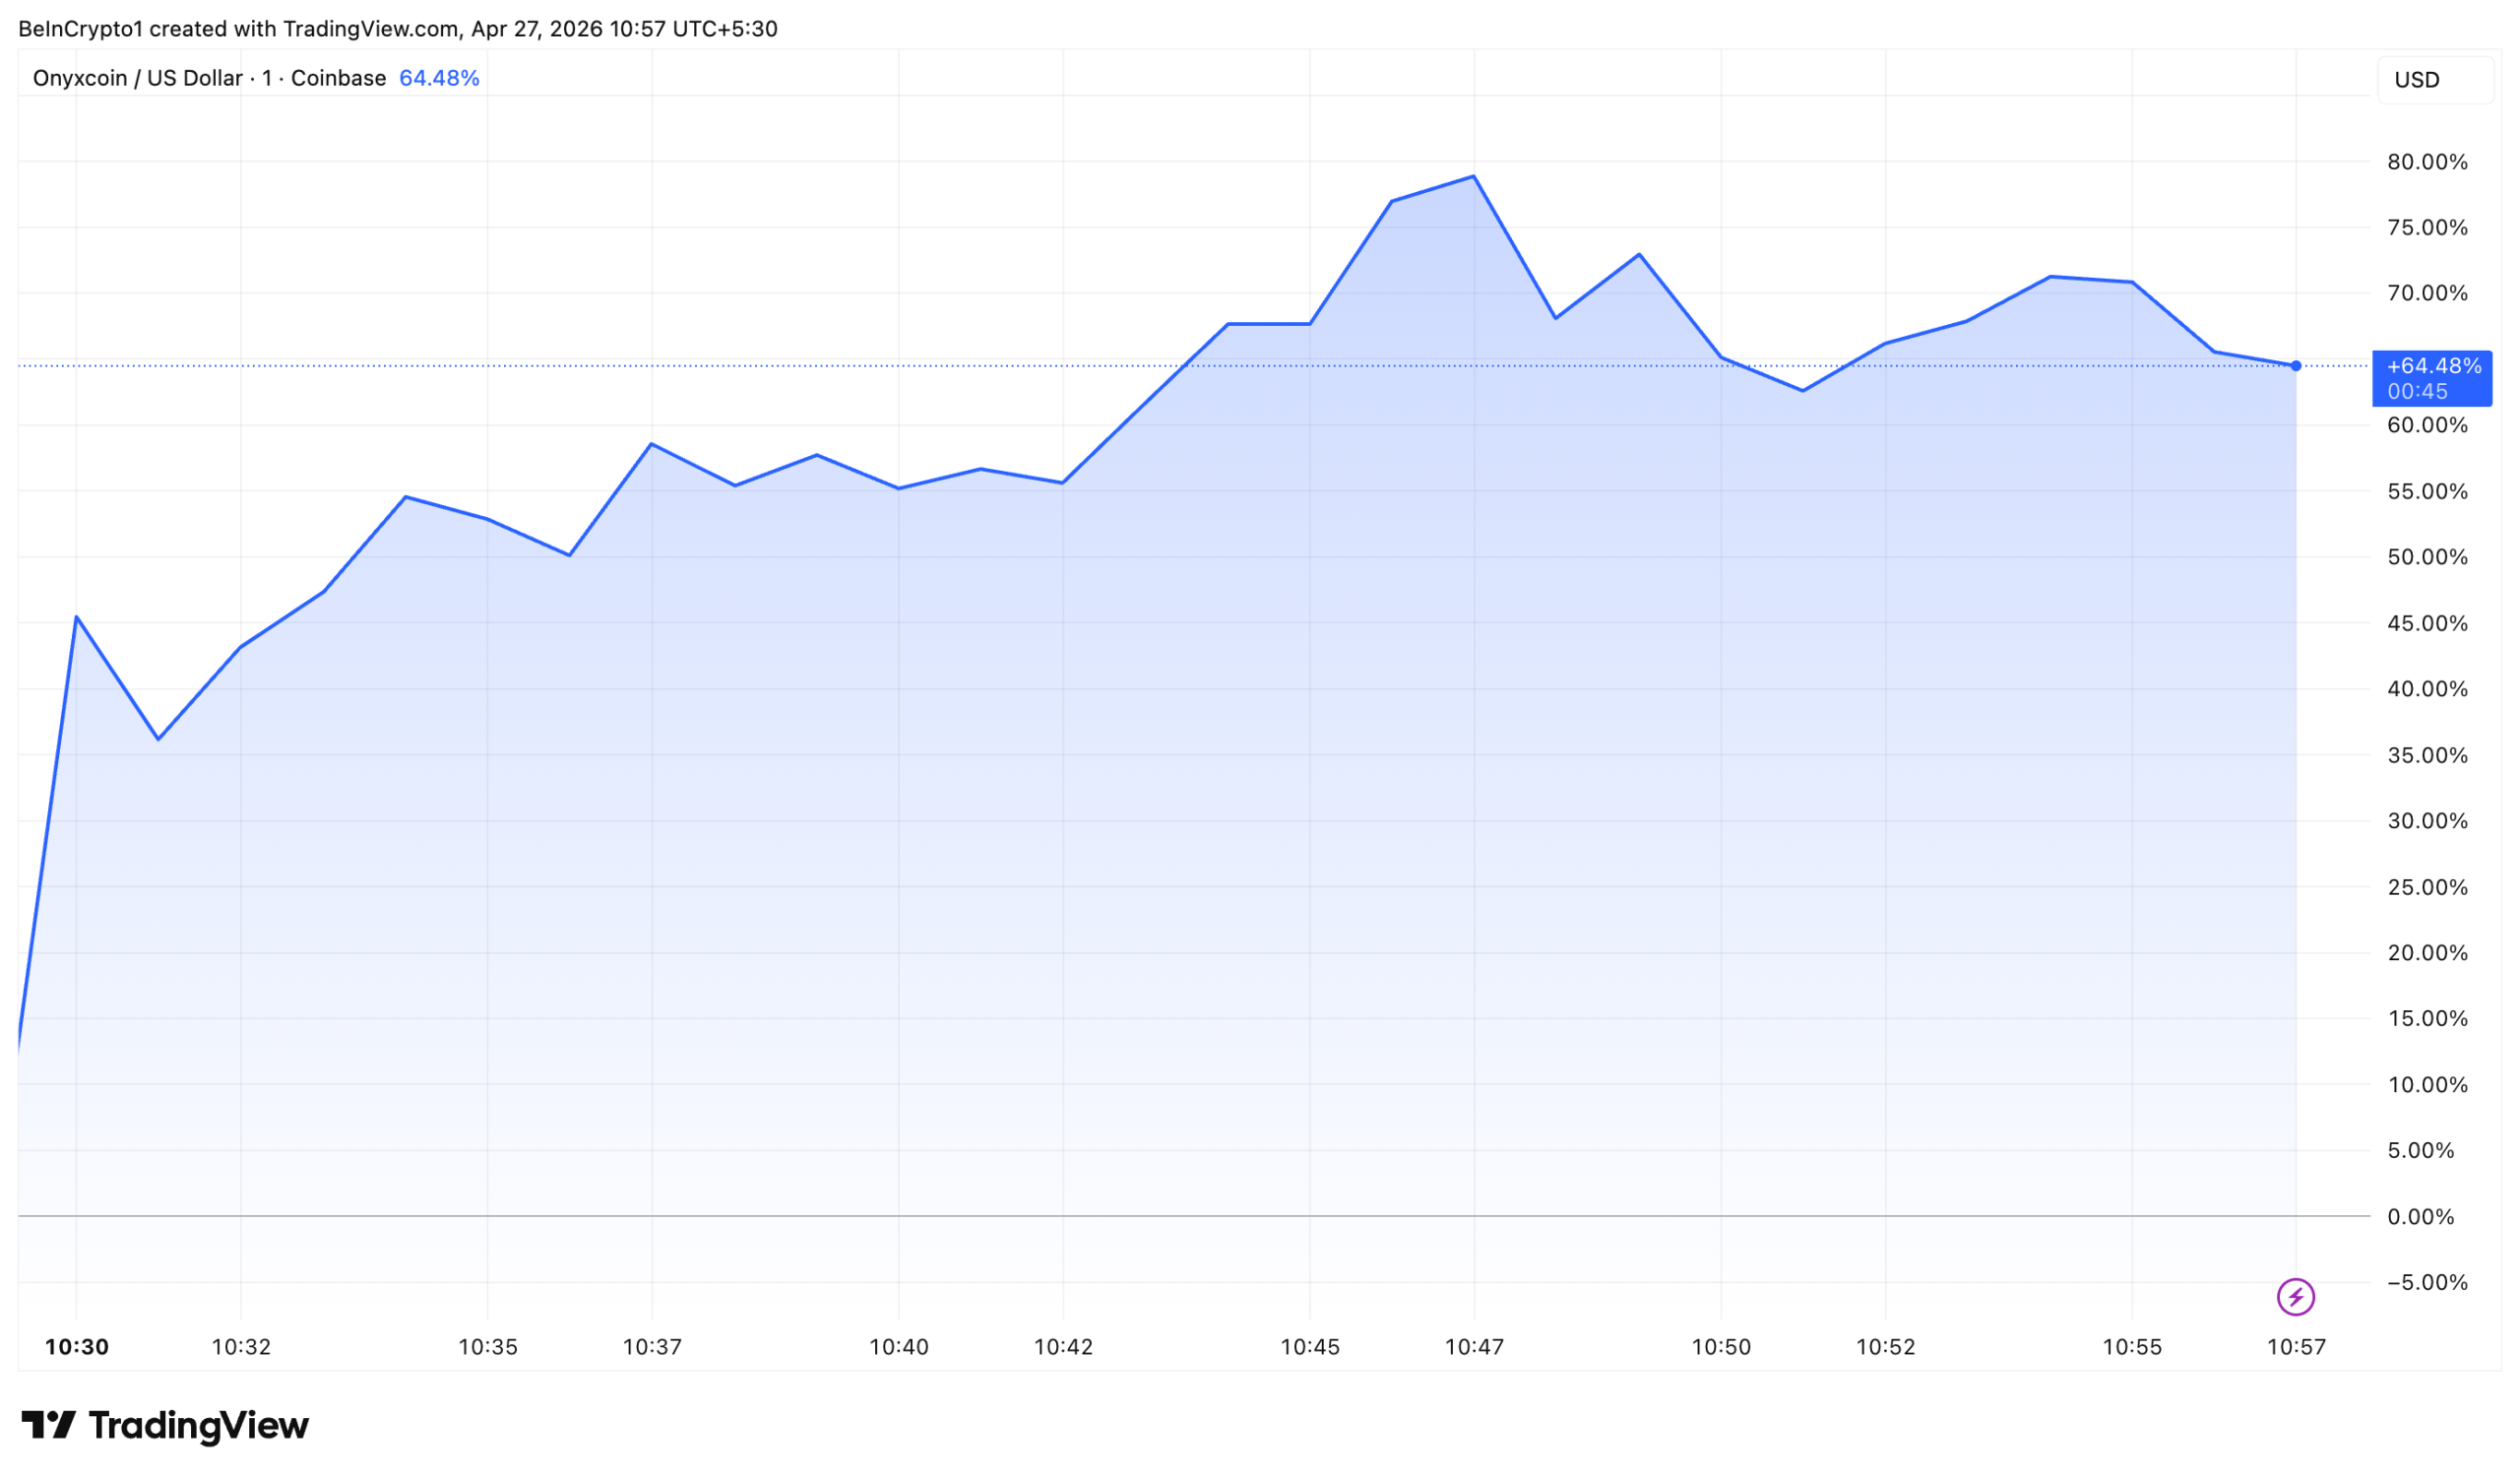
The altcoin saw a notable price surge after the announcement, reaching an intraday peak of $0.0086, its strongest level since mid-January.
Onyxcoin (XCN) Price Jumps to January Highs Ahead of Upbit Debut
At press time, XCN was trading at $0.0077, up 64.48% since the announcement. The sharp rally has propelled the token to the top of the gainers’ list among the 1,000 largest cryptocurrencies by market capitalization on CoinGecko.
Follow us on X to get the latest news as it happens

The daily trading volume also jumped 629% to reach $37 million. South Korea’s second-largest crypto exchange accounted 25.45% of the total volume. Historically, Upbit listings have produced sharp short-term price reactions in newly listed altcoins.
Meanwhile, the exchange revealed that XCN trading will start at 16:00 Korean Standard Time (KST). The altcoin will be available to trade against two pairs: the Korean Won (KRW) and Tether (USDT).
“Please be sure to verify the network before depositing digital assets. Deposits and withdrawals through networks other than the one specified are not supported,” the notice read.
The exchange also noted that it will apply short-term trading restrictions. For the first five minutes after trading opens, traders will not be able to place buy orders, and sell orders priced more than 10% below the previous day’s closing value will be blocked.
Additionally, the exchange will permit only limit orders for approximately two hours after trading support begins. The temporary measures are meant to reduce volatility and ensure a fair, controlled start to XCN trading.
Subscribe to our YouTube channel to watch leaders and journalists provide expert insights
The post Upbit Listing Pushes Onyxcoin (XCN) to Highest Level in 3 Months appeared first on BeInCrypto.

Bitcoin tagged a 12-week high of $79,399 overnight before sellers stepped in during Asian morning hours on Monday, dousing a rally that setup the asset for a run to $80,000 for the first time since January.
Bitcoin traded at $77,705 on Monday morning, down 0.4% over 24 hours after climbing to $79,399 around 09:00 IST and reversing sharply through the Asia session. Ether slipped 2.4% to $2,329, Solana fell 1.9% to $86, and BNB declined 1.2% to $630. The rally that lifted bitcoin to its highest level since January 31 unwound by mid-morning Singapore time.
The push higher came on a report from Axios that Iran offered a new proposal to the U.S. to reopen the Strait of Hormuz, with nuclear talks delayed until after the U.S. naval blockade is lifted.
Asian equities ran with it. The MSCI Asia Pacific Index rose 1.7%, the emerging markets index hit a record, and Taiwan Semiconductor Manufacturing surged 6% to its own record. Brent crude pared earlier 2.5% gains to up 1% at $106.50 a barrel.
Bitcoin briefly traded along with the risk-on move and then peeled away. The rejection at $79,399 has a clean technical explanation. Rachael Lucas, an analyst at BTC Markets, said $80,000 is where many recent buyers are approaching breakeven, which historically produces selling pressure as those traders rotate out of positions they were underwater on for weeks.
Bitcoin is up 16% in April, on pace for its first double-digit monthly gain since May 2025. Strategy bought $3.9 billion of bitcoin this month, according to Bloomberg, the firm’s largest monthly accumulation in a year.
Funding rates on perpetual futures across major exchanges remain negative on a seven-day basis at -0.13% per Coinglass, meaning shorts are still paying longs to hold positions, which is the structural setup that produces a squeeze if spot can hold above the recent breakeven cluster.
The Federal Reserve and European Central Bank both have policy decisions this week, and megacap tech earnings include the four largest U.S. companies by market cap.
Either the Fed or a single earnings beat could provide the catalyst the bitcoin tape has been missing. Without one, the third rejection from $79,000 in eight sessions starts to define the range rather than precede the breakout.


Non-fungible tokens (NFTs) are rallying, and to those fixated on rising prices, the market may seem to be booming. Overall activity, however, tells a different story.
Leading the rally are Bored Ape Yacht Club and Pudgy Penguins. Their floor prices, the lowest possible acquisition cost, have climbed double digits in recent weeks, and their tokens have posted double-digit gains. Still, the comeback is unfolding with far fewer buyers.
Pudgy Penguins’ floor has climbed above 5 ETH, up more than 20% on the week, with 201 sales and nearly 1,000 ETH in volume over the past seven days supporting the move. BAYC’s floor is up 81% over the past 30 days, rebounding sharply from depressed levels.
Floor prices are an important metric to follow. In an NFT collection, the floor price is the lowest-priced item currently for sale. If the lowest-priced Pudgy Penguin on the market is listed at 5.38 ether (ETH), that becomes the collection’s floor. A rising floor generally means buyers are willing to pay up to get in. A falling floor usually means holders are rushing for the exit.
But beneath the headline price gains, the market’s structure tells a different story, as broad participation is shrinking.
According to CryptoSlam, global NFT sales fell to roughly $175 million in April from $304 million in February, while total transactions and active users both dropped by nearly half.
Average sale prices, meanwhile, more than doubled month over month, climbing from $30.60 in March to $67.38 in April. Those two data points describe the same phenomenon from opposite ends. A smaller pool of capital is concentrating in high-value trades in blue-chip collections, rather than a broad-based demand returning to the market.
Even within blue chips, demand quality varies. Pudgy Penguins is seeing relatively high transaction counts alongside rising prices, a sign of sustained activity. By contrast, collections like CryptoPunks have recorded similar weekly volume with far fewer trades, implying that a small number of large transactions are having an outsized impact on price.
Broader market signals remain mixed. Wash trading still accounts for roughly 50% of total volume, according to CryptoSlam, and aggregate trading profits remain negative, indicating that many participants are still underwater despite the recent rebound.
Taken together, the data points to a market that is stabilizing but not yet expanding. Prices are rising, but participation is falling, and activity is concentrated in a handful of collections.
At the same time, ETH is up roughly 18% over the past month, and BTC is up nearly as much. Some portion of what looks like an NFT-specific rally is simply beta to a crypto-wide risk-on move, with blue-chip collections priced in ETH catching the updraft alongside everything else.

Republican Senator Thom Tillis has lifted his opposition to Kevin Warsh’s nomination as Federal Reserve chair after a federal investigation into Jerome Powell concluded.
Summary
- Tillis has ended his hold on Kevin Warsh’s nomination after the DOJ closed its investigation into Jerome Powell.
- The Senate Banking Committee is set to vote on April 29, with a full Senate decision expected in mid-May before Powell’s term ends.
According to a statement shared by Tillis on X, the U.S. Department of Justice has wrapped up its three-month probe into Powell over the Federal Reserve’s headquarters renovation, clearing a key hurdle that had stalled Warsh’s path forward.
“I have been clear from the start: the U.S. Attorney’s Office criminal investigation into Chair Powell was a serious threat to the Fed’s independence, and it needed to end before I could support Kevin Warsh’s confirmation,” Tillis said.
“I welcome the inspector general’s investigation. This is a necessary and appropriate measure, and I have confidence it will be conducted thoroughly and professionally.”
Holding a seat on the Senate Banking Committee, Tillis had been in a position to delay the process through a procedural hold or by withholding support, which would have prevented the nomination from advancing to the full Senate.
With his backing now in place, the committee is set to vote on April 29, while a full Senate vote is expected to follow, potentially during the week of May 11.
Jerome Powell’s current term is scheduled to end on May 15. If confirmed, Warsh is likely to assume the role within days, placing him at the helm of the U.S. central bank at a time when monetary policy remains closely watched across markets.
Policy outlook and crypto exposure
Attention has turned to how Warsh might steer interest rate policy and what that could mean for risk-sensitive assets, including cryptocurrencies. Known for a cautious stance on aggressive rate cuts during his time as a Federal Reserve governor, Warsh has often been viewed as hawkish, a posture that can weigh on speculative markets.
At the same time, political pressure has added another layer to expectations. U.S. President Donald Trump has repeatedly urged the Federal Reserve to lower rates, prompting questions about whether new leadership could lean in that direction.
Warsh, however, has indicated that policy decisions would remain insulated from external influence, noting that no such pressure has been directed at him.
Financial disclosures have also drawn interest from the digital asset sector. Warsh reported exposure to more than 30 crypto-related investments, including holdings tied to Solana and activity linked to decentralized exchanges such as dYdX.
The portfolio has led some market participants to view him as more familiar with the industry than previous candidates, even as his policy stance remains under close scrutiny.
With the confirmation process moving ahead, the focus now rests on the Senate vote and how quickly leadership at the Federal Reserve transitions once Powell’s term concludes.
3 Signs Smart Money Is Repositioning in Crypto Right Now

Acute Lymphoblastic Leukaemia Symptoms: Why The Lumps On My Scalp Were Not A ‘Scalp Infection
China formalises gig worker protections for 200 million platform workers with algorithm transparency and 2027 deadline
Manchester United reach agreement with Casemiro over contract clause amid transfer speculation

US brings back mandatory military draft registration

Steven Gerrard disagrees with Gary Neville over ‘shock’ Chelsea and Arsenal claim | Football


-

 Politics6 days ago
Gary Stevenson delivers timely reminder to register to vote as deadline TODAY
-

 Fashion3 days ago
Weekend Open Thread – Corporette.com
-
Crypto World2 days ago
Hyperliquid $HYPE Rally Builds Momentum as AI Sector Enters Prove-It Phase
-
Crypto World7 days ago
Bank of Hawai’i (BOH) Q1 2026: Net Income Drops to $57.4M as Net Interest Margin Expands
-

 Politics5 days ago
Making troops accountable for war crimes threatens US alliance, ex-SAS colonel warns
-

 Politics5 days ago
Disabled people challenge government SEND proposals over segregation concerns
-

 Business5 days ago
Rolls-Royce Voted UK’s Most Iconic Trade Mark as IPO Register Hits 150
-

 Business3 days ago
Patterson-UTI Energy, Inc. (PTEN) Q1 2026 Earnings Call Transcript
-

 Politics5 days ago
Zack Polanski responds to home secretary’s taser threat
-
 Sports18 hours ago
IPL 2026: Ruturaj Gaikwad registers slowest fifty of the season, enters all-time unwanted list | Cricket News
-
 Crypto World6 days ago
Five Value Stocks with Recovery Potential in 2026: PayPal (PYPL), Nike (NKE), and More
-
Politics5 days ago
Wings Over Scotland | How To Get Away With Crimes
-

 Politics5 days ago
Starmer handler McSweeney to be dragged from shadows by Foreign Affairs Committee
-

 Crypto World5 days ago
New York sues Coinbase, Gemini over prediction market offerings
-

 Politics4 days ago
‘Iran is still a nuclear threat’
-
 Business5 days ago
HCL Tech share price tank over 9% after weak Q4. JPMorgan, HSBC & 3 others cut target price
-
Entertainment6 days ago
Sydney Sweeney cameo cut from “The Devil Wears Prada 2”, source explains why (exclusive)
-

 Fashion6 days ago
Kilkenny Design New Beauty Arrivals for Spring 2026
-
 Sports4 days ago
Tim Bradley names the current best in the world: “Better than Inoue and Usyk”
-

 NewsBeat22 hours ago
LK Bennett closes all stores after entering administration
You must be logged in to post a comment Login