

Crypto World
Polymarket aims for prediction market approval in Japan by 2030


Polymarket is set to lobby for authorization of prediction markets in Japan, according to a Bloomberg report on Friday.
The decentralized prediction market platform has appointed a representative in the country and is aiming for government approval by 2030, Bloomberg report said, citing people familiar with the matter who asked not to be named.
Mike Eidlin, head of Japan at cryptocurrency exchange Jupiter, is leading Polymarket’s efforts, according to the report.
Polymarket, which allows users to bet on outcomes of real-world events through blockchain-based futures contracts, has been under pressure to expand its reach into other major markets as legal scrutiny has hampered its activity in the U.S.
Read More: India cracks down on prediction markets: Polymarket goes dark, Kalshi could be next
Japan maintains some of the world’s strictest gambling laws, with most forms of betting prohibited under the country’s criminal code. Exceptions exist for state-sanctioned wagering on events such as horse racing and lotteries, while casinos are only beginning to emerge under a tightly regulated framework.
Polymarket has seen “meaningful organic interest from users in Japan,” a spokesperson said, according to Bloomberg’s report.
Japan has also taken a comparatively cautious approach toward crypto-related businesses, with regulators enforcing licensing and consumer protection requirements on digital asset firms operating in the country.
Polymarket did not respond to CoinDesk’s request for comment.


Polymarket, a global prediction market platform, is reportedly seeking entry into Japan amid growing regulatory scrutiny of the sector worldwide.
The company has appointed Mike Eidlin, head of Japan at crypto firm Jupiter, to lead its local efforts and is preparing to lobby for authorization of prediction markets in the country, Bloomberg reported Friday, citing people familiar with the matter.
Polymarket is targeting government approval in Japan by 2030, viewing the market as a major untapped opportunity.
The plans come as prediction markets, including Polymarket and rival Kalshi, face increased regulatory pressure globally, with countries such as India among the latest to move against the platforms.
Japan’s strict gambling rules pose hurdle
Japan has strict laws around online gambling, permitting betting only on select government-authorized activities such as horse racing and public lotteries.
Authorities have stepped up scrutiny of online betting in recent years, with violations linked to online casino use carrying fines of up to $3,400 and potential prison sentences of up to three years for repeat offenses.
Polymarket reportedly said the company has seen “meaningful organic interest from users” in the country and across Asia, adding: “We’re always evaluating opportunities to expand access globally in compliant and locally appropriate ways.”
Cointelegraph approached Polymarket for comment but had not received a response by publication.
Related: CFTC sues Minnesota, Governor Tim Walz over prediction markets ban
Polymarket’s Japan community on X already exceeds 53,000 followers
Despite only seeking regulatory approval to operate in the country, Polymarket already has a Japan-focused X account with more than 53,000 followers,
Cointelegraph was not able to identify any other Polymarket regional community of comparable size on X at the time of writing.

Source: Polymarket Japan
Polymarket lists Japan among 35 restricted jurisdictions, including the United States, according to its country access policy. However, past reporting indicates users in restricted regions may still access the platform using tools such as VPNs.
Trading volumes fall amid regulatory pressure and competition
Polymarket’s trading activity has come under pressure amid rising regulatory scrutiny across multiple jurisdictions and growing competition from platforms such as Kalshi.
According to Token Terminal data, Polymarket’s monthly notional trading volume fell nearly 15% in April, while Kalshi saw an increase of about 13%.
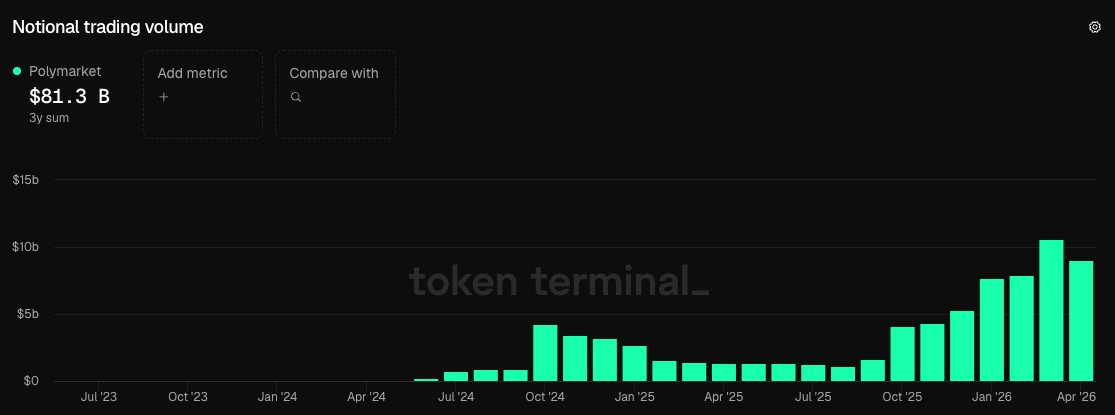
Polymarket’s monthly notional trading volume. Source: Token Terminal
Polymarket’s access is also increasingly restricted globally, with the platform blocked in roughly 34 countries and subject to “close-only” restrictions in four others, according to Start Polymarket data.
Related: Polymarket team says user funds safe as exploit losses climb above $600K
India is among the latest jurisdictions moving to restrict access to prediction markets, with authorities reportedly preparing blocking orders against rival platform Kalshi following earlier action against Polymarket.
Magazine: Should users be allowed to bet on war and death in prediction markets?


F2Pool co-founder Chun Wang plans to join SpaceX’s Starship program for a two-year mission that would fly beyond the Earth-Moon system and past Mars.
Summary
- F2Pool co-founder Chun Wang plans to join SpaceX’s two-year Starship mission for a Mars flyby.
- Wang previously commanded Fram2, the first human spaceflight to fly over Earth’s polar regions.
- F2Pool remains a major Bitcoin mining pool, holding about 10% market share by recent data.
SpaceX has announced Wang as part of a planned Starship mission that would travel beyond the Earth-Moon system, conduct a Mars flyby, and return to Earth. Universe Today reported that SpaceX described the trip as a two-year round journey, though no launch date has been announced.
Wang said the mission would start with a flyby rather than a landing. He said “It’s going to be a flyby mission of Mars,” adding that such a flight could help build momentum for future missions.
Lunar flight comes before Mars
Before the Mars trip, Wang is expected to join Dennis Tito and Akiko Tito on a planned commercial Starship flight around the Moon. The weeklong mission would pass within about 200 kilometers of the lunar surface, according to the same report.
Wang said the Moon flyby would test new work for Starship. He said “Even though it’s just a flyby,” the mission would attempt several things that have not been done before.
Meanwhile, Wang is not new to private spaceflight. Earlier reports noted that he funded and commanded Fram2, SpaceX’s first crewed mission to fly over Earth’s polar regions. The mission launched in 2025 with Wang, Jannicke Mikkelsen, Rabea Rogge, and Eric Philips aboard Dragon Resilience.
The mission aimed for a 90-degree inclination, sending the crew over both poles. Related coverage said Fram2 carried scientific work linked to human health, space travel, polar auroras, and microgravity.
F2Pool link keeps crypto in the story
Wang co-founded F2Pool in 2013. The pool later became one of the largest Bitcoin mining pools, giving Wang a central place in early Bitcoin mining history.
F2Pool still ranks among the largest Bitcoin mining pools. Hashrate Index data shows F2Pool with about 107.2 EH/s and an 10% Bitcoin mining pool market share, behind Foundry USA and AntPool.
The SpaceX plan now places Wang among the small group of crypto-linked figures using private wealth for human spaceflight. It also adds a new chapter to the link between Bitcoin mining profits and high-risk frontier projects.
For now, the Mars mission remains a plan without a fixed launch date. Starship is still in testing, and long-duration private flights beyond the Moon remain complex. Still, Wang’s role gives the crypto industry a rare connection to SpaceX’s push beyond Earth orbit.
The break and retest strategy is a trading approach based on support and resistance levels. A breakout occurs when price moves beyond a key level, while a retest happens when price returns to that level before potentially continuing in the direction of the breakout. Traders use this strategy in forex and CFD markets to identify possible trend continuation setups and evaluate market structure shifts.
The approach is commonly applied in trending conditions, where price momentum may support continuation after the retest is confirmed. Traders often combine break and retest in trading with price action analysis, volume, or technical indicators to assess breakout strength and manage risk more effectively. In this article, we explain how the break and retest strategy works, how traders may apply it in different market conditions, and which confirmation methods are commonly used.
Break and Retest Strategy Explained

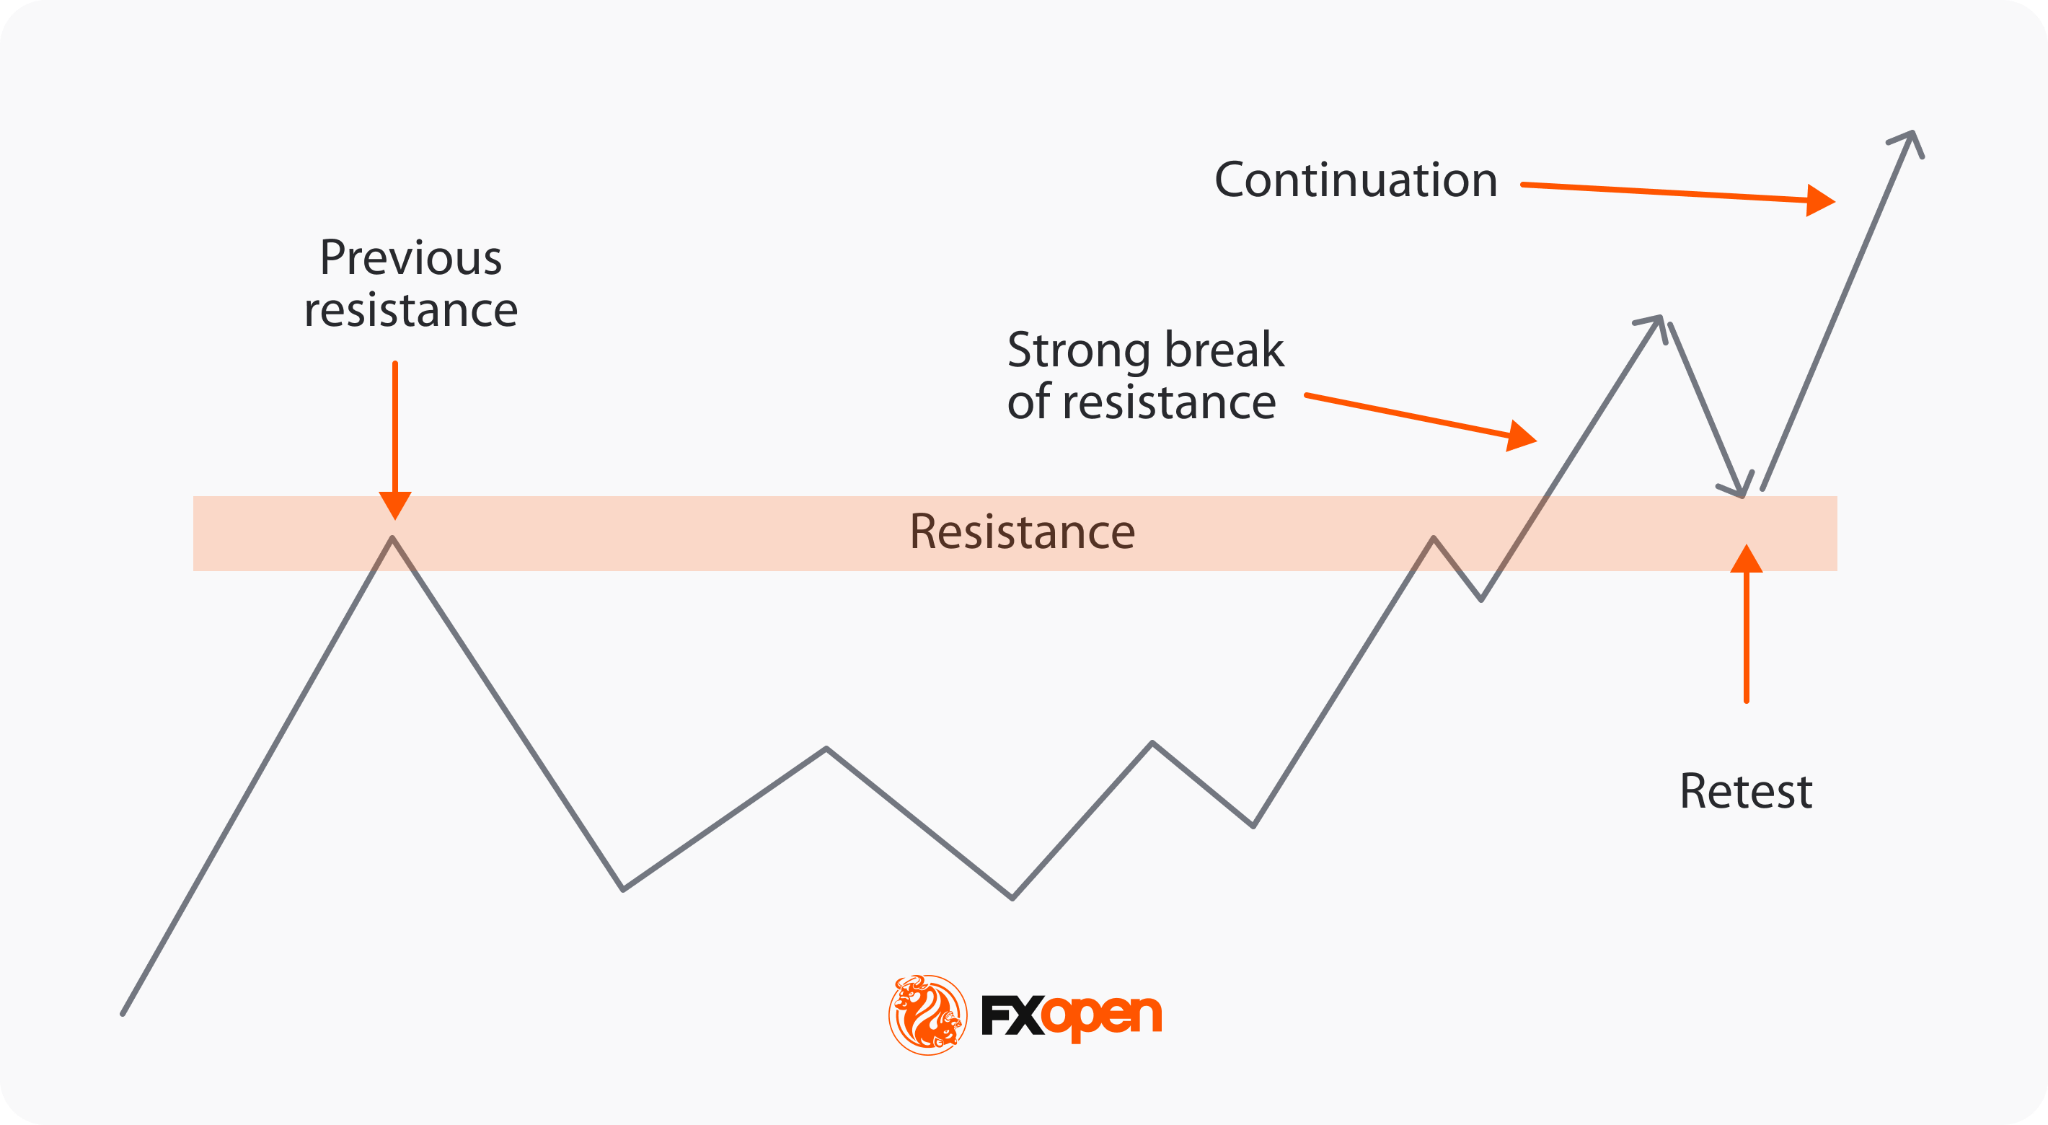
The break and retest strategy involves three stages. Price first breaks a major support or resistance level. It then returns to retest that level. Finally, the trend continues in the breakout direction. Each stage builds on the previous, with the retest giving traders a second reference point.
The breakout itself is a liquidity shift. Resting orders above resistance and below support get absorbed when price moves through. New positions then build in the breakout direction. The retest acts as validation: the level either holds in its new role or fails.
A support/resistance retest works on role reversal. Broken resistance often acts as support on the return move. Broken support often acts as resistance. When the retest holds and price moves away from the level, the original signal is confirmed. The trend tends to continue from that point.
Break and Retest Strategy Steps
The break and retest strategy follows a fixed sequence. Each step builds on the last, with execution clarity around entries, stops, and invalidation.
1. Identifying Key Levels
Traders mark significant support and resistance levels on the chart. Levels validated by multiple touches and clear reactions carry more weight than untested ones.
2. Monitoring for a Breakout
A breakout occurs when price closes decisively beyond a key level, often with rising trading volume. A volume surge supports the move and reduces the chance of a false break.
3. Waiting for the Retest
After the breakout, price often retraces to test the broken level. Former resistance now acts as support, or former support as resistance, depending on direction.
4. Confirming the Retest
Confirmation comes from price action at the retest. Rejection candles such as pin bars or engulfing patterns, paired with sustained volume, suggest the new level is holding.
5. Entering the Trade
Traders typically enter once the rejection candle closes.
6. Managing the Trade
Traders could set take-profit levels at prior swing points or fixed risk-reward ratios. Stop-loss orders could sit beyond the retest extreme: below the new support for longs, above the new resistance for shorts. They also may be trailed to protect unrealised gains as price moves favourably.
Entry and Exit Logic
A break and retest entry strategy needs a defined trigger. The most common is a candle close in the breakout direction after the retest, often with a rejection wick at the level. Aggressive traders typically enter on the close of the rejection candle itself. More conservative traders typically wait for the next candles to confirm direction before committing.
Stop placement follows the structure. For longs, stops typically sit a few pips below the retest low or below the most recent swing point. For shorts, stops sit above the retest high or below the most recent swing high. Position sizing then scales to the stop distance rather than the other way around. This anchors risk management to where the trade idea is invalidated, not to an arbitrary pip figure.
Take-profit targets are commonly set at the next significant structural level, or at a fixed risk-reward ratio such as 1:2 or 1:3.
Break and Retest Trading Example (Forex)
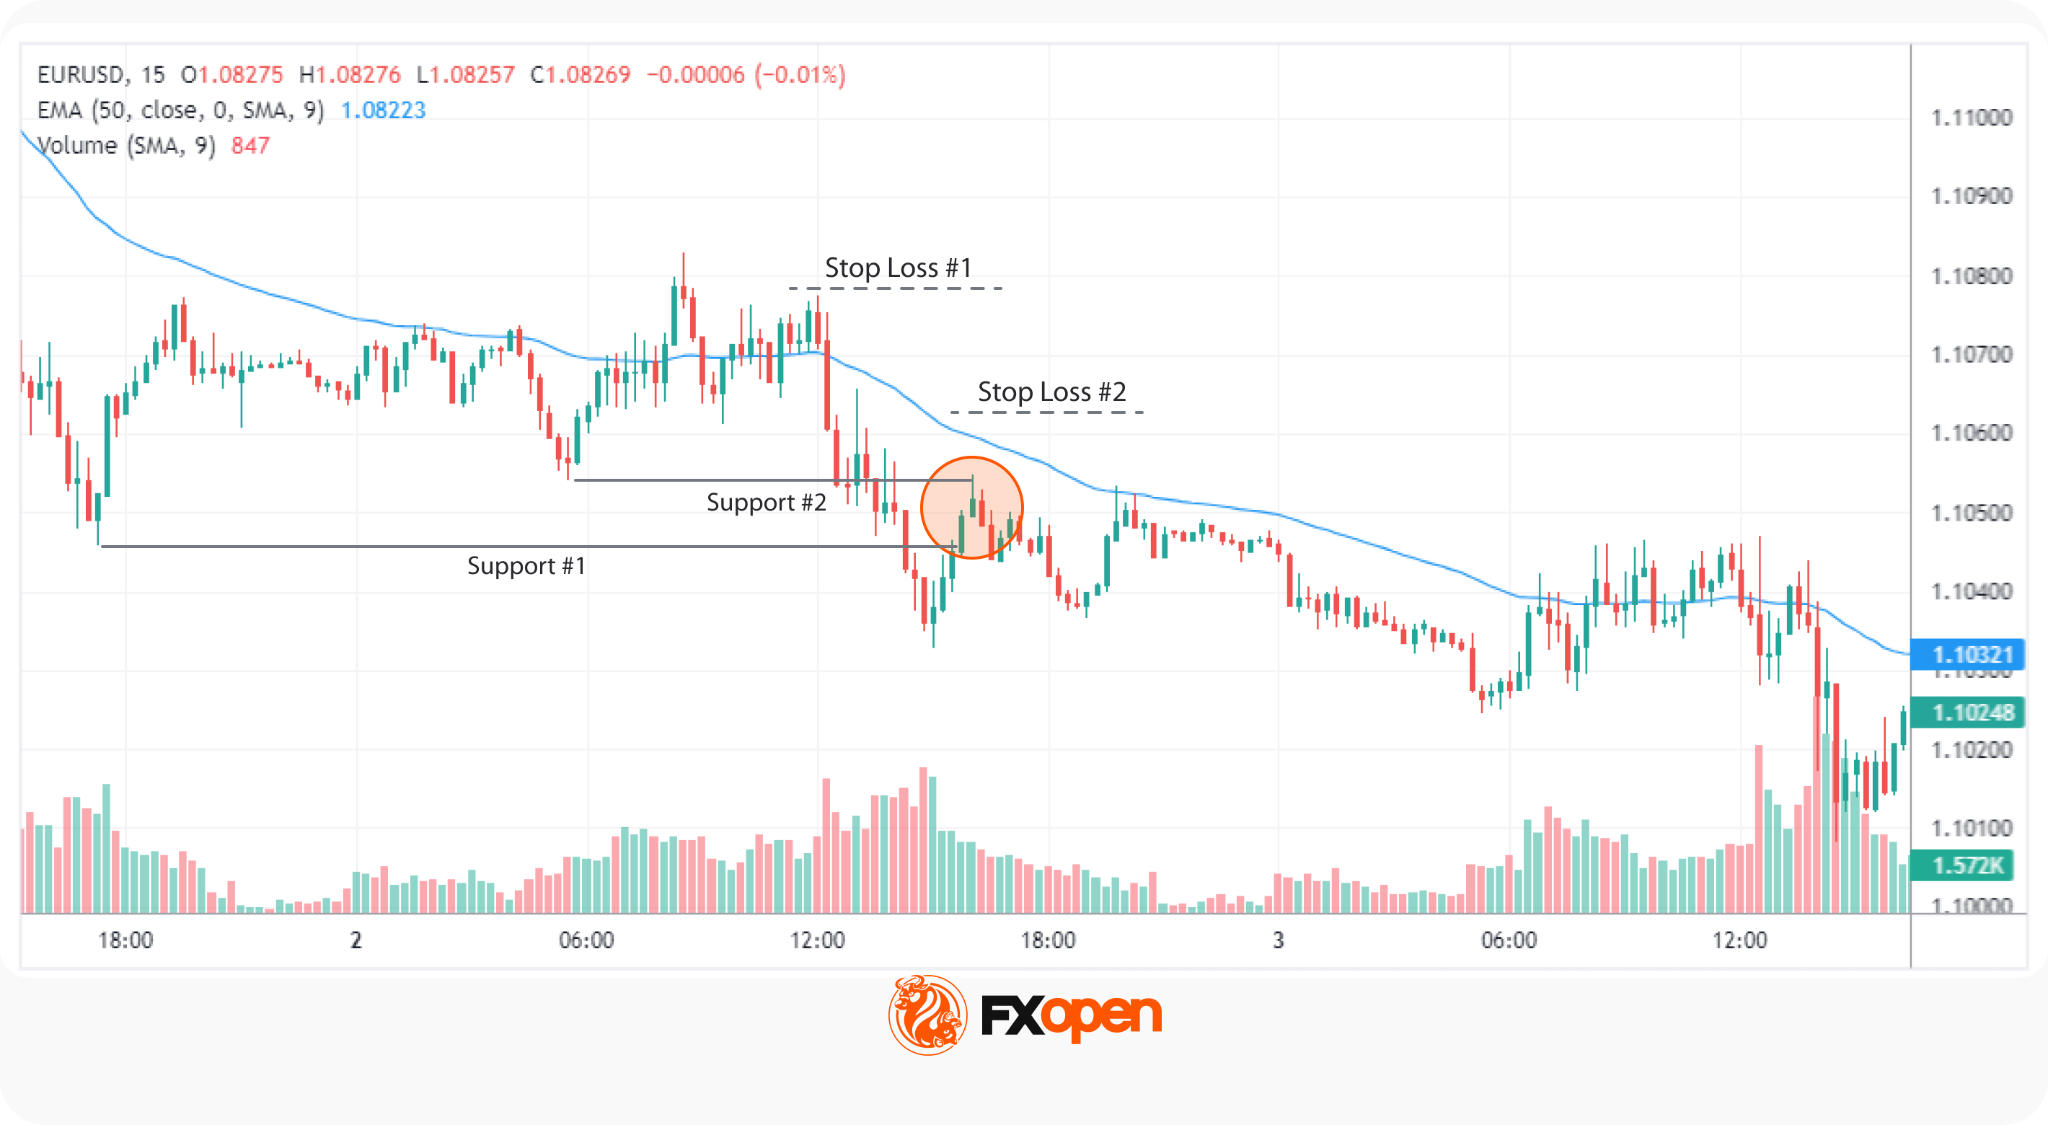
Consider this EUR/USD 15-minute chart, which displays a clear bearish trend. The 50-period Exponential Moving Average (EMA) slopes downward, acting as dynamic resistance with price staying below it. Recently, the price broke below a key support level on higher-than-average volume, signalling the time to apply the break and retest strategy.
Two support levels are worth monitoring. The first sits at the broader structural low. Trading at this level can allow traders to enter the market quickly, though it comes with a less favourable risk-reward ratio.
The second support level is found within the recent brief retracement. This level offers an entry with a tighter stop, improving the risk-reward profile. The trade-off is that price may not retrace deeply enough, leaving traders without a fill.
The entry point is identified by a candle with a wick longer than its body (a pin-bar on the 30m chart), indicating rejection of higher prices as the market retests the second support level. Once this candle closes, traders typically enter at the next candle.
Stop losses would typically be placed either above the last major swing high or the 50-period EMA, depending on individual risk tolerance. Take-profit targets are commonly set at a 1:3 risk/reward ratio, where every pip risked targets three pips of potential return. An alternative is the next significant support level below, where price reaction may develop.
Alternative Entry Scenarios
Not every retest develops the same way. A shallow retest pulls back only marginally before resuming the trend, often leaving conservative traders without a fill. An aggressive entry on the first rejection candle captures these moves but accepts wider initial drawdown risk.
A deep retest pulls back further into the previous range, sometimes to the 50% or 61.8% Fibonacci level of the breakout swing. These setups could offer tighter stops and a stronger risk-reward profile, though they carry a higher chance of the level failing entirely. Ultimately, missed trades are a cost of waiting for confirmation in a breakout trading strategy.
Confirmation Methods in Break and Retest Trading
Price action remains the primary confirmation tool. A rejection candle at the retest level carries more weight than any indicator reading on its own. Indicators, multi-timeframe analysis, Fibonacci levels, and fundamentals are layered on top of that price-action signal rather than used in isolation.
Retest trading confirmation signals gain reliability when two or more methods align around the same level. Conflicting signals are themselves information, often pointing to a setup worth skipping. Here are several methods traders consider:
1. Indicators
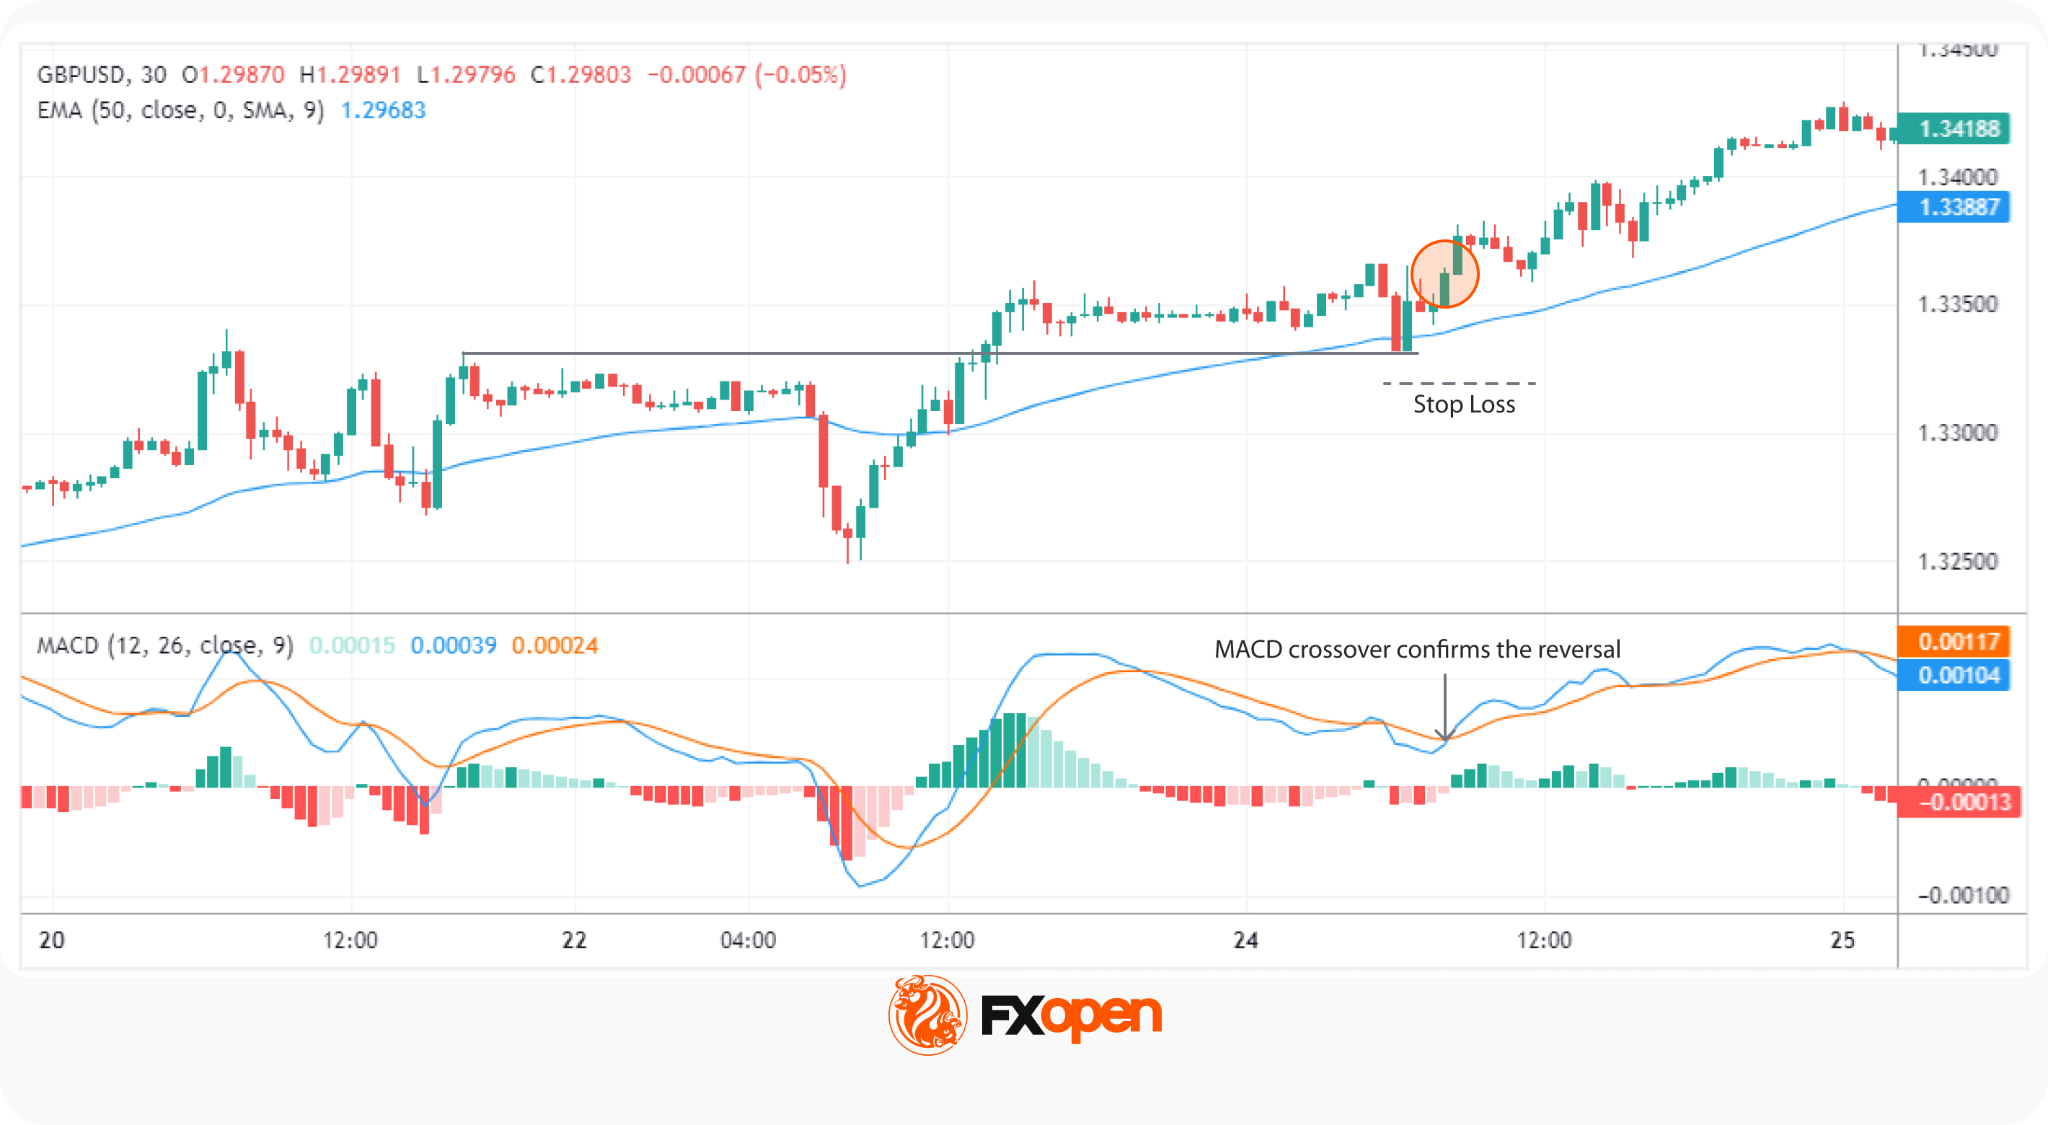
The RSI and MACD are two common break and retest indicators. An RSI crossing below 70 or above 30 during a breakout suggests weakening upside/downside momentum. An MACD line crossing above/below its signal line, or the histogram rising/falling above zero, suggests strengthening bullish/bearish momentum.
2. Multi-Timeframe Analysis
Multi-timeframe analysis works top-down. The higher timeframe (HTF) sets the directional bias, the lower timeframe (LTF) refines entry timing. A breakout observed on a 4-hour chart gains additional confirmation when a strong trend is also visible on a daily chart. Alignment across timeframes filters out lower-timeframe noise.
3. Fibonacci Retracements
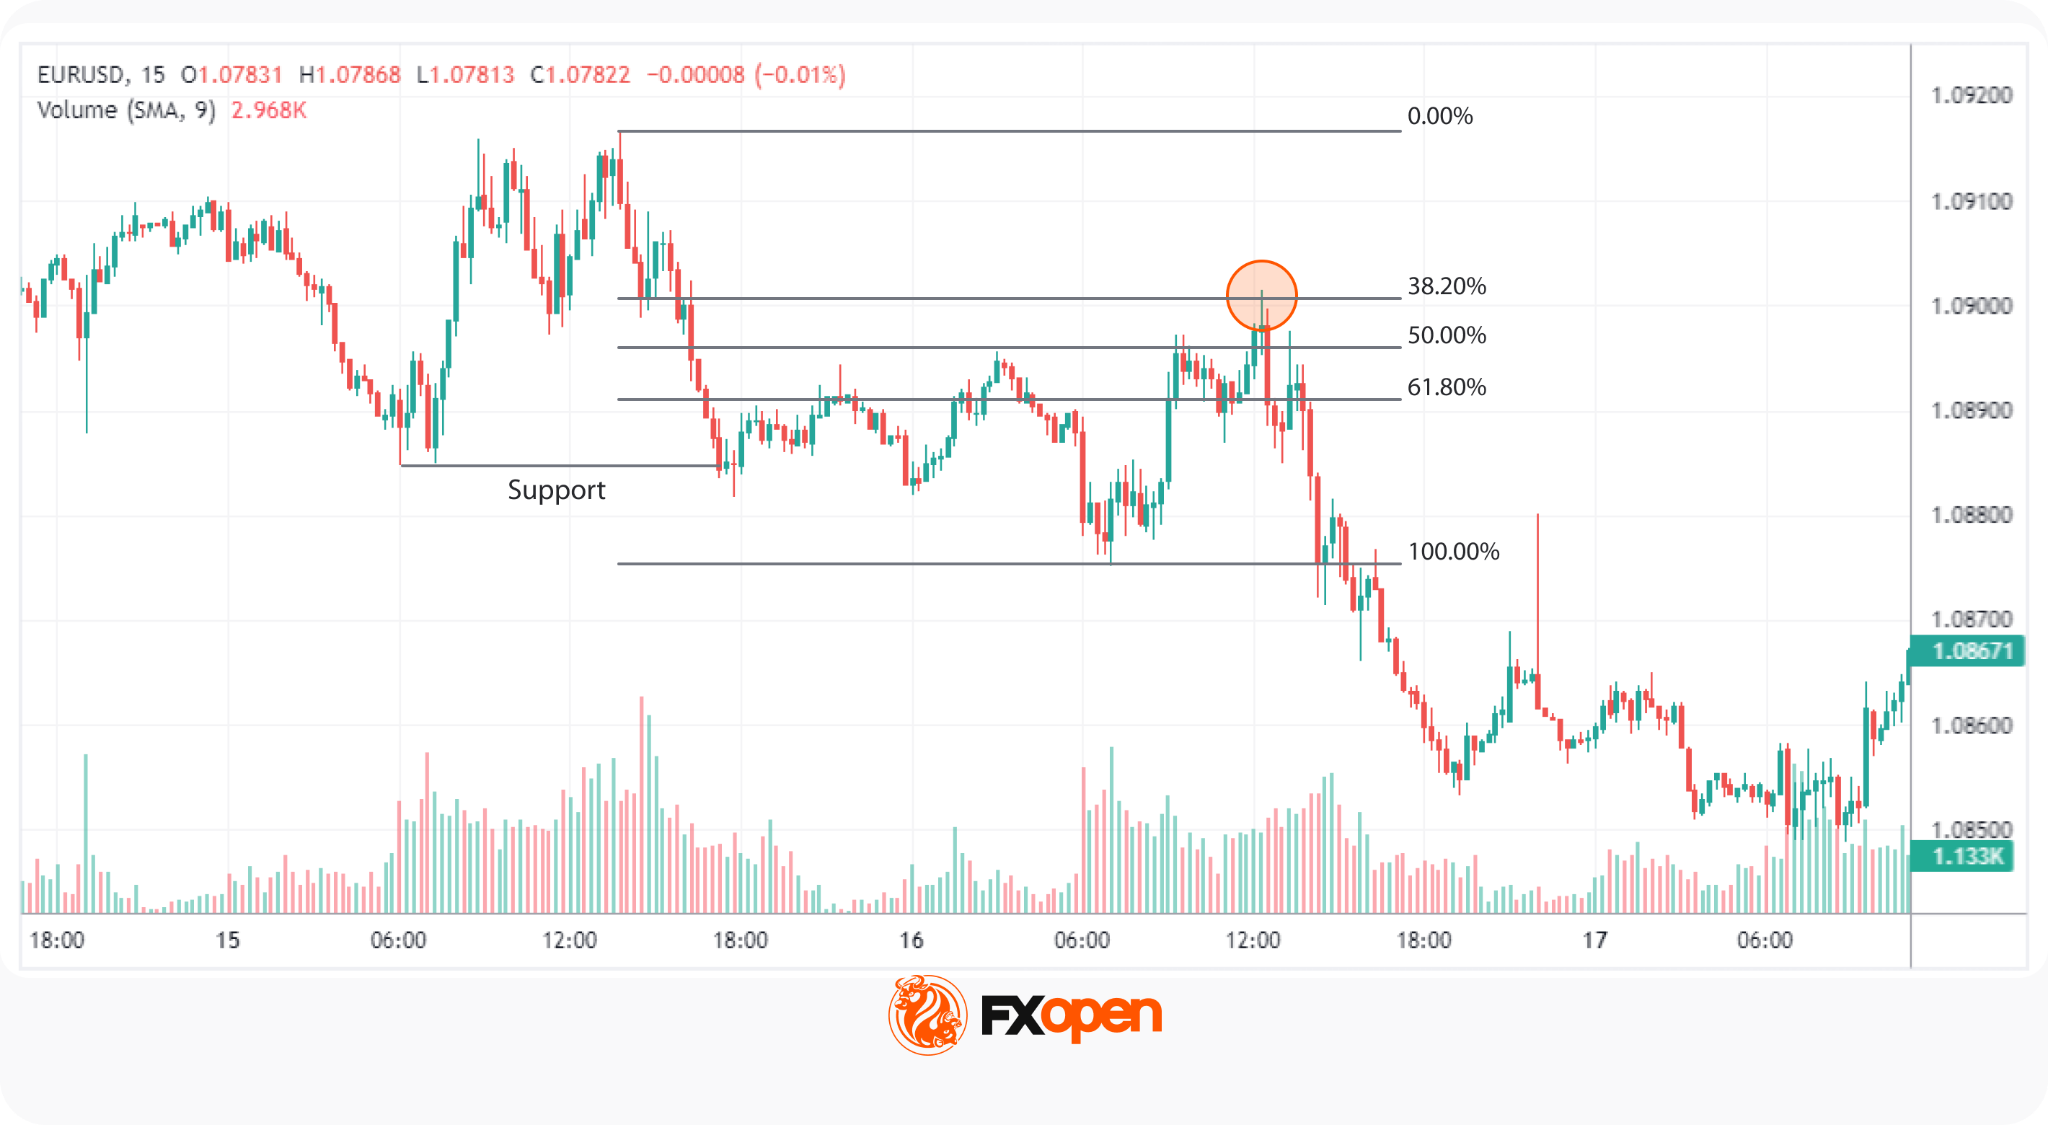
The Fibonacci retracement tool is drawn from the breakout swing high to the breakout swing low (or vice versa for bullish setups). The 38.2%, 50%, and 61.8% levels are the most-watched retest zones. According to theory, a retest that holds at one of these levels carries stronger structural support than a retest at an arbitrary price.
4. Fundamental Analysis
Fundamentals tie technical setups to real volatility drivers. A breakout aligned with a major economic release or central bank decision is more likely to sustain than one occurring in low-volume conditions. Traders typically cross-check an economic calendar for scheduled events around the retest window.
When Break and Retest Conditions Are Valid
Recognising when conditions favour the strategy is as important as the entry mechanics.
Trending markets may produce clearer break and retest setups because a directional bias can support continuation after the breakout. Range-bound or choppy markets generate frequent false breaks, with price flipping back through levels without commitment.
Volatility expansion may support breakout validity. A move accompanied by widening range and rising volume suggests participation behind the price action. A breakout on flat volume often lacks the order flow to sustain.
Session timing may also influence a forex breakout strategy. The London and New York sessions account for a large share of daily forex turnover, while their overlap is often associated with higher liquidity and volatility. As a result, some traders monitor breakouts forming during these periods more closely than those developing in quieter market conditions, where price expansion may be less consistent.
Advantages of the Break and Retest Strategy
The break and retest strategy has several advantages that make it one of the most popular trading approaches:
- Additional Confirmation: The retest serves as an additional validation of the breakout, boosting trader confidence in their entry decision and reducing hesitation.
- Strong Risk Management: Setting stop-loss orders based on the retest level provides a clear risk boundary.
- Alignment with Market Trends: This strategy naturally aligns trades with the prevailing market trend. By trading in the direction of the breakout, traders can take advantage of sustained movements.
- Versatility Across Markets: The breakout and retest strategy can be applied to various financial instruments, including forex, stocks, and commodities. Its adaptability makes it a valuable tool in diverse trading environments.
- Scalability and Flexibility: This strategy can be adapted to different timeframes and trading styles, making it popular among both short-term and long-term traders seeking to implement a consistent approach.
Disadvantages of the Break and Retest Strategy
While the break and retest strategy can be a powerful tool, traders may face several challenges when implementing it:
- False Breakouts: Not every breakout leads to a sustained trend. Sometimes, the price moves beyond a support or resistance level only to reverse shortly after. Recognising these false signals is crucial to avoid entering trades that may quickly turn against expectations.
- Market Conditions: According to theory, this strategy is more popular in trending markets. In sideways or highly volatile environments, breakouts can be less reliable, making it harder to distinguish a strong price movement from random swings.
- Timing the Retest: Accurately determining when the price will retest the broken level can be challenging. Entering too early may expose traders to higher risk, while waiting too long might result in missed trades if the retest doesn’t occur as anticipated.
- Reliance on Confirmation Signals: While additional indicators like RSI or MACD can support the strategy, over-reliance on these tools can complicate decision-making. Traders balance multiple signals without becoming overwhelmed or confused.
- Emotional Discipline: Maintaining discipline during retests is critical. Traders might feel pressured to act quickly if the market moves unexpectedly, leading to impulsive decisions that deviate from their trading plan.
Common Mistakes in Break and Retest Trading
Several recurring mistakes may reduce the effectiveness of the strategy. Recognising them early may help traders manage risk more consistently.
- Early entry. Jumping in on the first touch of the level rather than waiting for a rejection candle leaves the trade exposed to a false breakout. The retest needs to confirm, not just occur.
- Ignoring higher timeframes. When traders ignore a higher-timeframe trend, it may turn valid setups into low-probability trades. A clean retest against the daily-chart direction often fails, even when the lower-timeframe structure looks textbook.
- Chasing breakouts is the opposite error. Entering well after the initial break, with price already extended, could give a poor risk-reward profile and a wider stop. The retest is expected to be the entry, not the breakout candle.
- Overusing indicators clutters the decision. Stacking RSI, MACD, Bollinger Bands, and Stochastics on the same chart produces conflicting signals more often than convergent ones. One or two confirmation tools layered on price action often are more popular than five.
The Bottom Line
This strategy provides a structured approach for trading on breakouts and retests. Understanding how the price may behave after a breakout may support traders in their future decisions. One of the major advantages of the break and retest strategy is that it can be applied across different markets and timeframes. However, traders should note that break and retest trading requires consideration of market conditions and careful risk management.
Traders looking to apply the strategy can consider opening a trading account at FXOpen and gain access to three advanced trading platforms, tight spreads, and low commissions from $1.50 per lot (additional fees may apply).
FAQ
What Is a Retest in Trading?
A retest occurs when the price returns to a broken support or resistance level after an initial breakout. It serves to confirm the strength of the breakout, which may help traders decide whether the new trend will continue or if the breakout was false.
What Is the Break and Retest Strategy?
The break and retest strategy involves identifying a breakout of a key support or resistance level and then waiting for the price to return to that level. Traders use this retest as a confirmation to enter the market, aiming to follow the new trend.
How Many Times Can I Backtest My Strategy?
Backtesting is typically done extensively across different market conditions and timeframes. According to theory, traders need to test a strategy on at least 100 trades to understand how it performs in various scenarios.
Does Retest Always Happen?
No, the retest does not always happen. While retests are common, they are not guaranteed. Traders often use additional confirmation signals and be prepared for both possibilities when applying the break and retest strategy.
Which Timeframe Is Used for Break and Retest Trading?
The break and retest strategy works across timeframes. Higher timeframes such as the 4-hour and daily charts may produce clearer break and retest setups, as price movements can appear less affected by short-term market noise. Lower timeframes may appeal to active traders but can generate more frequent false breaks and less stable retest behaviour.
What Confirms a Valid Retest?
A valid retest is confirmed by price action at the broken level. Rejection candles such as pin bars or engulfing patterns, sustained volume, and alignment with the higher-timeframe trend all add weight. Confirmation matters more than the speed of entry.
Is Break and Retest Suitable for Forex Trading?
Yes. The break and retest strategy is widely applied in forex due to clear support and resistance structure and high liquidity. Major pairs such as EUR/USD and GBP/USD produce frequent setups, particularly during London and New York session overlaps.
This article represents the opinion of the Companies operating under the FXOpen brand only. It is not to be construed as an offer, solicitation, or recommendation with respect to products and services provided by the Companies operating under the FXOpen brand, nor is it to be considered financial advice.
- XRP is holding a tight range near $1.35–$1.36 under pressure.
- Most moving averages and signals still show a dominant downtrend.
- RSI weakness suggests a pause, with $1.35 acting as key support.
XRP is trading at $1.36, sitting almost directly on a key short-term support zone after a steady decline across multiple timeframes.
The price has slipped 7.4% over the past seven days and 6.4% over the past month, extending a broader downtrend that has now reached a 44% drop over the past year.
This puts the current market situation of the Ripple token at the centre of a critical decision point, where bulls and bears are actively testing whether the support at $1.35 can hold.
XRP has entered a tight consolidation phase
XRP has been moving inside a very narrow range between $1.35 and $1.38 over the past 24 hours.

This tight consolidation often reflects hesitation in the market, where neither bulls nor bears have enough momentum to force a clear breakout.
The lower boundary of this range, $1.35, has now become the immediate level to watch.
A clean breakdown below this point would place XRP into a weaker technical structure, with little short-term support visible beneath it.
On the upside, the $1.38 level remains the first resistance barrier, and price has repeatedly failed to sustain moves above it in recent sessions.
But despite this compression, momentum indicators suggest the market is still leaning cautiously.
The 14-day RSI sits at 41.94, which is neutral but tilted toward weakness.
On the weekly chart, RSI drops further to 38.67, which is commonly interpreted as oversold territory.
This divergence between timeframes suggests that while short-term selling pressure is cooling, longer-term momentum remains under stress.
XRP’s technical structure remains under bearish control
A broader look at the trend shows that XRP is still trading below all major exponential moving averages (EMAs) on the daily chart.
These include the 10-day, 20-day, 50-day, 100-day, and 200-day EMAs, which are all positioned above the current price.
This signals a clear bearish structure, where every major trend line is acting as resistance rather than support.
In technical terms, this type of stacking usually reflects a market that has not yet completed a full reversal phase.
In addition, out of 23 tracked technical indicators, 13 are currently pointing to sell signals, while only 3 suggest buying conditions, and 7 remain neutral.
Moving averages alone account for 12 sell signals with zero buy signals, reinforcing the view that the long-term trend has not shifted back in favour of buyers.
At the same time, oscillators like the MACD and the RSI present a slightly different picture. With 3 buy signals against 1 sell signal, short-term momentum indicators show early signs of stabilisation.
However, this has not yet been strong enough to counter the dominant bearish trend formed by the moving averages.
The next directional move will depend heavily on whether buyers can defend the $1.35 support zone or whether selling pressure forces a breakdown into lower price territory.
Short-term estimates point to movement toward $1.39, while broader yearly forecasts place 2026 within a wide range between $0.82 and $2.12.

Hyperliquid and Zcash are leading the altcoin market, but analysts warn that crowded sentiment and stretched indicators may raise pullback risk.
Summary
- Hyperliquid trades near $59 after hitting a $62.18 all-time high on May 21.
- Zcash is up over 100% in 30 days, but traders now watch the $700 resistance zone.
- Analysts warn crowded sentiment and overbought signals may raise pullback risk for both assets.
Hyperliquid traded near $59.11 on May 22 after gaining 29.68% over seven days and 45.77% over the past month. The token reached an all-time high of $62.18 on May 21, while 24-hour volume stood at about $1.42 billion.
The move keeps HYPE among the strongest large-cap crypto assets during a weaker market. Related coverage noted that HYPE broke above $60 on May 21, with ETF demand and DeFi-native speculation helping drive the rally.
Ali Martinez said in a post on X that Hyperliquid’s price action has drawn record social attention. The analyst said HYPE has reached new all-time highs while social media mentions also moved to record levels.
That attention can support momentum, but it can also raise risk. When a trade becomes crowded, traders often watch for signs that late buyers are entering near resistance instead of early in the move.
HYPE traders watch the $60 zone
Ali Martinez said HYPE is approaching a key resistance area while several indicators show possible exhaustion. He pointed to an active TD Sequential Combo 13 sell signal, overbought RSI, and elevated Chande Momentum Oscillator readings.
The analyst said HYPE “could still push toward $59 or even slightly above $60” before momentum fades. He added that rejection from that area could open a move toward about $40. That view is a conditional setup, not a confirmed price path.
Recent HYPE coverage also carried a similar caution. After the break above $60, crypto.news noted that short-term volatility risk remained high even as medium-term structural flows stayed supportive.
Those flows include new listed products. 21Shares launched the first U.S. exchange-traded funds tied to HYPE, including a spot product with staking exposure and a leveraged product. The firm said Hyperliquid handles about $8 billion in daily trading volume and directs more than 95% of fees toward daily HYPE buybacks.
Bitwise has also linked its Hyperliquid ETF fee model to HYPE demand. The asset manager said it would use 10% of management fees from its BHYP product to buy and hold HYPE on its balance sheet.
Zcash price rally faces $700 test
Zcash traded near $645.63 on May 22, down 2.76% over 24 hours but still up 20.35% over seven days and 100.43% over 30 days. Its 24-hour trading volume stood near $690 million, while its market cap was about $10.8 billion.
The rally pushed ZEC close to the $700 area before a mild pullback. The same price data showed a 24-hour range between $645.73 and $682.56, keeping traders focused on whether buyers can reclaim the upper end of the move.
Recent crypto.news coverage said ZEC moved toward $700 after confirming a bull flag breakout. That report linked the rally to regulatory relief, institutional accumulation, and stronger technical momentum.
Ardi said on X that the recovery toward $680 did not look mainly retail-driven. He said retail participation stayed mostly flat while buying came from mid-sized flows, with larger flows starting to recover after the correction.
ZEC traders weigh breakout and reversal risk
Ali Charts said Zcash has climbed more than 40% in one week and is nearing the same $700 to $730 area that caused a major rejection in November. He also said the TD Sequential is flashing a weekly sell signal.
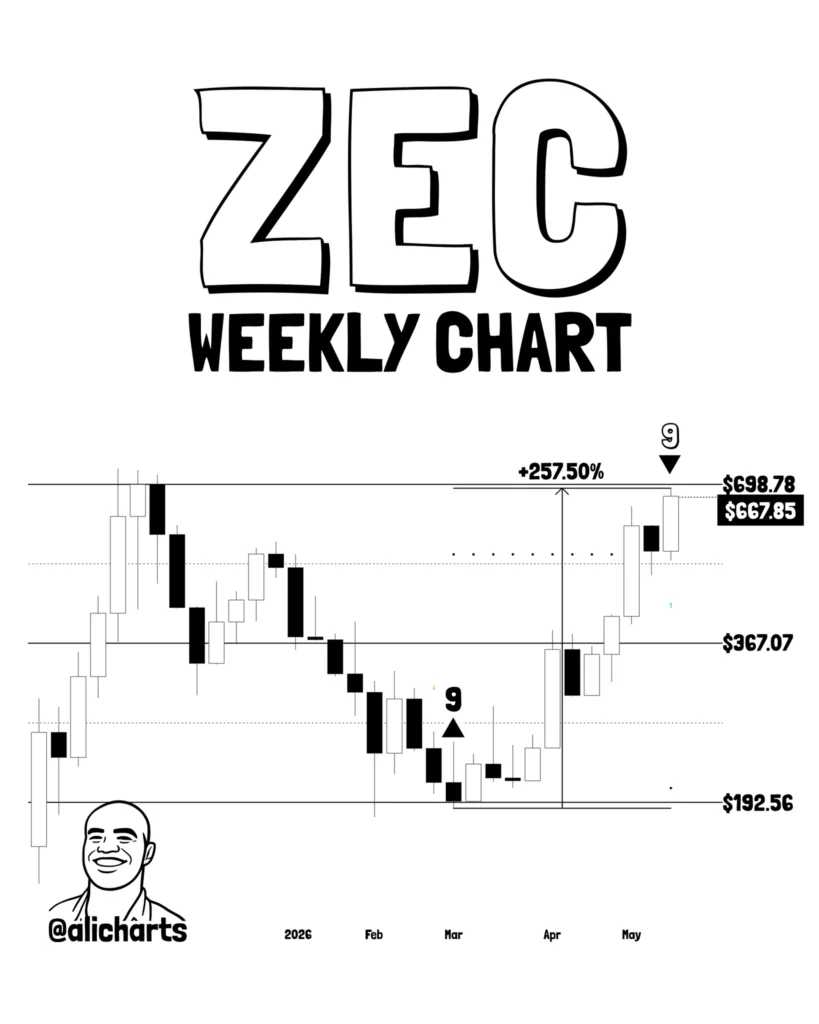
The analyst said the weekly signal matters because any confirmed correction could be larger than a short-term pullback. He mapped a first downside area near $500 and a deeper retracement zone near $380.
That warning fits earlier market caution. A recent crypto.news report said traders had already been weighing a possible $750 target against leverage risk. The report cited concerns that weak spot demand and heavy perpetual trading could expose ZEC to faster reversals if momentum fades.
Another recent report said ZEC’s monthly rally had already crossed 70%, with a golden cross adding to bullish expectations. It also noted that Multicoin Capital’s ZEC accumulation disclosure and rising privacy-asset demand helped fuel the move.
Disclosure: This article does not represent investment advice. The content and materials featured on this page are for educational purposes only.
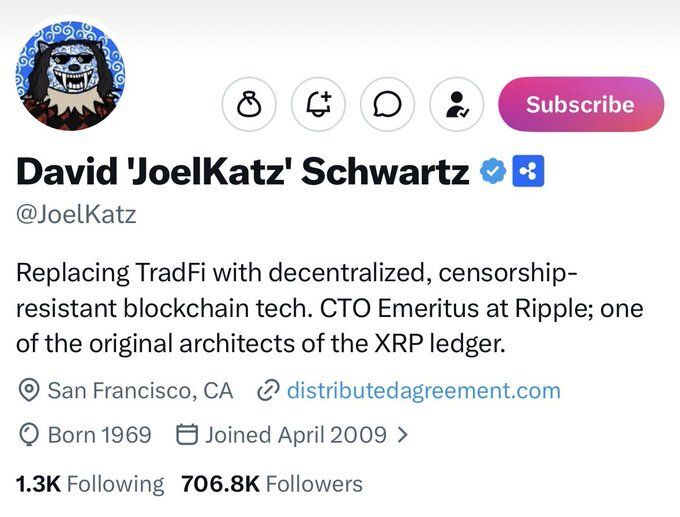
David Schwartz, Ripple’s CTO Emeritus, known on X as @JoelKatz, changed his profile picture to a fuzzy bear image connected to FUZZY, a meme coin on the XRP Ledger (XRPL), reigniting criticism over endorsements and the responsibilities that come with influence.
The update landed with particular force because Schwartz had gone on record against treating meme coins as investments only weeks earlier. His new avatar made that position harder to maintain.
From Trust Lines to Avatars
Schwartz first attracted attention when he opened a trust line for FUZZY, a token inspired by the XRPL’s historic Fuzzybear wallet, which entered network lore with a famous early decentralized exchange order. He was quick to clarify that the step was purely technical. Adding a trust line, he argued, is a routine network action and should not be read as a personal endorsement.
He then called meme coin investing distasteful in explicit terms, pushing back against community members who treat speculative XRP Ledger tokens as serious assets. The framing allowed him to draw a clear line between technical participation and any implied personal backing.
A profile picture change does not carry that technical defense. Critics noted that updating an avatar is a deliberate, voluntary act with no technical justification whatsoever. Several commentators argued that the reasoning Schwartz used to explain the trust line episode simply could not be stretched to cover his X profile.
Meme coin prices have historically reacted to signals from high-profile ecosystem figures. Even informal gestures from someone with Schwartz’s reach can translate into real buying pressure on low-liquidity tokens.

Who Bears the Risk
The stakes extend beyond optics. When a recognized figure links himself publicly to a thinly traded token, some traders interpret the move as endorsement and buy in. Late entrants risk absorbing losses as earlier holders exit. The person who triggered the interest bears no formal responsibility for the outcome.
A Ripple CTO PHNIX surge earlier this year illustrated that pattern. Prices spiked on the signal and then reversed, leaving later entrants exposed.
Schwartz has built credibility through years of commentary on XRP price dynamics and has argued that crypto offers generational wealth potential. Within the meme coin space, influential figures can significantly impact markets, and observers often scrutinize how they exercise or signal that influence.
The post Ripple’s Ex-CTO Switched His Profile Picture to an XRPL Meme Coin appeared first on BeInCrypto.

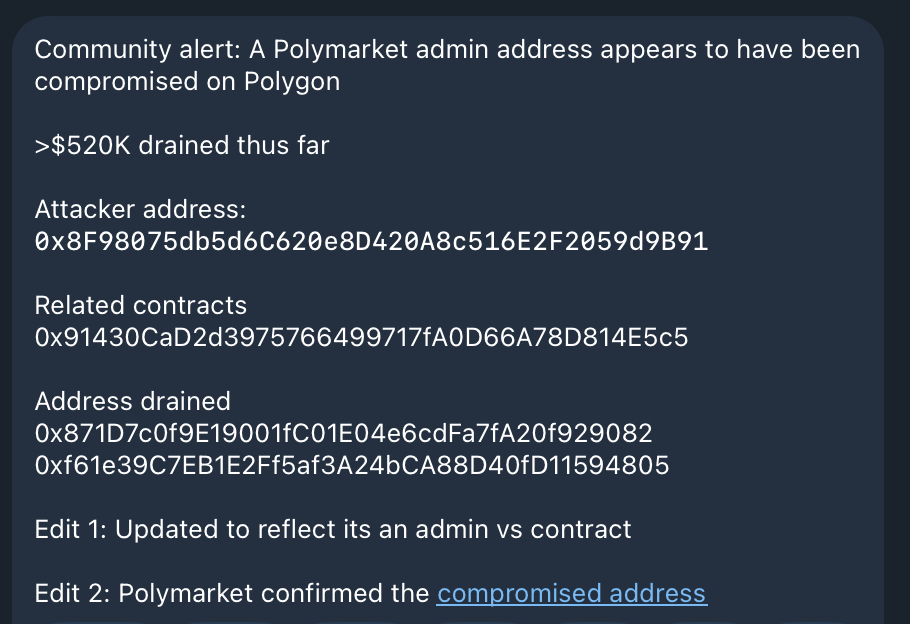
An attacker drained over $600,000 from Polymarket, attacking its UMA CTF Adapter smart contract on Polygon, with on-chain investigator ZachXBT flagging the exploit and identifying the attacker’s wallet as 0x8F98075db5d6C620e8D420A8c516E2F2059d9B91.
ZachXBT issued an emergency alert first on his Telegram channel, followed by Bubblemaps warning users to pause all Polymarket activity as the platform’s losses climbed toward $600,000.
The targeted contract, the UMA CTF Adapter, is the custom integration layer that allows Polymarket’s prediction markets to settle via UMA’s Optimistic Oracle. It is not part of UMA’s audited core protocol.
Discover: The Best Crypto to Diversify Your Portfolio
How the Polymarket Exploit Worked: The Smart Contract Vulnerability
The UMA CTF Adapter is custom integration code written and deployed by Polymarket, not a canonical UMA contract. As UMA’s own documentation makes clear, protocol integrators build their own adapter contracts on top of the Optimistic Oracle, and those adapters carry project-specific logic and trust assumptions that fall entirely outside UMA’s security model.
This structural gap is where the Polymarket exploit found its surface. The CTF Adapter encodes the custom economics and access control that determine how prediction market positions settle and how funds flow.
— ProMint (@ProMint_X) May 22, 2026
 ALERT: Polymarket UMA CTF Adapter Exploited
The Adapter acts as a bridge between the platform and the UMA oracle.
It was via this bridge that the hacker managed to manipulate the system.
Over $500K has been stolen.
The hacker is currently laundering the stolen funds on… pic.twitter.com/K8EcR1SqmW
Polymarket’s core exchange contracts underwent a formal security audit by ChainSecurity in 2021–2022, which reported that all critical issues identified were addressed before mainnet deployment. That audit did not cover the UMA CTF Adapter. The exploit did.
This is a recurring pattern in DeFi platform failures: audits cover only the components submitted for review, not the integration layers bolted on afterward.
Polymarket’s history with oracle-adjacent risk is not new. A prior incident involving erroneous off-chain data fed into Polymarket’s oracle stack, the so-called Paris case, demonstrated that adapter and oracle design represent a systemic weak point for prediction markets, independent of whether the base contracts function correctly.
On-Chain Footprint and What The Data Reveals
Onchain data tracked the attacker removing 5,000 $POL tokens every 30 seconds during the active drain phase, a withdrawal cadence that points to an automated script executing repeated contract calls. By the time the alert was issued, the attacker had extracted approximately $600,000 according to Bubblemaps, with ZachXBT’s figure placing confirmed losses at over $520,000.
The post-exploit behavior is consistent with early-stage on-chain laundering. The attacker dispersed the stolen proceeds across 15 separate wallet addresses in a fragmentation pattern designed to complicate chain-of-custody tracing and slow any freeze or recovery attempt.
As of the time of reporting, the dispersed funds remain distributed across those 15 addresses with no confirmed movement to a mixer or cross-chain bridge. ZachXBT’s public identification of the originating wallet gives investigators a clear on-chain starting point, though the 15-address dispersal complicates any downstream recovery without exchange cooperation.
Discover: The Best Token Presales
The post Polymarket Exploit: 5,000 POL Drained every 30 Seconds appeared first on Cryptonews.
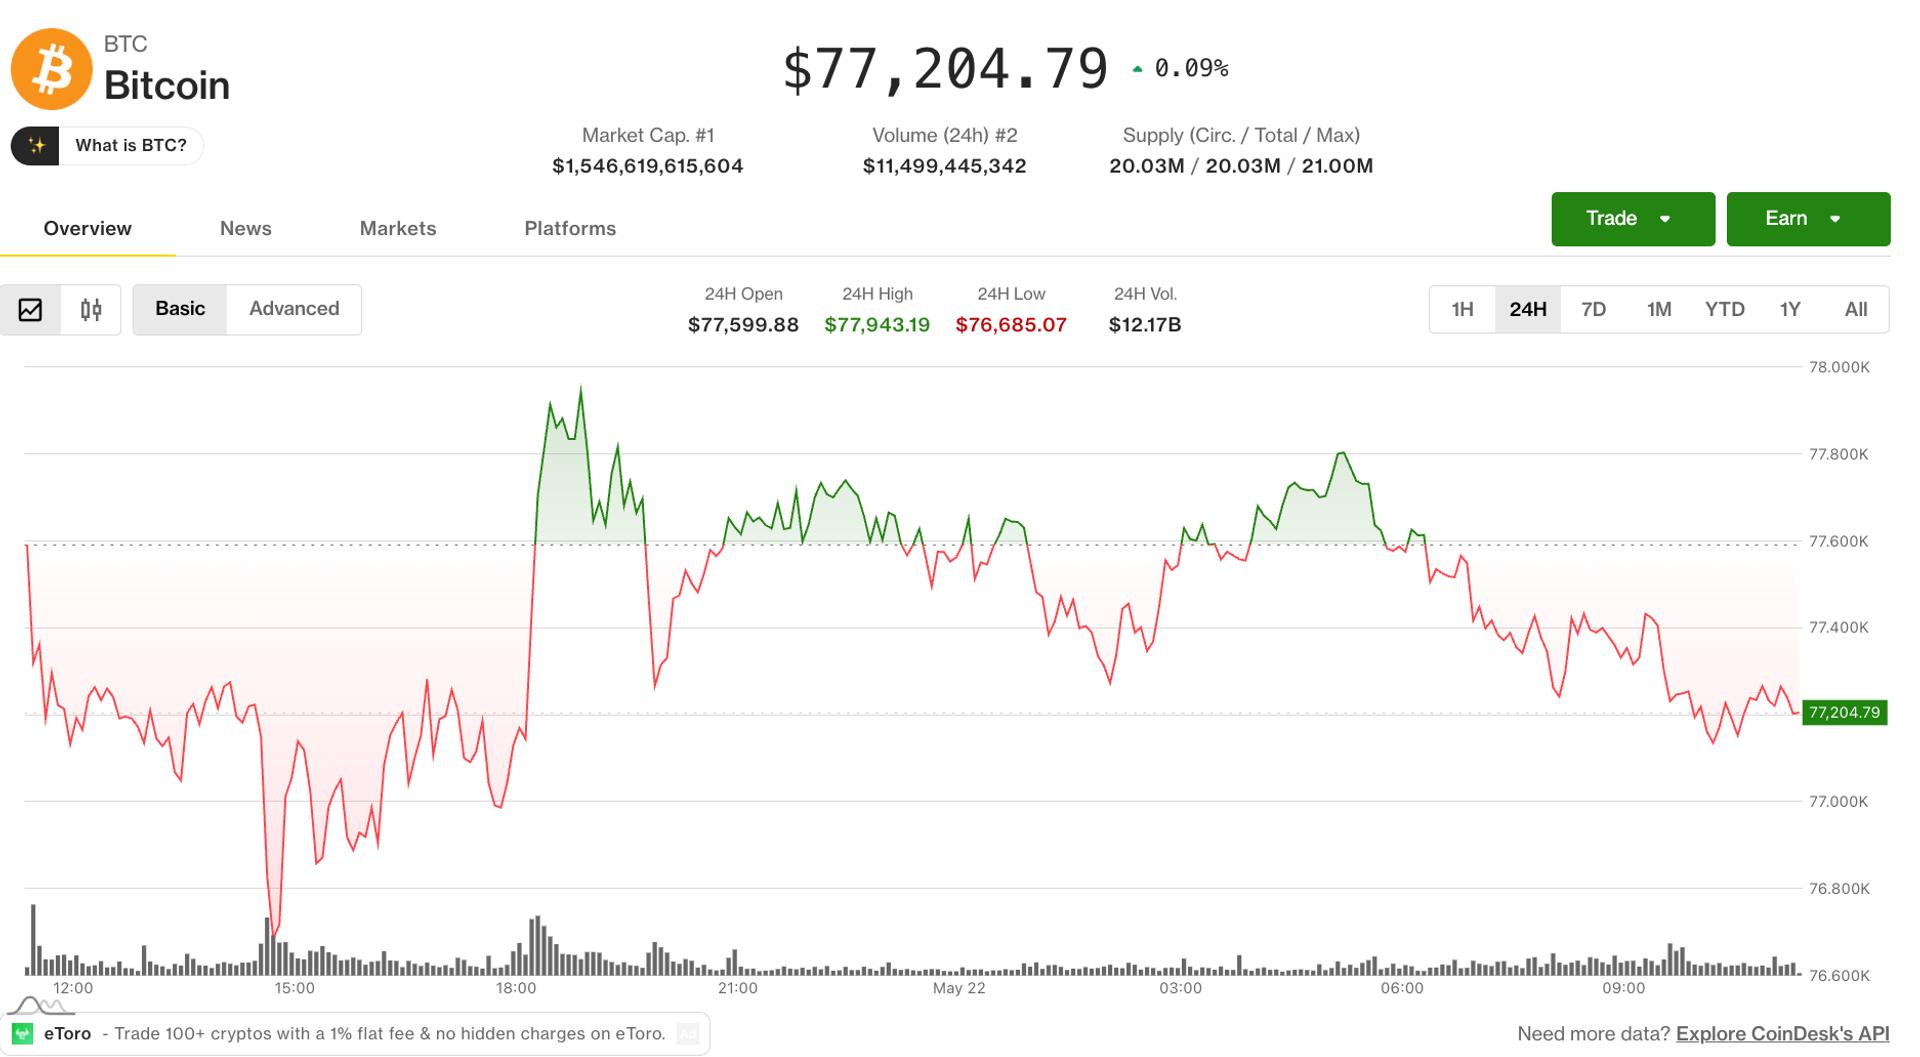

Crypto majors bitcoin and ether (ETH) head into the weekend having been confined to a tight trading range over the past four days, with BTC being trapped between $76,100 and $78,000.
The lack of volatility has led to little pockets of the altcoin market benefitting from the speculative nature of crypto investors. The AI sector was the recipient of such speculation on Friday as NEAR increased by 28.5% while FET posted an 11.4% gain in the past 24 hours.
Conversely, privacy coins DASH, ZEC and XMR experienced a wave of sell pressure on Friday, eroding much of their early week rally, indicating that sector rotation is in full effect.
Brent crude oil dropped to $102 per barrel on Friday, down from $112 seen earlier this week as speculation swirls around a potential peace deal between Iran and the U.S.
U.S. equities responded well to the drop off in oil; Dow Jones Industrial Average closed at a record high on Friday, while Nasdaq 100 and S&P 500 are now up by 3% and 1.7% respectively since Tuesday’s low, suggesting a return to risk-on sentiment.
Derivatives positioning
- Crypto futures market-wide volume rose modestly by 1% to $160 billion in the last 24 hours, while notional open interest (OI) remained stable near $128 billion. Liquidations declined sharply by 26% to $200 million. This setup reflects a calmer market with reduced forced liquidations, even as volume growth remains relatively muted.
- Today’s standout token is Near Protocol’s NEAR, which has gained over 25%. With the price rise, OI in futures tied to the token has surged to a record high of 282.53 million tokens. The OI-adjusted 24-hour cumulative volume delta is positive, a sign of aggressive buying at market orders rather than passive limit orders. This validates the upswing in prices. And last but not least, funding rates remain mildly positive, suggesting healthy leverage conditions and no overheating.
- Markets tied to TRX and LINK display a similar bullish profile, characterized by OI growth, positive CVDs and positive funding rates.
- The bitcoin market offers little excitement, with OI steady in the recent 720K BTC to 750K BTC range. The same can be said for ether.
- Both BTC and ETH’s annualized 30-day implied volatility indices continue to slide. That’s a sign of relentless volatility selling via options, mostly call overwriting.
- On Deribit, bitcoin puts at strikes ranging from $71,000 to $77,000 dominate the 24-hour volume rankings. Similar volume concentration is seen in ether puts. A put option offers protection against price losses in the underlying asset.
Token talk
- CoinDesk’s DeFi Select Index (DFX) was up by 1.1% on Friday, outperforming the CoinDesk Smart Contract Platform Select Capped Index (SCPXC), up by just 0.3%, and the CoinDesk Memecoin Select Index (CDMEME) after it tumbled by 1%.
- The altcoin market was generally a mixed bag on Friday; XRP, SOL and ETH all lost ground alongside the privacy coin sector while the likes of HYPE and ATOM continue to show relative strength, with the later posting a 5% gain since midnight UTC.
- HYPE, the native token of perpetual exchange HyperLiquid, has been its own animal this week – rising to a barnstorming record high after surging by around 60% since Tuesday.
- The move comes alongside heavy short interest and a wave of liquidations coupled with institutional participation following the launch of spot ETFs in the U.S. this month.
- CoinMarketCap’s “altcoin season” indicator rose from 31/100 to 38/100 this week, buoyed by HYPE’s strong performance.

Crypto markets love pretending they run on fundamentals. In reality? A massive part of the market moves because of attention velocity — who’s being talked about, which narrative is trending, what influencers are amplifying, and which meme is capturing the timeline for 48 hours before everyone rotates to the next shiny thing. 😅
The uncomfortable truth is that many traders are not investing in technology, revenue, or long-term adoption. They are trading social gravity.
And sometimes, that matters more than the product itself.
The Market No Longer Trades Fundamentals First
Traditional finance often values assets based on cash flow, earnings, or economic performance.
Crypto operates differently.
A token can rally 300% with:
- no revenue,
- no users,
- no sustainable tokenomics,
- and sometimes no working product.
Why?
Because markets now react to visibility before utility.
If enough people pay attention to a narrative, liquidity follows. Once liquidity arrives, traders chase momentum. Then engagement algorithms amplify the movement even further.
The cycle feeds itself.
In many cases, price is simply the chart representation of collective online attention.
Narrative Rotation Is the Real Market Cycle
Every cycle in crypto develops its own obsession:
- DeFi summer
- NFTs
- Play-to-earn
- AI tokens
- Solana memes
- Restaking
- RWAs
- Telegram trading bots
- Perp DEXs
The pattern rarely changes.
Capital rotates toward the story, attracting the most engagement at a specific moment.
Sometimes the underlying technology is genuinely innovative. Other times, the narrative arrives years before actual adoption.
But traders often don’t care.
They only need enough momentum to front-run the next wave of attention.
This is why entire sectors can explode in valuation before proving product-market fit. The narrative itself becomes the asset.
Influencers Became Market Infrastructure
Crypto influencers are no longer just commentators.
Many effectively function as liquidity routers.
A single large account posting about a low-cap project can:
- trigger retail inflows,
- create trending discussions,
- activate algorithmic visibility,
- attract copy traders,
- and generate enough momentum for price expansion.
This creates a dangerous feedback loop.
Projects increasingly optimize for influencer exposure instead of product quality because attention has become a monetizable infrastructure.
The incentive is obvious:
- building takes years,
- Virality takes one tweet.
As a result, some teams prioritize:
- aesthetic branding,
- meme creation,
- engagement bait,
- rage farming,
- and influencer partnerships
over actual protocol development.
And honestly? The market often rewards them for it.
Engagement Farming Is the New Yield Farming
A few years ago, crypto users farmed liquidity incentives.
Today, many farm impressions.
CT (Crypto Twitter) evolved into an economy where attention itself has financial value:
- more visibility = more followers,
- more followers = more influence,
- more influence = more deal flow,
- More deal flow = more monetization opportunities.
This changes user behavior dramatically.
People post extreme predictions because outrage spreads faster.
They recycle bullish narratives because optimism attracts engagement.
They post “alpha” threads because authority converts into social capital.
In some cases, traders are no longer analyzing markets.
They are analyzing what other people will pay attention to next.
That’s a completely different game.
Memetic Momentum Is Stronger Than Logic
Memes simplify complexity into emotion.
And markets move emotionally far more often than people admit.
A meme coin with:
- strong branding,
- recognizable humor,
- viral community culture,
- and relentless online presence
can outperform technically superior projects simply because it captures the collective imagination.
Memes spread faster than research reports.
Jokes travel faster than whitepapers.
Identity spreads faster than utility.
This is why memetic momentum became one of the strongest forces in crypto markets.
At scale, attention itself becomes liquidity.
The Attention Economy Created Reflexive Markets
Crypto is uniquely reflexive.
Attention drives price.
Price attracts more attention.
More attention attracts more buyers.
More buyers push the price higher.
This loop continues until attention fades.
Then the reverse happens just as violently.
This explains why:
- dead ecosystems suddenly revive,
- abandoned narratives return,
- low-quality tokens temporarily outperform,
- And fundamentally strong projects can remain ignored for years.
Visibility often matters more than value creation in the short term.
That doesn’t mean fundamentals are irrelevant.
It means fundamentals frequently lose to narrative timing.
The Dangerous Part Most Traders Ignore
Many users believe they are trading technology.
In reality, they are often trading crowd psychology amplified by algorithms.
That distinction matters.
Because once attention becomes the primary driver:
- volatility increases,
- conviction weakens,
- narratives shorten,
- and markets become increasingly emotional.
This environment rewards speed, positioning, and social awareness more than deep technical understanding.
The smartest traders in modern crypto are not just reading charts anymore.
They are reading timelines.
Final Thoughts
Crypto has evolved into one of the purest attention markets ever created.
The winners are not always the best builders.
Sometimes they are simply the best storytellers.
And whether people admit it or not, much of modern crypto speculation revolves around one thing:
Capturing attention before everyone else notices where it’s flowing next.
REQUEST AN ARTICLE

The SEC’s move to permit third-party listings of tokenized stocks could reshape on-chain market structure, raising questions about liquidity concentration and where revenue accrues as markets fragment across multiple blockchain networks. While proponents see practical benefits, researchers warn that fragmentation could pose real risks to price discovery and market efficiency.
According to Tiger Research director and head of research, Ryan Yoon, liquidity fragmentation may occur as capital migrates away from centralized venues to a broader set of blockchain platforms and decentralized exchanges.
“Traditional finance views the breakup of its previously consolidated, centralized liquidity as a serious structural threat,”
Yoon said, underscoring the potential for trading to spread across disparate networks rather than concentrate on established venues like the NYSE or Nasdaq. When the same listed stock is tokenized and traded across multiple networks, order flow could become dispersed, leading to price discrepancies and higher slippage on sizeable orders—ultimately eroding market efficiency.
The analysis comes in the wake of the SEC’s recent “innovation exemption” plan, announced earlier in the week, which would allow third-party exchanges to list tokenized stocks without requiring issuer approval. The regulatory move aims to accelerate on-chain access to traditional equities, but observers caution that the initial scope and implementation remain unsettled. announced this exemption as part of a broader effort to modernize how tokenized assets are treated in U.S. markets.
Key takeaways
- The SEC’s innovation exemption could enable third-party exchanges to list tokenized stocks without issuer consent, altering market infrastructure.
- Experts warn liquidity fragmentation across blockchains could cause price differences, higher slippage on large trades, and reduced market efficiency.
- Revenue fragmentation may shift value away from domestic exchanges, with potential implications for national financial competitiveness.
- On-chain activity in tokenized stocks is expanding, as evidenced by growing open interest on certain decentralized venues.
- Benchmarked benefits—faster settlement, fractional ownership, lower costs, and around-the-clock trading—are cited as practical incentives, though regulatory clarity remains incomplete.
Liquidity fragmentation and market efficiency
At the heart of the debate is whether tokenized stocks will concentrate liquidity on a single venue or spread it across multiple chains and decentralized platforms. Yoon emphasized that dispersing liquidity undermines the traditional model where large-cap equities benefit from deep, centralized order books. The concern is not merely about where trades occur, but how price formation unfolds when activity is split among competing ecosystems. If broad adoption proceeds on several networks, traders—especially institutions placing sizable orders—could face inconsistent pricing and higher costs just to execute similar exposure across platforms.
Proponents counter that tokenized assets unlock new efficiencies, such as peer-to-peer settlement and continuous access to markets beyond standard U.S. hours. Still, the practical impact of fragmentation depends on the balance of liquidity, custody arrangements, and the ability of on-chain venues to deliver robust price discovery relative to traditional venues. In the near term, observers will be watching whether new listings on third-party platforms concentrate sufficient liquidity to prevent persistent mispricings.
Revenue fragmentation and competitiveness
A second structural concern raised by Yoon is how revenues flow in a multi-chain environment. If tokenized stocks trade across various platforms and geographies, revenue that would typically accrue to domestic exchanges could be dispersed, potentially affecting national financial competitiveness. The shift mirrors broader debates about how blockchain-based markets may reallocate economic value away from traditional hubs and toward on-chain ecosystems with global reach.
Market activity on decentralized venues already illustrates the broader dynamics at play. Hyperliquid, a decentralized exchange focused on real-world assets, has reported an open interest milestone—reaching the mid-double-digit billions in recent weeks—highlighting how demand for on-chainRWA trading continues to grow even as the regulatory landscape evolves. In parallel, observers note that tokenized securities currently represent a small but growing slice of on-chain value, with tokenized stocks accounting for about 4.4% of total on-chain real-world asset value, per data aggregator RWA.xyz.
Industry voices warn that the evolution could force incumbents to reassess their on-chain strategies. Maja Vujinovic, chief strategist for digital assets at FG Nexus, cautioned that markets may split into “disconnected pools” that could generate price-tracking errors and shadow-shorting vulnerabilities if localized buyers fail to stabilize a token’s price across networks. The overarching question is whether the ecosystem can cultivate sufficiently broad liquidity and robust price formation across diverse venues to prevent instability as tokenized equities gain traction.
Market momentum is real, but the path forward remains unsettled. Tokenized stocks are already being discussed as part of broader debates about how real-world assets can be efficiently represented on-chain, with the potential to reshape access to U.S. equities for global investors who face brokerage limitations of traditional markets.
As regulatory clarity continues to unfold, observers emphasize that the current discussions are less about a single policy moment and more about the framework that will govern tokenized assets in the coming years. Hester Peirce, SEC Commissioner, noted that any exemption would be scoped narrowly, restricting digital representations to those corresponding to underlying equities that investors can already purchase in the secondary market. The final contours of what will be permitted remain to be finalized, and stakeholders will be watching how the rule interacts with custody standards, settlement timelines, and market surveillance.
Practical market benefits and adoption momentum
Despite the tensions, there are practical arguments in favor of tokenized stock trading. Advocates point to potential improvements in settlement speed, fractional ownership, and lower transaction costs, along with the possibility of 24/7 trading that could broaden market access. The Blockchain Council has highlighted these benefits as part of a broader push to modernize how equity exposure is accessed and traded. For non-U.S. investors, tokenized stock products could provide easier entry into U.S.-listed equities without relying on traditional brokerage rails.
Industry observers also note that some market participants anticipate a gradual migration of flows onto on-chain rails as regulation clarifies and infrastructure matures. Siebert Financial’s senior research analyst Brian Vieten suggested that the industry could accelerate the transition of the U.S. financial system from legacy rails to blockchain-enabled infrastructure. He added that a portion of this flow might eventually move toward high-quality networks like Bitcoin and specialized platforms such as Hyperliquid as the market tests the new regime.
What to watch next
The coming weeks will be critical for observing how the SEC’s exemption is scoped and how exchanges respond to the evolving regulatory framework. Key questions include how custody, settlement cycles, and corporate actions will be handled for tokenized stocks, and whether liquidity will consolidate quickly on a few dominant networks or remain fragmented across multiple platforms. Investors and builders should monitor open-interest trends, the emergence of liquidity metrics across networks, and any regulatory disclosures that clarify the permissible scope of tokenized equity representations.
Ultimately, the trajectory of tokenized stocks will hinge on whether on-chain markets can deliver reliable liquidity and accurate price discovery while preserving investor protections. The next developments in policy detail, exchange implementations, and cross-network trading infrastructure will reveal how far the promise of tokenized equities can translate into a durable, global market.
As the regulatory dialogue continues, readers should keep an eye on how volume and liquidity converge across platforms, how revenue distributions evolve, and which networks emerge as the preferred rails for tokenized equity trading in a rapidly expanding on-chain market.

Polymarket Seeks Japan Entry Amid Global Scrutiny: Report

The House Article | Mythos And AI Hacking: A High-Stakes Cybersecurity Arms Race

Astros vs. Cubs odds, prediction, line, time: 2026 MLB picks for May 22 from proven model


-

 Crypto World6 days ago
BloFin War of Whales 2026 Grand Prix opens registration for $5M trading championship
-

 Fashion7 days ago
Weekend Open Thread: Theory – Corporette.com
-

 Crypto World7 days ago
E-Estate Announces 1 Year Live: Washington DC Summit as Real Estate Tokenization Enters Its Next Phase
-

 Tech6 days ago
Google reimburses Register sources who were victims of API fraud
-

 Business7 days ago
H&R Real Estate Investment Trust (HR.UN:CA) Q1 2026 Earnings Call Transcript
-

 Entertainment7 days ago
David Letterman Returns to Late Show, Blasts Cancellation
-

 Sports6 days ago
Napoleonic enters 2026 Doomben 10,000 field via Abounding withdrawal
-

 Crypto World7 days ago
BeInCrypto 100 Institutional Awards Nomination: KAST for Best Digital Assets Neobank and Best Digital Assets Fintech
-
 Crypto World6 days ago
Bitcoin Battles US Bond Nerves With BTC Price Dip Toward New May Lows
-

 Crypto World7 days ago
ICE and CME urge US regulators to curb Hyperliquid energy trading
-
 Crypto World6 days ago
Wall Street’s Boldest Gold Prediction Has Russians Rushing to Buy
-

 Fashion5 days ago
On the Scene at Gucci’s Cruise Show in New York City: Mariah Carey, Kim Kardashian, Lindsay Lohan, Iman, and More!
-

 Crypto World6 days ago
IREN closes $3 billion convertible notes deal amid AI infrastructure expansion
-

 Fashion6 days ago
Trending Western Style Vests Perfect for Summer
-

 Politics6 days ago
Watch: far-right flag-fanatics run over victim, attack locals – Setup By the Left wing for your entertainment
-

 Crypto World17 hours ago
Blockchain.com files with SEC for U.S. IPO
-

 Fashion7 days ago
Creative Ideas for Custom T-Shirts
-

 Fashion5 days ago
Amazon Sundays: Memorial Day Hosting
-

 Crypto World7 days ago
Crypto Market Structure Bill Clears Committee; Senate Vote in Focus
-
 Fashion7 days ago
Philip Jones Wedding Jewellery For Women
You must be logged in to post a comment Login