

Crypto World
ICT Turtle Soup Trading Strategy Explained

The ICT Turtle Soup is a price action strategy built around false breakouts. It targets failed moves at major support and resistance levels across forex and other markets. Turtle Soup trading focuses on liquidity sweeps that trap breakout traders before price reverses. It uses the reversal that often follows a stop run for entry timing.
This article covers the Turtle Soup forex setup along with its core components. Let’s discuss the conditions traders watch for and the entry framework that goes with them.
What Is the ICT Turtle Soup Pattern?
The ICT Turtle Soup is a reversal approach based on failed breakouts at key support and resistance levels. This forex reversal strategy comes from the Inner Circle Trader (ICT) methodology and frames failed moves as setups.
Traders aim to identify and take advantage of situations where the price briefly moves beyond a major support or resistance level, only to reverse direction shortly after. This movement is often seen in ranging markets where prices oscillate between established highs and lows.
The concept behind ICT Turtle Soup trading is rooted in the idea of stop hunts and market imbalances. When the price breaks out, it often triggers stop-loss orders set by other traders, creating a temporary imbalance. A failed breakout occurs when price returns inside the prior range after sweeping a swing level.
The ICT Turtle Soup strategy seeks to capitalise on this by entering trades in the opposite direction once the breakout fails and the price returns to its previous range.
The ICT version adapts the original Turtle Soup setup from Linda Raschke and Larry Connors. In the ICT strategy, forex traders apply it on intraday charts using liquidity and order flow, not fixed 20-day breakout rules.
Typically, traders look for signs of a false breakout. This often shows as price briefly moving above a recent high or below a recent low. Price then fails to sustain the move.
ICT Turtle Soup vs Breakout Strategies
The Turtle Soup strategy and standard breakout trading sit on opposite sides of the same setup. Breakout traders typically enter when price clears a high or low, expecting momentum to continue. ICT Turtle Soup traders wait for that move to fail, then look to position in the opposite direction.
The choice between Turtle Soup vs a breakout strategy depends on the prevailing market context. Breakouts typically work in trending conditions where buying or selling momentum drives continuation. Turtle soup setups work around range edges where liquidity sits and breakouts often fail.
Core Elements of the ICT Turtle Soup Setup
The ICT Turtle Soup setup uses several elements working together to identify failed breakouts. Each element provides context for where price might sweep liquidity before reversing back inside the prior range.
The core elements traders typically work with include:
- Order flow and market structure across higher and lower timeframes
- Liquidity and stop hunts at swing highs and swing lows
- Internal and external liquidity zones inside the range
- Order blocks and imbalances as supportive context
Each element below shows how price typically reacts during a Turtle Soup trading setup.
Order Flow and Market Structure
Order flow and market structure are critical in analysing the ICT Turtle Soup pattern. This involves observing price movements and traders’ behaviour in different timeframes.
Order flow refers to the sequence of buying and selling activity that drives price. Market structure organises that activity into recognisable patterns of highs and lows. Together, they describe the directional bias of a market.
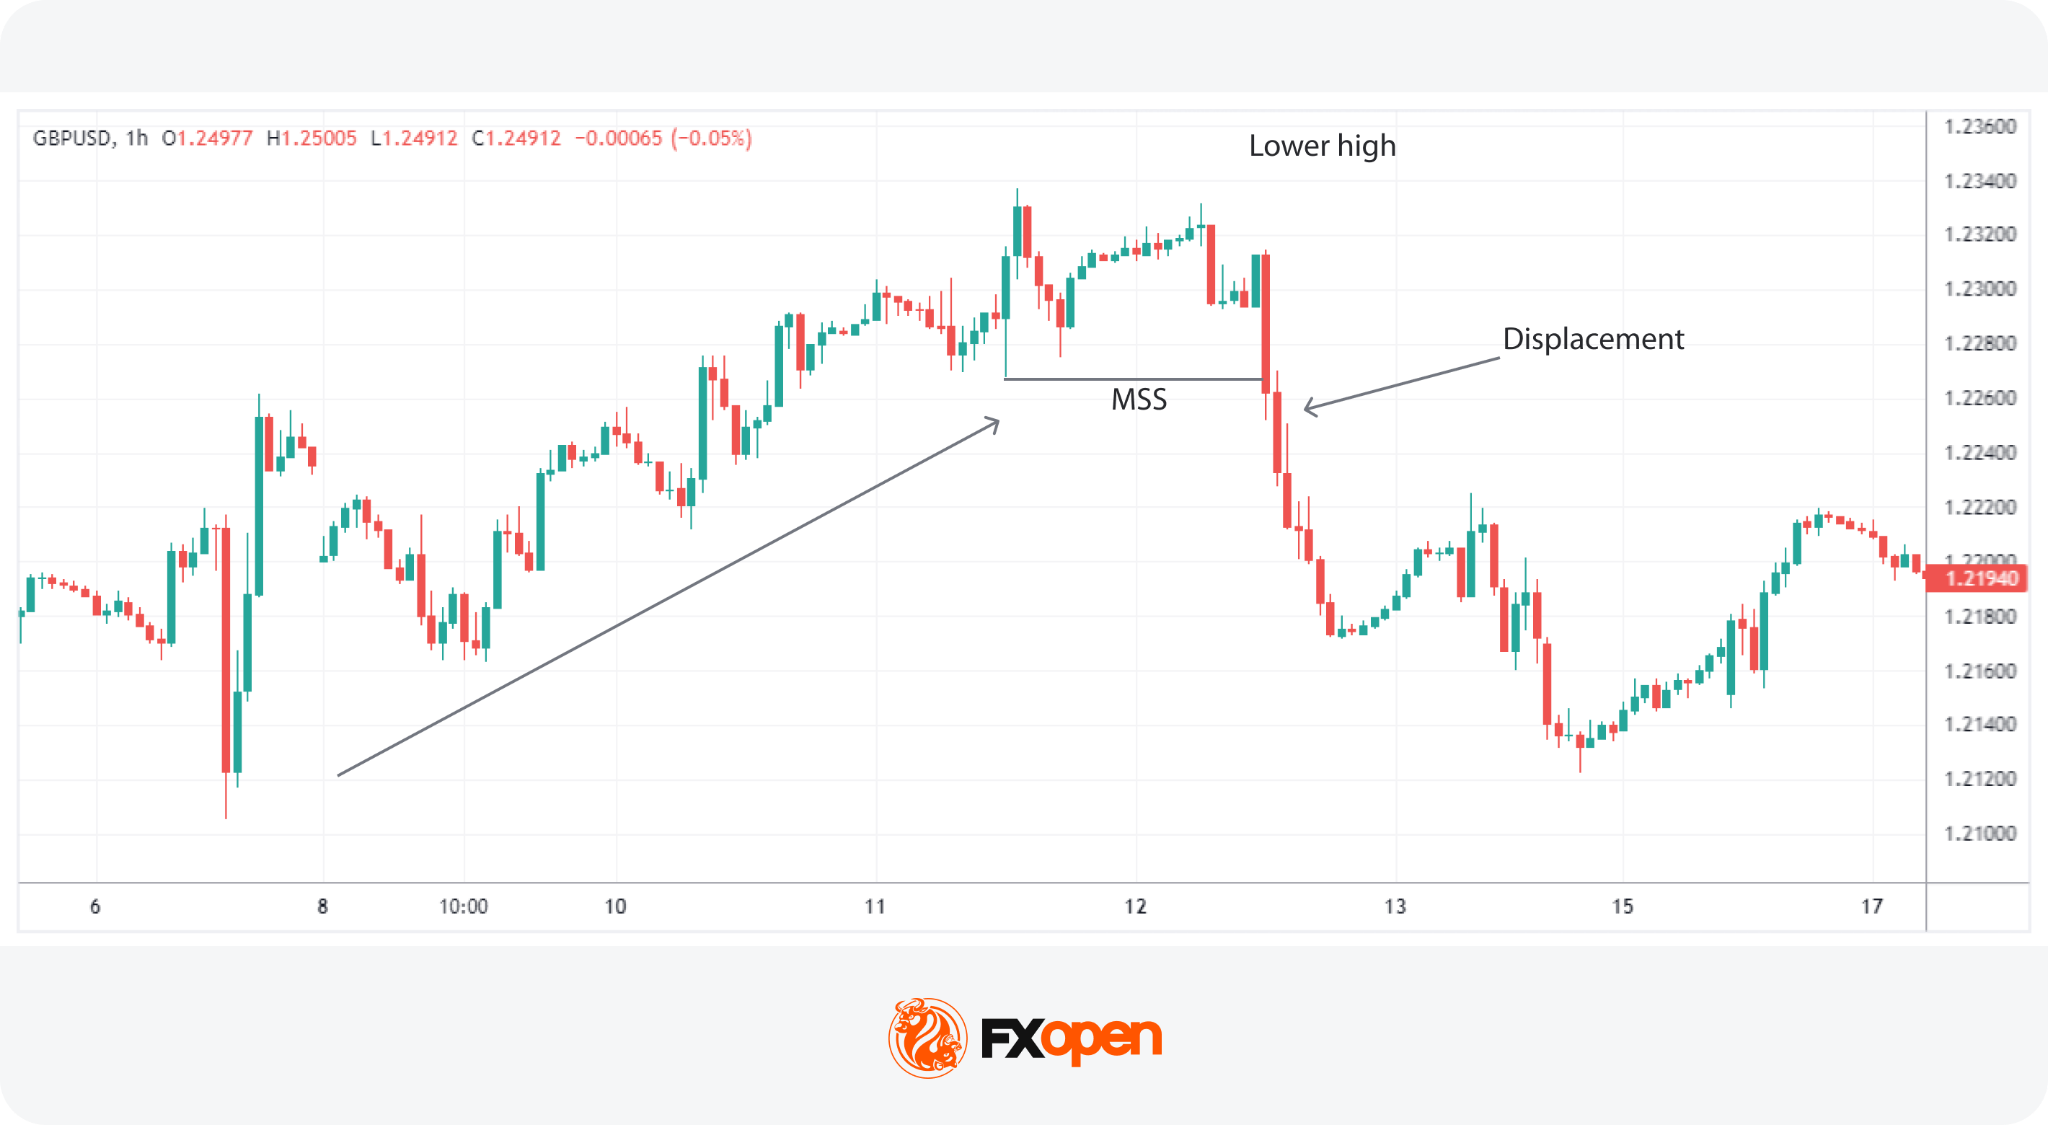
Traders also track a Market Structure Shift (MSS), which signals a potential change in trend direction. An MSS appears when price breaks an opposing swing point with displacement. Displacement here means a strong, single-direction candle that closes well beyond the broken level.
If you want to analyse higher and lower timeframe price movements, consider using FXOpen’s TickTrader platform.
Higher Timeframe Structure
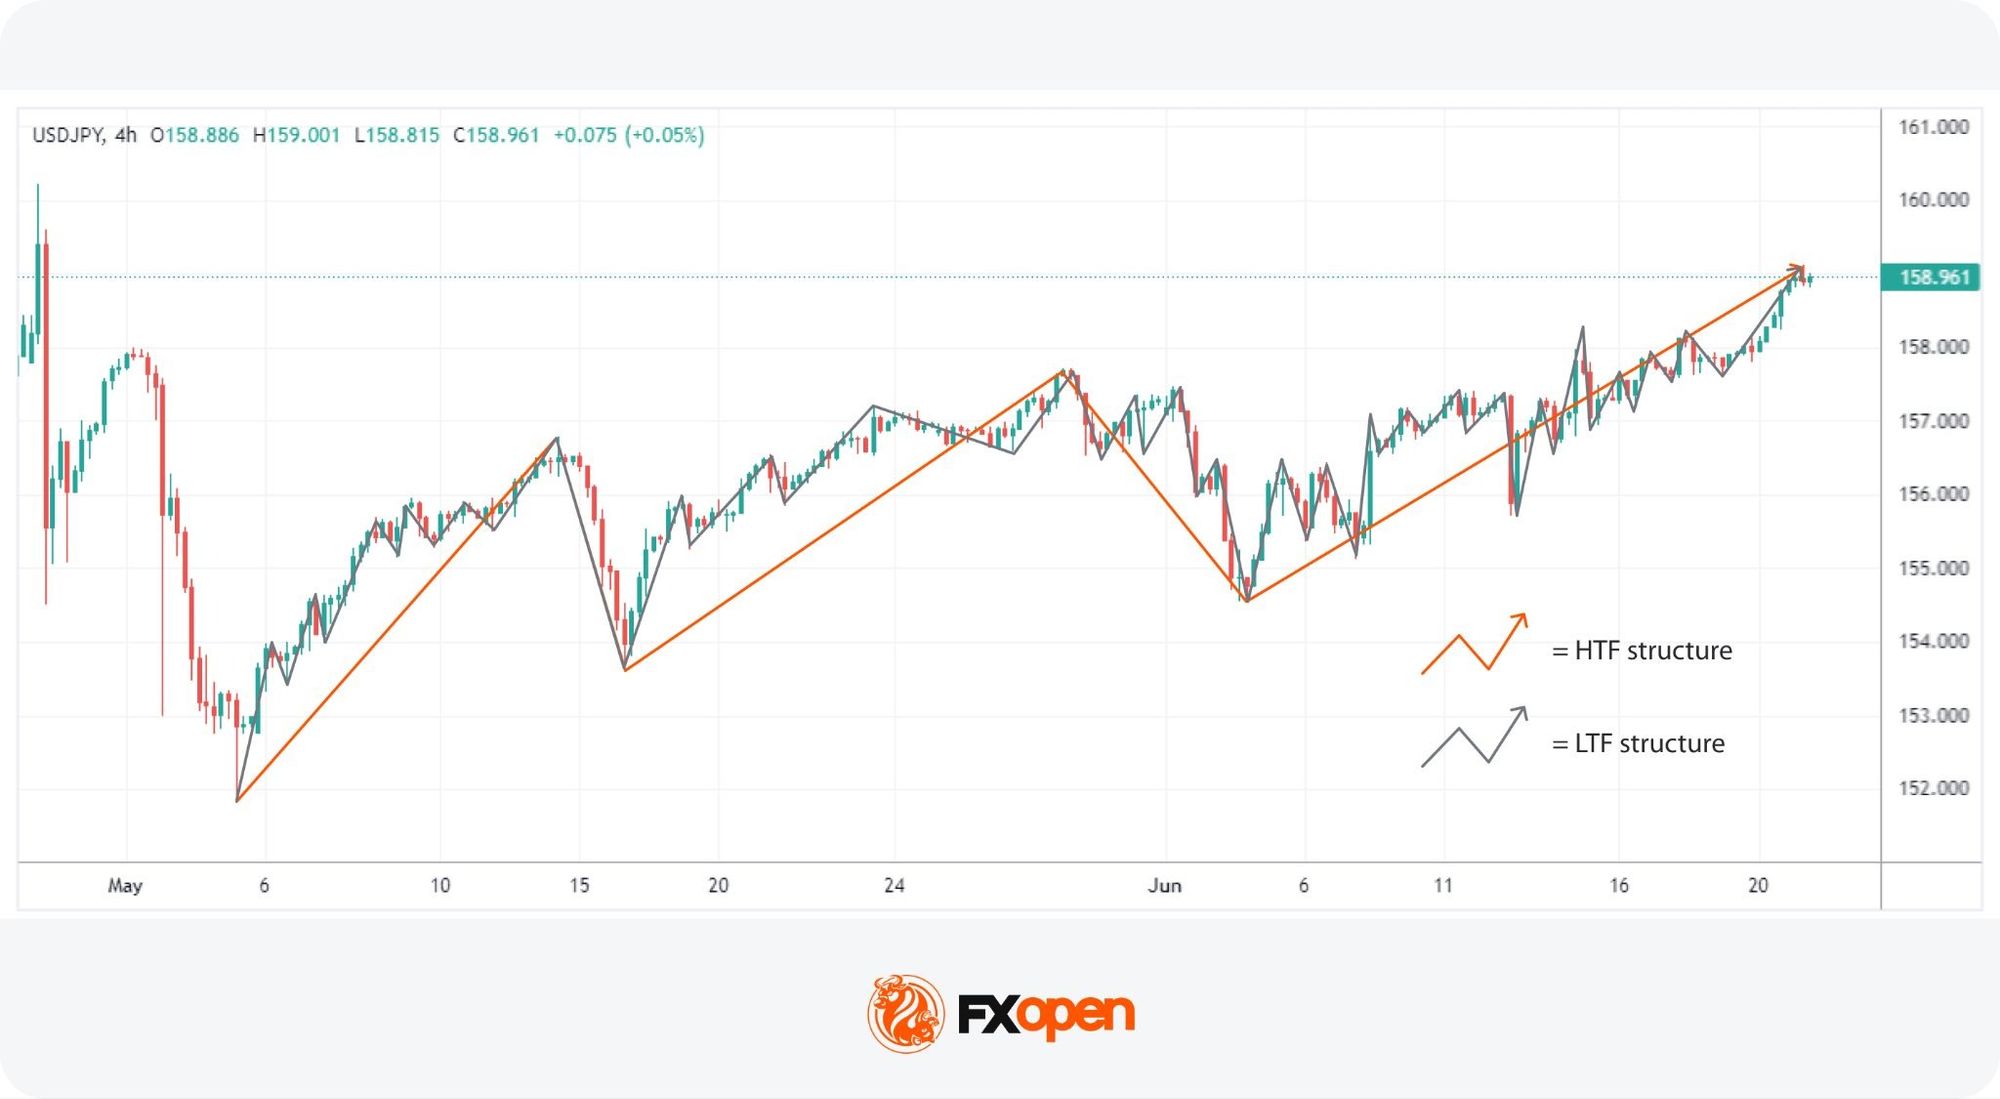
This refers to the broader trend governing the lower timeframe trend. For traders using the 15m-1h charts to trade, this might mean structure visible on 4h or 1d charts.
Higher timeframe structures may help traders identify the major support and resistance levels. These levels are important as they mark the boundaries within which the market generally oscillates. Traders use these to determine the prevailing market direction and potential areas where false breakouts (stop hunts) are likely to occur.
This higher timeframe view sets the directional bias for the Turtle Soup setup. A market making higher highs and higher lows suggests a bullish bias, where traders typically look for long-side setups after liquidity sweeps below swing lows. The reverse applies in a bearish structure of lower highs and lower lows.
Lower Timeframe Structure
Lower timeframe structures are examined on hourly or minute charts. These provide a more detailed view of price action within the higher timeframe’s range. They also account for the bullish and bearish legs that dictate a broader higher timeframe trend.
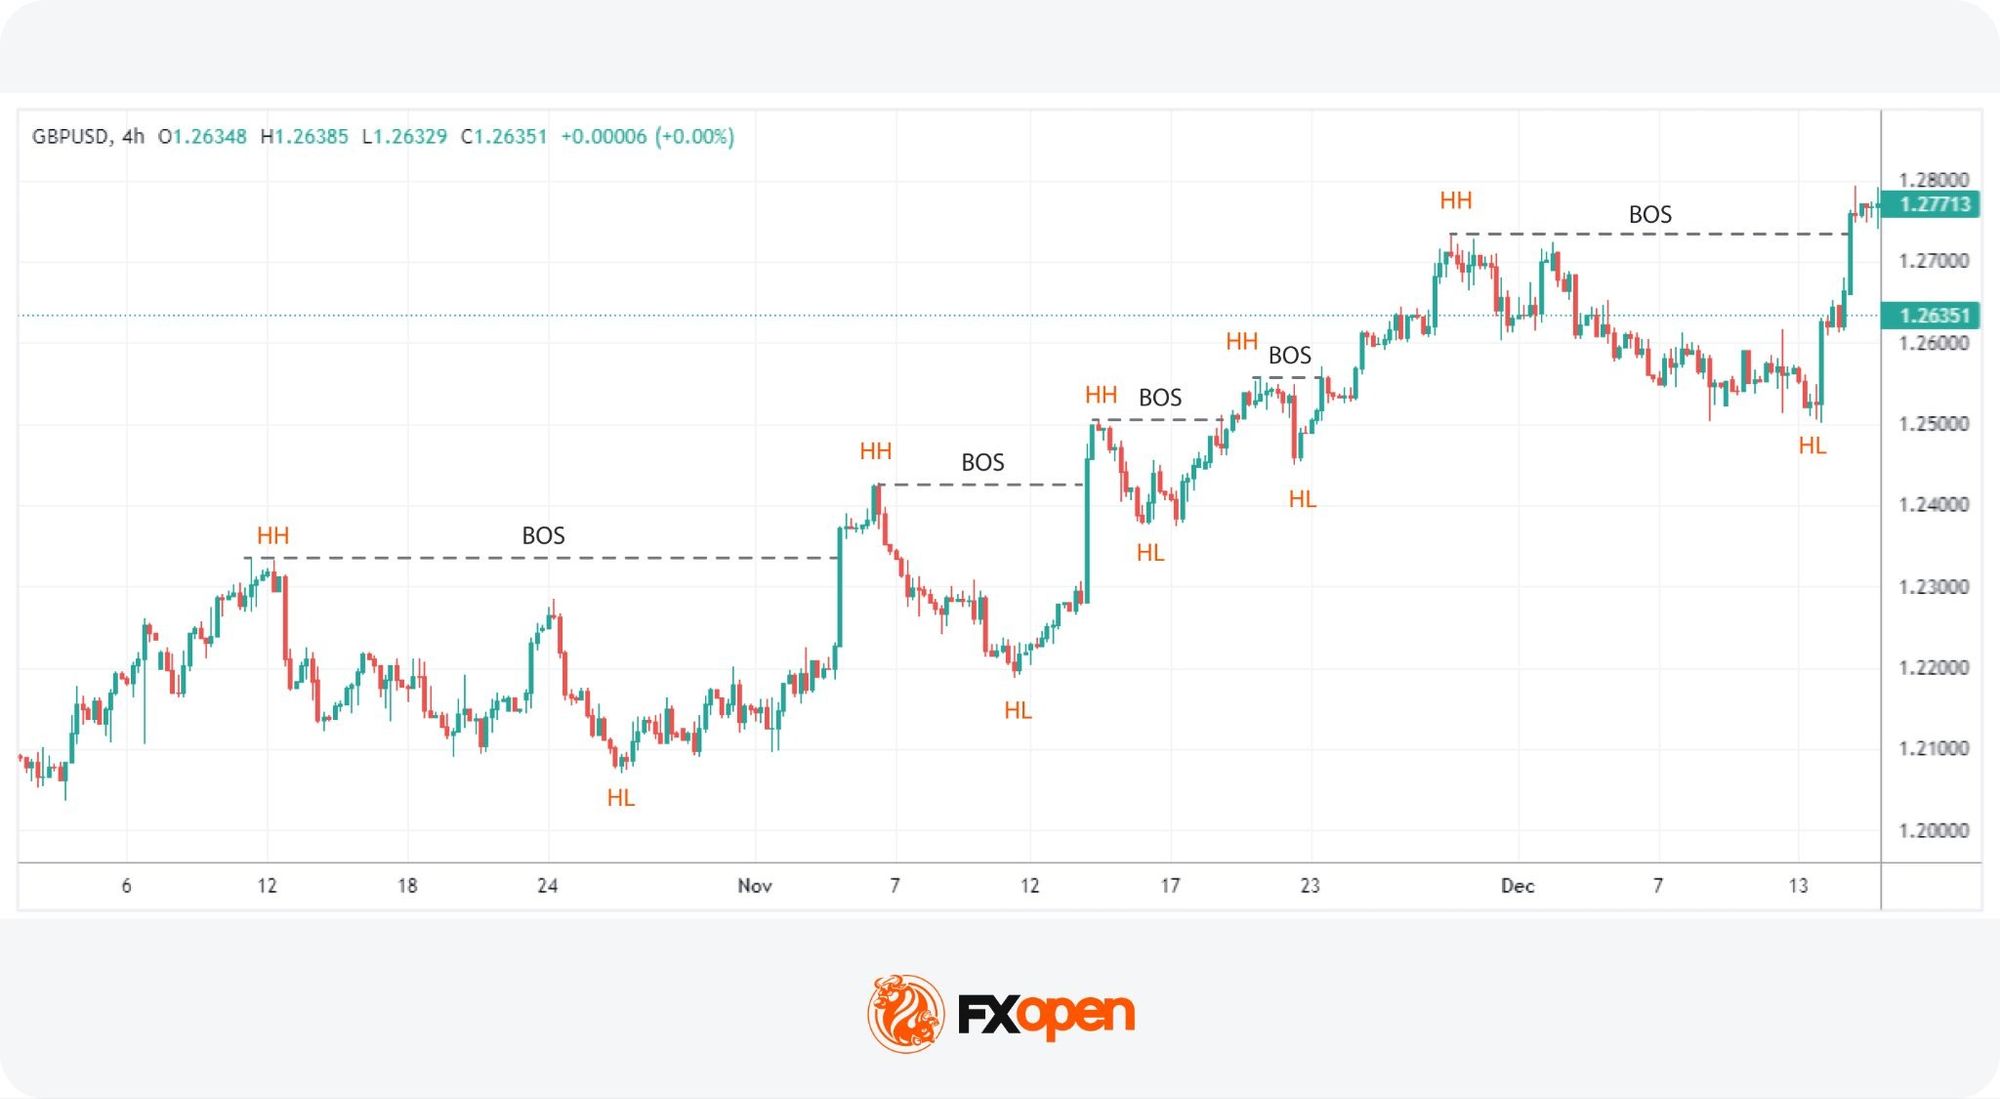
On these charts, traders watch for a Break of Structure (BOS) that aligns with the higher timeframe bias. A BOS occurs when price breaks a recent swing high or low in the trend’s direction. Displacement supports the move when a strong candle closes well beyond that swing point with limited pullback.
Together, these signals confirm the lower timeframe is aligning with the Turtle Soup setup bias.
Liquidity and Stop Hunts
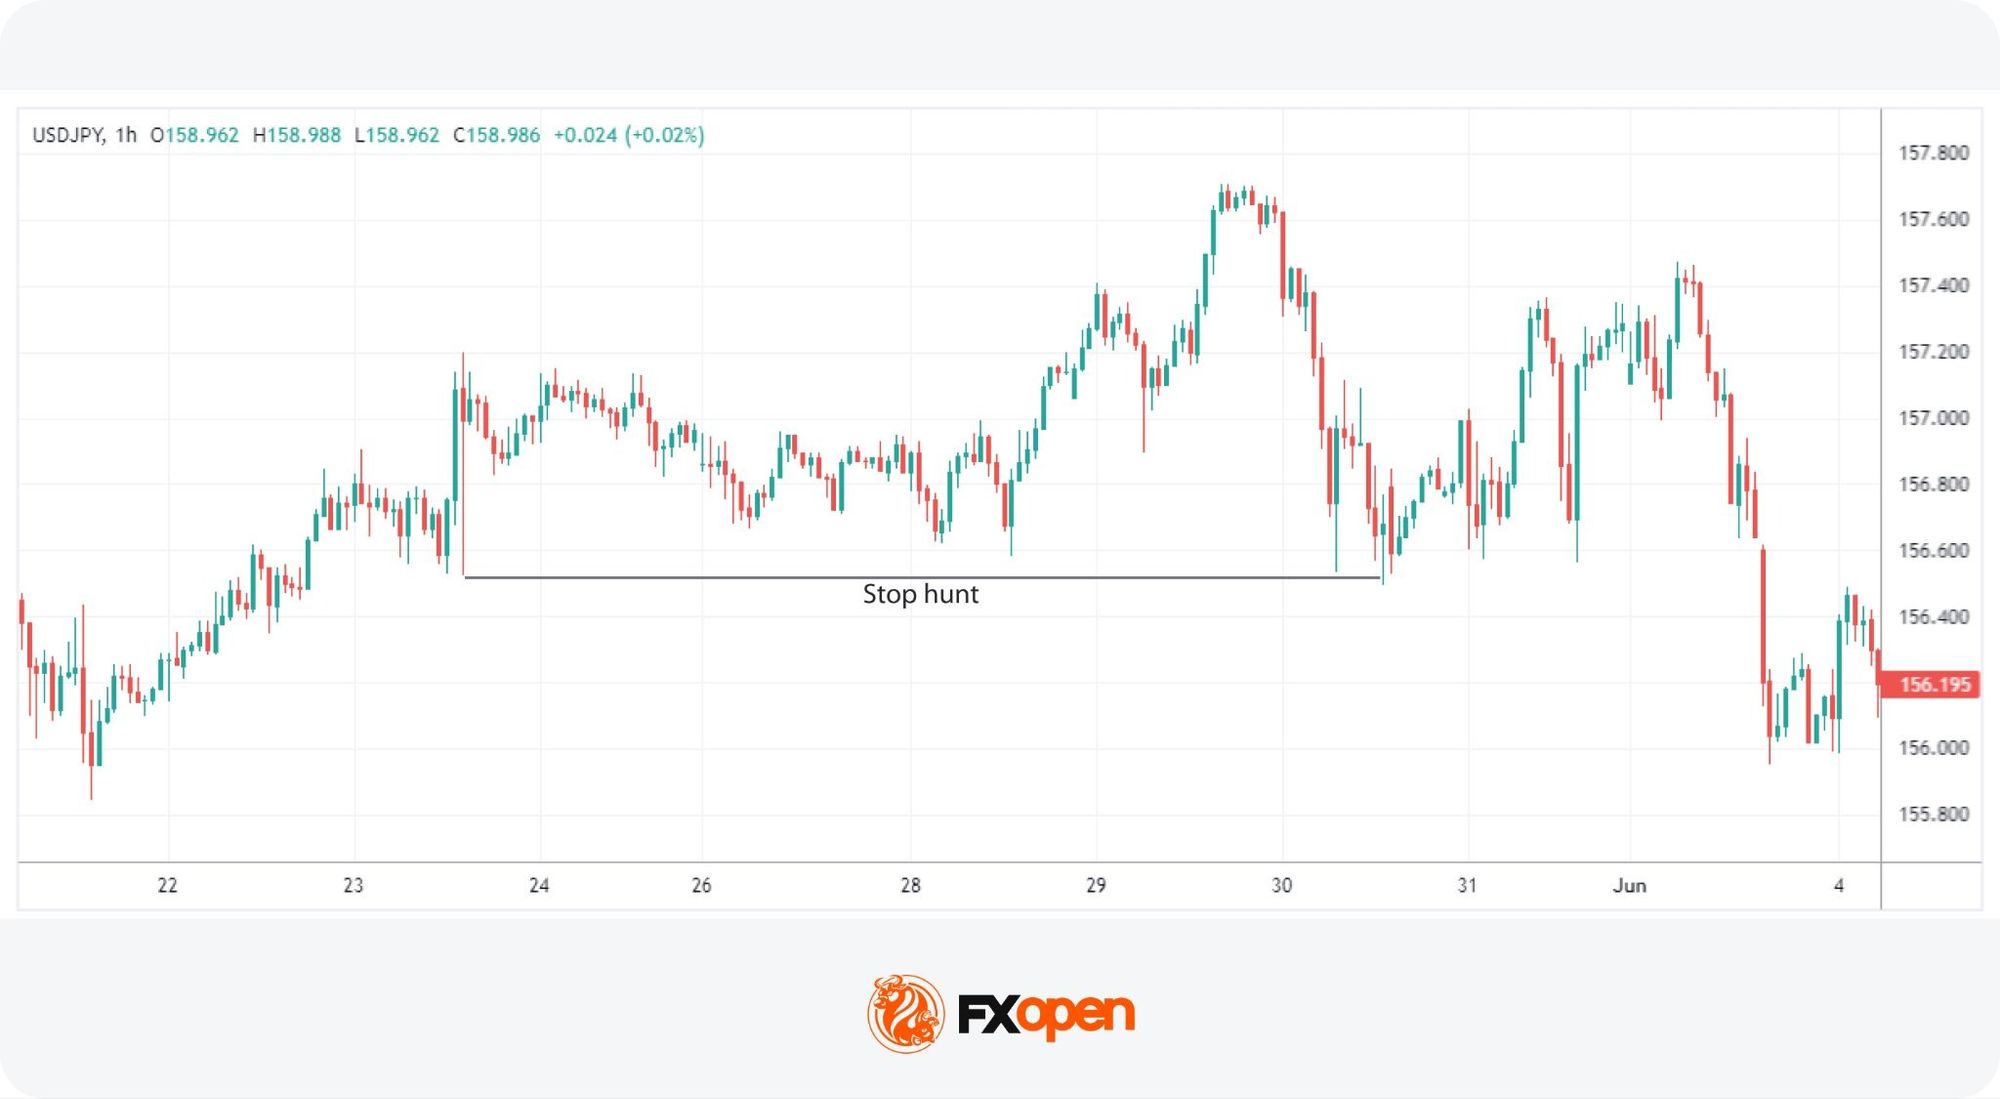
In general trading terms, liquidity represents how easy it is to enter or exit a market. However, in the context of the ICT Turtle Soup pattern, areas of liquidity can be identified beyond key swing points.
These pools of stop-loss orders sit just above swing highs and just below swing lows. These orders are ready to be triggered if price reaches the level.
Stop hunts in trading, also known as a liquidity sweep or stop run, are central to Turtle Soup setups. They occur when price moves through a resistance or support level, triggering clustered stop-loss orders that sit beyond. Triggered stops create a liquidity spike that allows price to reverse back into the range. Traders applying the ICT Turtle Soup strategy typically position against the initial breakout direction once that liquidity has been swept.
Internal and External Liquidity
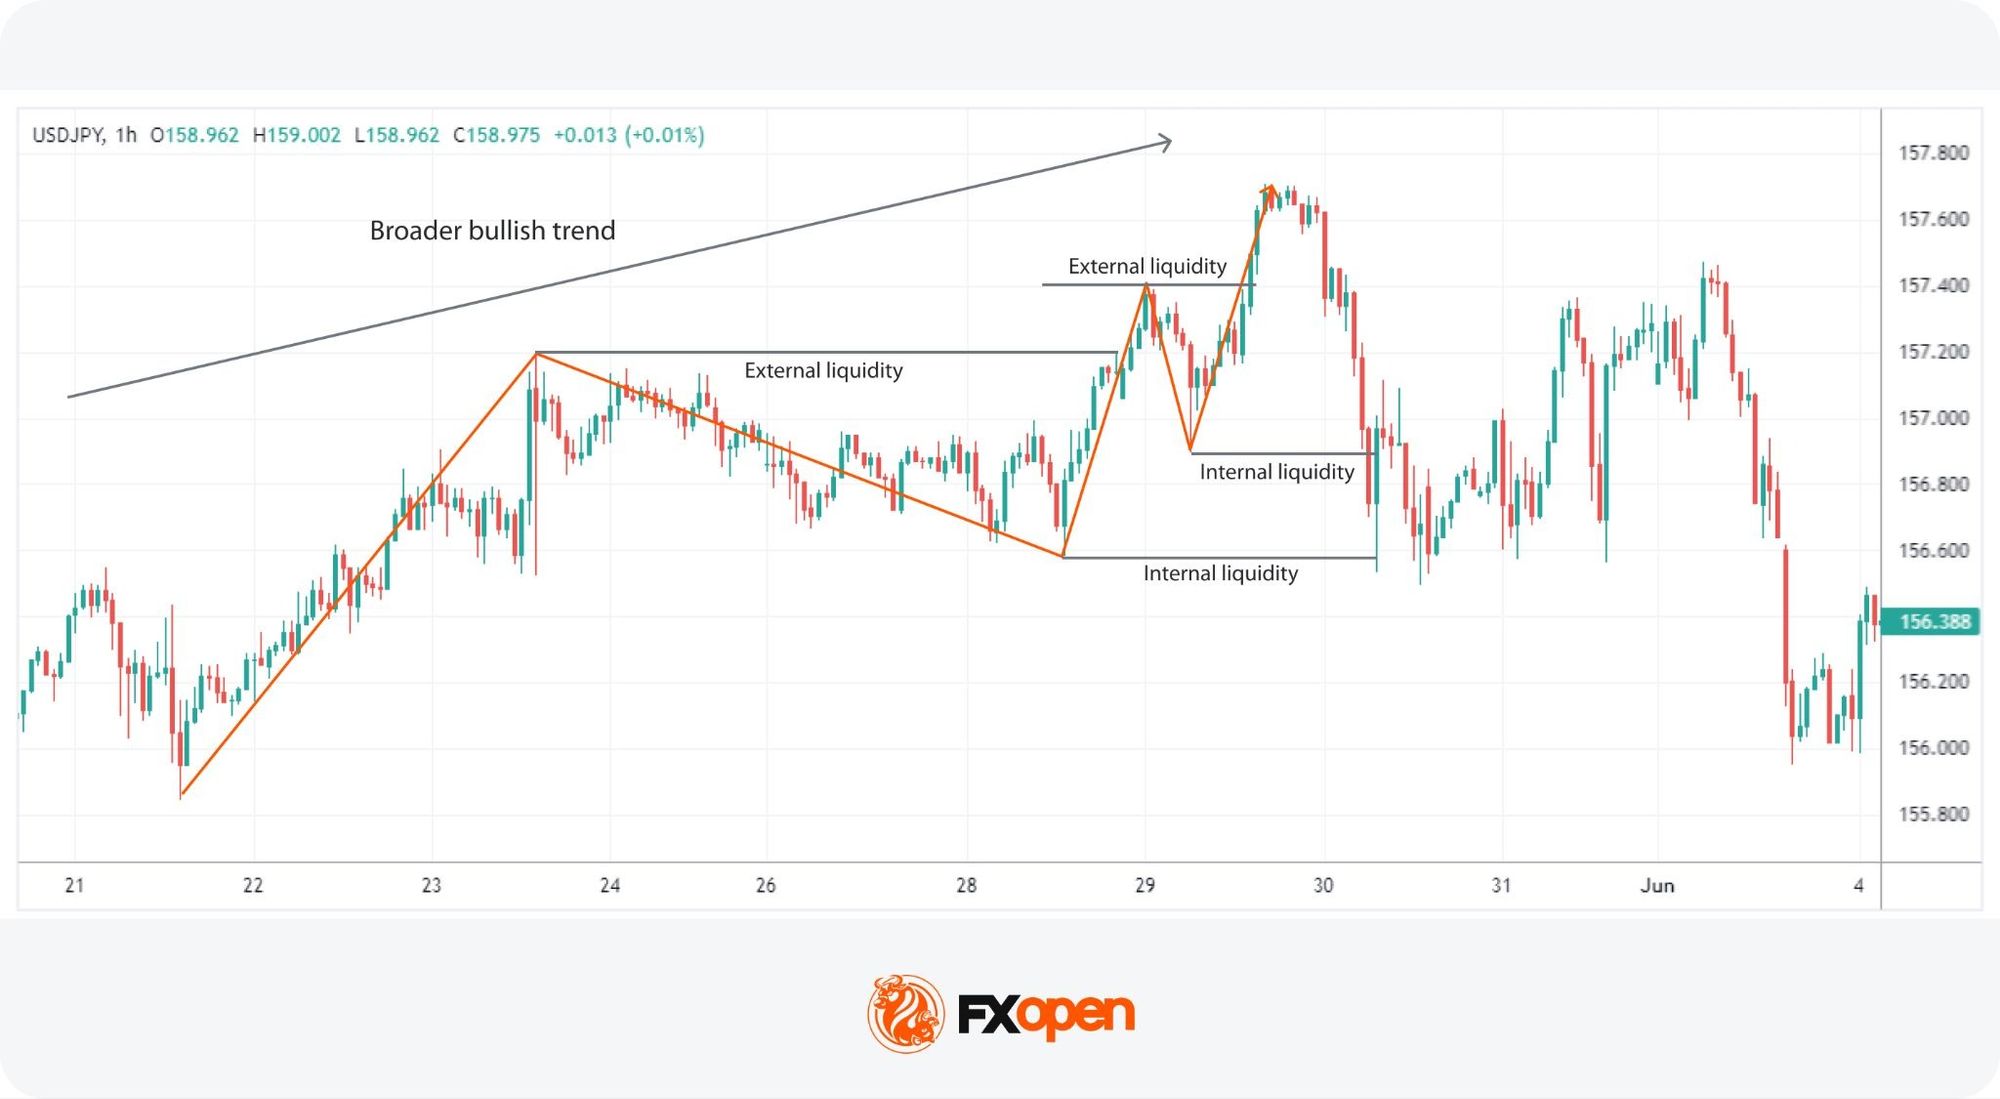
Internal and external liquidity sit on opposite sides of the higher timeframe range. Identifying both is central to Turtle Soup forex setups, since each plays a different role.
Internal liquidity refers to the liquidity available within the range of the higher timeframe structure. It involves identifying smaller support and resistance levels within the larger range. In a bullish leg, internal liquidity rests beneath each higher low. In a bearish leg, it sits above each lower high. This internal liquidity is often swept to start a counter-move within the broader trend.
External liquidity involves liquidity that exists outside the major highs and lows of the higher timeframe trend. The swing low where a bullish leg started is one external liquidity zone. The swing high where a bearish retracement began is another external liquidity zone.
Quick reference:
- Internal liquidity: inside the higher timeframe range, beneath higher lows (bullish) or above lower highs (bearish).
- External liquidity: outside the higher timeframe range, at the extremes that defined the leg.
Context Tools: Order Blocks and Imbalances
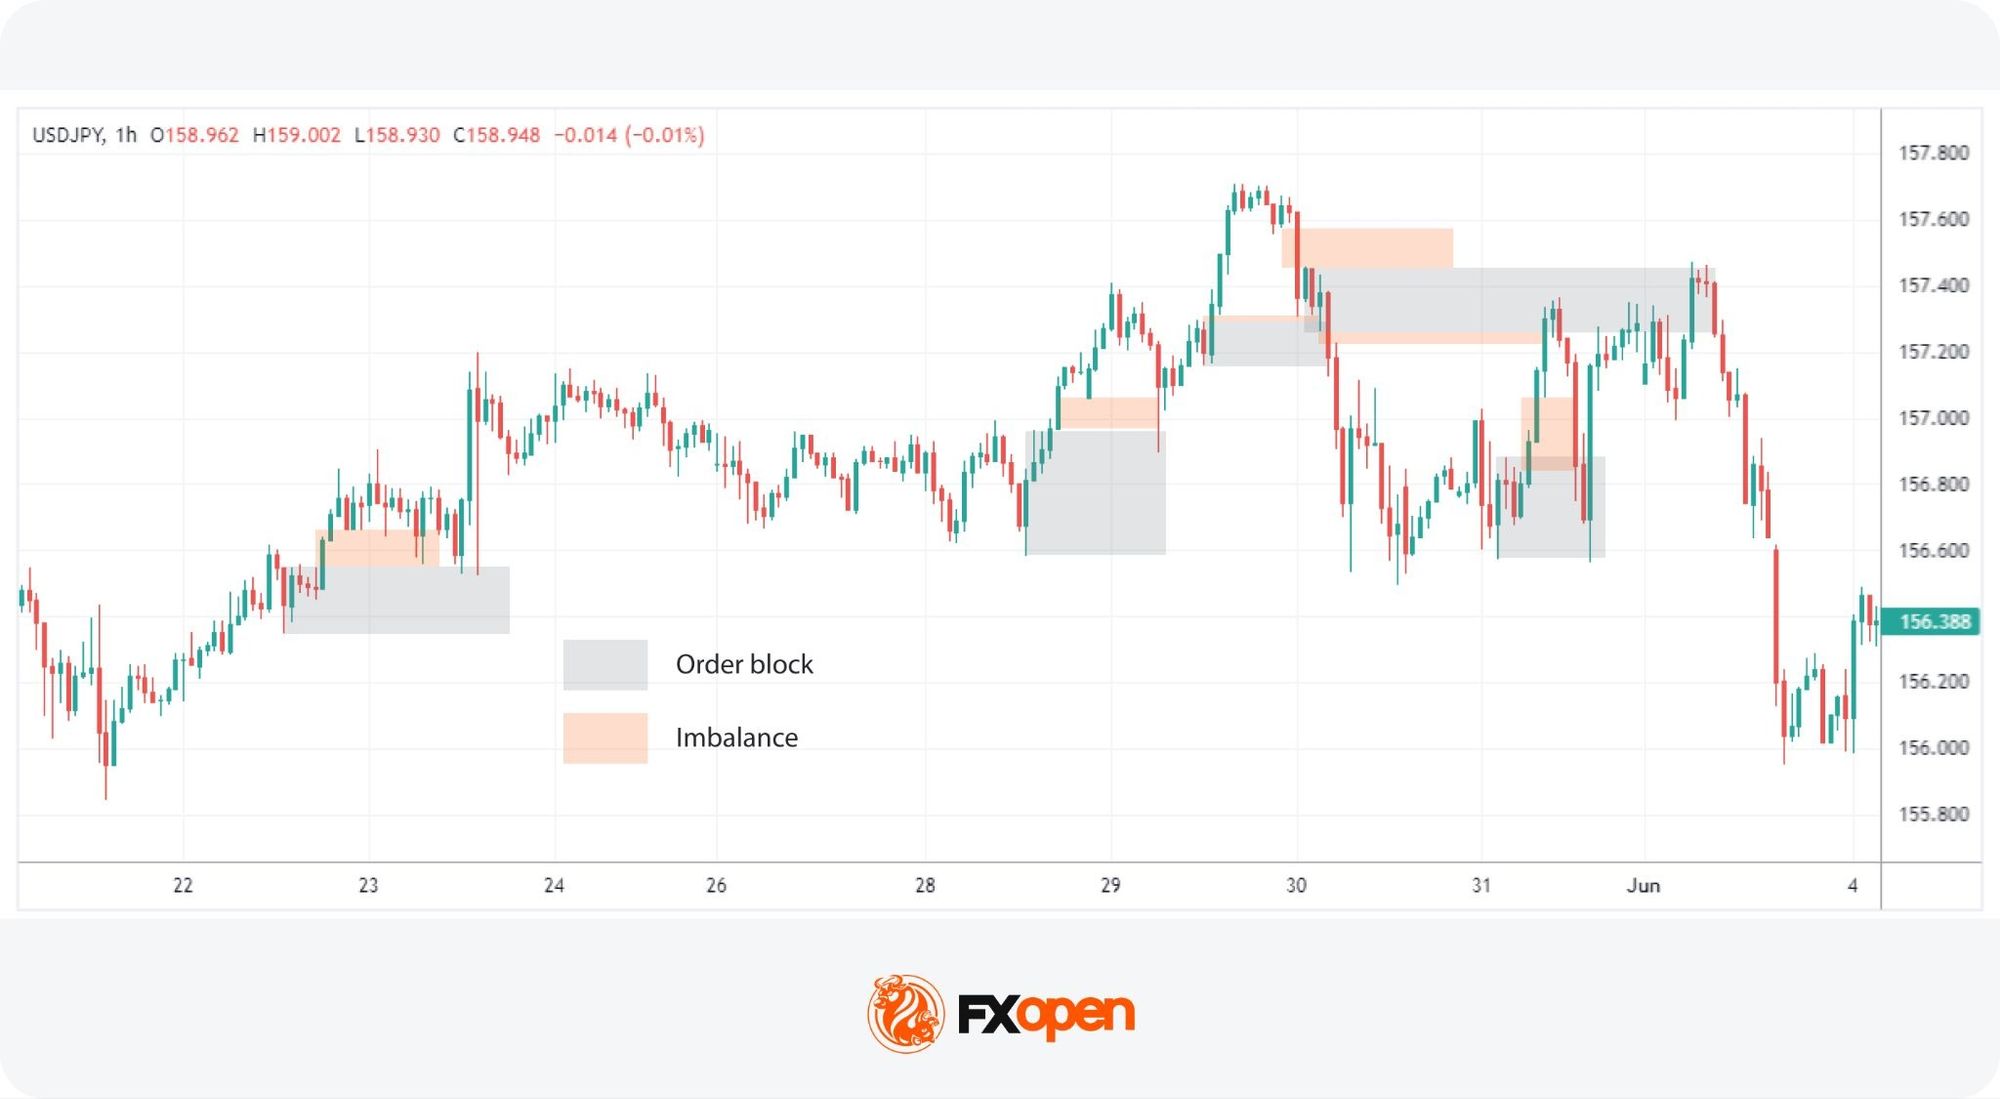
While not directly involved in the ICT Turtle Soup setup, order blocks and imbalances act as supportive context rather than required components. Understanding them can provide insight into where the price might head and the general market context.
Order blocks are areas where significant buying or selling activity has previously occurred, often due to institutional orders. These blocks represent zones of support and resistance where the price is likely to react.
- Bullish order blocks form at the base of upward moves and often act as support on a revisit.
- Bearish order blocks form at the top of downward moves and often act as resistance.
Imbalances, or more precisely fair value gaps (FVGs), are price regions where the market has moved too quickly. When price rapidly moves in one direction, it leaves behind an area with little trading activity. The market often returns to fill these gaps before continuing.
ICT Turtle Soup Setup Conditions
The ICT Turtle Soup setup forms when several conditions appear together on the chart. Each condition narrows the context until a failed breakout becomes the likely outcome.
The conditions for this liquidity grab trading strategy traders typically look for include:
- A defined higher timeframe bias
- Marked internal liquidity inside that bias
- A liquidity sweep that fails to hold
- Lower timeframe confirmation aligned with the higher timeframe direction
Establishing a Bias
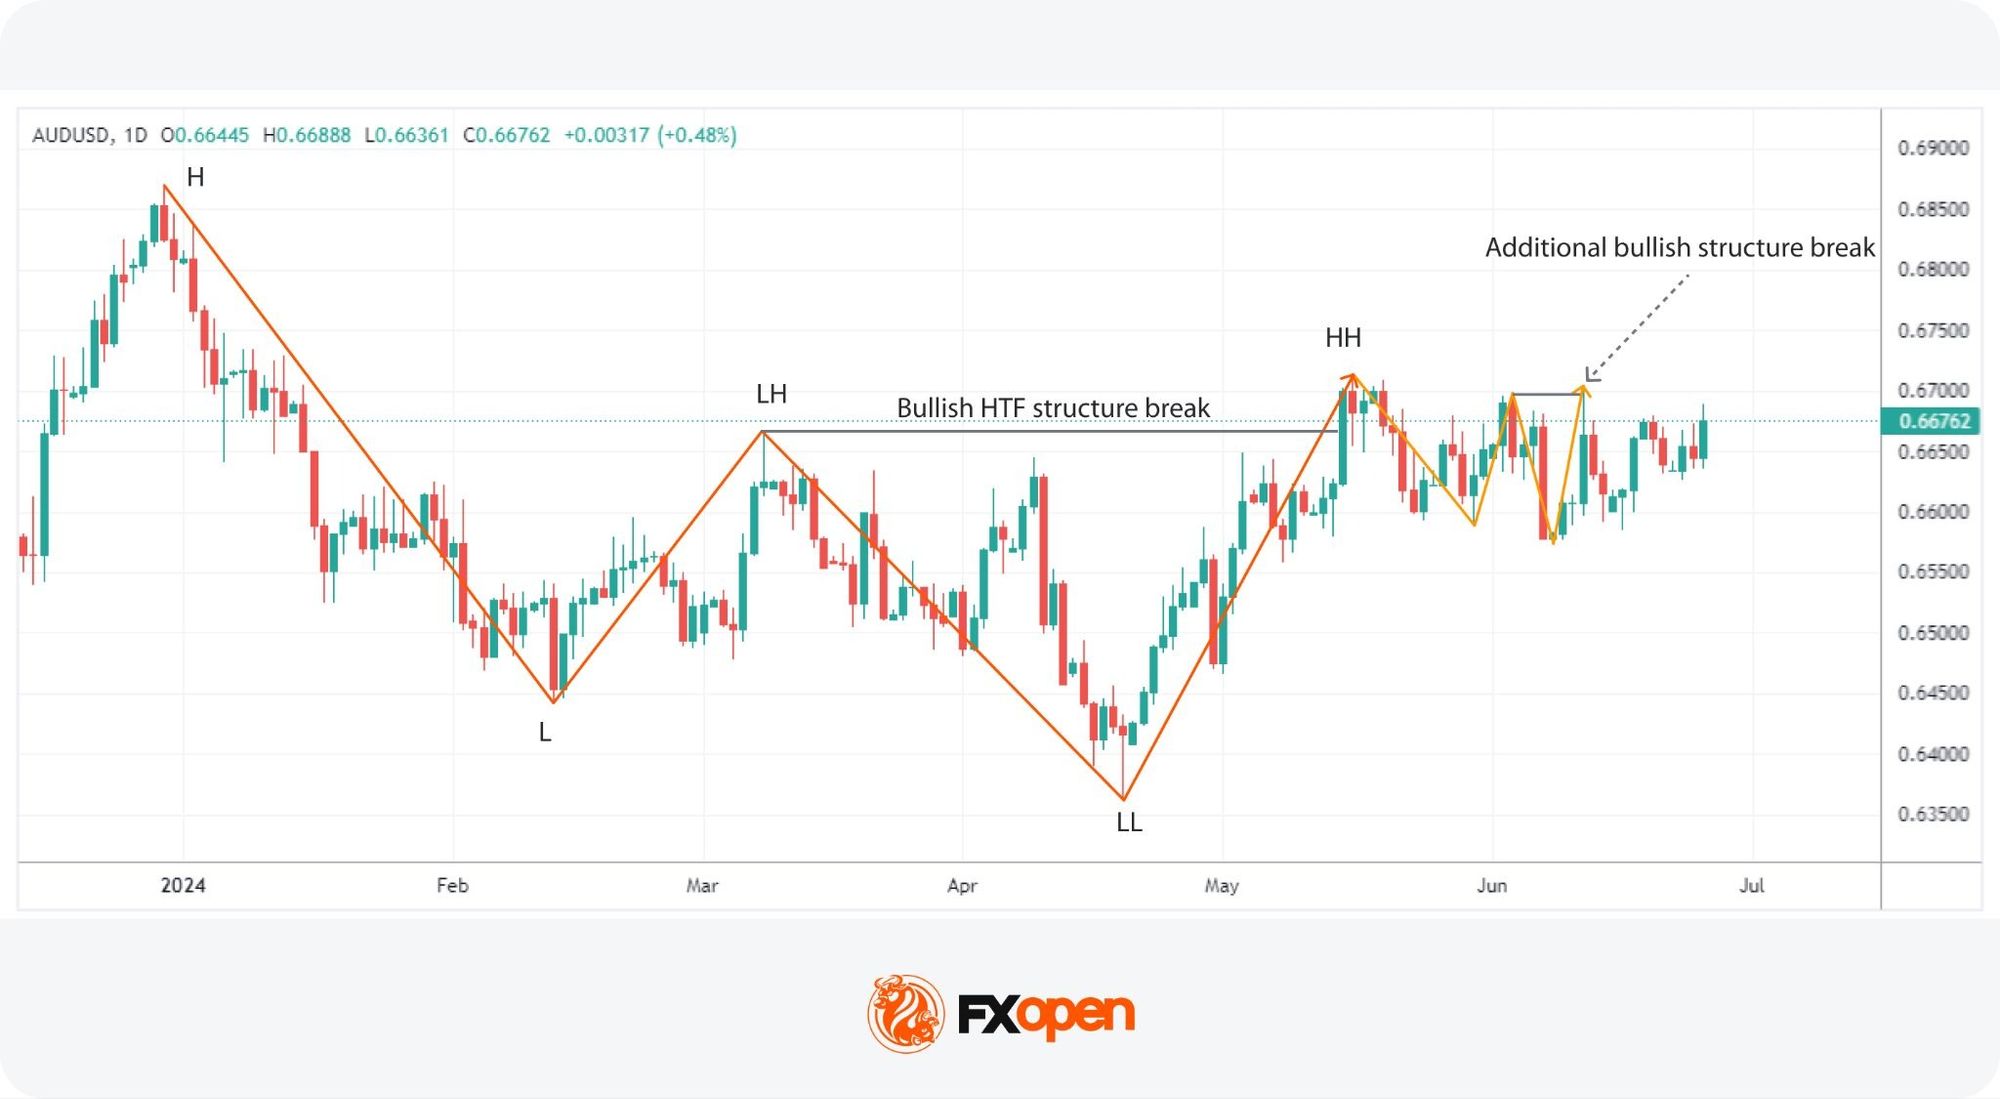
Traders begin by analysing the higher timeframe trend, such as the 4h daily charts, to establish a market bias. This analysis may help determine whether the market is predominantly bullish or bearish.
Measurable criteria for the bias typically include:
- A break of structure in one direction on the higher timeframe
- A series of higher highs and higher lows for a bullish bias
- A series of lower highs and lower lows for a bearish bias
- Price respecting key swing points without violating them in the opposite direction
Once the bias is set, traders only look for setups that align with that direction.
Identifying Internal Liquidity
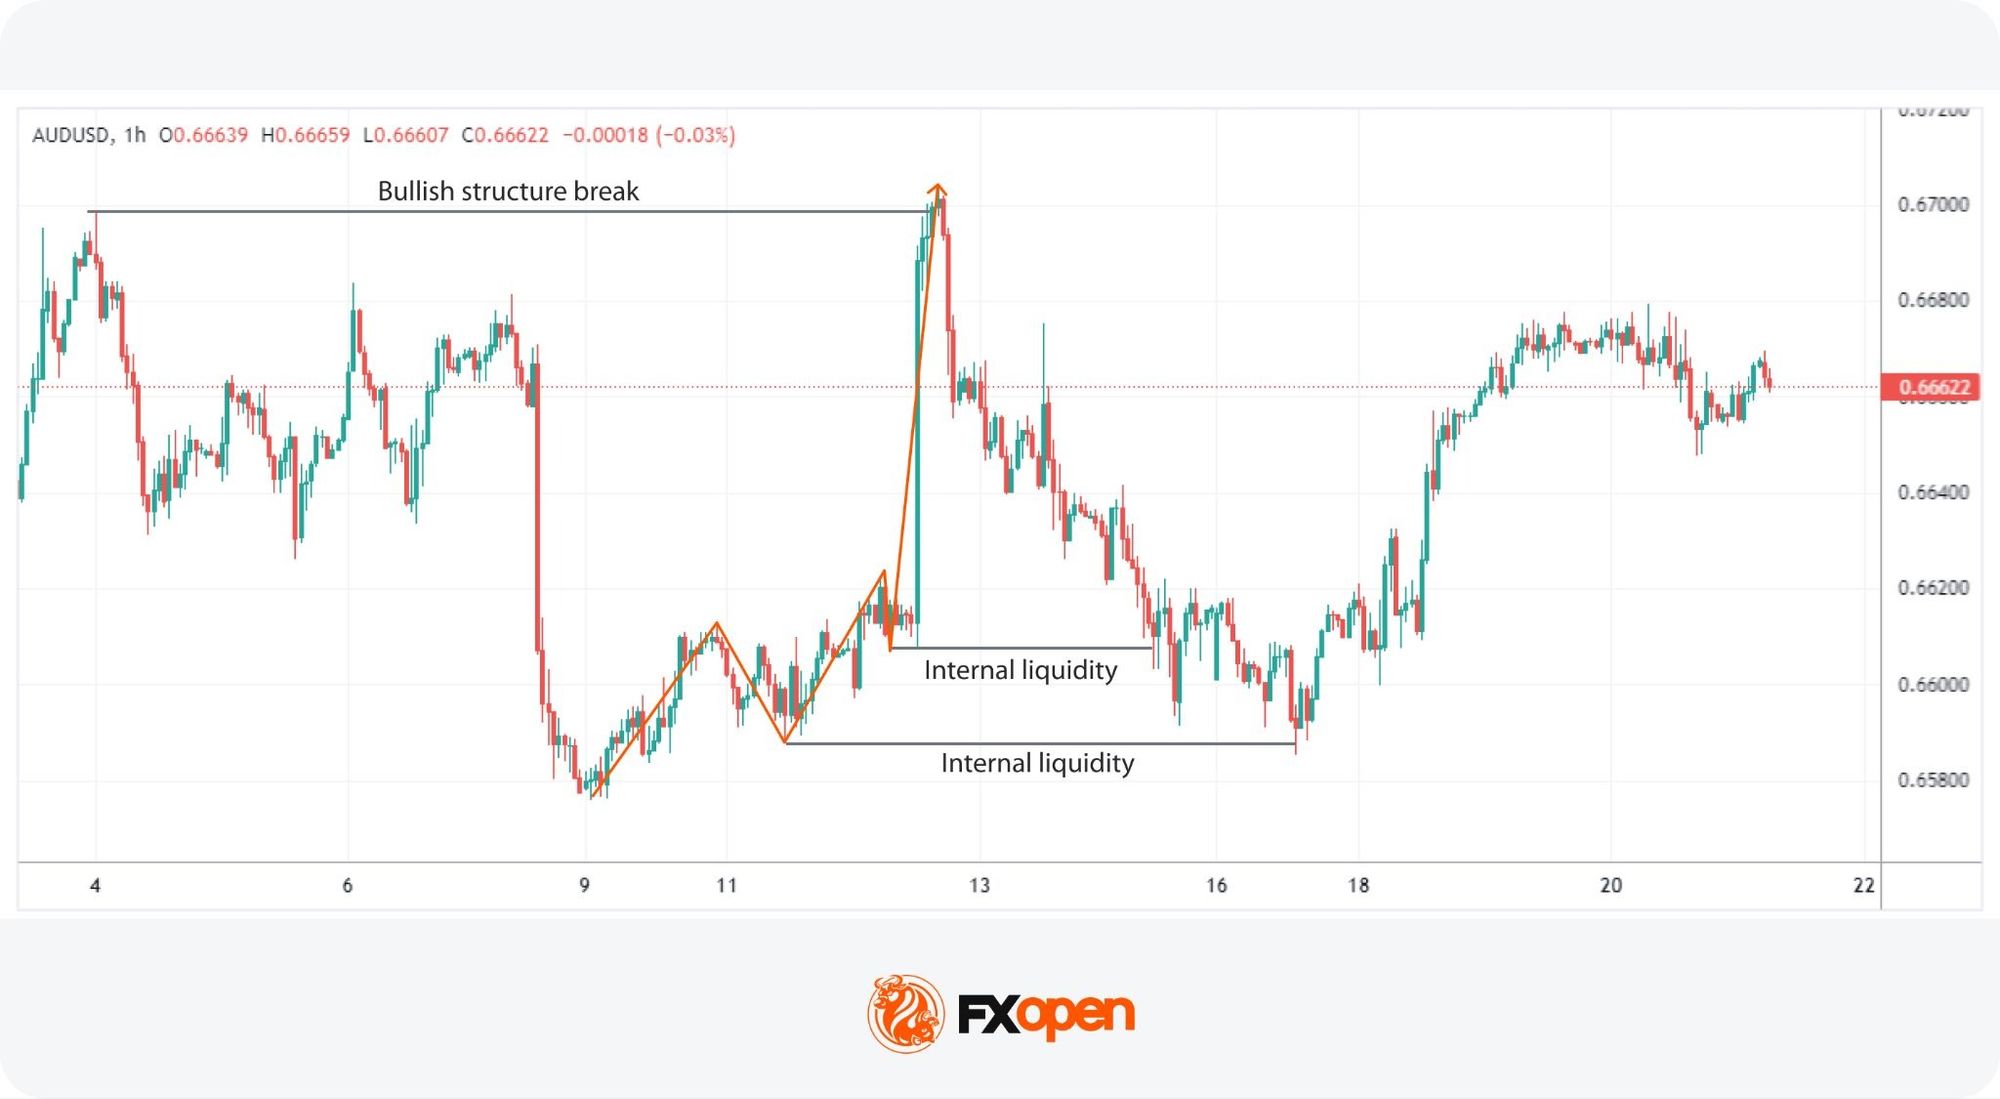
Once the higher timeframe trend is established, traders mark levels of internal liquidity inside the broader leg.
Internal liquidity typically rests in these locations:
- Below recent swing lows in a bullish leg
- Above recent swing highs in a bearish leg
- Beneath equal lows or above equal highs, where stop clusters build
- At round-number levels that attract retail stop placement
These zones are likely to attract stop-loss orders, making them probable targets for a liquidity sweep before the higher timeframe trend resumes.
Liquidity Sweep Trading Condition
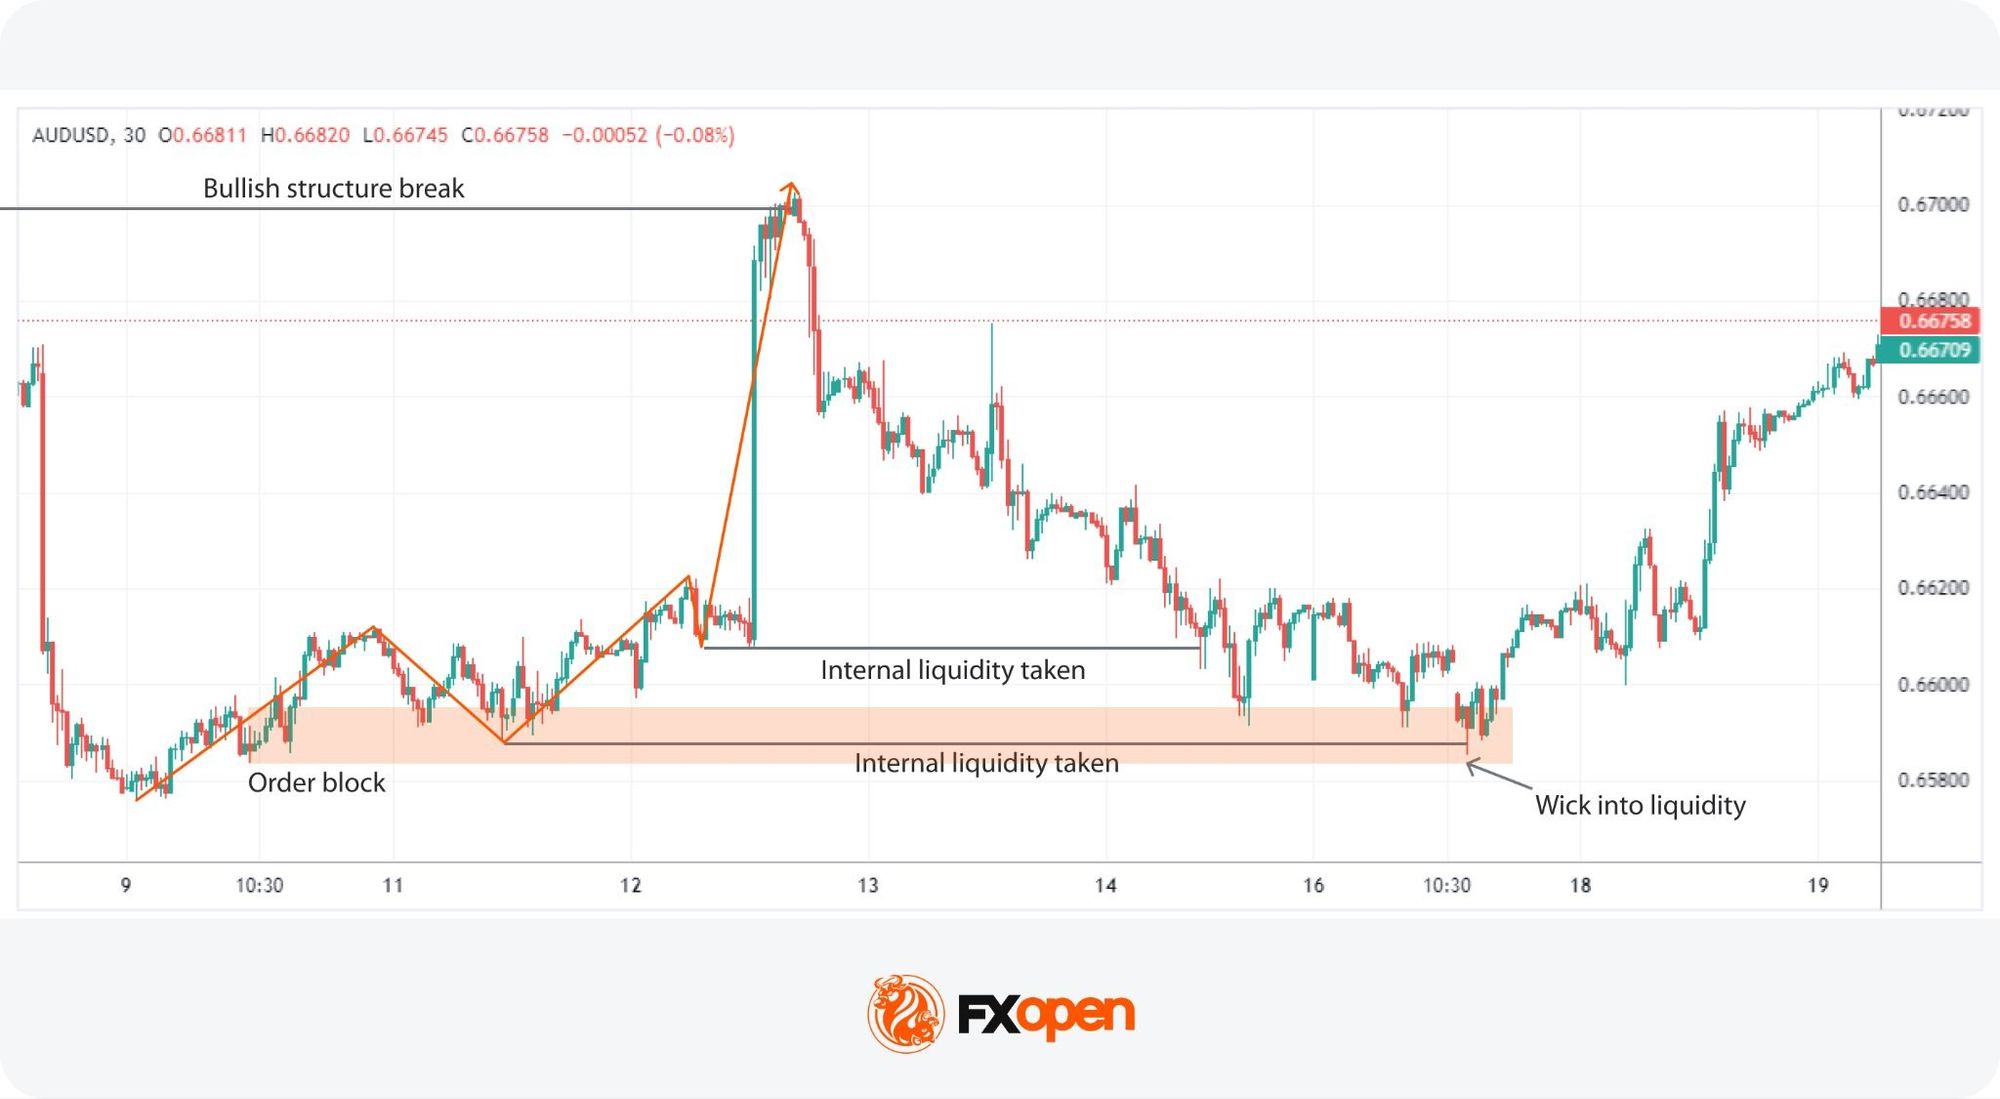
The condition is met when price briefly breaks through a marked internal liquidity level, then reverses back inside the range. This typically happens when stop-loss orders are triggered before price quickly returns.
Confirmation comes from wick and close behaviour. Price should sweep the level with a wick that extends beyond it, then close back inside the prior range on the same candle. A small wick relative to the candle body suggests the sweep absorbed liquidity efficiently.
The setup fails when price closes beyond the swept level instead of reversing. A close outside the range, especially with continuation in the next candle, signals a genuine breakout rather than a Turtle Soup condition.
Lower Timeframe Confirmation
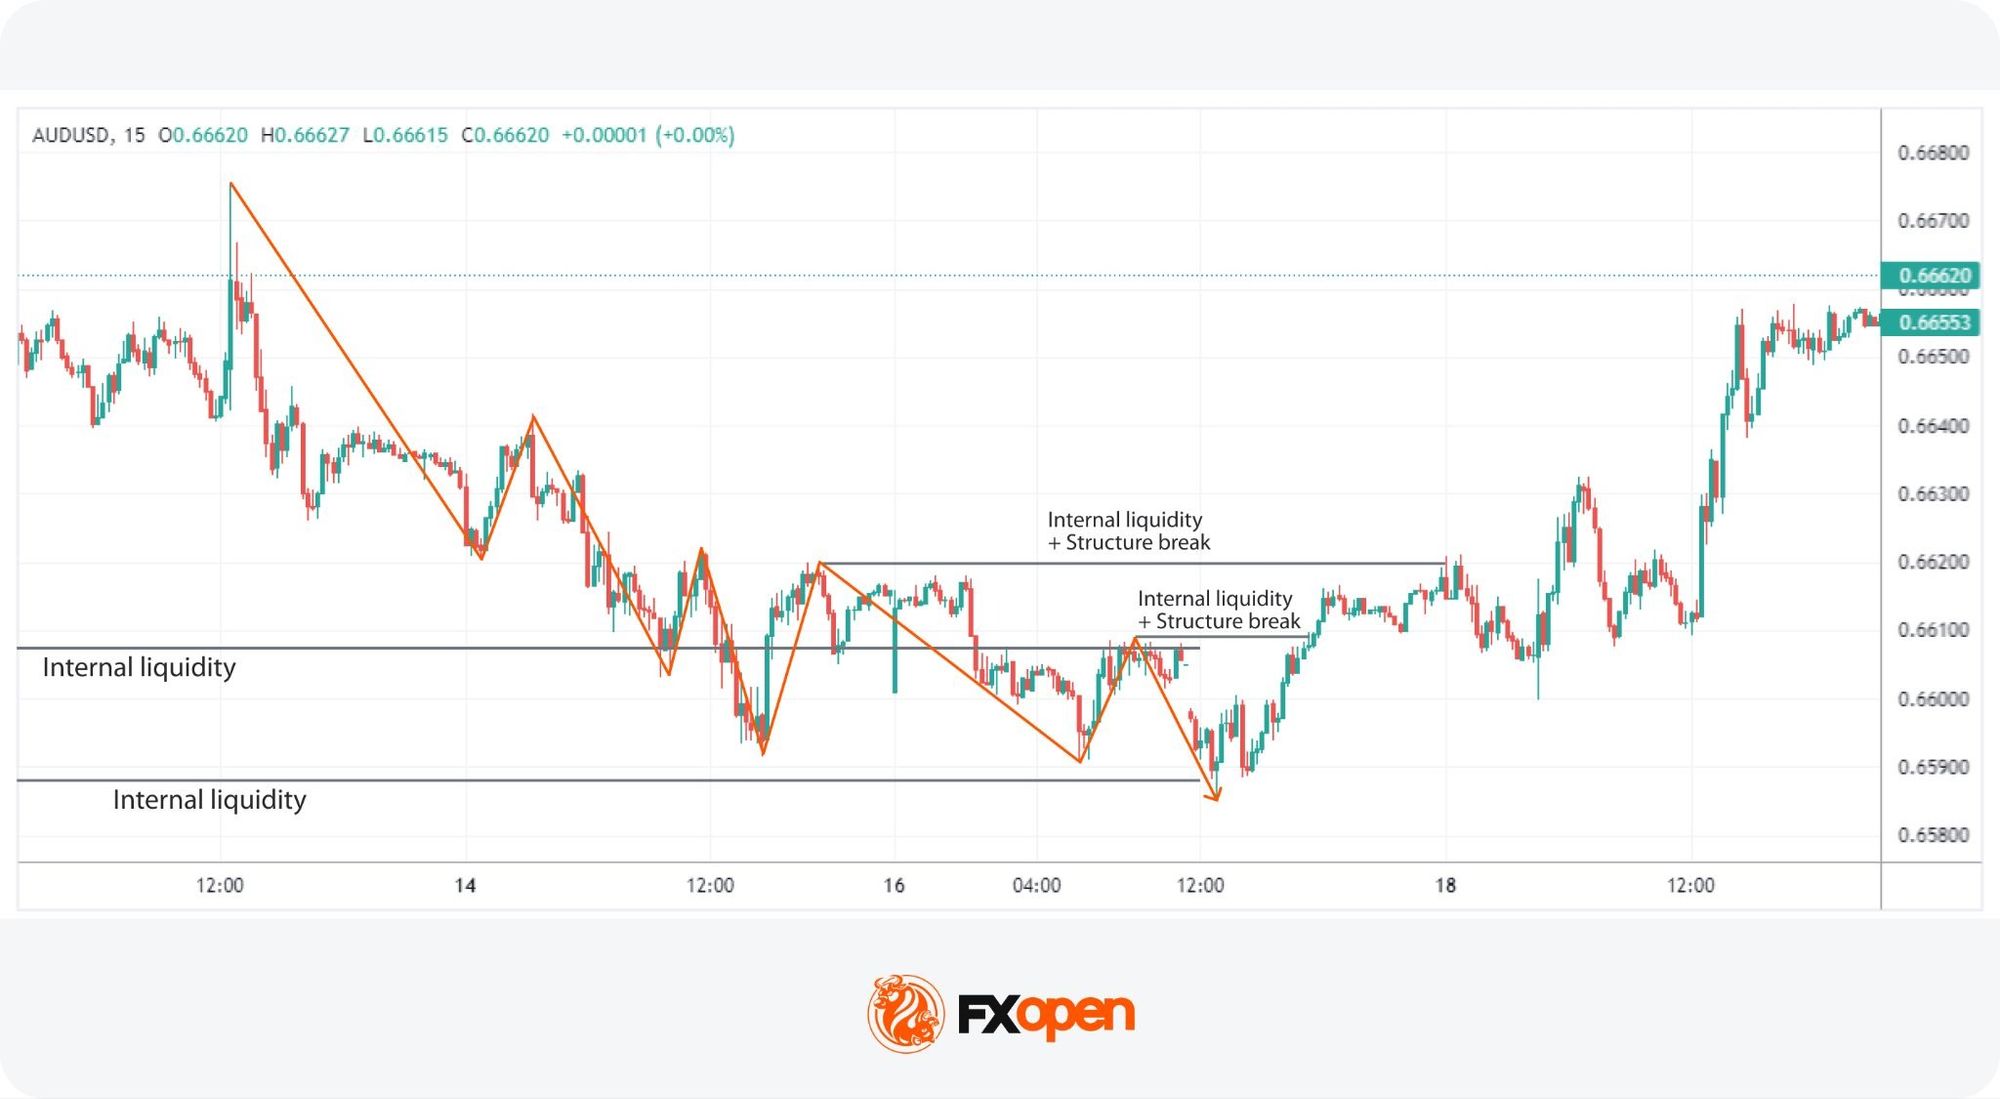
After identifying a liquidity grab beyond this internal liquidity level, traders look for an entry on a lower timeframe. They watch for a Market Structure Shift (MSS) in the direction of the higher timeframe bias. Displacement supports the shift when a strong candle closes well beyond the lower timeframe swing point.
Price often retraces back into the range to fill an imbalance before continuing. This retracement frequently meets an order block left behind by the displacement candle. The combination of MSS, displacement, and an order block retest typically gives a precise entry zone aligned with the higher timeframe direction.
Entry, Stop Loss, and Targets
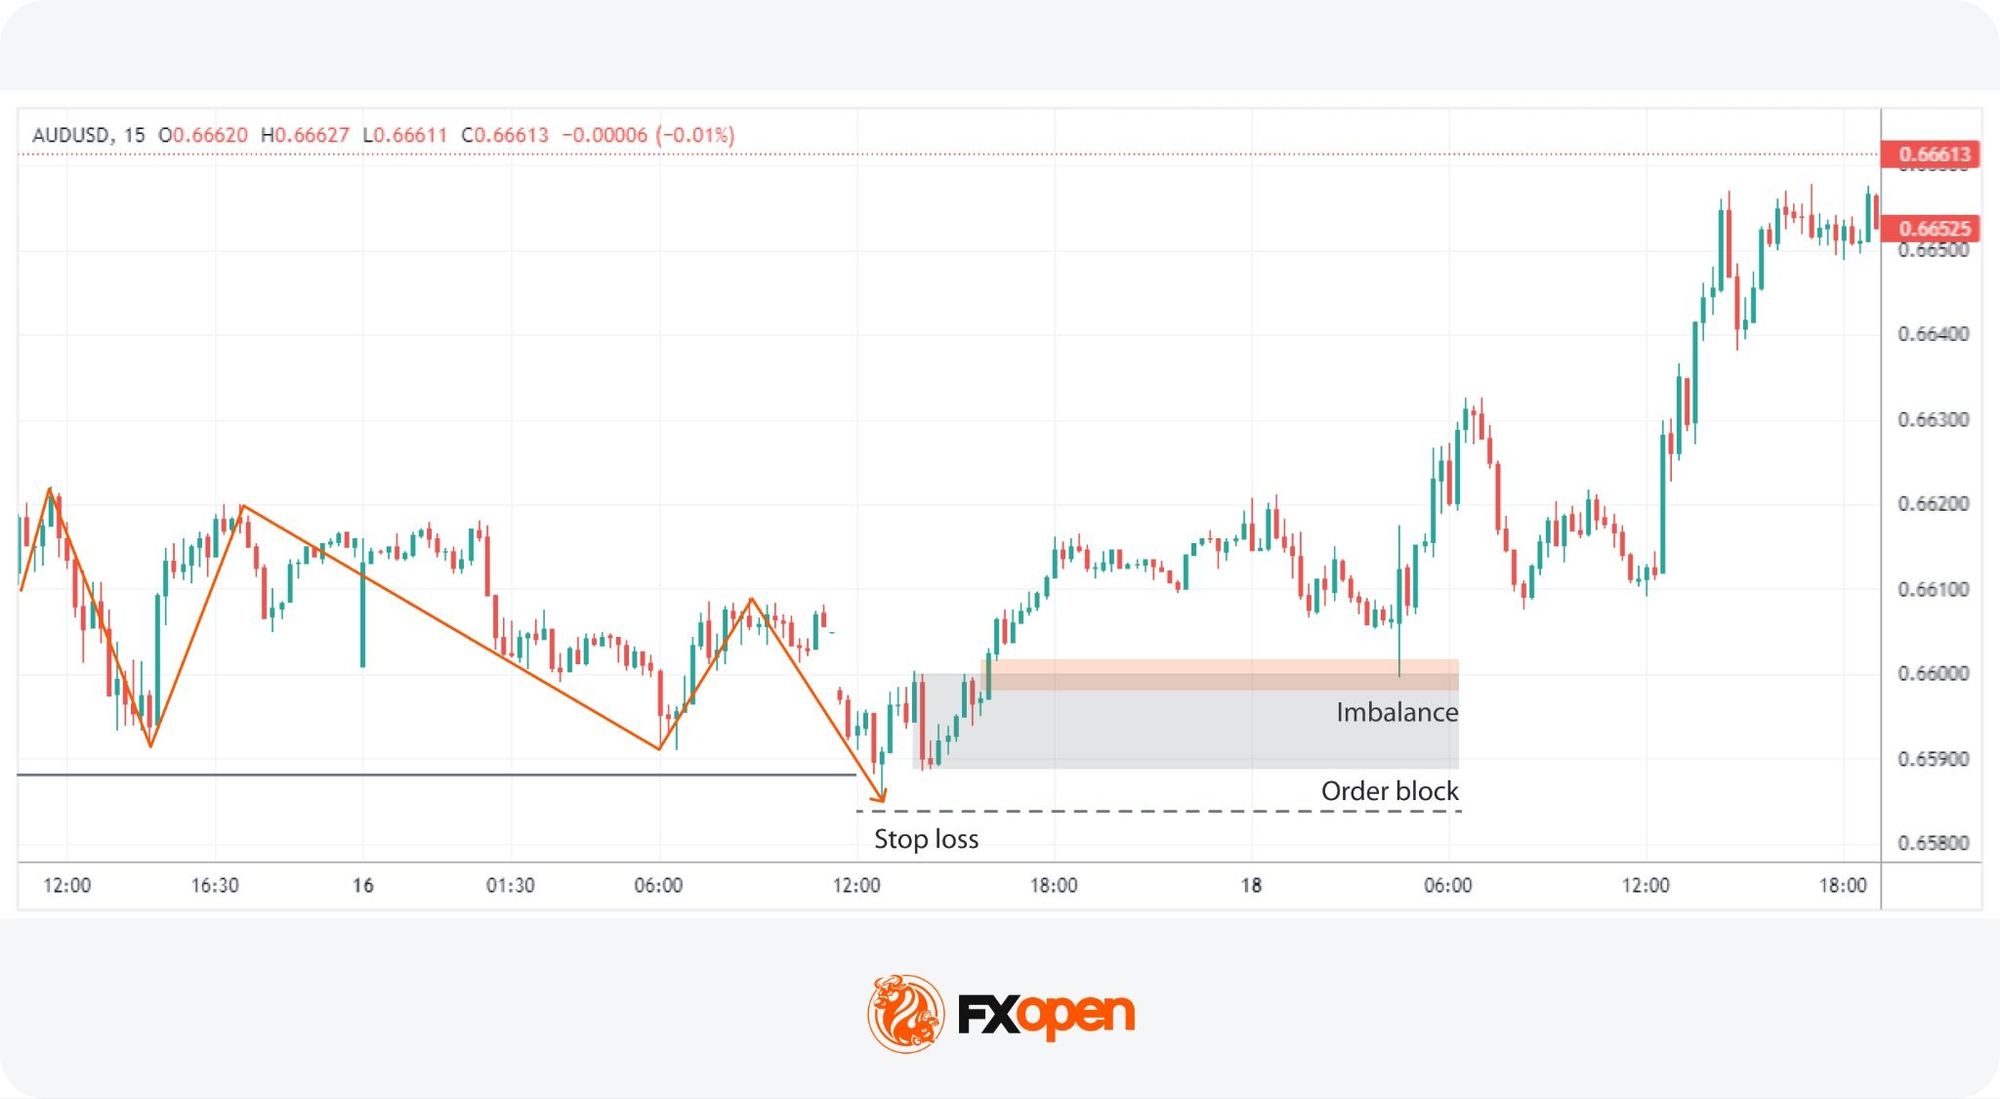
Once the conditions described above appear together, traders typically position in the direction of the higher timeframe bias. The setup gives a clear framework for entry, stop loss, and target placement.
- Entry zone: A limit order at the order block left behind by the displacement candle, in line with the higher timeframe direction.
- Stop loss: Placed just beyond the liquidity sweep wick. Above the recent high for a short trade, below the recent low for a long trade.
- Targets: Set at major liquidity levels such as previous highs or lows, where significant orders are likely to sit.
Position sizing and stop placement should align with the trader’s broader risk management approach. The framework above outlines structure, but potential risk per trade still depends on account-specific factors.
Potential Advantages and Limitations
The ICT Turtle Soup pattern is a trading strategy with several potential benefits and drawbacks.
Advantages
- Defined entry framework: The setup gives a specific entry zone, stop placement, and target structure, which removes ambiguity about where to act.
- Multi-timeframe applicability: The pattern can be applied across different timeframes and market conditions, including ranging and trending markets.
- Structured risk parameters: Stop losses sit just beyond the liquidity sweep, which produces a defined risk distance for each setup.
Limitations
- Steep learning curve: Applying the setup requires familiarity with market structure, liquidity, and order flow, which takes time to build.
- Sensitive to market conditions: Highly volatile or thin markets can produce false signals where sweeps continue rather than reverse.
- Time-intensive: The setup demands monitoring multiple timeframes to identify valid conditions, which limits how many markets a trader can cover at once.
The Bottom Line
The ICT Turtle Soup is a pattern built around failed breakouts and liquidity sweeps at key support and resistance levels. It frames a reversal setup with defined conditions for bias, liquidity sweep behaviour, lower timeframe confirmation, and entry placement.
Like any approach, its outcomes depend on context. The setup tends to work where range edges hold and breakouts fail. It tends to underperform where momentum carries through swept levels. Disciplined execution, careful risk management, and alignment with the broader market context remain the deciding factors.
Traders who want to apply the framework on live markets may open a forex trading account with FXOpen and trade with tight spreads from 0.0 pips and low commissions from $1.50.
FAQs
What Is ICT Turtle Soup in Trading?
ICT Turtle Soup is a method that exploits false breakouts in trading. It identifies potential reversals when the price briefly moves beyond a major support or resistance level, triggering stop-loss orders before reversing direction. This strategy aims to take advantage of these liquidity grabs by entering trades opposite to the initial breakout direction.
What Are the Conditions for ICT Turtle Soup?
To identify the ICT Turtle Soup pattern, traders analyse higher timeframe trends to establish market bias. They then look for counter-trend moves and mark internal liquidity areas. The pattern is identified when the price taps these liquidity zones and reverses quickly, often leaving a small wick. This signals a liquidity grab and potential trade setup in the direction of the higher timeframe trend.
How May Traders Use the ICT Turtle Soup Pattern?
According to theory, using the ICT Turtle Soup pattern involves several steps. First, traders establish a market bias based on higher timeframe analysis. Then, they look for liquidity grabs at marked internal liquidity areas, indicating false breakouts. The next step is to confirm the setup on a lower timeframe by observing a similar liquidity grab and structure break. Lastly, they are supposed to enter trades in the direction of the higher timeframe trend, placing stop losses just beyond the liquidity grab and targeting key liquidity levels for profit-taking.
What Is a Turtle Soup Setup in Forex Markets?
A turtle soup setup in forex markets is a failed breakout pattern at a key swing level. Price briefly breaks a recent high or low and sweeps clustered stop-loss orders. It then reverses back inside the prior range. Traders typically position against the initial breakout once the sweep is confirmed.
What Confirms a Liquidity Sweep in ICT Trading?
A liquidity sweep is confirmed by specific wick and close behaviour. Price should extend beyond a marked swing point, then close back inside the prior range. The wick reaches past the level while the candle body stays inside. A close beyond the level without reversal suggests a genuine breakout instead.
Is Turtle Soup a Reversal or Continuation Pattern?
Turtle soup is classified as a reversal pattern, not a continuation pattern. It targets failed breakouts where price moves through a level and then returns inside the prior range. The setup positions against the initial breakout direction rather than with it. Continuation patterns take the direction of the breakout instead.
This article represents the opinion of the Companies operating under the FXOpen brand only. It is not to be construed as an offer, solicitation, or recommendation with respect to products and services provided by the Companies operating under the FXOpen brand, nor is it to be considered financial advice.



Polymarket has clarified that it is not introducing mandatory Know Your Customer checks across its main prediction market platform despite renewed scrutiny over compliance and restricted-jurisdiction access.
Summary
- Polymarket said KYC checks are limited to a new beta product and will not apply to its main prediction market platform.
- The clarification followed reports that regulators have increased pressure over sanctions compliance, restricted market access and anonymous trading activity.
- Brazil and Spain have already moved against Polymarket operations as U.S. regulators continue examining insider trading and market integrity risks tied to prediction markets.
In a post on X, Polymarket vice president of engineering Josh Stevens said identity verification applies only to a new beta product currently being tested with a limited group of users.
Stevens explained that “no KYC is being added to any part of existing polymarket.com with this launch” and later added that the beta product would not require KYC once testing ends.
The clarification comes less than a day after a report from The Information suggested Polymarket had explored mandatory verification measures.
Stevens also responded “no” when asked whether KYC could eventually become mandatory on the main platform.
Nevertheless, regulatory pressure around prediction markets has continued to build across several regions, especially as authorities question whether geoblocking systems and anonymous trading structures are enough to prevent restricted access.
Polymarket faces growing compliance pressure
According to Polymarket’s public documentation, users from dozens of jurisdictions remain blocked from trading or restricted to closing existing positions. The company states that these controls are tied to sanctions compliance, anti-money laundering rules and local regulatory obligations.
Among the restricted regions listed by Polymarket are the U.S., Russia, the U.K., France, Germany, Iran and the Netherlands. In some jurisdictions, including Poland, Singapore, Thailand and Taiwan, users are limited to close-only trading activity. Japan is currently listed under a frontend restriction category.
Earlier reporting from The Information said the company had considered stronger identity verification procedures as regulators increased pressure over sanctions exposure and access through unofficial workarounds. It alleged that some traders in blocked markets have continued reaching the platform through bots, alternative routing tools and community-organized methods that bypass standard geofencing restrictions.
Inside Polymarket’s own developer documentation, the platform instructs builders to check a geoblock endpoint before processing trades and warns that orders from restricted regions will be rejected. Separate documentation also notes that users who complete KYC or KYB verification can gain access to direct co-location services in the platform’s primary server region.
Regulators and lawmakers have also intensified scrutiny around market integrity and insider trading risks tied to event contracts.
Earlier this year, seven members of the U.S. House of Representatives questioned whether the Commodity Futures Trading Commission had acted aggressively enough against suspicious trading activity connected to geopolitical prediction markets involving Iran and Venezuela.
At the enforcement level, federal agencies have recently pursued insider trading allegations tied directly to Polymarket activity. As previously reported, U.S. authorities charged Google software engineer Michele Spagnuolo with allegedly using confidential company information to profit from Polymarket bets linked to Google’s 2025 search trend rankings.
Access restrictions continue expanding
Outside the U.S., enforcement pressure has also expanded into Europe and Latin America.
Back in April, Brazilian authorities moved to block 27 prediction market platforms, including Polymarket and Kalshi, after regulators said the services operated outside the country’s legal structure.
More recently, Spain’s gambling regulator blocked local access to both platforms while legal proceedings tied to alleged unlicensed gambling activity continue.
As previously reported by crypto.news, similar reports have also emerged from India.
Despite those restrictions, Polymarket has still pursued international expansion. Reports in April said the company had entered discussions with the CFTC regarding a possible return to the U.S. market, while separate reports in May said the platform was exploring entry into Japan despite strict gambling laws in the country.
At the platform level, Polymarket has already tightened certain internal rules. In March, the company introduced tighter market-integrity policies across both its decentralized platform and its CFTC-regulated exchange operations, warning that violations could result in account suspension, monetary penalties, or referrals to law enforcement agencies.
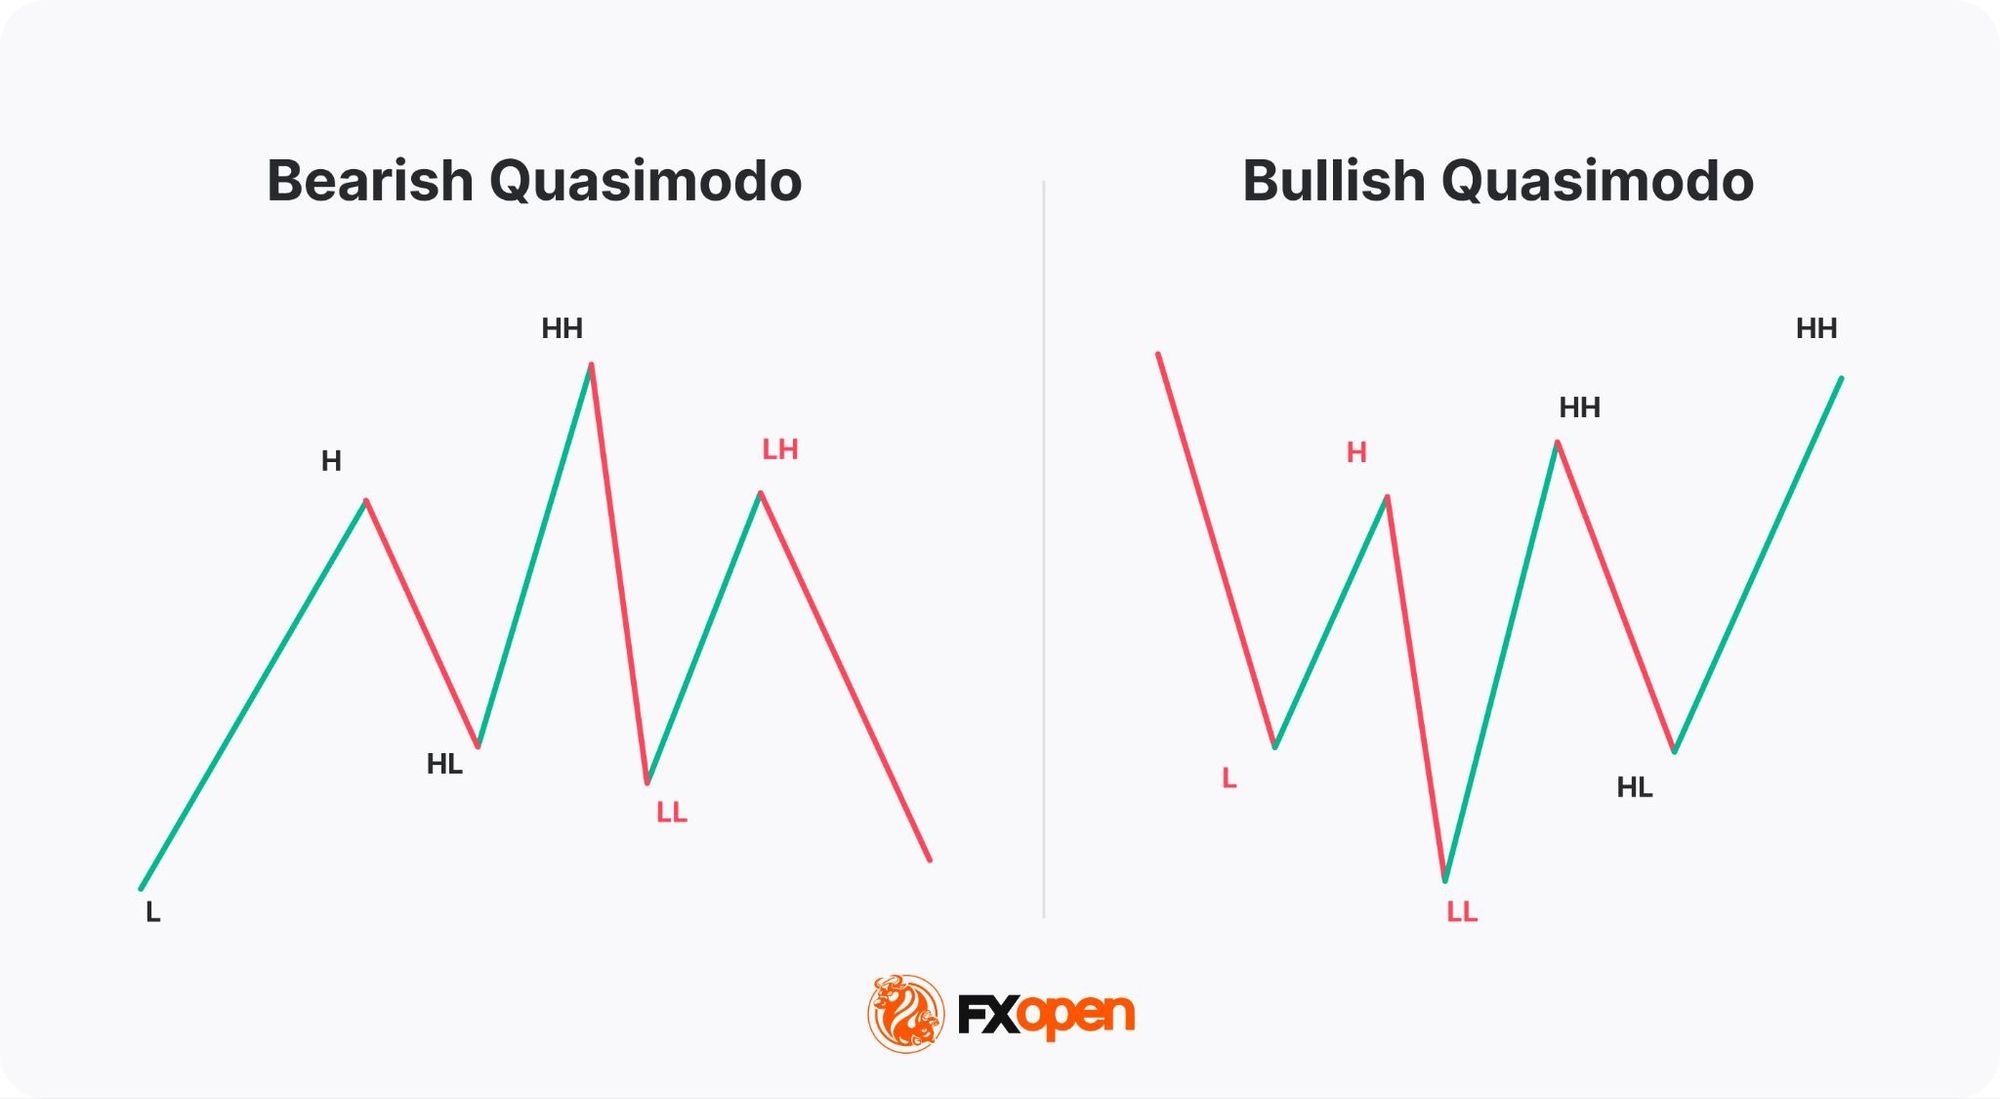
The Quasimodo pattern is a reversal structure that closely resembles the Head and Shoulders. Many traders overlook it or mistake it for its more popular counterpart in price action trading. The QM pattern has distinct entry, stop-loss, and take-profit rules that set it apart. This article covers its structure, the methods used to confirm signals, and the execution rules.
Quasimodo Pattern Structure Explained
The Quasimodo pattern is a reversal chart structure that forms at the end of a trend. The QM pattern relies on a failed continuation. Price prints a higher high (or lower low) in line with the trend. Then it reverses and breaks the prior swing in the opposite direction. This break invalidates the previous structure and signals exhaustion. QM pattern trading suits any timeframe. A Quasimodo trading strategy may be used across forex, stock, and commodity charts.
The pattern has two variants:
- Bearish Quasimodo: appears after an uptrend and signals a potential downtrend.
- Bullish Quasimodo (inverse): appears after a downtrend and signals a potential uptrend.
Bearish and Bullish QM Structure
A bearish QM occurs at the end of an uptrend and signals the formation of a new downtrend. It consists of three peaks (a head in the middle and two shoulders at the sides) and two troughs. The second peak (head) is the highest, and the second trough is the lowest.
A bearish QM reversal pattern forms in six moves:
- Price prints a left shoulder high, then pulls back to the first trough.
- It pushes to a higher high (the head), then pulls back below that trough.
- Price rallies to a right shoulder lower than the head.
- The lower low between head and right shoulder breaks bullish structure.
- Price moves downward from the right shoulder.
- Failure to retake the head confirms sellers have taken over.
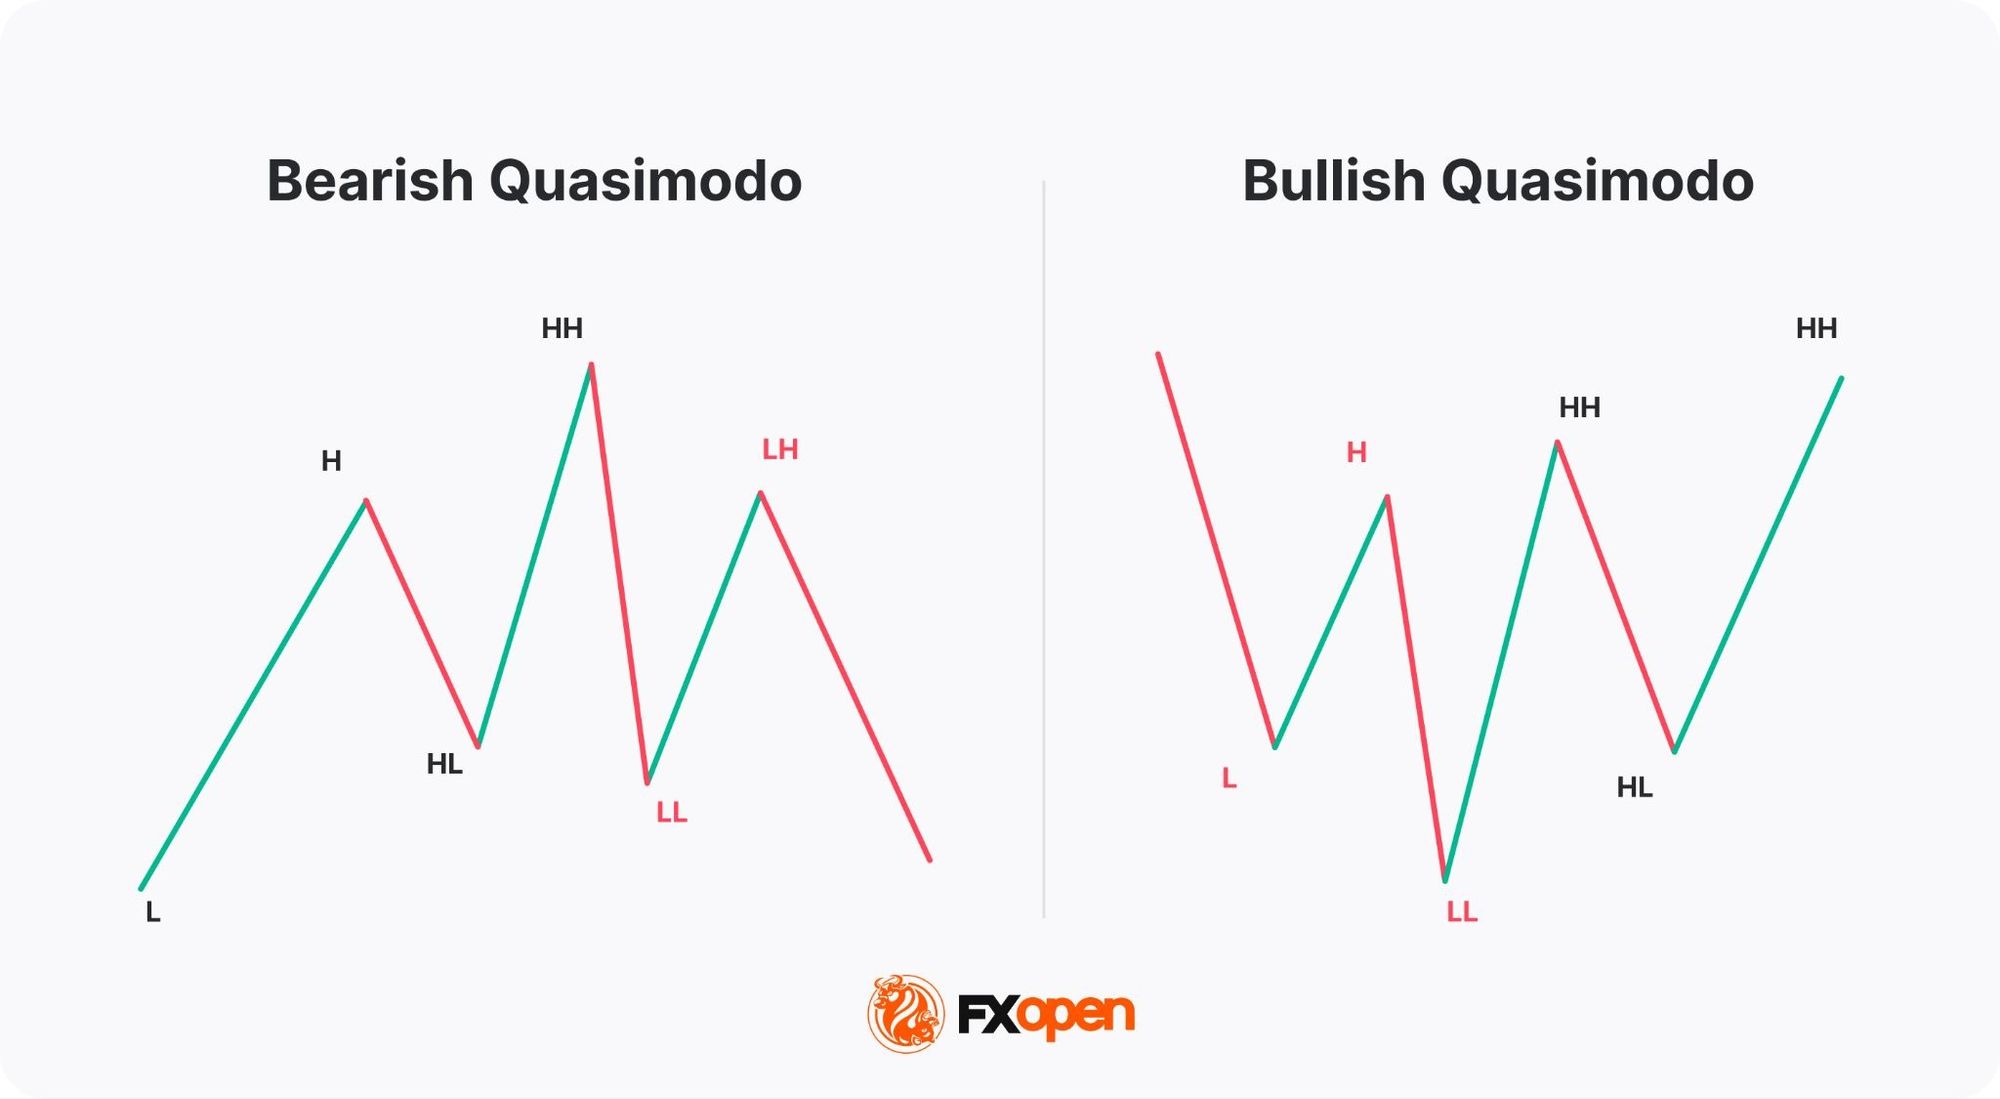
A bullish (inverse) Quasimodo occurs at the end of a downtrend and signals a potential uptrend. It consists of three lows (a head in the middle and two shoulders at the sides) and two tops, where the second trough (head) is the lowest and the second top is the highest.
A bullish QM forms in six moves:
- Price prints a left shoulder low, then rallies to the first peak.
- It pushes to a lower low (the head), then rallies above that peak.
- Price pulls back to a higher low (right shoulder).
- The higher high between head and right shoulder breaks bearish structure.
- Price reverses upward with the right shoulder.
- Failure to retake the head’s low confirms buyers have taken over.
Market Structure Behind the QM Pattern
The QM pattern reflects a specific shift in market structure. Price extends the prevailing trend by sweeping the prior swing high or low. This sweep often triggers stops and absorbs liquidity sitting above old highs or below old lows.
Buyers (or sellers) fail to push price further. The market then reverses and breaks the opposite swing, invalidating the trend’s structure. This failed continuation is what gives the QM its reversal signal.
In terms of reliability, the Quasimodo pattern is considered useful for identifying trend reversals, particularly when supported by other technical indicators like the RSI or MACD. Unlike more common patterns, the QM pattern provides distinct entry and exit points.
Its reliability might increase in strongly trending markets, where the previous trend is well-defined, and the pattern clearly indicates a reversal. CME Group’s reference on reversal chart patterns notes that confirmation through volume or follow-through movement strengthens any reversal signal.
QM Pattern Trading Strategy Rules
The Quasimodo trading strategy defines four execution components tied to pattern structure:
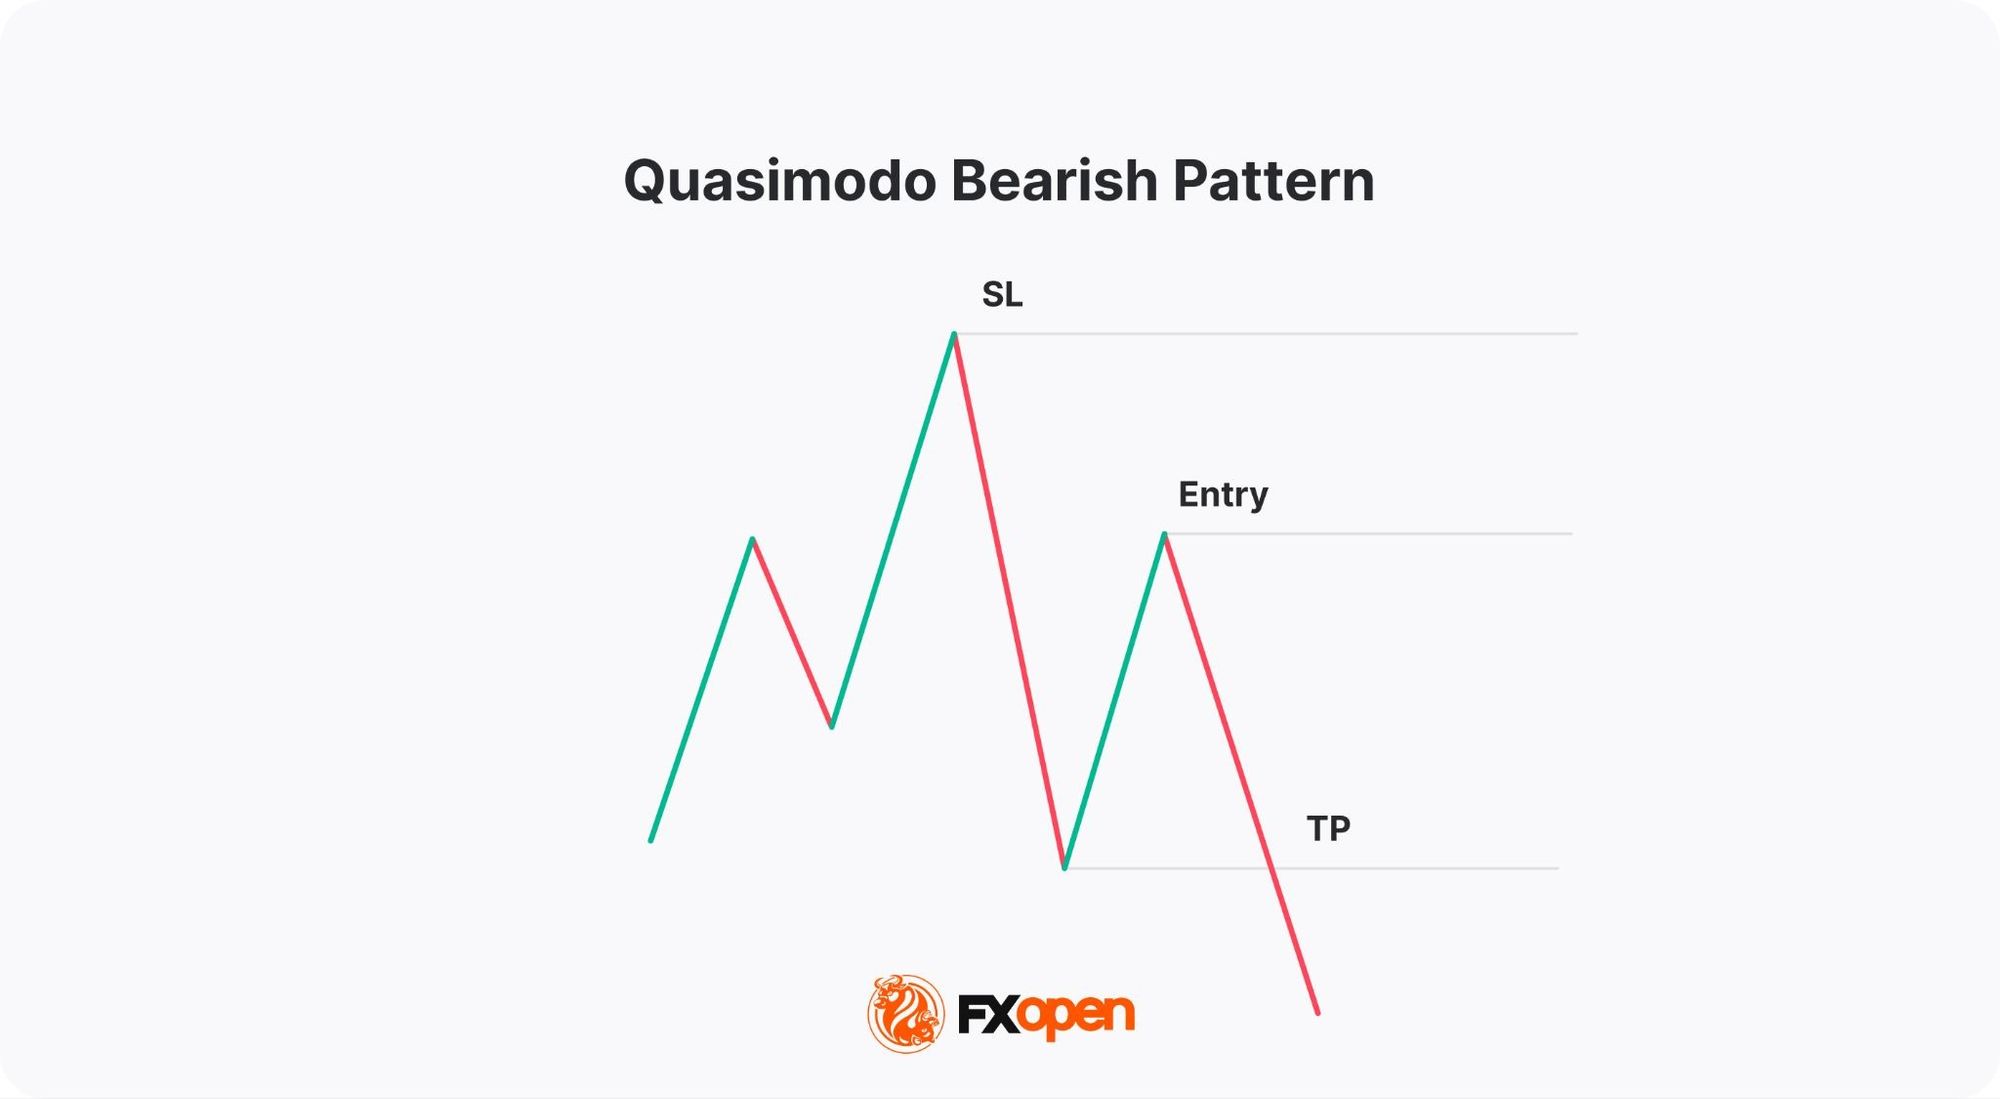
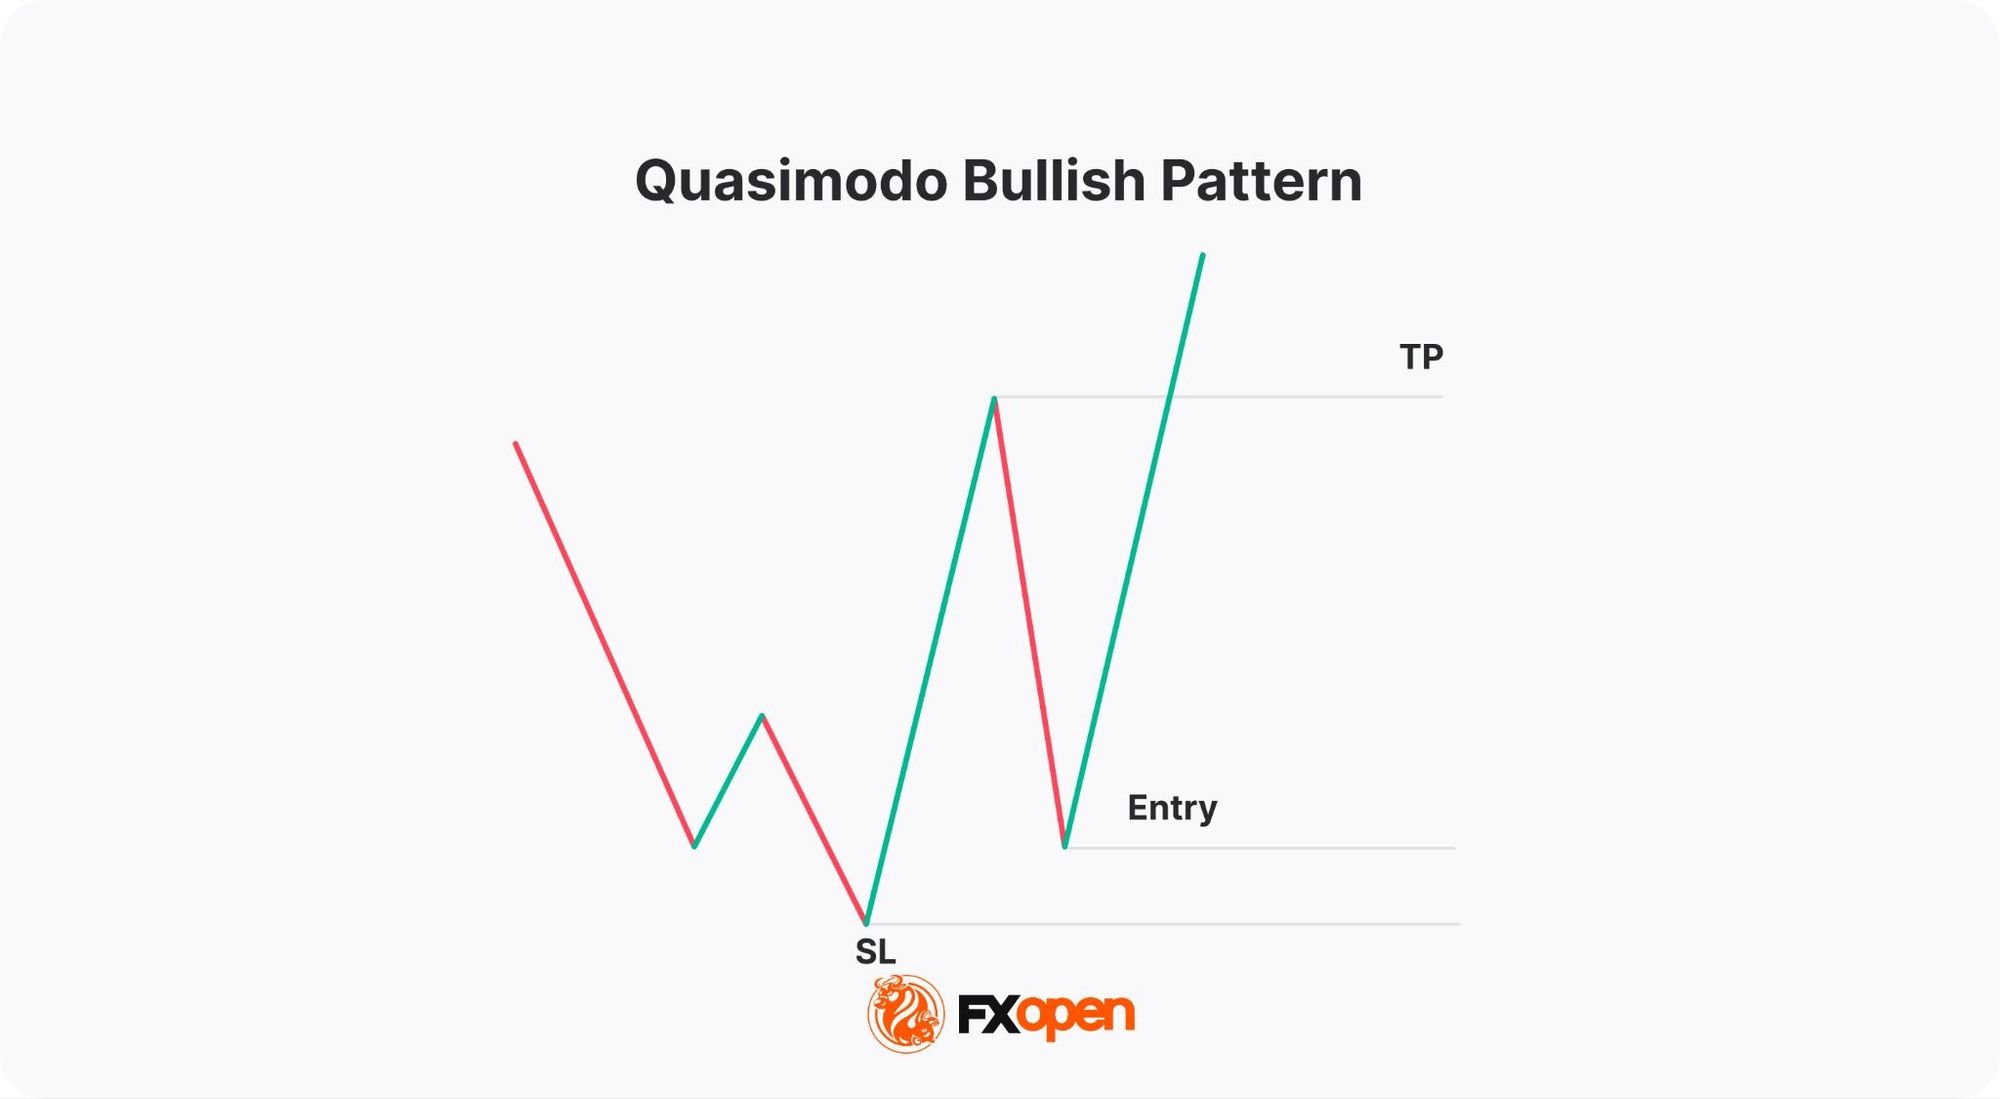
- Entry: a position is typically opened as the right shoulder forms, after price reverses from the head’s extreme.
- Stop-loss: placed just beyond the head, since a move through that level invalidates the structure.
- Take-profit: set at the second trough (bearish) or second peak (bullish), which marks the prior swing the pattern broke.
- Invalidation: price closing beyond the head, or failing to reverse from the right shoulder area, cancels the setup.
Risk-to-reward depends on shoulder placement. A right shoulder formed close to the second trough (or peak) shortens the take-profit distance and may produce a 1:1 ratio or worse. A shoulder formed further away can deliver 1:2 or 1:3. In a QM entry strategy, traders often filter setups by the structural geometry rather than entering every formation.
Entry and Risk Parameters
The table below summarises the QM pattern entry and stop loss logic for both directions:
Variations and Execution Adjustments
Any theory is always based on perfect conditions, but the actual market often differs. For example, on the chart below, the take-profit target (1) is three times smaller than the stop-loss level (2). In such cases, standard rules don’t work.
In this particular case, we would avoid trading as the risk/reward ratio is negative and potential loss is twice potential profit.
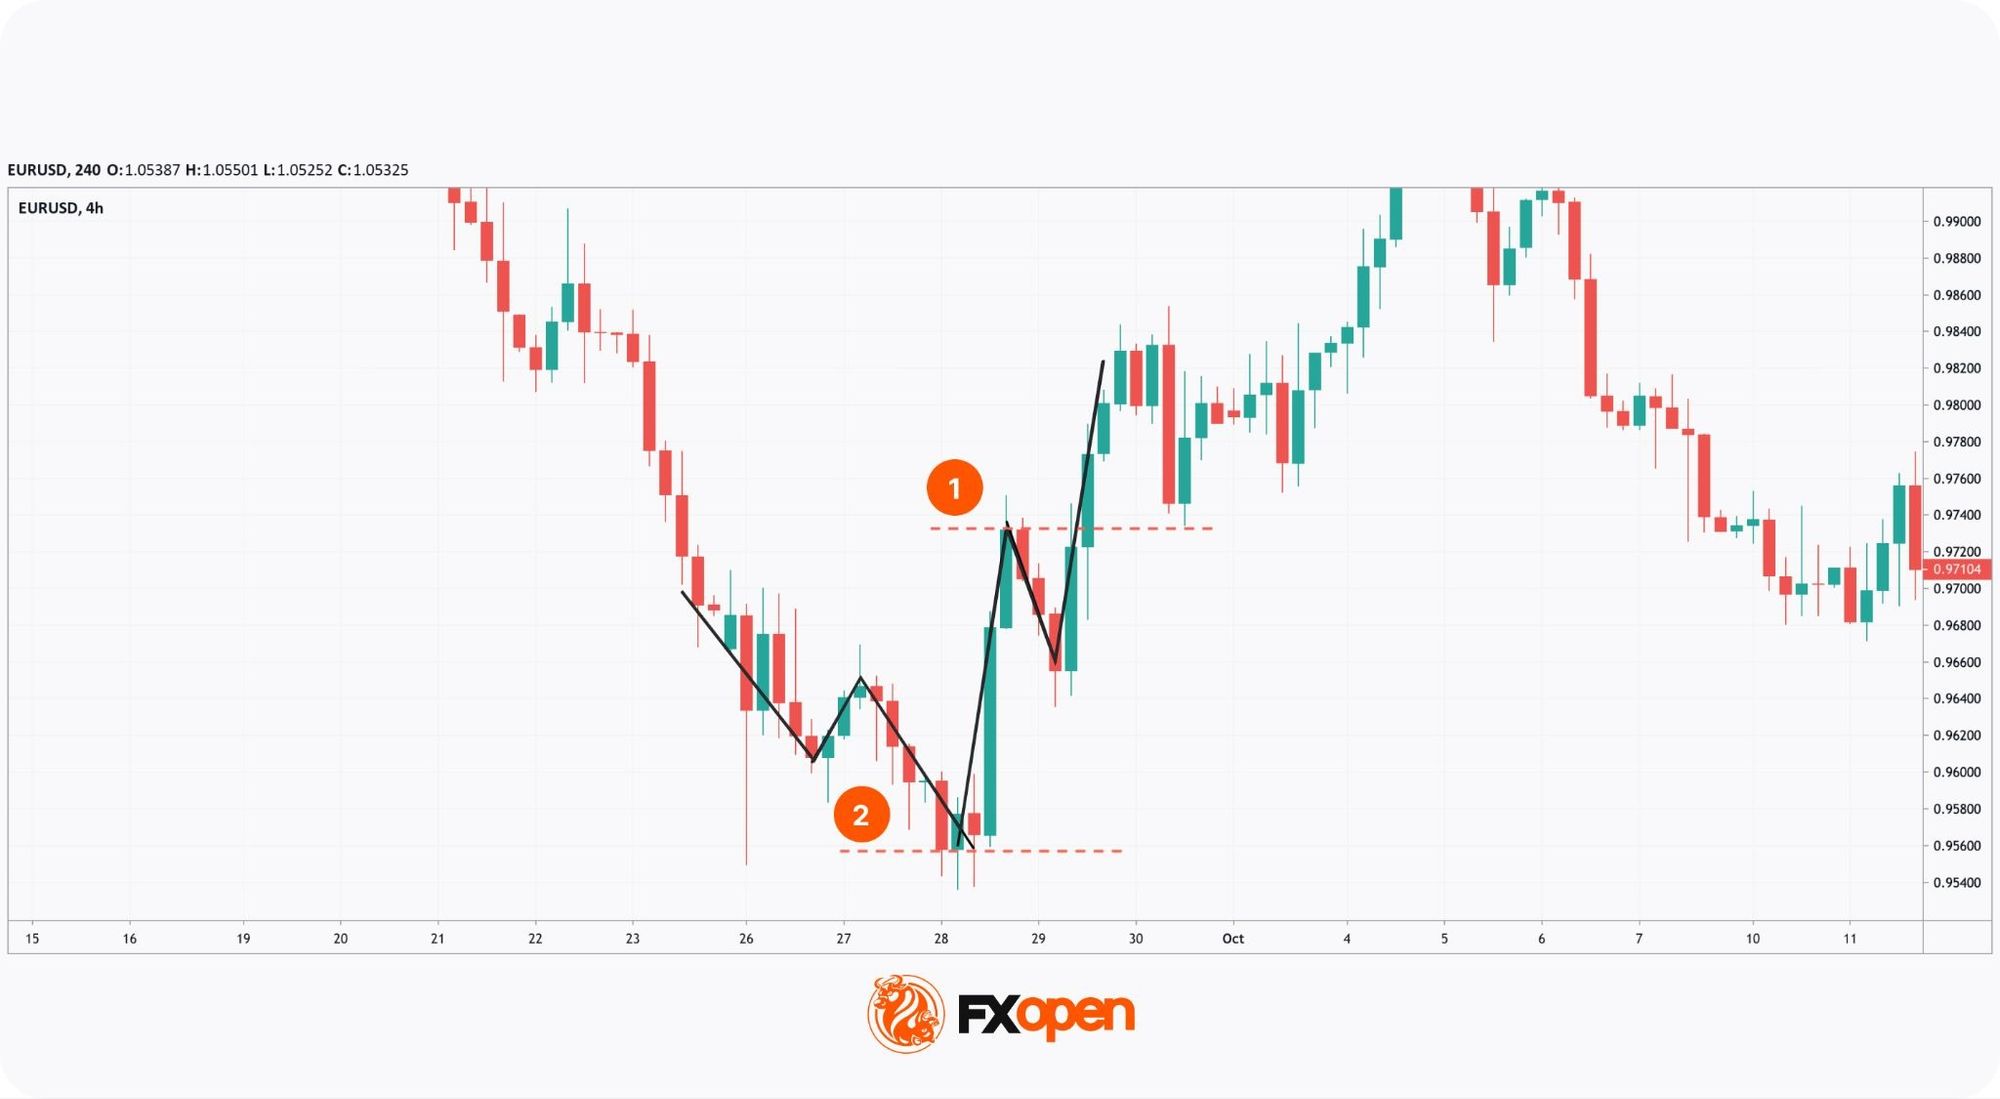
Distorted Quasimodo forex structures often appear in three forms:
- Asymmetric shoulders, where the right shoulder sits far closer to the head than the left, leaving little room for a meaningful take-profit.
- A shallow head break, where price only marginally clears the prior swing before reversing, which weakens the liquidity sweep logic.
- A sloped or skewed neckline, where the troughs (or peaks) sit at very different levels, blurring the pattern boundary.
A setup is often avoided when:
- The risk-to-reward ratio falls below 1:1 after measuring entry to head and entry to the second swing.
- The prior trend is weak or choppy, since the pattern relies on a defined trend to reverse.
- Higher-timeframe structure conflicts with the QM pattern trading direction, such as a bearish QM forming inside a strong daily uptrend.
- Confirmation tools fail to align with the reversal signal.
Quasimodo vs Head and Shoulders
The QM and the Head and Shoulders are reversal patterns. They look similar but still differ and provide different entry/exit points. Take a look at the image below.
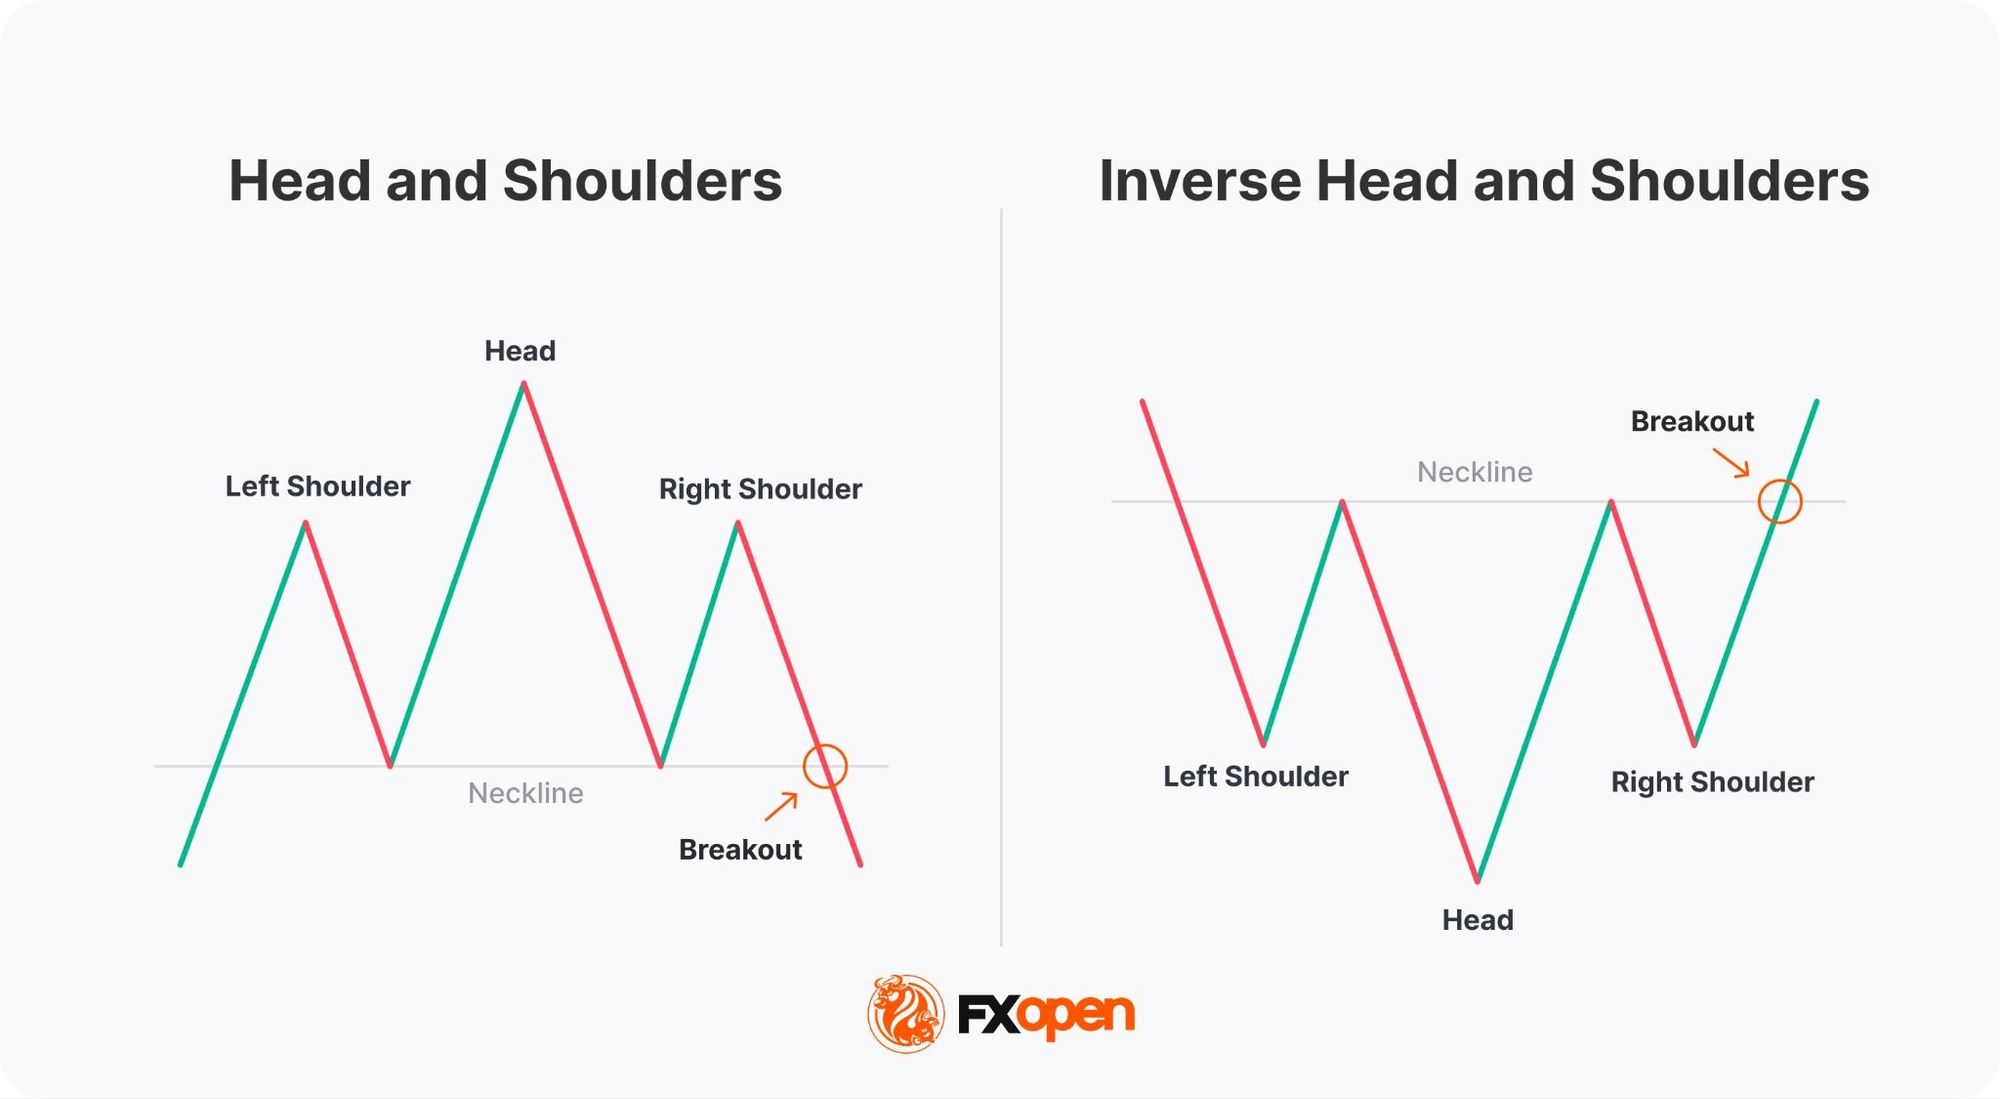
The bearish Head and Shoulders also has three maximums and two minimums, where the second peak (head) is the highest. However, the second trough is at the same level as the first one. This is the difference between the QM and the Head and Shoulders patterns.
The inverse Head and Shoulders consists of three lows and two peaks, where the second trough (head) is the lowest, and the second top is at the same level as the first.
To make it easier, draw a line, a so-called ‘neckline’, through the two troughs in a bearish formation and the two maximums in a bullish one. If the neckline is horizontal, it’s the Head and Shoulders. If it’s angled, it’s the Quasimodo.
The table below highlights the structural and execution differences:
The practical effect of these structural differences:
- When trading the bearish QM pattern, you are supposed to go short on the right shoulder. In the Head and Shoulders, you would wait for the price to break below the neckline after the right shoulder.
- In the inverse QM, you enter the trade at the third trough (right shoulder). But when trading on the inverse head-and-shoulders formation, the common rule is to enter the market not on the second shoulder but after the price breaks above the neckline.
QM Pattern Confirmation Method
Although patterns are reliable technical analysis tools, they must be validated.
Confirmation works in a priority order. Price structure comes first: the head must clearly break the prior swing, and the right shoulder must form below (or above) it. Divergence on RSI or MACD comes second, strengthening the signal where momentum disagrees with price. A moving average crossover near the right shoulder comes third, acting as a trend-bias filter.
Timing matters as much as the signal itself. Confirmation that prints before or at the right shoulder is treated as proactive. A signal that appears only after the right shoulder reverses adds weight but reduces the entry window.
Divergence
RSI and MACD signal a trend reversal in several ways, but the divergence method is the most dependable.
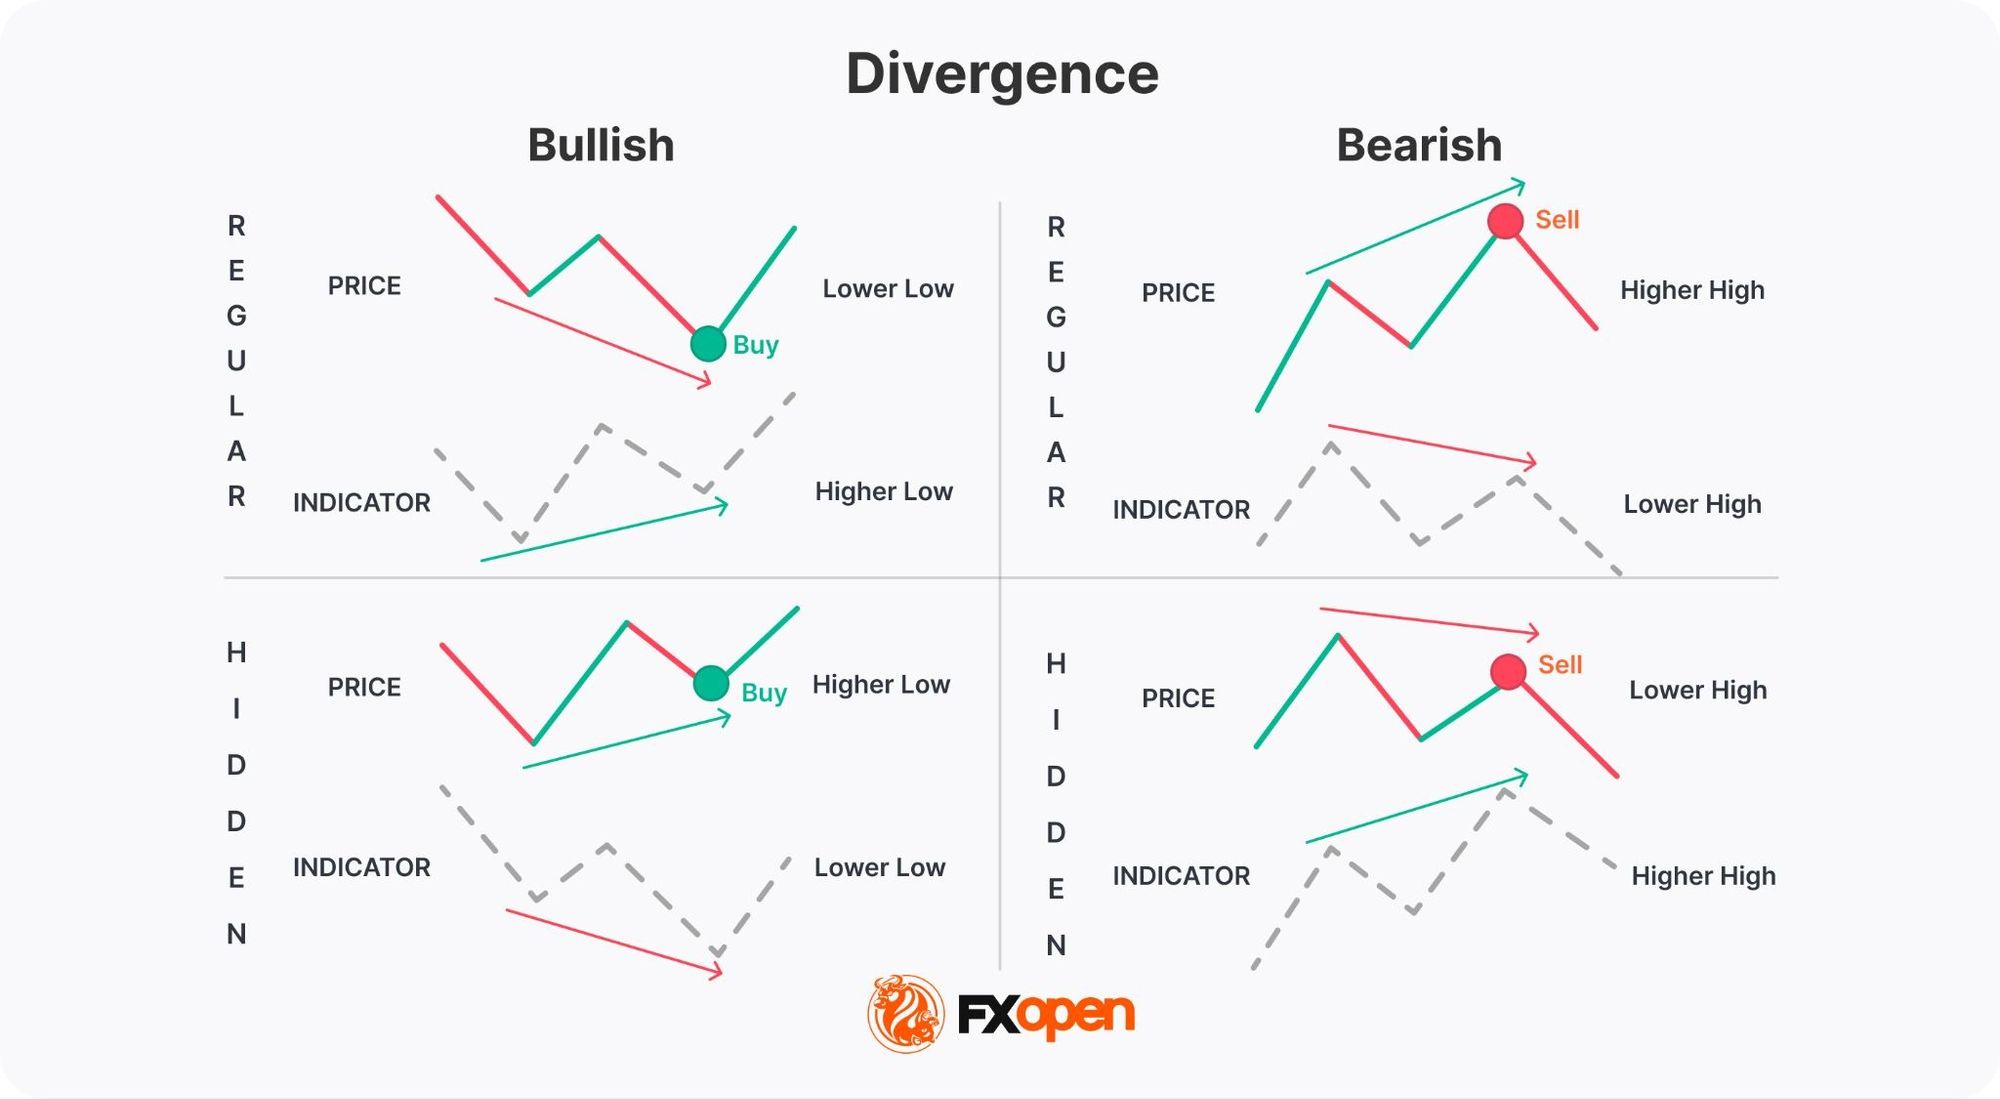
- Regular Bullish Divergence: When the price creates lower lows, but the indicator forms higher lows, it suggests the market might be poised for an upward turn.
- Regular Bearish Divergence: When the price reaches higher highs, but the indicator forms lower highs, it indicates a potential market decline.
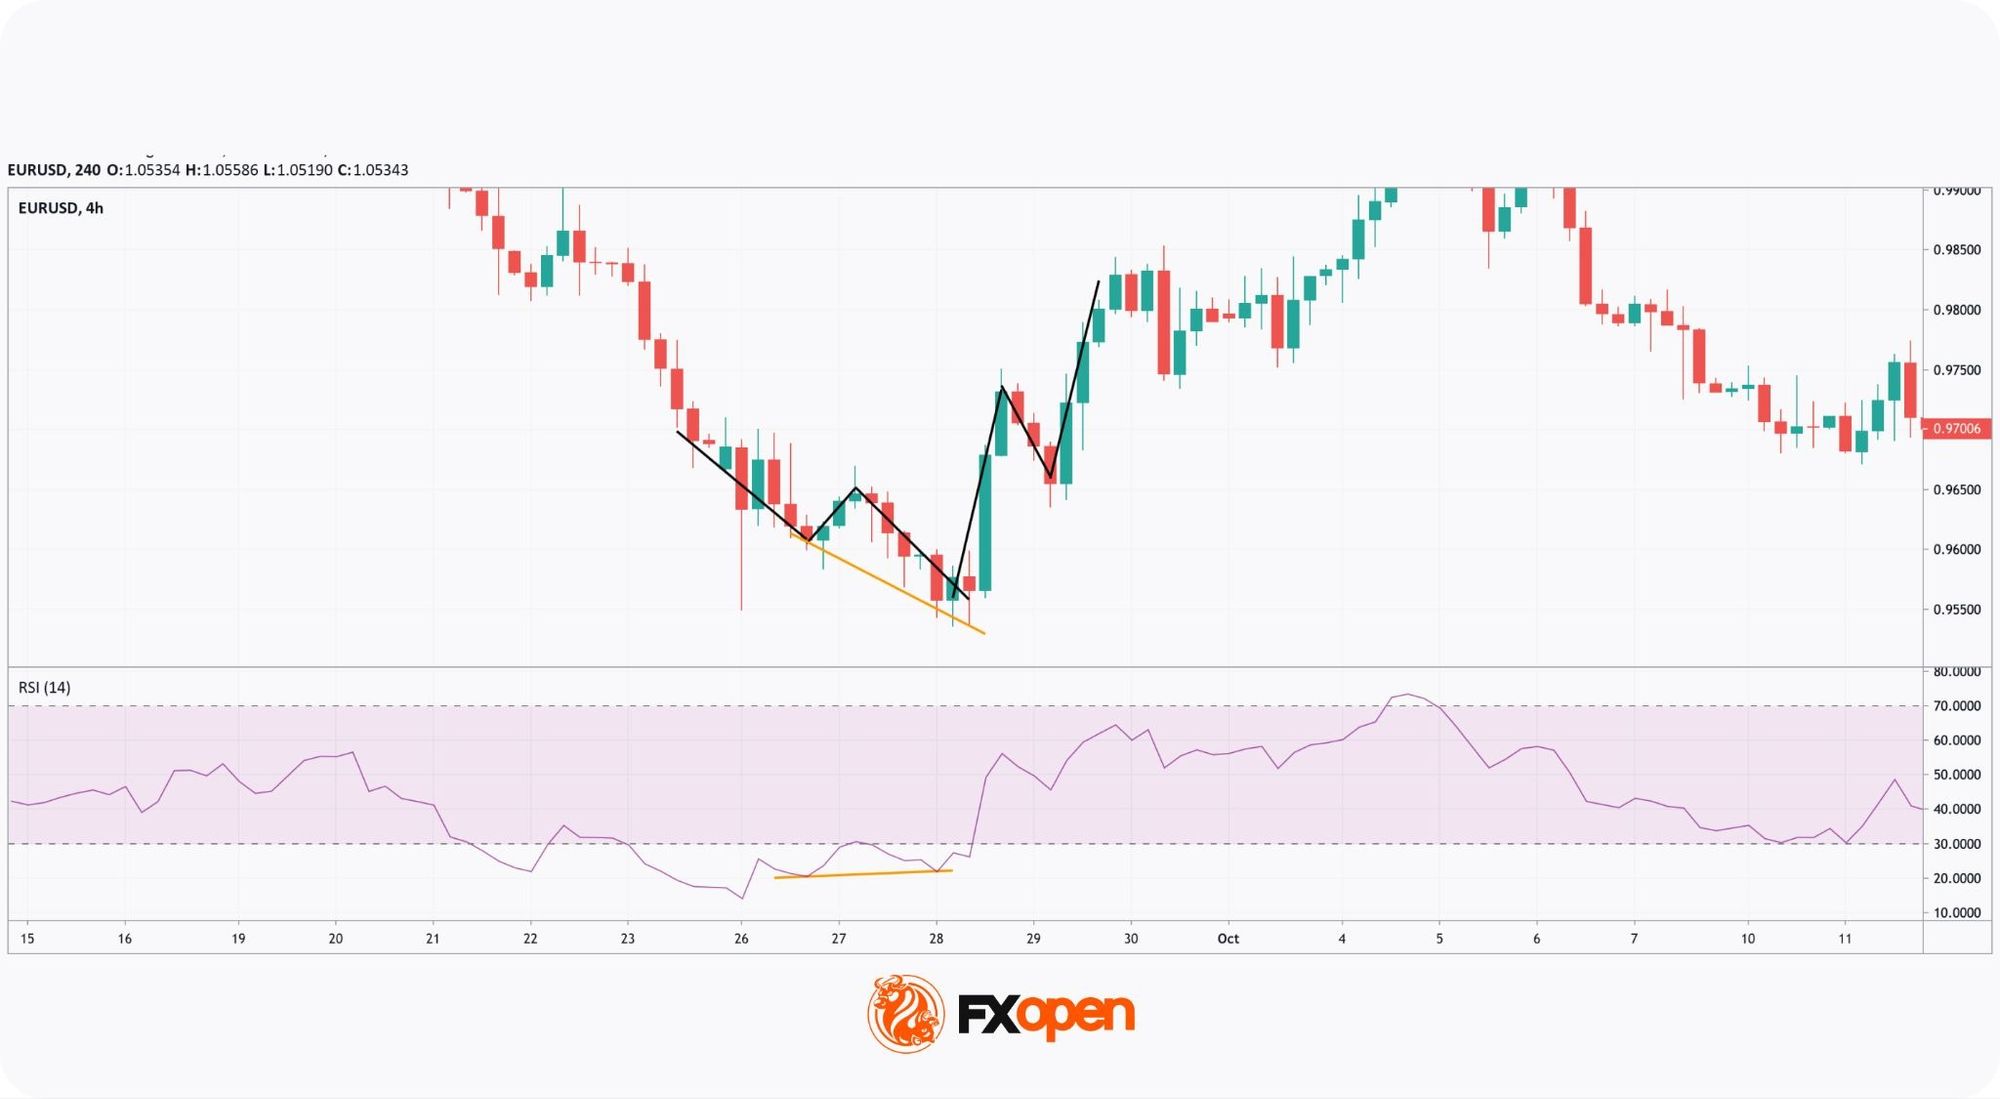
The chart above shows a regular bullish divergence between the price chart and the RSI indicator. As the RSI formed a higher low and left the oversold area, you can anticipate a price reversal. Once the second shoulder of the Quasimodo appears, the market creates conditions for a buy trade.
Divergence strengthens a QM signal when it prints between the head and the right shoulder, on the same timeframe as the pattern. It weakens when:
- The divergence appears on a lower timeframe but is absent on the pattern’s own timeframe.
- The indicator extreme is shallow (e.g., RSI barely leaves overbought or oversold).
- Momentum aligns with the prior trend instead of disagreeing with it.
Moving Averages
A simple moving average is widely used to confirm a trend reversal. You will need two MAs with different periods, depending on the timeframe you trade on. 50-, 100-, and 200-period MAs are typically used on high timeframes, while 9-, 12-, and 21-period MAs are more popular on shorter-term periods.
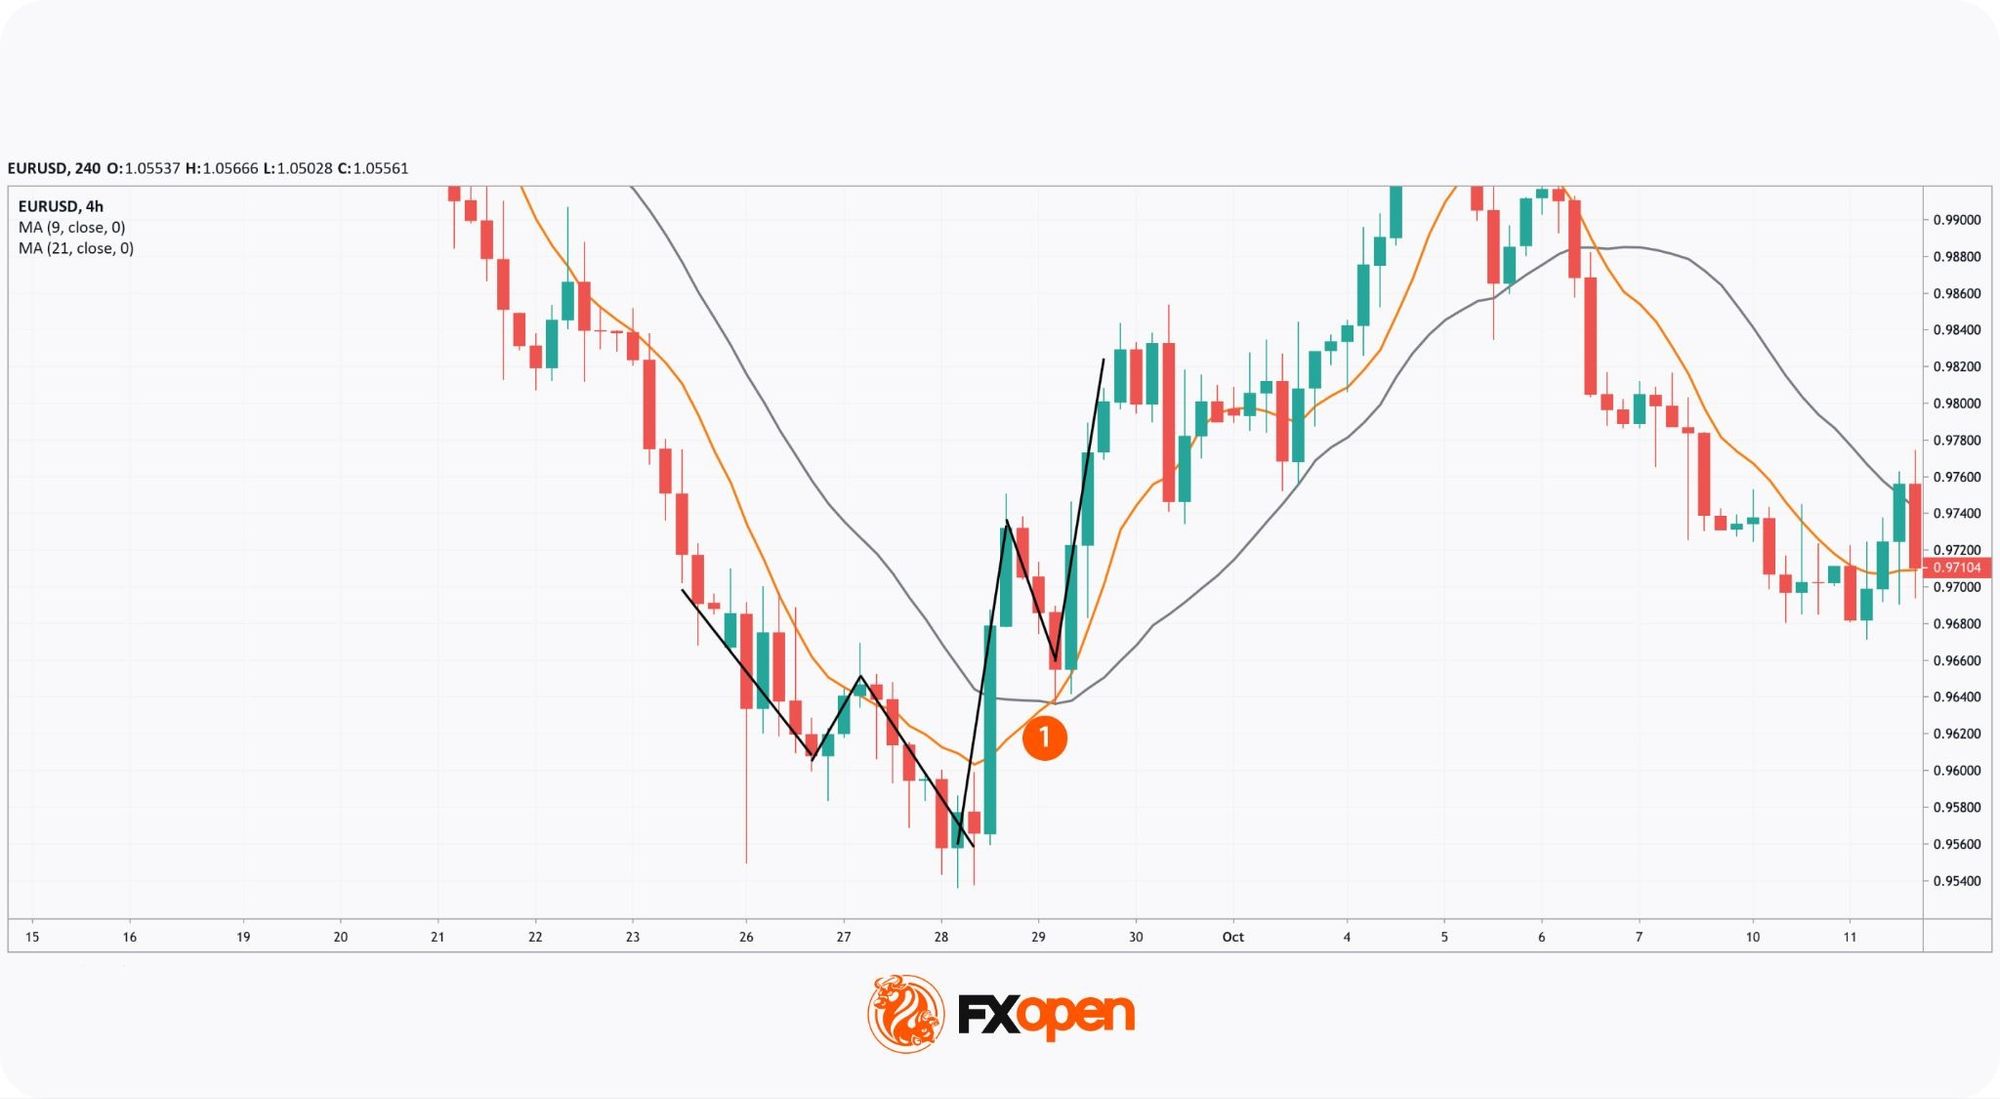
Let’s look at the 4-hour chart of the EUR/USD pair. The price formed an inverse QM. When the second bottom appeared on the chart, a 9-hour MA crossed the 21-hour MA from bottom to top (1). It’s a so-called golden cross that signals an upward movement. As the cross occurred before the price formed the third bottom of the QM, you could open a buy trade at the second shoulder with a strong confirmation.
MA periods should align with the trade’s timeframe. A QM on the 4-hour chart pairs naturally with a 9 and 21 MA, since those react fast enough to confirm the right shoulder. A daily QM calls for 50 and 200 MAs, which filter noise and reflect institutional trend bias.
Using short MAs on a high-timeframe QM produces too many crossovers and weakens the confirmation. Using long MAs on a short-timeframe QM lags the entry and may miss the reversal entirely.
If you want to practice spotting the QM pattern, you may consider using FXOpen’s TickTrader trading platform.
Execution Conditions for QM Pattern
Before executing a Quasimodo trading strategy, traders typically run through a checklist that combines pattern validity, confirmation, and risk control:
Pattern validity:
- The prior trend is clearly defined, not choppy or sideways.
- The head breaks the prior swing decisively, not by a few pips.
- The right shoulder sits below the head (bearish) or above the head (bullish), not at the same level.
Confirmation:
- At least one confirmation tool aligns with the reversal direction — divergence, MA crossover, or a clean reversal candle at the right shoulder.
- Higher-timeframe structure does not contradict the trade direction.
Risk control:
- Stop loss sits just beyond the head, with the distance accepted before entry.
- Risk-to-reward measures at least 1:1, with 1:2 or better preferred, after accounting for the take-profit at the prior swing.
- Position size respects the wider risk management plan, with potentially no more than 1–2% of account capital exposed per trade.
Additional reminders:
- Don’t confuse bearish and bullish formations. A QM is formed at the end of an uptrend, while an inverse QM appears when the downtrend ends.
- Don’t confuse the Quasimodo trading pattern with the Head and Shoulders.
Common Execution Errors
When trading the QM pattern, traders often fall into common mistakes:
- Ignoring confirmation signals: Failing to use additional indicators, momentum indicators, to confirm the pattern can lead to premature or losing trades. Consequence: traders enter at the right shoulder before momentum confirms the reversal, often catching a continuation move against them.
- Overtrading: Trying to trade every Quasimodo pattern without considering the broader market context or trend strength can result in overtrading and losses. Consequence: capital exposure compounds across multiple weak setups, eroding the account even when individual trades look reasonable in isolation.
- Neglecting market conditions: Not accounting for low volatility or trading during choppy market conditions can reduce the pattern’s reliability. Consequence: the QM relies on directional follow-through. In a range, price often returns to the head and triggers the stop-loss before reaching the take-profit.
- Misjudging pattern completeness: Entering trades before the second swing fully forms may result in false signals and unexpected reversals. Consequence: the right shoulder may extend past the head, invalidating the structure mid-trade and forcing an exit at the stop-loss.
- Improper position sizing: Failing to adjust position sizes based on market conditions or pattern strength can lead to excessive risk. Consequence: a single failed QM can wipe out the gains from several successful setups when sizing ignores the stop-loss distance.
Summary
The QM pattern is a reversal structure built on a failed continuation followed by a break of prior swing. Its execution rules tie entries to the right shoulder, stops to the head, and targets to the broken swing.
Confirmation through price structure, divergence, and moving average alignment strengthens the signal but does not replace it. A Quasimodo trading strategy is considered to work when the prior trend is well-defined and risk-to-reward measures at least 1:1.
Traders interested in applying these execution rules can open a trading account at FXOpen to test the QM pattern across forex and CFDs on stocks, indices, and commodities.
FAQ
What Does Quasimodo Mean in Trading?
In trading, the Quasimodo definition refers to a reversal pattern that signals a potential change in the trend direction. It indicates a shift from an uptrend to a downtrend (bearish Quasimodo) or a downtrend to an uptrend (bullish Quasimodo). Traders use it to identify entry and exit points.
What Is the Quasimodo Structure?
The Quasimodo consists of three peaks and two troughs in the bearish pattern and three troughs and two peaks in the bullish pattern. The middle peak or trough (head) is the most prominent, flanked by two smaller shoulders.
How May Traders Use the Quasimodo Pattern?
Traders use the Quasimodo pattern to enter trades at potential reversal points. Typically, they look to sell near the right shoulder in a bearish QM or buy near the right shoulder in a bullish QM. The invalidation level is usually set just beyond the head, while profit targets are placed at the closest swing.
What Is the Quasimodo Pattern in Crypto*?
The QM meaning in crypto* is the same as in other markets. The Quasimodo signals potential trend reversals in digital assets. The reliability of its signals often depends on market conditions and is typically confirmed with indicators like oscillators or those that reflect trends.
What Confirms a Valid Quasimodo Pattern?
Confirmation works in three layers. First, the price structure itself: the head must break the prior swing decisively, and the right shoulder must form below (or above) it. Second, momentum indicators like RSI or MACD showing divergence against price. Third, a moving average crossover that aligns with the reversal direction. A pattern with all three layers carries more weight than one supported by structure alone.
Does the Quasimodo Pattern Work on All Timeframes?
The QM pattern can form on any timeframe, but reliability tends to vary. Higher timeframes (4-hour, daily, weekly) produce fewer setups but with clearer structure and stronger follow-through. Lower timeframes (15-minute, 1-hour) produce more setups but carry more noise, more false breaks at the head, and more shallow shoulders that fail to develop. Most traders apply the pattern on medium-term timeframes.
*Important: At FXOpen UK, Cryptocurrency trading via CFDs is only available to our Professional clients. They are not available for trading by Retail clients. To find out more information about how this may affect you, please get in touch with our team.
This article represents the opinion of the Companies operating under the FXOpen brand only. It is not to be construed as an offer, solicitation, or recommendation with respect to products and services provided by the Companies operating under the FXOpen brand, nor is it to be considered financial advice.
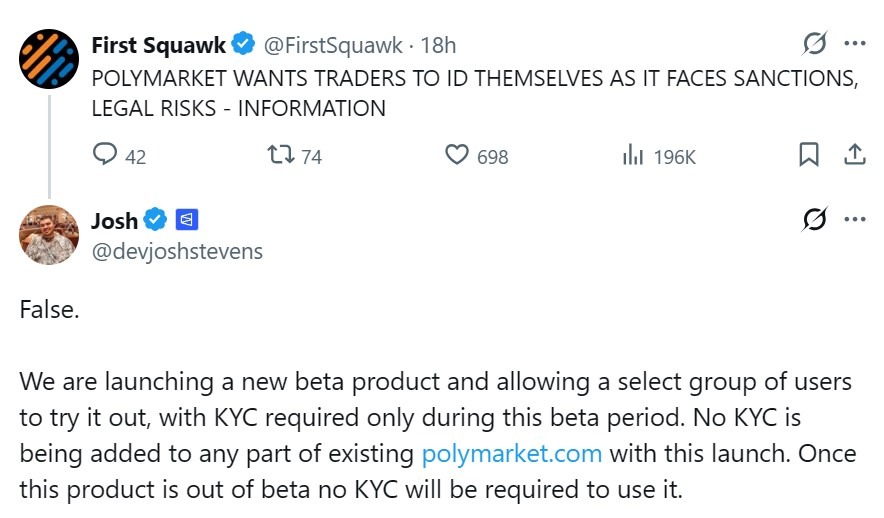
Polymarket’s vice president of engineering, Josh Stevens, clarified that the prediction market platform is not adding mandatory Know Your Customer (KYC) checks to its existing service, after a report said the company had considered user verification requirements.
Stevens said in an X response that Polymarket is launching a new beta product for a select group of users and that KYC is required only to access the beta during its early test period. “No KYC is being added to any part of existing polymarket.com with this launch,” Stevens wrote. He said that once the product is out of beta, no KYC will be required to use it.
He later addressed questions about whether KYC could be added later, saying “no” and clarifying that he was “just highlighting” that identity checks are tied to early access for a new beta product rather than a broader move away from pseudonymous trading on Polymarket’s main prediction market.
The clarification followed a report from The Information that said Polymarket had considered mandatory user verification requirements amid growing pressure from regulators.
Cointelegraph reached out to Polymarket and Josh Stevens for more information but had not received a response by publication.
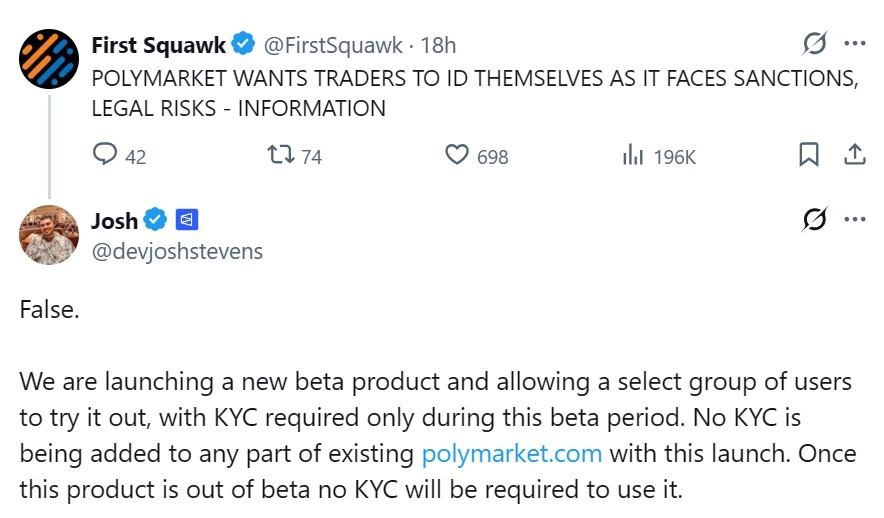
Source: Josh Stevens
Polymarket restrictions grow amid regulatory scrutiny
Polymarket’s clarification comes as the platform faces widening access restrictions across several jurisdictions.
As of Thursday, Polymarket listed dozens of restricted jurisdictions, including countries where users are blocked from placing orders and others where access is limited to closing existing positions.
Related: Monthly prediction market volume hits $25.7B as user activity shifts beyond one-off events
In April, Brazil moved to block 27 prediction market platforms, including Polymarket and Kalshi, after authorities said the services operated outside the country’s legal framework.
In May, Spain’s gambling regulator also blocked local users from Polymarket and Kalshi as a “precautionary measure” while authorities pursued legal proceedings over alleged unlicensed gambling activity.
Despite the restrictions, Polymarket has continued to pursue expansion in major markets. In April, the company was reportedly in talks with the US Commodity Futures Trading Commission over a broader US relaunch, and in May, it was reportedly seeking entry into Japan despite the country’s strict gambling laws.
Magazine: Big Questions: Do we really only need 2–5 cryptocurrencies?
Fundamental backdrop
On 27 May, the Reserve Bank of New Zealand kept the Official Cash Rate (OCR) unchanged at 2.25%, in line with market expectations. However, the decision proved finely balanced: the Monetary Policy Committee voted 3–3, with the final decision resting with Governor Anna Brehman.
In its updated rate projection path, the regulator signalled that the OCR could rise to around 2.8% by the end of the year, implying several rate hikes before year-end. Additional caution stems from the inflation backdrop: the conflict in the Middle East continues to keep inflation above the target range, while the central bank also warned about the weak pace of economic recovery. The split vote and the signal of likely future tightening supported the New Zealand dollar during the Asian session.
Technical picture
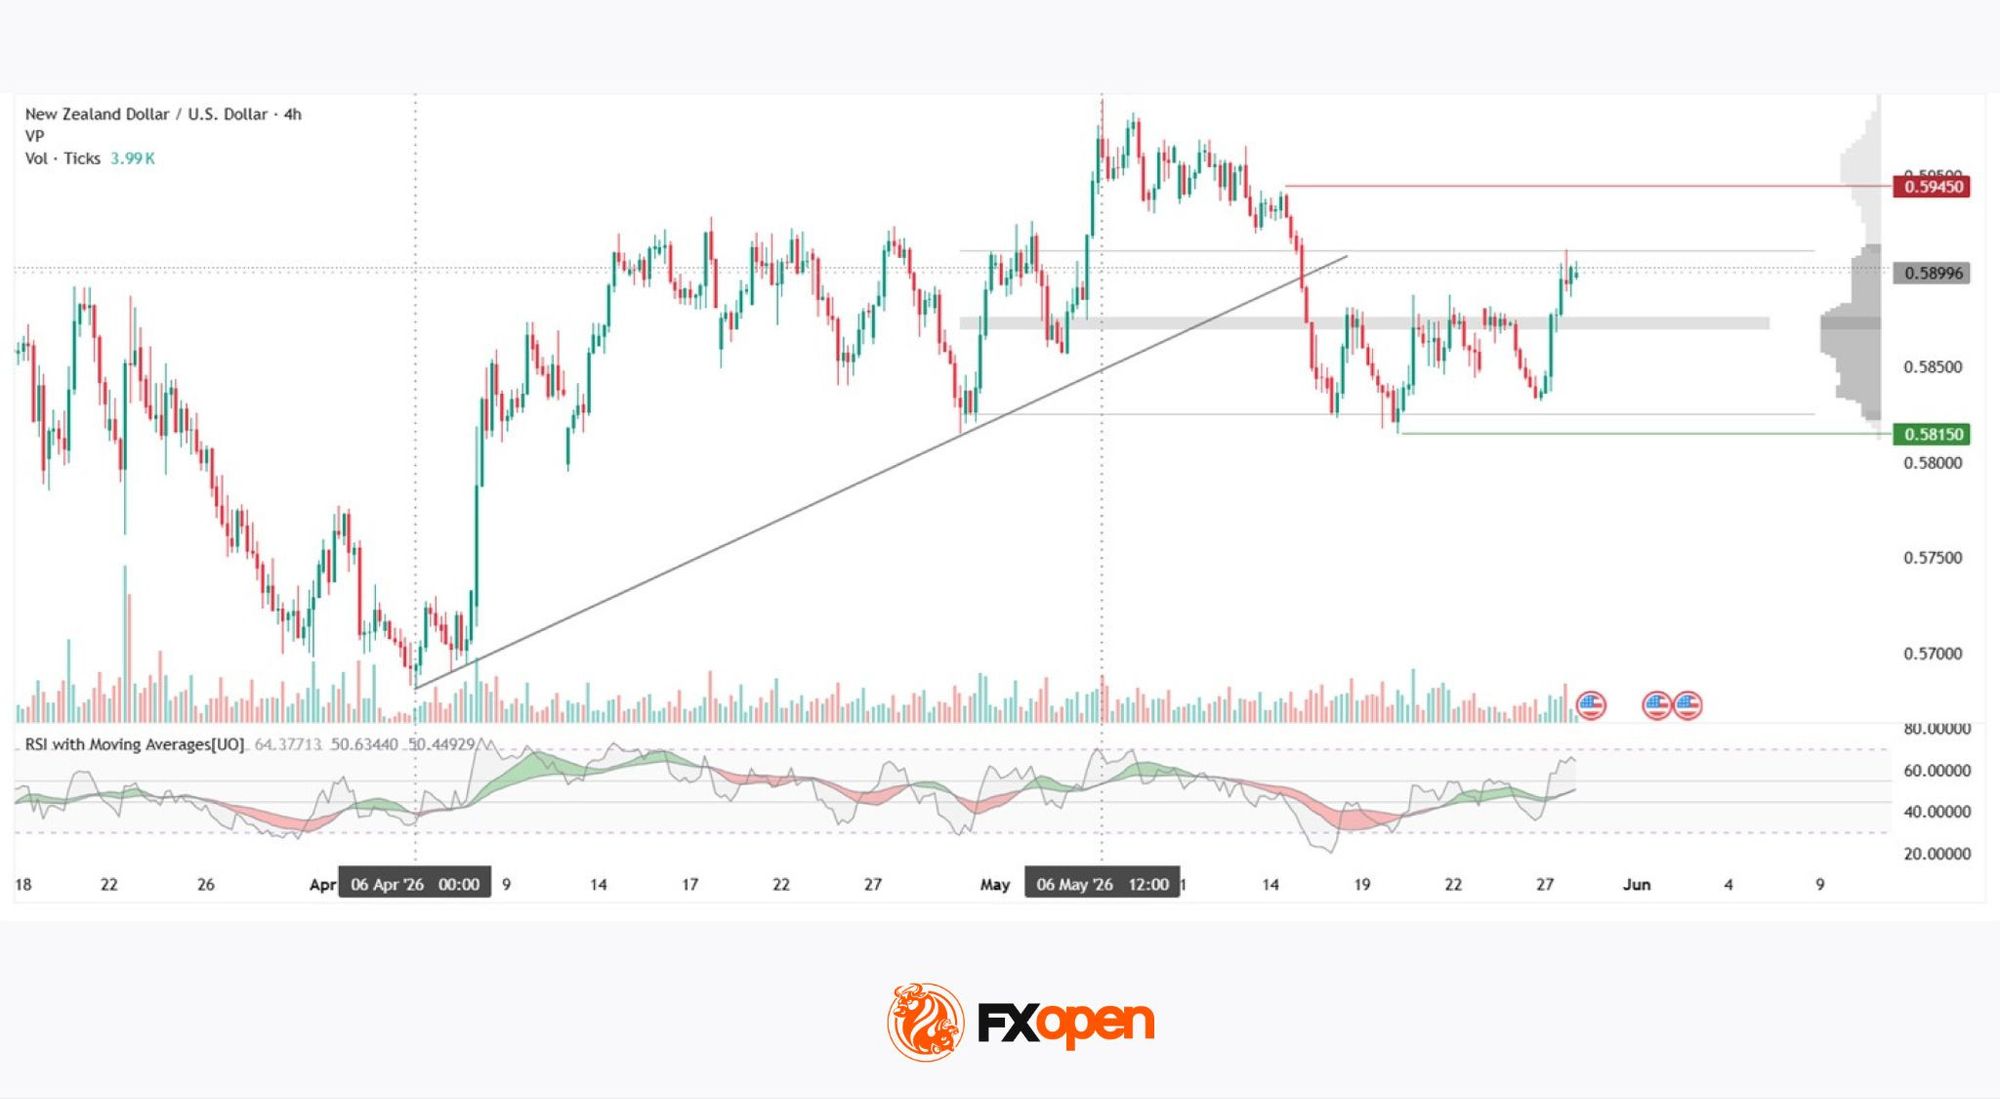
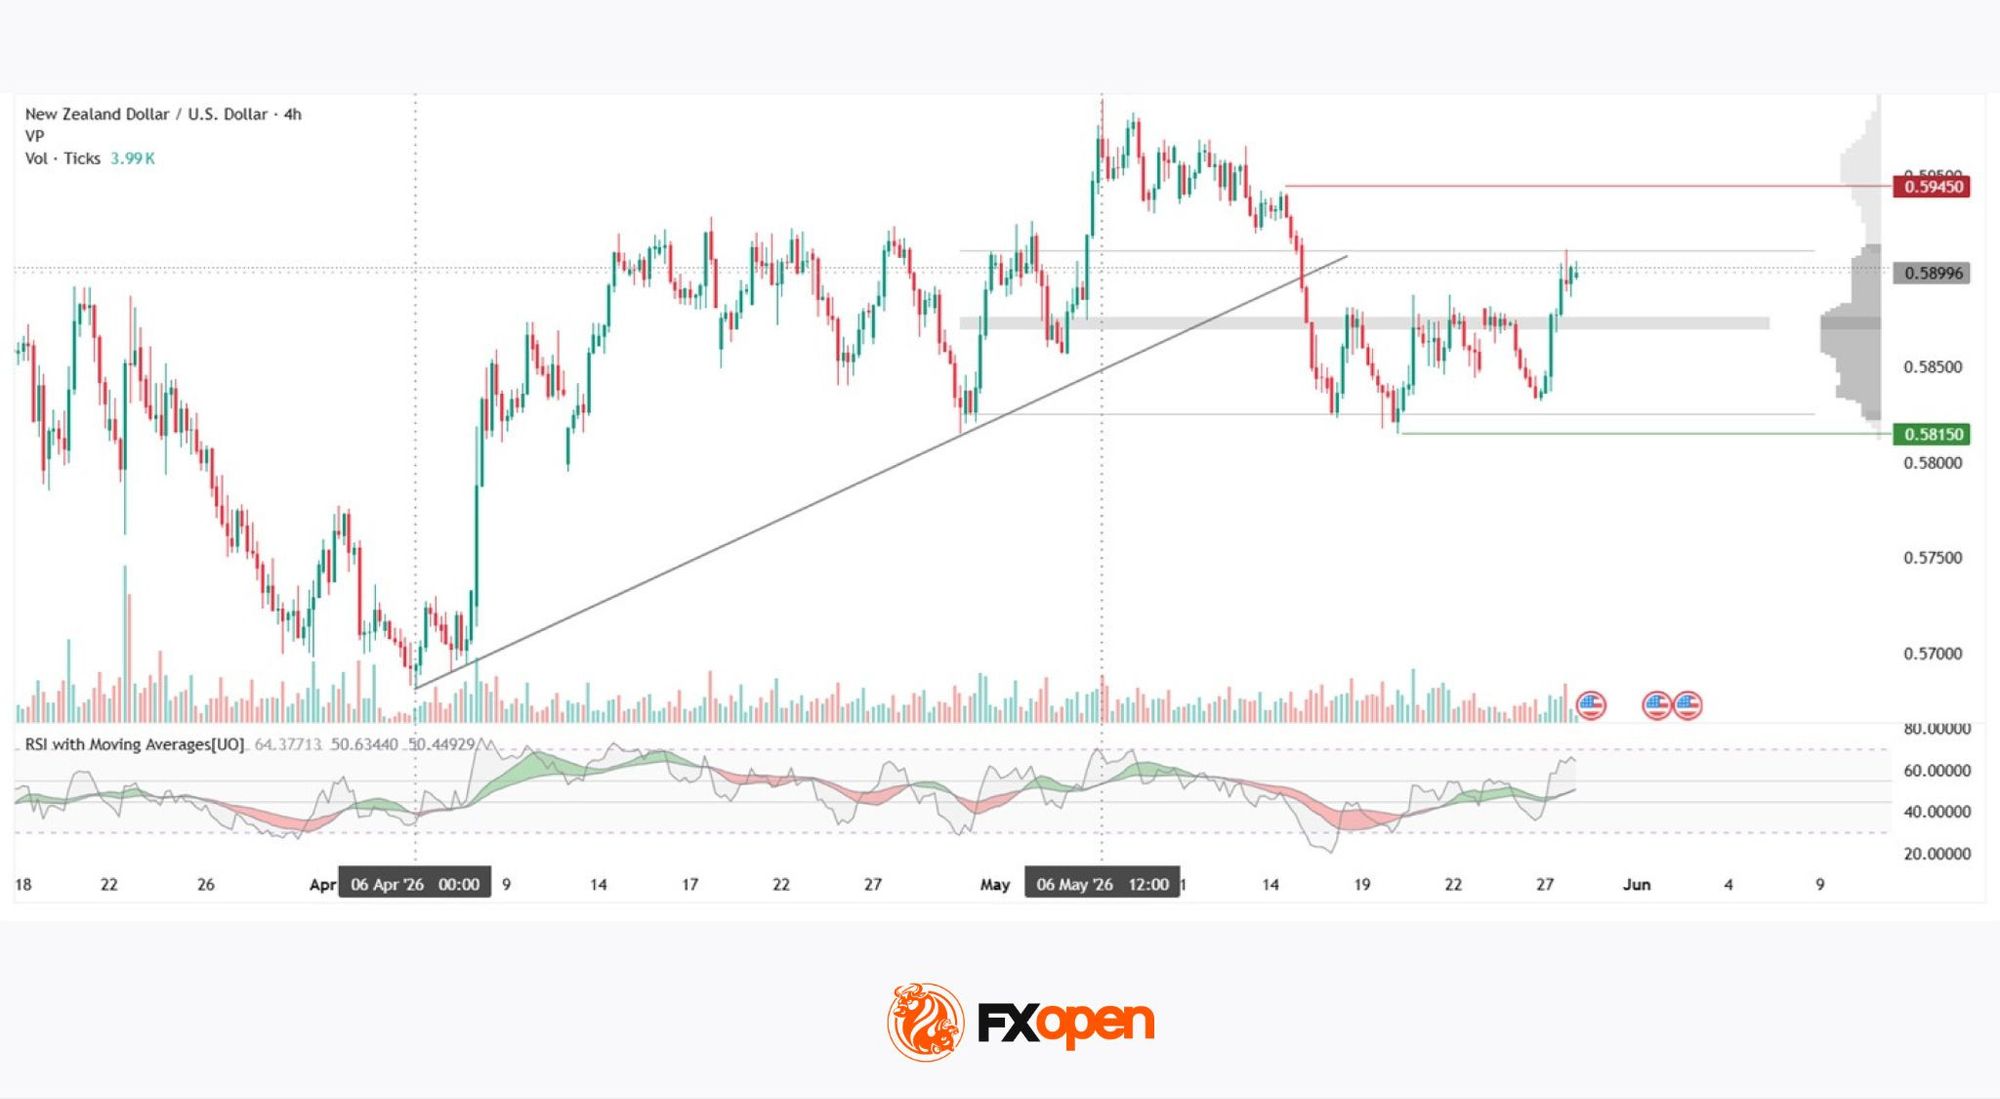
On the four-hour chart, NZD/USD displays a two-phase structure. In April, the pair established an upward trend: from the lows near 0.5680 at the beginning of the month, price gradually moved higher. The move culminated in early May with a peak around 0.5990, after which the trendline was broken to the downside and the pair entered a corrective phase, refreshing local lows near the 0.5815 area.
This was followed by a consolidation phase, during which the volume profile formed a point of control around 0.5870–0.5875, while the profile boundaries were established near 0.5910 and 0.5825.
At the time of writing, price is testing the upper boundary of the profile from below, and a breakout could draw market attention towards the 0.5945 area — the nearest resistance level. Should quotations return below the point of control, focus may shift towards the lower boundary of the profile at 0.5825, with a potential support zone located beneath it around 0.5815.
RSI + MAs currently show readings of 64 / 50 / 50. The oscillator remains noticeably above both moving averages and has not yet entered overbought territory, indicating the presence of a local bullish impulse. At the same time, the RSI moving averages themselves remain close to the neutral 50 mark, meaning that the character of the move will largely depend on how price reacts to the upper boundary of the profile.
Key takeaways
The split RBNZ vote and the updated rate outlook have created a situation in which the market may continue to reassess expectations as new New Zealand inflation data emerge. The technical picture reflects the same duality: the RSI curve points higher, yet the neutral positioning of its moving averages does not provide sufficient confirmation of a sustained upward trend.
Trade over 50 forex markets 24 hours a day with FXOpen. Take advantage of low commissions, deep liquidity, and spreads from 0.0 pips (additional fees may apply). Open your FXOpen account now or learn more about trading forex with FXOpen.
This article represents the opinion of the Companies operating under the FXOpen brand only. It is not to be construed as an offer, solicitation, or recommendation with respect to products and services provided by the Companies operating under the FXOpen brand, nor is it to be considered financial advice.
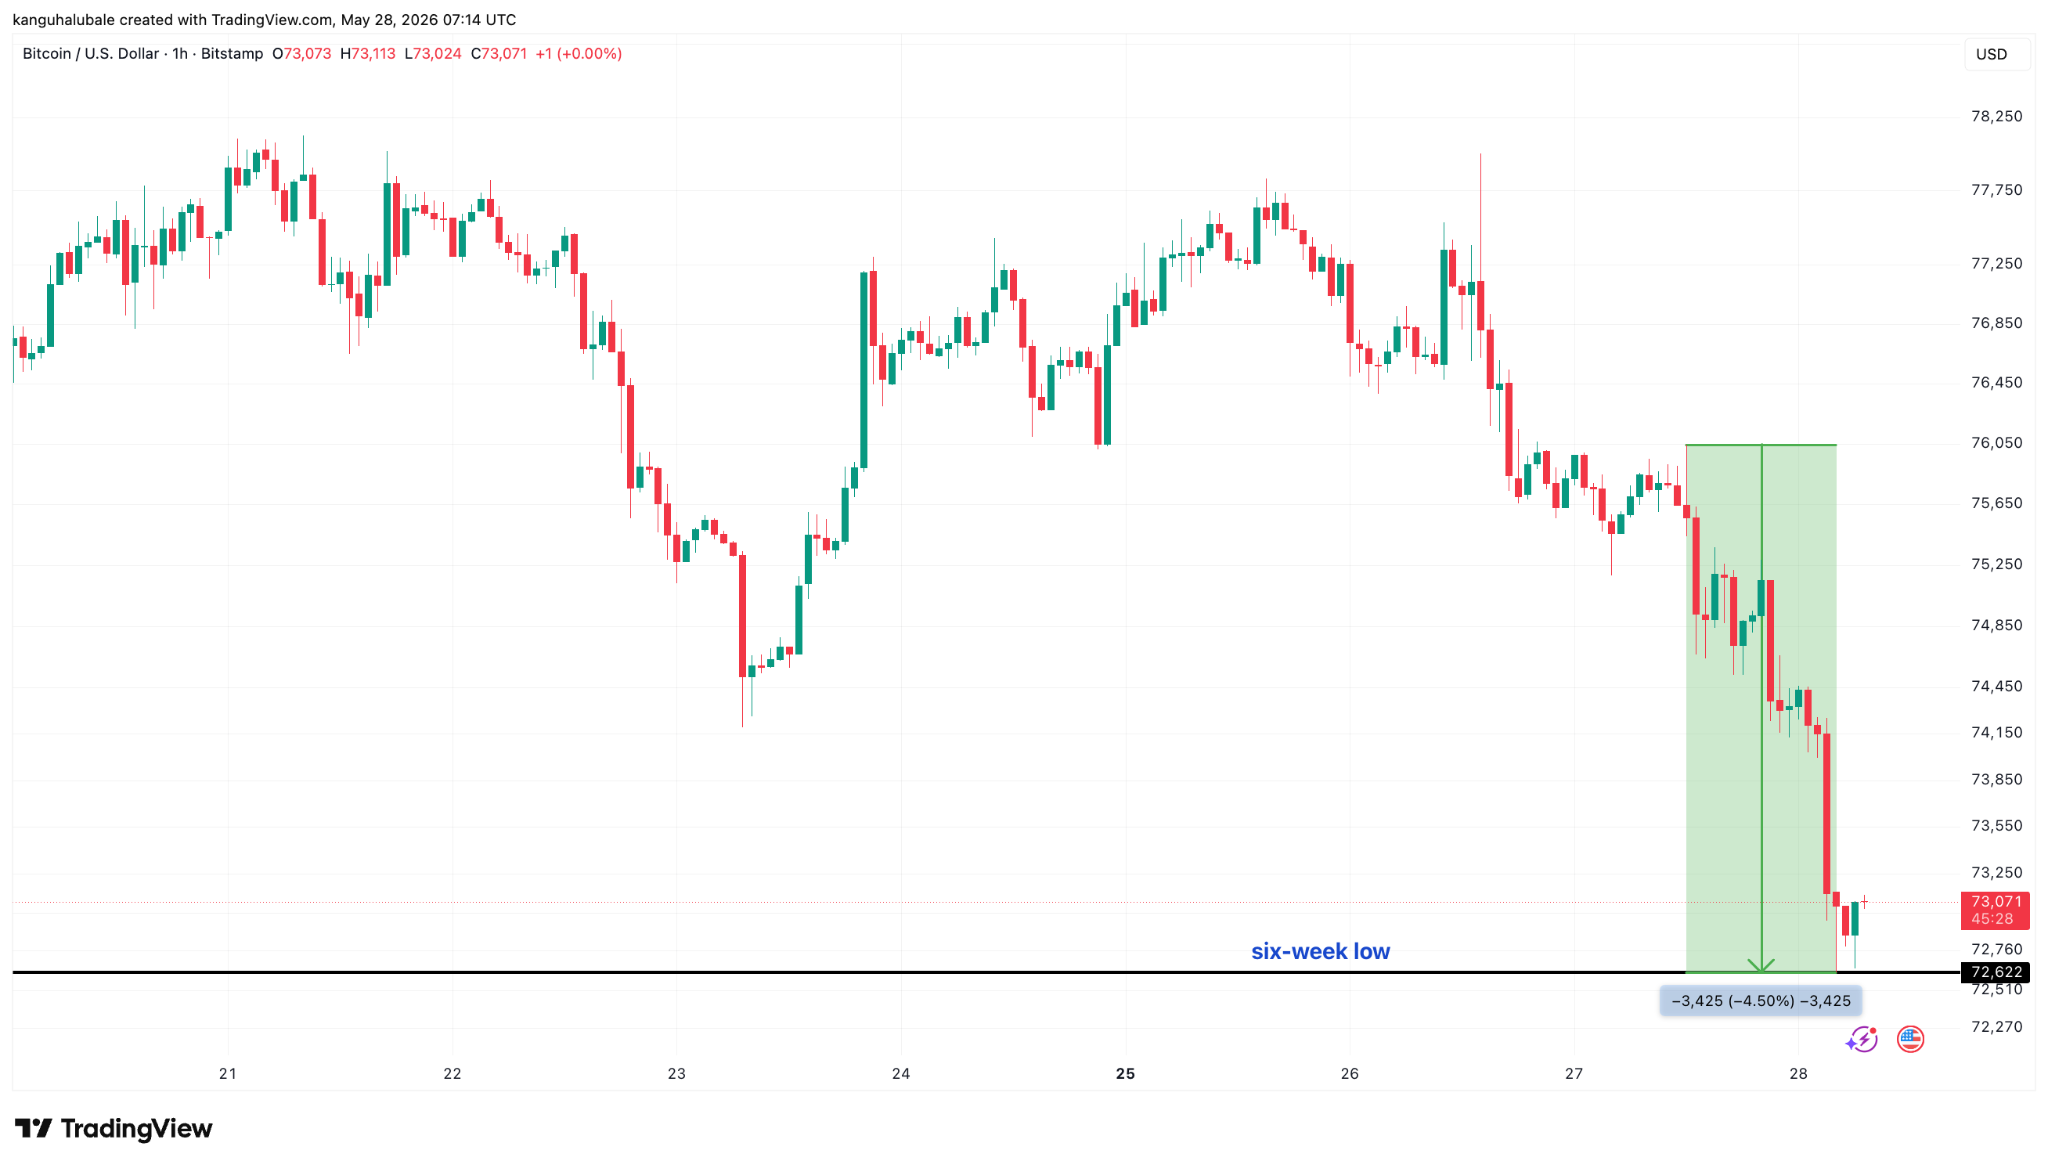
Bitcoin (BTC) sold off into the early Asian Trading session on Thursday as the drop to $72,600 produced significant liquidation of leveraged positions across the crypto market.
Key takeaways:
- Bitcoin price deviated 4.5% from its daily high of $76,050 on Wednesday, dropping to a six-week low of $72,620.
- Overleveraged crypto traders were liquidated out of nearly $935 billion in the past 24 hours.
- Traders say Bitcoin needs to hold above $70,000 to avoid a deeper correction toward $65,000 or lower.
Bitcoin price hits a 6-week lows below $73,000
The BTC/USD pair fell as low as $72,620 on Thursday, reversing all gains made since April 13 after the US reportedly carried out a new wave of military strikes on Iran.
BTC/USD 1-hour chart. Source: Cointelegraph/TradingView
This was accompanied by significant drops in other top-cap cryptocurrencies, wiping out more than $80 billion from the crypto market over the last 24 hours.
Related: Bitcoin falls further as BTC miners pivot to AI, pro-crypto legislation stalls
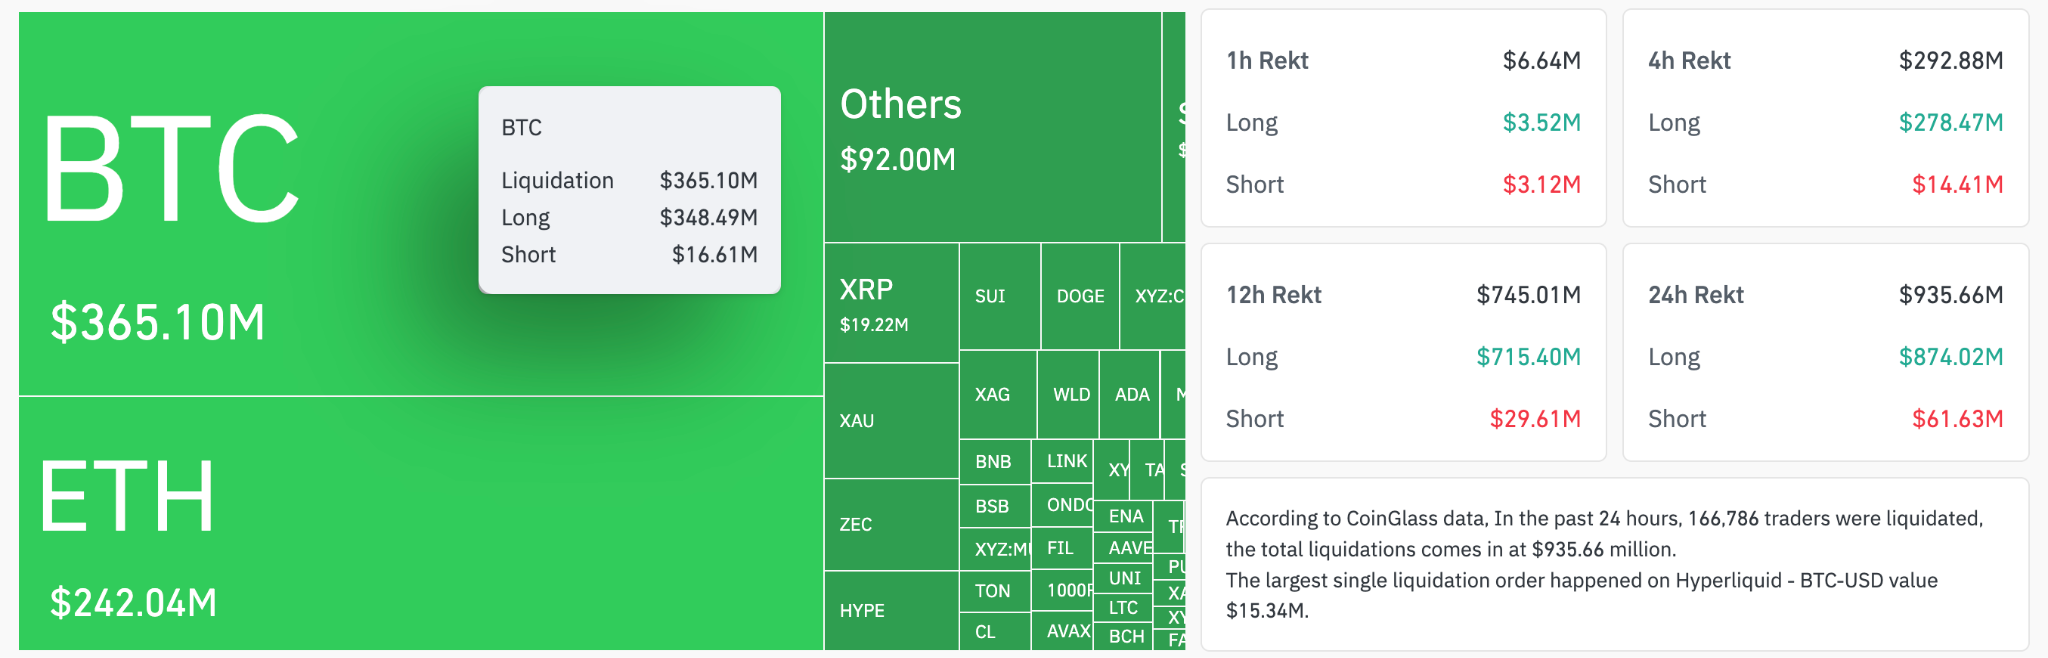
The derivatives market suffered a similar fate. More than $874 million in long positions were liquidated, with Bitcoin accounting for $348.5 million of that total. Ether (ETH) followed with $228.5 million in long liquidations.
Across the board, a total of $935.6 million was wiped out of the market in short and long positions, as shown in the figure below.
Crypto liquidations (screenshot). Source: CoinGlass
The single biggest liquidation occurred on Hyperliquid, where a $15.34 million BTC-USD long position was closed.
Additional data from CoinGlass showed a slight drop in Bitcoin’s futures open interest (OI) over the last 24 hours across all exchanges. The decline was more pronounced on the Chicago Mercantile Exchange and BingX, whose Bitcoin OI has fallen by 9.8% and 9% over the last 24 hours, respectively.
Even though futures longs (buyers) and shorts (sellers) are always matched, declining OI suggests reduced leverage and market participation, often signaling bearish sentiment. For example, a 30% decrease in OI between Jan. 14 and Feb. 6 was accompanied by a 38% drop in BTC price.
Meanwhile, US-based spot exchange-traded funds (ETFs) continue to post heavy outflows, indicating waning institutional interest. These ETFs have recorded outflows for eight consecutive days, totaling $2.6 billion. The $733 million in net outflows recorded on Wednesday marked the largest withdrawal since Jan. 29.
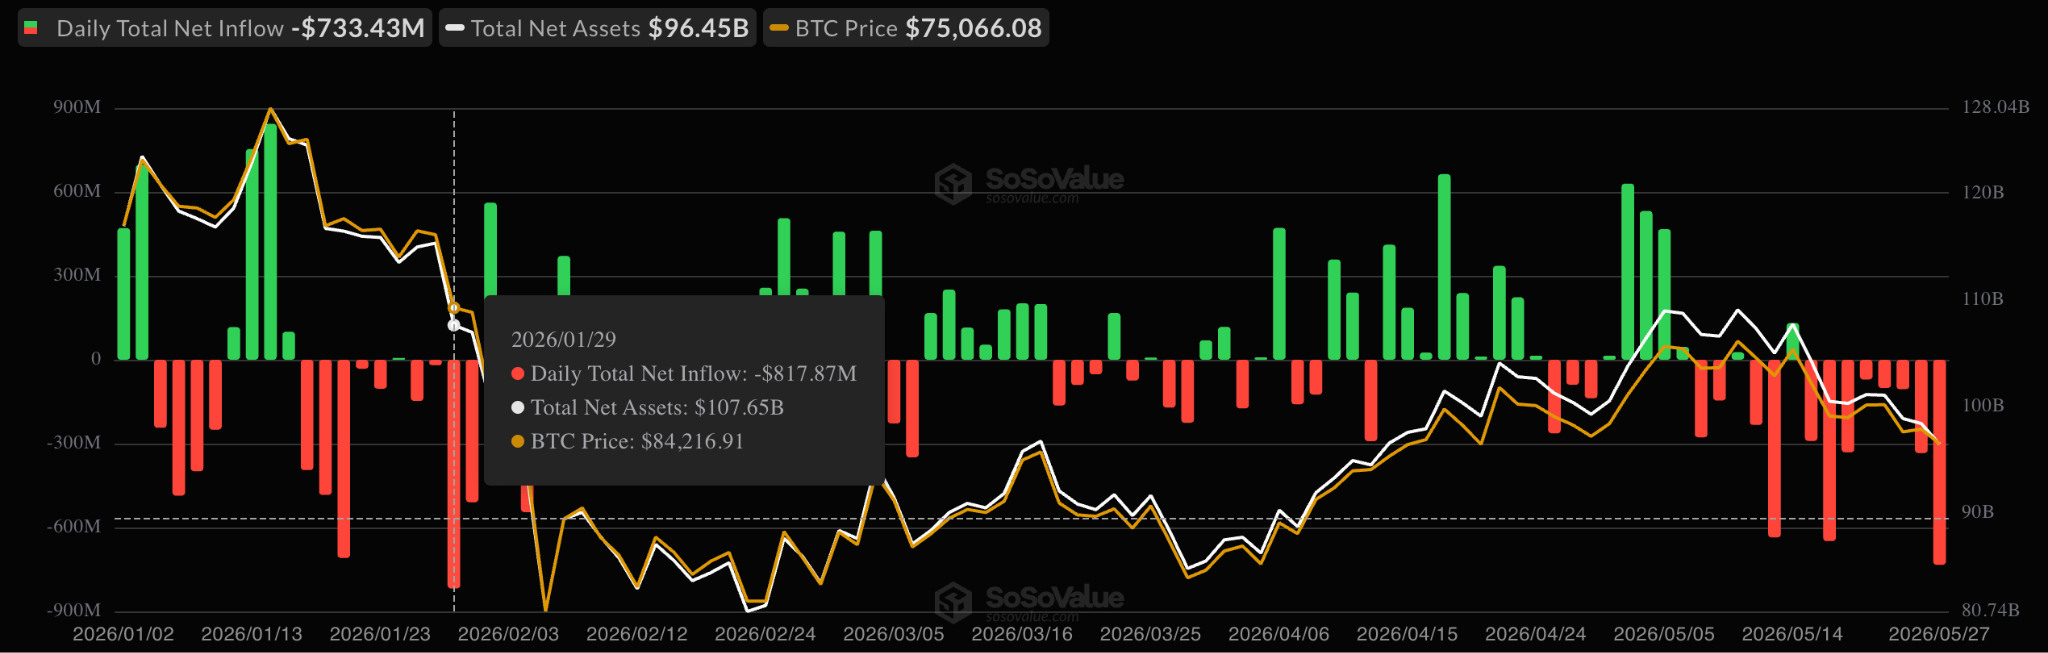
Spot Bitcoin ETF flows chart. Source: SoSoValue
As Cointelegraph reported, global Bitcoin investment products also posted outflows totaling $1.3 billion last week, adding to BTC’s headwinds.
$70,000 is now Bitcoin’s last line of defence
Bitcoin’s 4% drop over the last 24 hours has seen it lose the crucial $75,000 support, as the bears gained momentum.
Traders are now watching key support areas on the downside, including the 100-day simple moving average (SMA) at $73,000 and the demand zone above $70,000.
“Renewed US-Iran fighting overnight sent us lower with mass liquidations,” analyst Nicrypto said in a Thursday X post, adding:
“We have fallen well below the previous $75K support zone & are now at the critical $73K support.”
MN Capital founder Michael van de Poppe referred to Bitcoin’s latest sell-off as a “standard approach” typical of the final days of the month, “where markets correct as rebalancing takes place among asset managers.”
The analyst said, “Bitcoin showing weakness isn’t a recipe for a new low,” unless it drops under the $71,400-$73,400 support area as shown in the chart below.
“This is my last stance of an important support zone; otherwise, I’d expect lower $60Ks to be tested for support.”
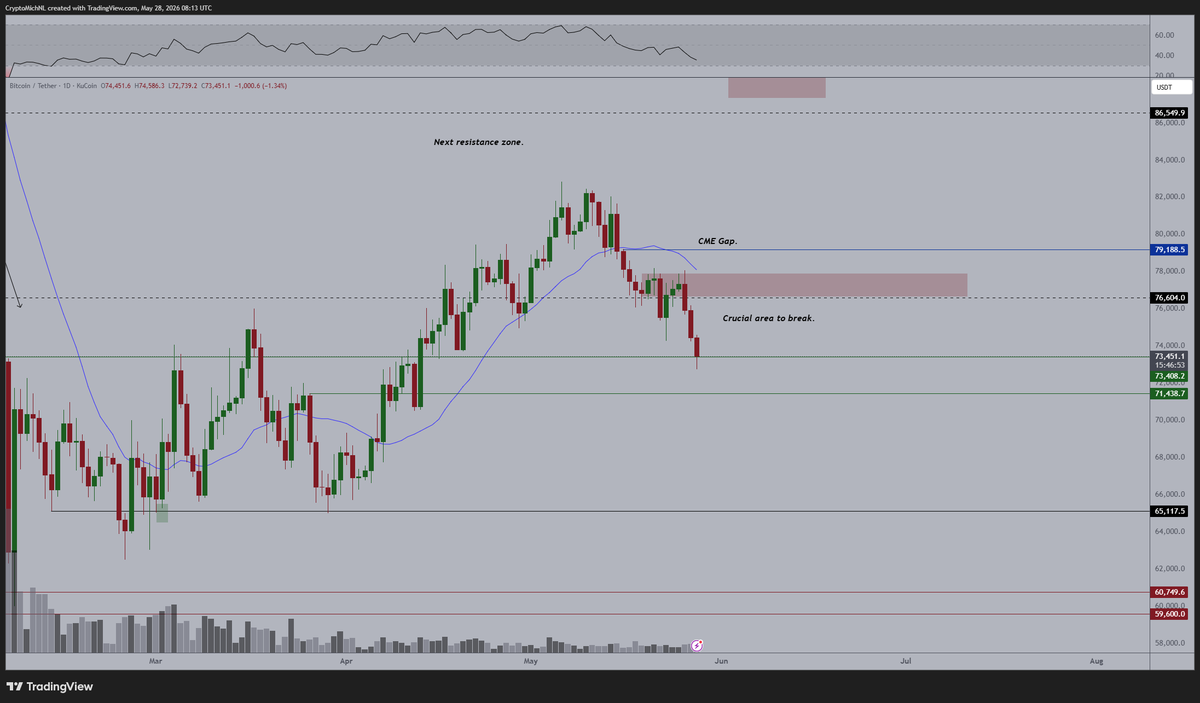
BTC/USD daily chart. Source: Michael van de Poppe
A daily candlestick drop below $70,000 could trigger another sell-off episode toward the target of an inverted V-shaped pattern at $65,000, as shown on the daily chart below. This would represent an 11.4% drop from the current price.
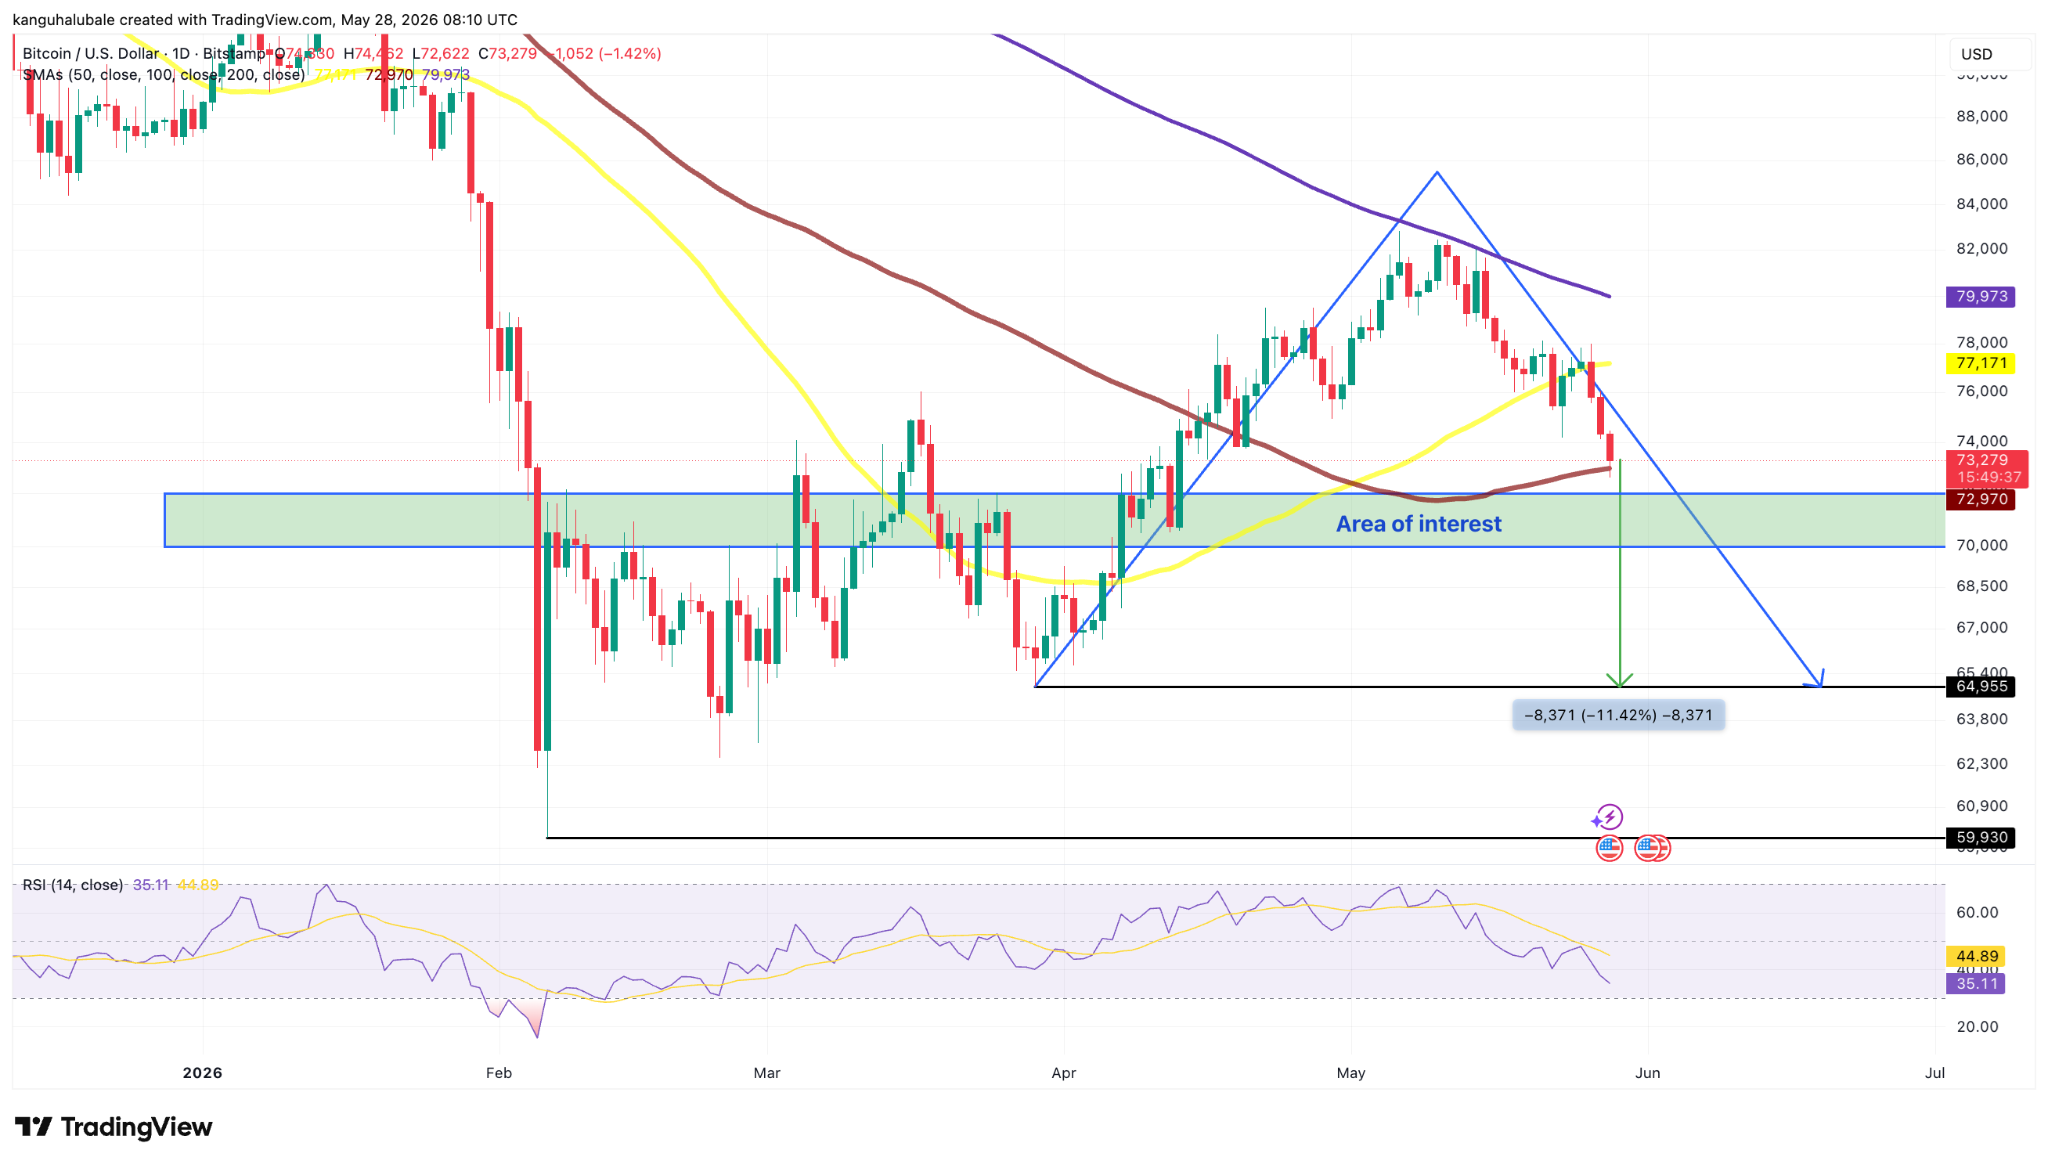
BTC/USD 1-day chart. Source: Cointelegraph/TradingView
As Cointelegraph reported, after losing support at $74,000-$76,000, BTC may then descend to the support line near $70,500, which is likely to attract buyers.
Crypto World
Bit Digital (BTBT) Stock Dips as $100M WhiteFiber Financing Challenges Ethereum Strategy

Key Highlights
-
BTBT shares decline following announcement of WhiteFiber credit facility.
-
Bit Digital provides $100M delayed draw loan to WhiteFiber subsidiary.
-
Ethereum-backed financing strategy deployed to fund AI infrastructure expansion.
-
Strategic asset approach faces market scrutiny with WhiteFiber lending deal.
-
Pre-market trading shows investor concern over ETH treasury deployment beyond staking.
Shares of Bit Digital experienced downward pressure in early trading hours following disclosure of a substantial WhiteFiber financing arrangement. While BTBT finished the previous session at $2.03 with a gain of 2.01%, the stock retreated to $1.9631 during pre-market activity, representing a decline of 3.30%. The pullback occurred as investors digested news of a $100 million credit facility connected to the company’s Ethereum holdings strategy.
WhiteFiber Secures Major Credit Facility from Bit Digital
According to the announcement, Bit Digital structured and funded a $100 million delayed draw term loan arrangement. The recipient is an entity within WhiteFiber, a company focused on artificial intelligence infrastructure and high-performance computing solutions. WhiteFiber operates as a publicly traded company on Nasdaq with the ticker WYFI, where Bit Digital maintains majority ownership.
Under the agreement terms, WhiteFiber can access up to $100 million through the delayed draw structure. Additionally, both parties retained the option to increase the total facility size to $150 million subject to mutual consent. This financing framework provides WhiteFiber with significant capital resources to accelerate its expansion initiatives within AI and HPC sectors.
A portion of the term loan was acquired by B. Riley Securities from Bit Digital Capital. Consequently, the arrangement features third-party involvement while maintaining Bit Digital’s primary role in the financing structure. Management indicated the transaction aligns with strategic holdings throughout its broader operational ecosystem.
Ethereum Holdings Deployed in Novel Lending Strategy
According to Bit Digital, funding for the loan advances will partially derive from an Ethereum-denominated secured credit arrangement. Through this mechanism, the company seeks to maintain its ETH holdings while generating returns from the lending operation. This methodology connects treasury asset management with credit-based revenue generation rather than relying exclusively on staking rewards.
Management positioned the transaction within its Strategic Asset Company framework. The company suggested the lending arrangement’s economics could potentially surpass conventional ETH staking returns. Furthermore, the structure enables WhiteFiber’s operational expansion while maintaining Bit Digital’s cryptocurrency exposure.
This initiative represents an untested application of Bit Digital’s balance sheet philosophy. The organization now leverages Ethereum-backed financing to generate income from a related infrastructure business. Yet the immediate market response demonstrated selling pressure on BTBT shares during pre-market hours.
Board Oversight Process Evaluates WhiteFiber Arrangement
Bit Digital disclosed that its board of directors authorized the transaction following comprehensive governance procedures. A committee composed of independent, disinterested directors conducted a separate evaluation of the deal’s financial merits, structural components, risk factors, and shareholder value considerations. The assessment particularly examined the intercompany relationship dynamics.
Needham and Company provided Bit Digital’s board with a formal fairness assessment in writing. Separately, Seaport Global Securities delivered an independent written fairness evaluation to WhiteFiber’s board. Both advisory opinions contributed to the deliberation process before final board approvals were granted.
The transaction positions Bit Digital at the intersection of three converging investment narratives. It merges Ethereum treasury deployment, artificial intelligence infrastructure participation, and strategic lending operations within a single framework. The pre-market weakness in BTBT shares suggests investors quickly incorporated concerns about the financing structure into their valuations.

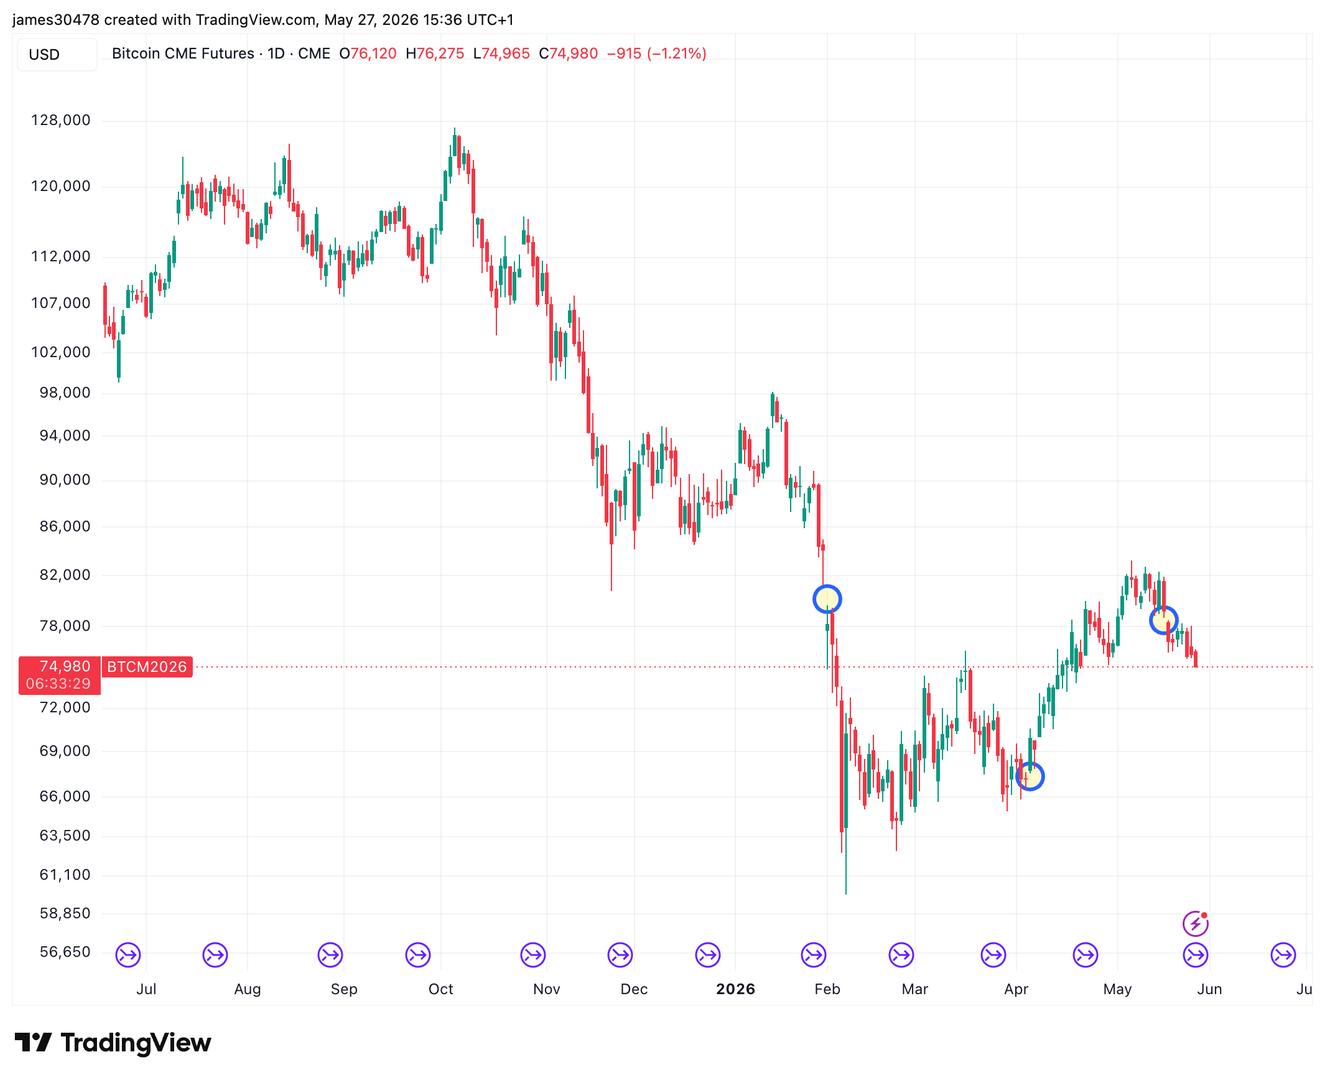
CME Group has officially entered the always-on crypto market. Beginning Friday, CME Bitcoin futures and options now trade 24 hours a day, seven days a week on Globex, CME’s electronic trading platform, with only a 60-minute weekly maintenance pause between 10PM and 11PM UTC each Sunday.
While weekend trades will still clear on the next business day, the broader implication is significant as the long-standing CME weekend gap has effectively disappeared.
For years, the Friday close through Sunday reopen created one of bitcoin’s most recognizable structural inefficiencies. Traders routinely positioned around “gap fills,” exploiting the disconnect between CME’s limited trading hours and Bitcoin’s continuous spot market. Thin weekend liquidity often exaggerated those moves, turning the CME gap into both a technical indicator and a speculative strategy.
Volatility would often spike sharply at the 11PM UTC Sunday reopen as futures markets recalibrated to wherever spot had drifted over the weekend. That weekend price action was characteristically low-volume and largely noise, thin order books amplifying moves that would frequently snap back once institutional participants logged on late Sunday.
With CME’s maintenance window now scheduled for that same 10PM–11PM UTC Sunday slot, it’s worth noting that window may retain some of its old character. Liquidity will thin as Globex goes offline, and the reopen at 11PM could still see brief volatility bursts as the market finds its footing. It’s a dynamic worth monitoring closely in the weeks ahead.
That era is now largely over. By aligning futures trading with bitcoin’s native 24/7 market structure, CME is reducing weekend risk premia and improving hedging efficiency for institutional participants. Asset managers, hedge funds, and corporate treasury desks can now manage exposure continuously rather than waiting for markets to reopen.
Still, CME remains behind where liquidity truly sits. Founder & CEO, Cole Kennelly at Volmex Labs, told CoinDesk, BlackRock’s IBIT ETF options currently holds roughly $27 billion to $30 billion in open interest, dwarfing CME Bitcoin futures options, which sit closer to $800 million to $900 million. That imbalance helps explain why the BVIV-US Index (BVUS), derived from IBIT’s deeper options market, has emerged as the preferred institutional benchmark for Bitcoin volatility.
Offshore perpetual futures and ETF options will likely retain their dominance for now. But CME’s shift to 24/7 trading removes a critical friction point.
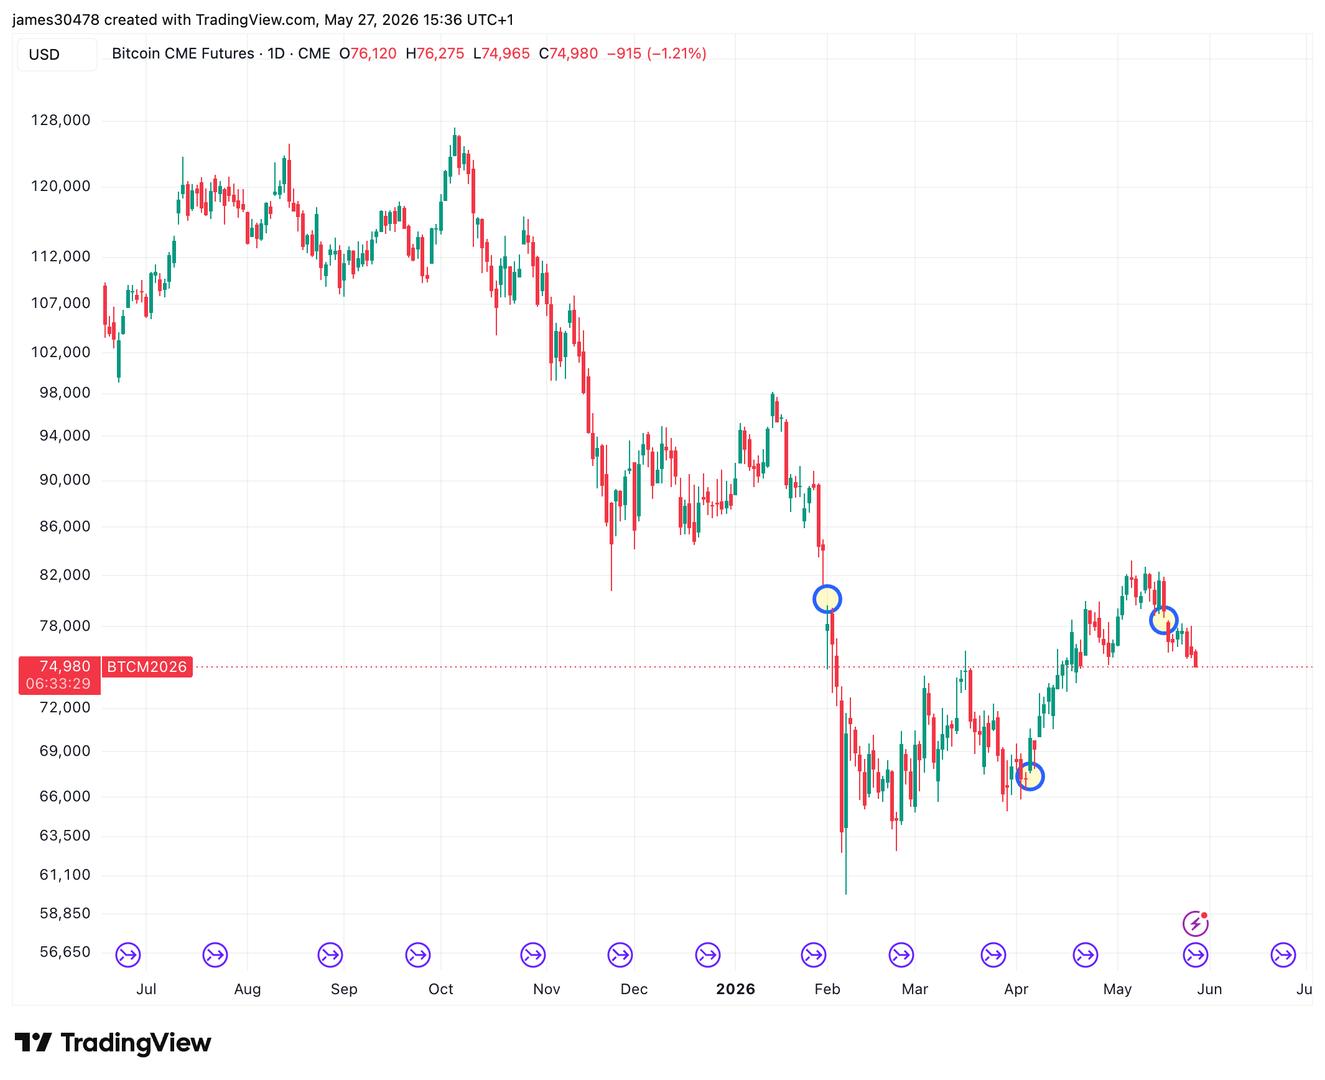
As it stands, there are currently three open CME gaps, all created this year. Two sit above Bitcoin’s current spot price of roughly $73,000, one formed in late January near $80,000 and another around $78,500. The third remains open below the market, just under $70,000.
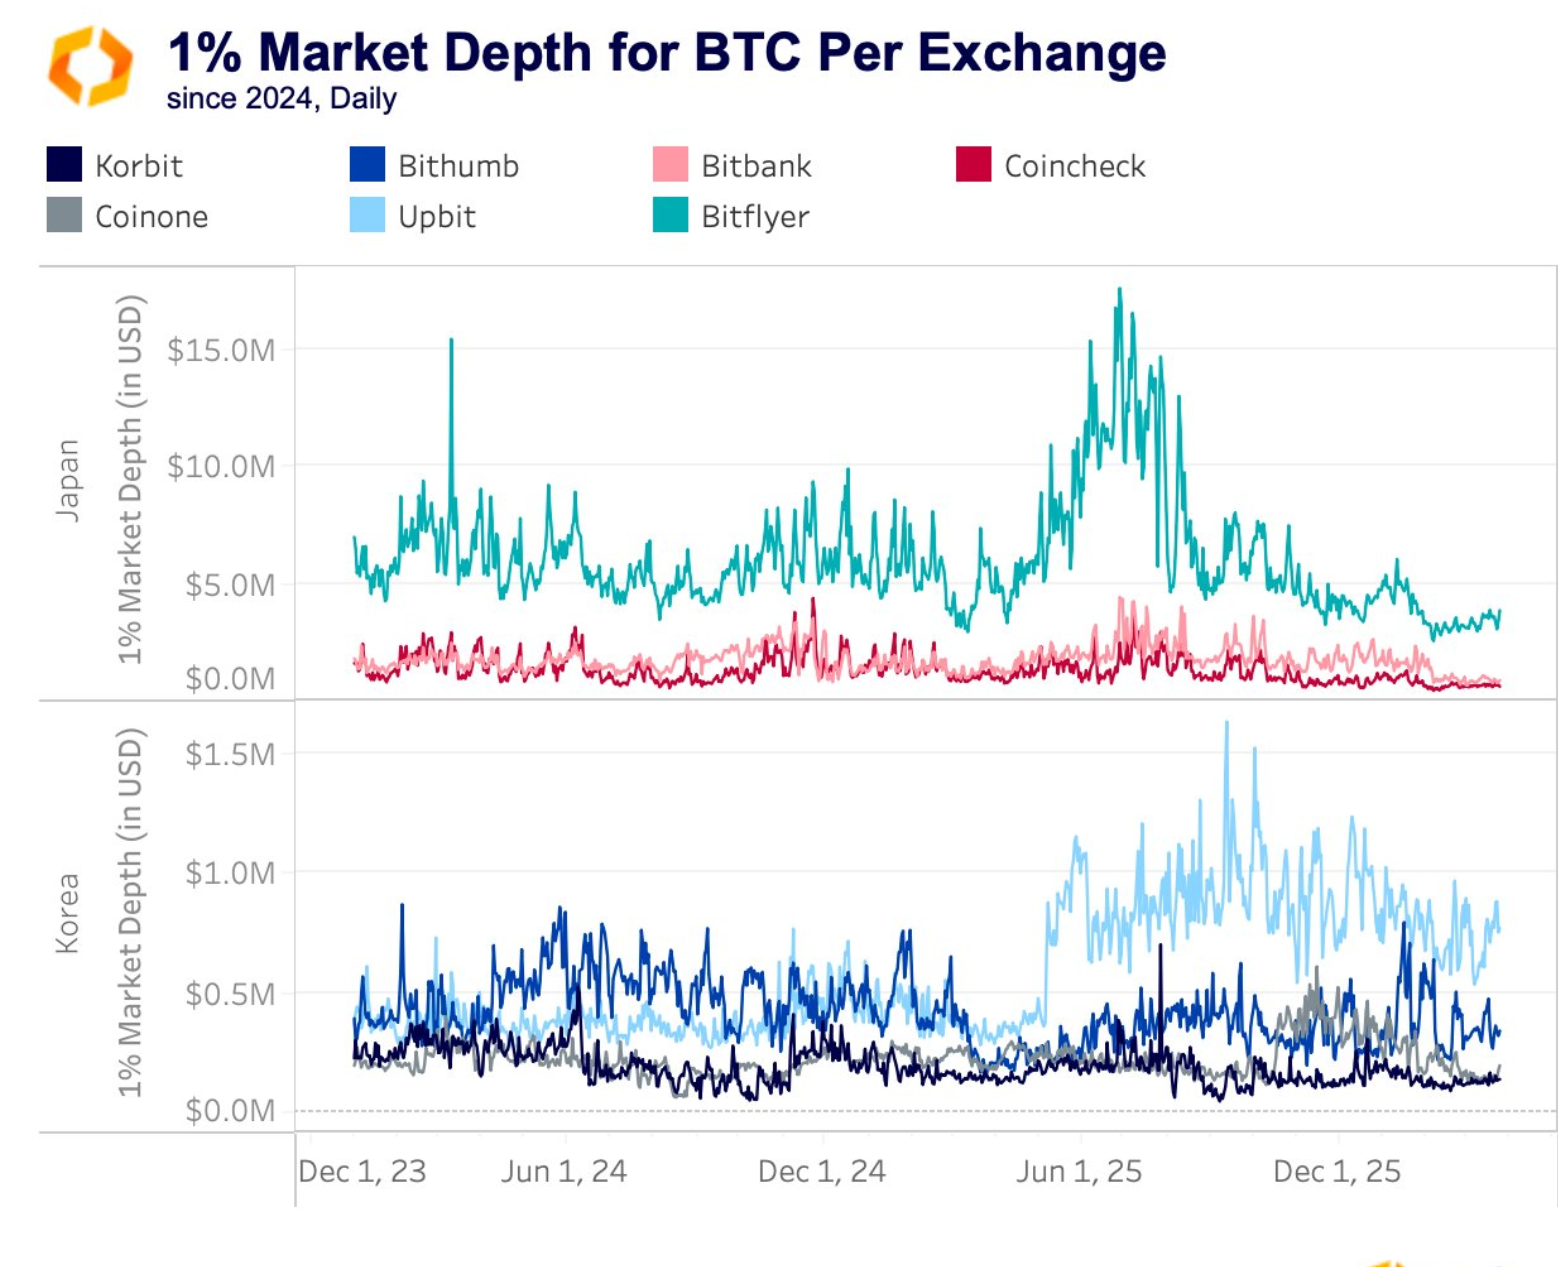
Three Samsung affiliates agreed to acquire a combined four percent stake in Dunamu, the operator of Upbit, Korea’s largest crypto exchange, for $408 million, capping a May rush by Korean financial giants.
We break down the deal, the wider buying spree, and what it means for Korea’s fast-shifting digital asset market.
What does the Samsung and Dunamu deal involve?
Samsung Securities, Samsung SDS, and Samsung Card said on May 28 that they will jointly buy 1.39 million Dunamu shares from Kakao Investment. The total consideration reaches 612.8 billion won, roughly $408 million.
According to reports, the split is clear across the three units. Samsung Securities takes a 2% stake, while Samsung SDS and Samsung Card each acquire 1%.
Dunamu matters far beyond Korea. Founded in 2012 and led by chairman Song Chi-hyung, it runs an exchange that handled around two-thirds of South Korean spot crypto trading volume last year.
That scale ranks Upbit among the world’s busiest venues by turnover. Any change in Dunamu’s ownership structure, therefore, affects global market makers, custodians, and token issuers active across the region.
Dunamu said it will work with the Samsung affiliates on blockchain-based financial investment products, payment infrastructure, and expansion into AI using blockchain technology, according to a company statement.
Follow us on X to get the latest news as it happens
Why Korean Financial Giants Are Racing Into Dunamu?
South Korea’s crypto market has historically run on individual investors. Banks, brokerages, and conglomerates largely held back due to regulatory caution and the absence of a clear digital asset framework.
That posture is now shifting fast. On May 15, Hana Financial Group’s banking unit agreed to buy 2.28 million Dunamu shares for 1.003 trillion won, roughly $669 million, securing a 6.55% holding.
The move made Hana the first Korean financial holding company to take direct equity in a crypto exchange. Five days later, Hanwha Investment Securities lifted its stake to 9.84%, spending 597.8 billion won, about $399 million.
Combined, the three deals shift close to 14% of Dunamu to established Korean groups in under two weeks. The disclosed consideration sits above 2.2 trillion won across the entire wave of activity.

Each buyer cited positioning for won-pegged stablecoins, tokenized securities, and on-chain settlement ahead of the Digital Asset Basic Act. Hana plans KRW-pegged stablecoins and blockchain remittance using Dunamu’s GIWA Chain, an Ethereum layer-2 network.
Meanwhile, Kakao Investment is exiting as Dunamu prepares an all-stock merger with Naver Financial valued at 15 trillion won. The reshuffle cuts Kakao’s stake from 10.58% at the end of last year to about 0.13%.
That removes a shareholder once seen as a potential obstacle to the merger. Both companies postponed their shareholder votes to August 18 and the closing date to September 30, citing a longer Fair Trade Commission review.
The post Samsung Units Acquire a $408 Million Stake in Upbit Operator Dunamu appeared first on BeInCrypto.

Italy’s Banca Sella has completed the notification process required under the European Union’s Markets in Crypto-Assets regulation (MiCA) with the Bank of Italy, unlocking authorization to offer crypto-asset services. The institution asserts that it becomes the first Italian bank to be authorized to provide crypto-asset services under MiCA, with plans to roll out a custody, transfer, and receipt solution for digital assets in 2026 targeting selected customer segments.
The Sella Group characterized the milestone as a meaningful step for Italy’s banking sector, providing a regulated entry point into digital assets amid a broader EU shift from crypto pilots to licensed custody, tokenized payments, and stablecoin infrastructure. The group notes that Banca Sella, the commercial bank of the Sella Group, operates nearly 300 branches and employs more than 2,400 people.
Andrea Tessera, managing director of digital banking at Banca Sella, framed tokenization as a driver of a payments landscape that will be “instant, interoperable, and programmable,” and positioned the bank’s forthcoming crypto service as part of that ongoing transformation.
According to the bank, MiCA authorization represents a regulated entry point for Italy’s banking sector into digital assets moving beyond pilots and partnerships toward full custody and related services under a harmonized EU framework.
In what prefaces a broader integration of crypto into traditional banking, Banca Sella also highlighted its prior crypto-related engagements, including participation in a distributed ledger technology (DLT) pilot promoted by the Bank of Italy’s Fintech Milano Hub in 2022.
The bank also noted its role in the creation of internal DLT and digital assets capabilities, and it is among the founders of Qivalis, a consortium of 37 European banks that aims to issue a euro-denominated stablecoin.
The legacy of Banca Sella’s crypto activities goes back to its digital banking brand, Hype, which partnered with Italian crypto firm Conio to offer Bitcoin wallet services. Conio has described its first banking integration as operational in March 2020 through the Hype partnership, enabling retail customers to buy, sell, send, and receive digital assets. Today, Hype’s offerings include a Bitcoin wallet accessed via the Hype app for seamless on-ramp/off-ramp activity.
Reflecting on scale, Reuters reported in 2024 that Banca Sella serviced roughly 1.3 million customers, while Hype served about 1.7 million customers, underscoring the breadth of the group’s reach prior to MiCA-aligned expansion.
This development arrives as European financial institutions increasingly align with MiCA’s regulatory framework, transitioning from crypto experiments to licensed custody, payments, and infrastructure for tokenized assets and stablecoins. The MiCA regime is designed to create a consistent, pan-EU standard for crypto-asset service providers, with implications for licensing, supervision, AML/KYC practices, and cross-border activity among banks, exchanges, and other financial institutions.
With Italy’s largest commercial bank brands edging into regulated crypto services, observers will watch whether additional lenders follow Sella’s lead, how custodial and settlement capabilities evolve, and what this means for cross-border operations within the Eurozone. The move also places regulatory and enforcement considerations at the forefront—clarifying licensing requirements, customer protections, custody standards, and the governance of tokenized payments and stablecoin arrangements across European jurisdictions.
Key takeaways
- Banca Sella has obtained MiCA-related authorization from the Bank of Italy to offer crypto-asset services, becoming the first Italian bank to do so under the regulation.
- The bank plans to launch a crypto service in 2026 focused on custody, transfer, and receipt of digital assets for selected customer segments.
- The milestone marks a regulated entry point for Italy’s banking sector into digital assets within a harmonized EU framework, signaling a shift from pilots to licensed infrastructure for custody, tokenized payments, and stablecoins.
- Banca Sella’s crypto footprint includes prior exposure through Hype (its digital banking brand) and Conio, as well as participation in the Bank of Italy’s 2022 Fintech Milano Hub DLT pilot.
- The group is a founder of Qivalis, a European bank consortium pursuing a euro-denominated stablecoin, reflecting broader industry moves toward central-bank–backed or tokenized monetary infrastructure.
Regulatory and ecosystem context: MiCA, governance, and cross-border implications
MiCA provides a unified regulatory approach for crypto-asset service providers across the European Union, aimed at aligning supervision, licensing, and consumer protections. The Italian authorization for Banca Sella demonstrates how national regulators are translating MiCA into concrete operating licenses for traditional financial institutions willing to expand into digital assets. This evolution matters for banks, exchanges, and custodians seeking scalable, compliant access points to crypto markets, as well as for institutional investors evaluating regulated custody and settlement environments across Europe.
From a policy perspective, the development highlights the interplay between supervision and innovation: authorities are calibrating enforcement, risk management standards, AML/KYC controls, and governance practices as licensed entities handle tokenized assets and potential stablecoin infrastructure. For banks, regulatory clarity on custody standards and the scope of permissible crypto activities under MiCA will influence licensing strategies, internal risk frameworks, and the design of customer protections in digital assets programs.
Historical context and ecosystem implications
The Sella Group’s crypto trajectory has been characterized by a blend of internal capability-building and external collaboration. The Bank of Italy’s 2022 DLT pilot, conducted through the Fintech Milano Hub, provided early exposure to distributed ledger technology and its potential applicability to financial services. Banca Sella’s subsequent formation of an internal DLT and digital assets team signals an intent to operationalize crypto capabilities within a regulated banking framework.
As a founder of Qivalis, Sella aligns with a broader European push to explore euro-denominated stablecoins as a bridge between traditional financial rails and new digital settlement mechanisms. The Qivalis initiative, backed by a coalition of European banks, signals industry readiness to consider standardized, cross-border settlement formats that leverage digital currency tokens while adhering to prudential and consumer-protection standards.
Conio’s 2020 integration with Hype marked an earlier, practical foray into consumer crypto services within a banking-enabled ecosystem. Hype’s Bitcoin wallet functionality—available to retail customers—illustrates how bank-affiliated digital brands have historically served as early on-ramps, even as MiCA regulatory expectations matured. The ongoing transition from such pilots to licensed, institutionally governed services represents a notable shift in the European crypto infrastructure landscape.
Market observers also note the regulatory implications for banks’ relationships with crypto firms and fintechs. As institutions begin to offer compliant crypto custody and settlement, third-party service providers and partner ecosystems will need to align with enhanced AML/KYC standards and custody governance. This alignment is critical not only for consumer protection but also for ensuring the resilience of broader financial market infrastructure as digital-asset activity scales within regulated channels.
Closing perspective
Italy’s MiCA milestone for Banca Sella signals a tangible step toward a more integrated, regulated digital-asset ecosystem within Europe. The next developments to watch include how additional Italian banks pursue MiCA authorizations, how custody and settlement infrastructure evolves for licensed institutions, and how cross-border supervisory coordination shapes the deployment of tokenized payments and stablecoins within the Eurozone. While the regulatory path remains dynamic, the alignment between traditional banking and digital-asset services appears to be gaining regulatory legitimacy and operational clarity, underpinned by MiCA’s harmonized framework.
Bitcoin price has fallen toward the $73,000 region after a wave of ETF outflows, derivatives pressure, and long liquidations triggered fresh panic across the crypto market.
Summary
- Bitcoin price fell toward the $73,000 region as over $6.25 billion in BTC options headed toward expiry alongside nearly $733 million in spot ETF outflows.
- BlackRock’s IBIT recorded roughly $527.8 million in outflows, while CoinGlass data showed nearly $330 million in Bitcoin long liquidations within 24 hours.
- Analysts warned that failure to hold the $73,000-$71,000 support range could expose Bitcoin to a deeper correction toward the key $70,000 psychological level.
According to crypto.news price data, Bitcoin (BTC) price dropped more than 4% over the past 24 hours and briefly touched the $72,800 area on May 28 after bulls failed to reclaim the $80,000 psychological resistance zone earlier this week. Ethereum, Solana, XRP, BNB, and Hyperliquid also posted sharp losses as total crypto market capitalization slid below $2.5 trillion.
The latest sell-off came as institutional investors rapidly reduced exposure through spot Bitcoin ETFs. Data from SoSoValue showed U.S. spot Bitcoin ETFs recorded nearly $733 million in net outflows on Wednesday alone, the largest single-day withdrawal since February. BlackRock’s iShares Bitcoin Trust led the decline with roughly $527.8 million in outflows, its second-largest daily bleed on record.
Over the past three weeks, spot Bitcoin ETFs have collectively lost more than $3 billion. The sustained withdrawals have removed a major source of spot demand that helped drive Bitcoin’s recovery earlier this year. At the same time, Coinbase Premium has turned negative, showing weakening buying activity from U.S.-based institutional and retail participants.
Macro pressure has also intensified after oil prices surged amid renewed Middle East tensions. Traders have reduced exposure to risk assets after reports surrounding potential disruptions tied to the Strait of Hormuz and uncertainty around U.S.-Iran negotiations.
Rising energy prices have complicated expectations for Federal Reserve rate cuts, especially as investors remain cautious ahead of upcoming U.S. inflation data.
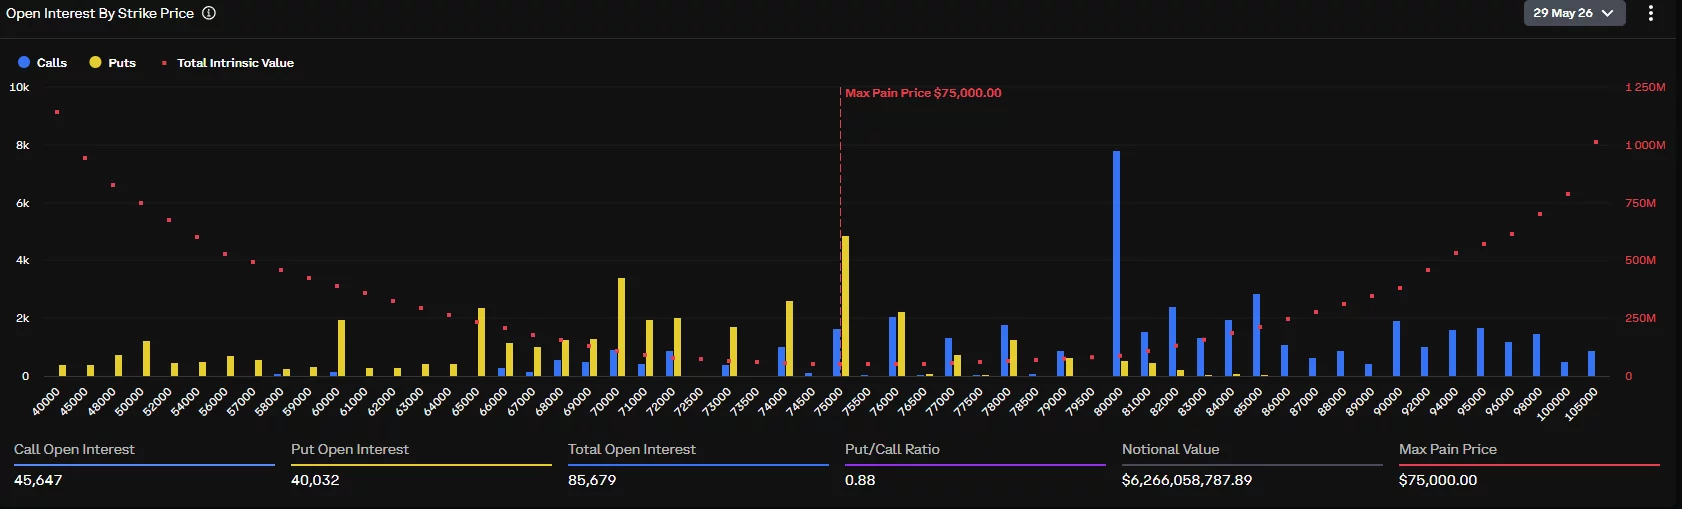
Meanwhile, derivatives traders are now focused on one of the largest Bitcoin options expiries of the year. Data from Deribit shows over $6.25 billion worth of Bitcoin options contracts, representing around 85,679 BTC contracts, are set to expire on Friday, May 29.
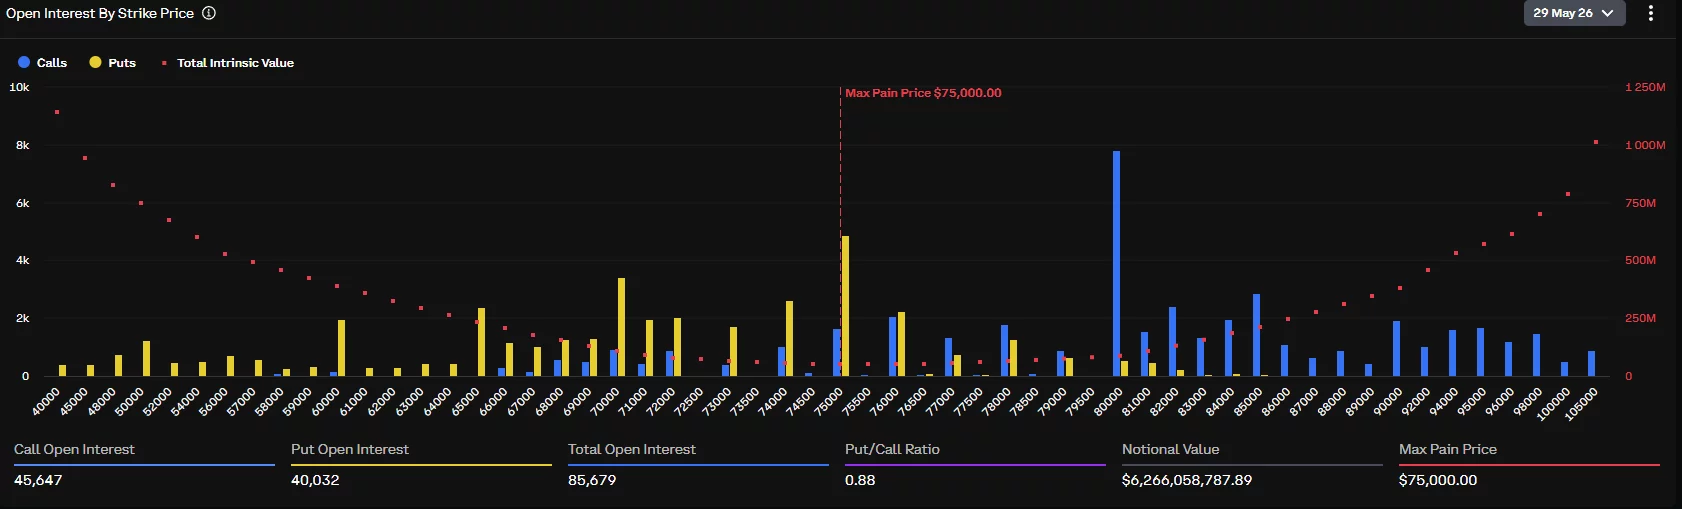
The largest concentration of call options sits near the $80,000 strike, while heavy put positioning has formed around the $75,000 region. Deribit’s max pain level currently stands at $75,000, the price where the highest number of contracts would expire worthless.
Options positioning has become increasingly problematic for bulls because Bitcoin is now trading well below the main concentration zones heading into settlement.
Analysts tracking derivatives flows noted that traders had spent much of the past month positioning for BTC to stabilize near higher expiry regions before the market abruptly reversed lower this week.
Analyst Ardi warned that Bitcoin’s move away from the major options positioning zones ahead of expiry could leave bullish traders trapped.
“When we see price moving away from the major areas of options positioning into expiry, it usually means one side of the market is about to get trapped badly….So right now, the bulls are the ones under pressure,” said Ardi
At the same time, liquidation activity has intensified across leveraged markets. CoinGlass data shows nearly $330 million in Bitcoin long positions were liquidated over the past 24 hours, contributing to more than $870 million in total bullish liquidations across the broader crypto market.
Bitcoin loses key support as liquidation clusters build near $71K
The technical structure has also weakened considerably following Bitcoin’s rejection from the $82,000 region earlier this month. On the daily chart, BTC has now broken below several short-term moving averages while continuing to print lower highs and lower lows.
The MACD histogram has extended deeper into negative territory, while the MACD line itself remains below the signal line after confirming a bearish crossover earlier this week. Meanwhile, the Relative Strength Index has fallen toward the 35 level, placing momentum near oversold territory but without showing a confirmed bullish divergence yet.
A separate chart shared by trader Altcoin Sherpa in a May 28 X post, showed Bitcoin losing support across the 4-hour exponential moving averages after failing to hold above the $76,000 region. The analyst warned that a sustained breakdown from current levels could drag BTC toward the $71,000 area.
“BTC close here and I think we go to 71k or something around there. 4h EMAs lost the bullish trend but I still think we’re fine in the overall context,” noted the analyst.
Meanwhile, analysts at Crypto World said Bitcoin has continued showing weakness after facing rejection near the $78,000 region earlier this week. The analysts noted that $73,700 remains the immediate support level to watch on the 4-hour chart.
According to them, a successful defense of that zone could trigger a short relief rally due to a bullish RSI divergence forming at current levels. However, failure to hold above support may expose Bitcoin to a deeper decline toward the next major support area near $71,000.
CoinGlass liquidation heatmaps also show large liquidity clusters sitting between $71,000 and $72,000. Those zones often attract price action during periods of elevated leverage because market makers and large traders tend to target heavily concentrated liquidation pockets.
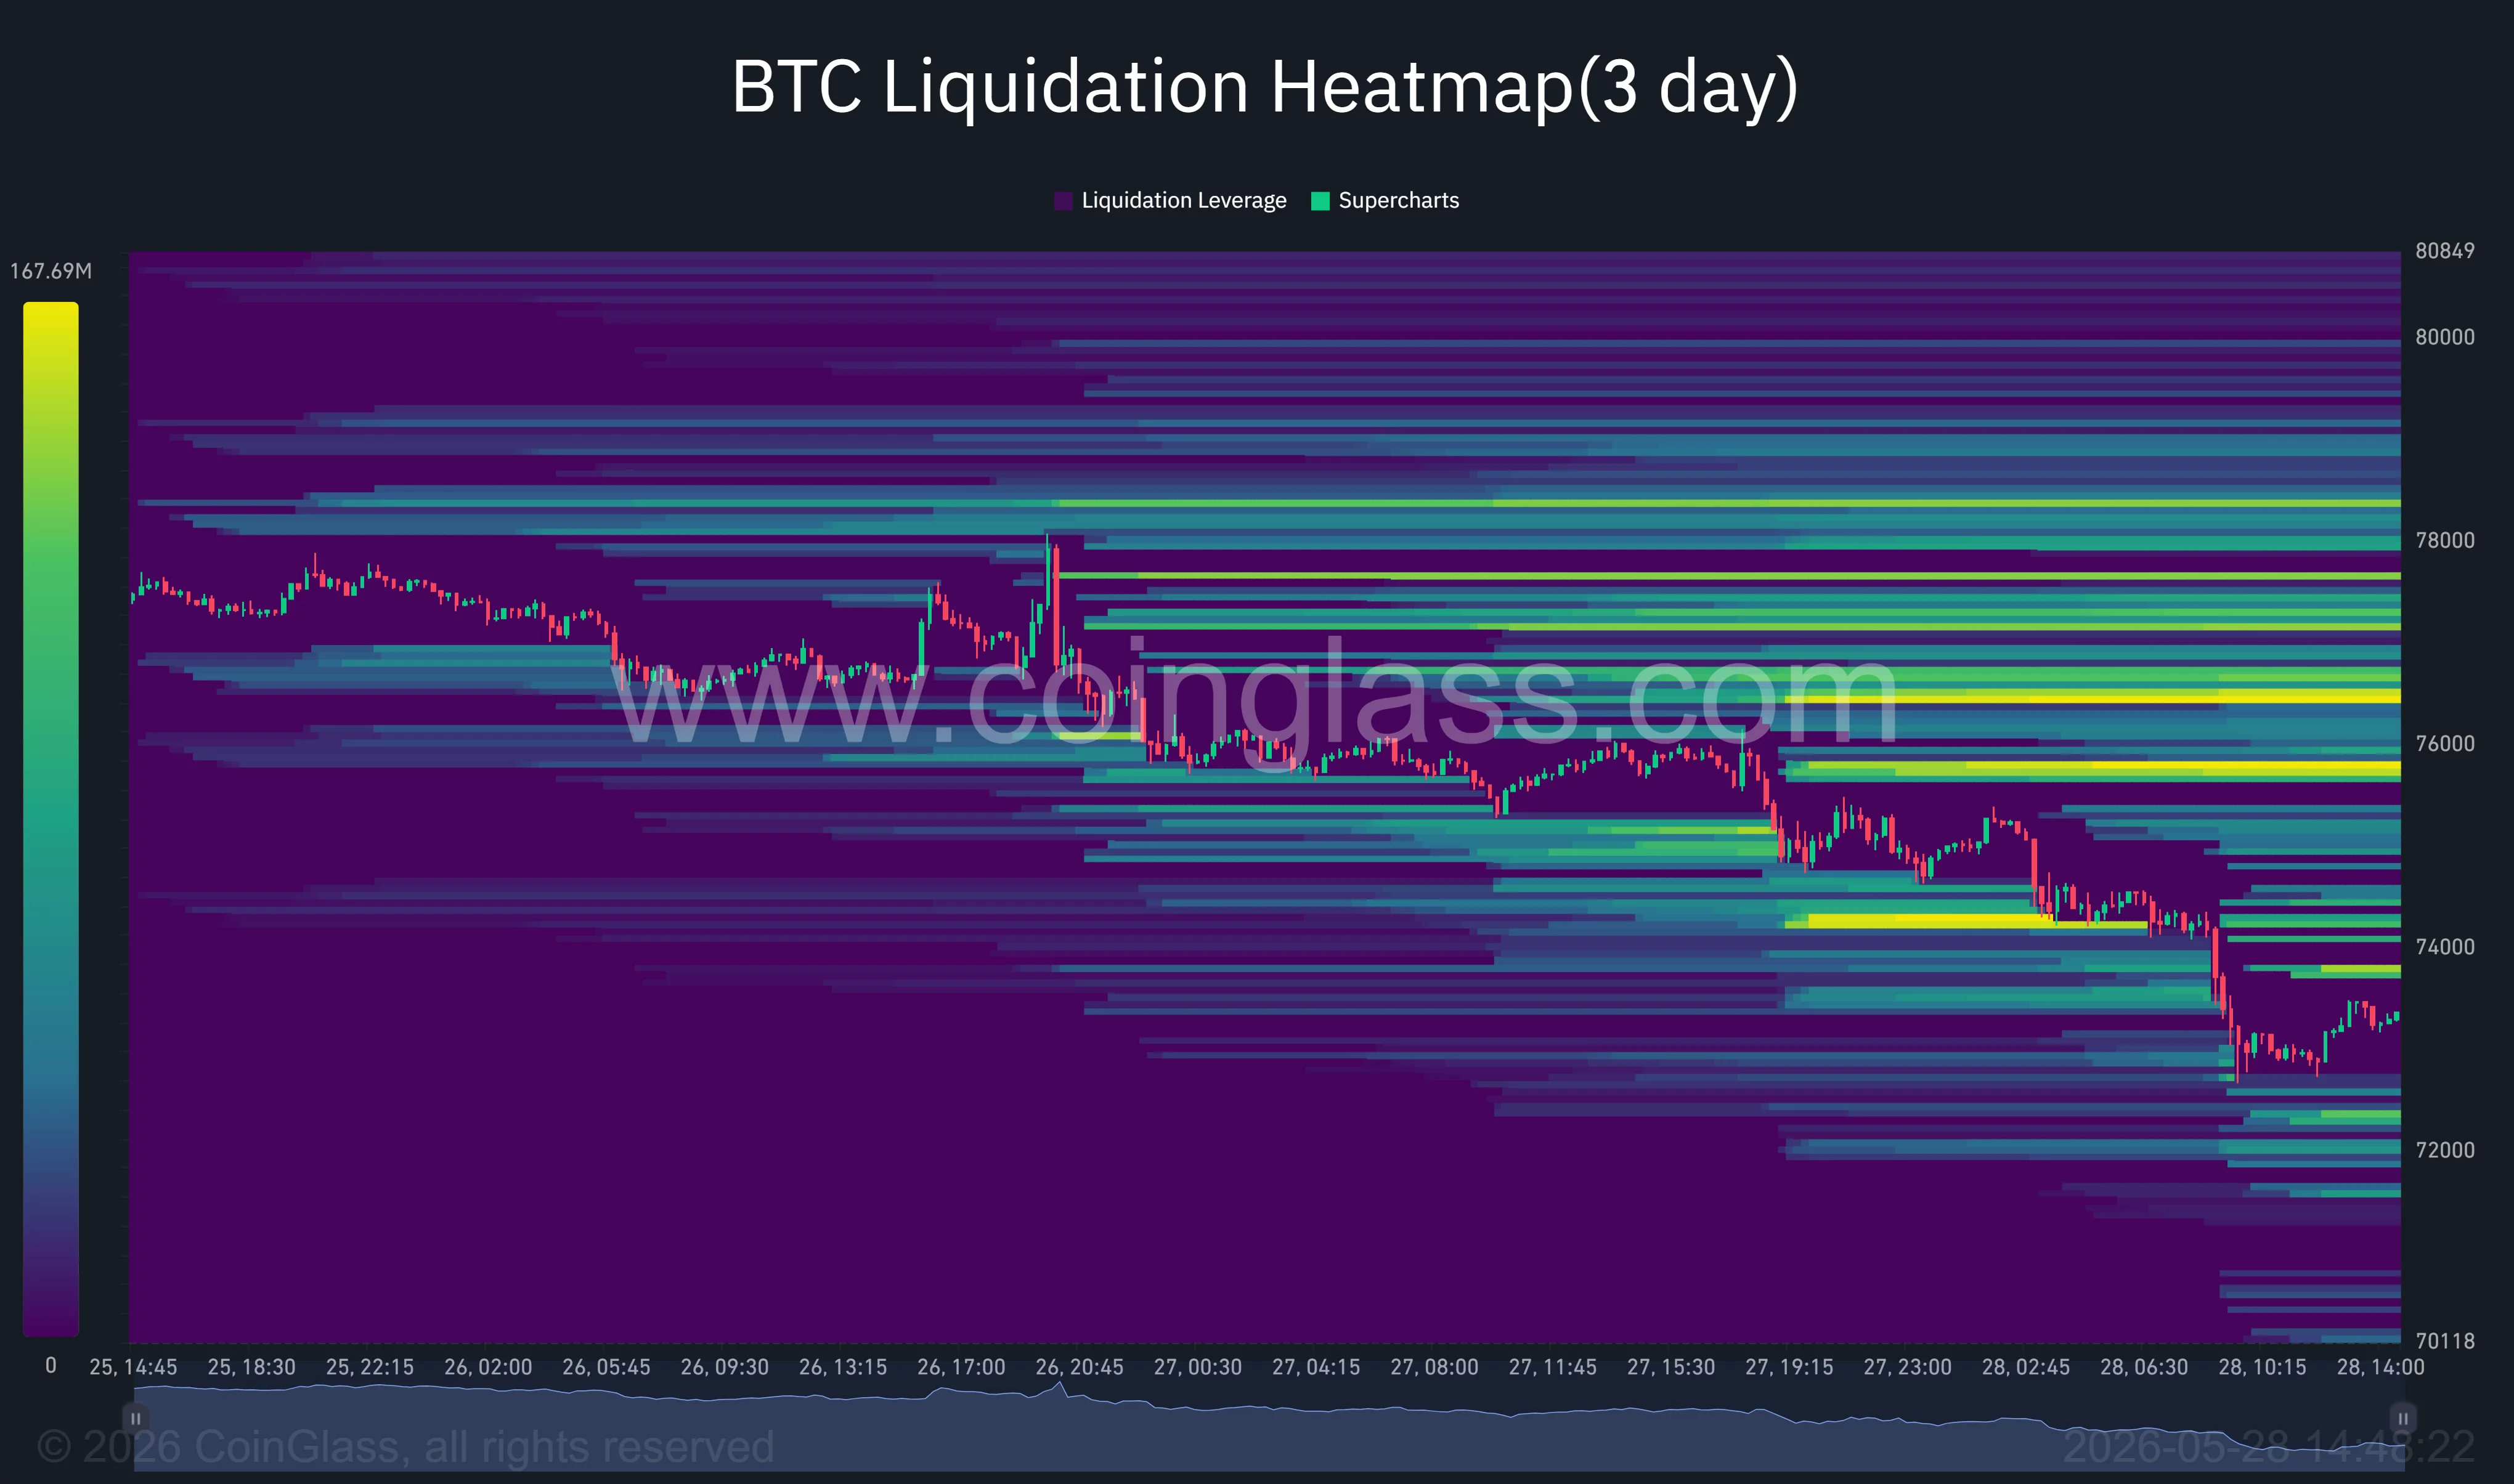
Below that region, thinner liquidity conditions extend toward the $70,000 psychological support level. A decisive breakdown beneath $71,000 could therefore accelerate volatility rapidly if another wave of long liquidations enters the market.
Despite the heavy selling pressure, some traders believe the current correction still remains within the structure of a larger bullish cycle. Bitcoin continues to trade above its March swing lows, and spot demand has not fully disappeared despite the ETF outflows.
ETF outflows and options expiry leave bulls defending $70K support
Institutional positioning, however, remains fragile ahead of Friday’s expiry event. Market makers often hedge aggressively near large options settlements, especially when spot price moves sharply away from major strike concentrations. With Bitcoin trading several thousand dollars below the dominant $80,000 call wall, hedging flows may continue adding pressure into settlement.
Order book data also shows buy-side liquidity concentrated primarily between $72,000 and $74,000. If those bids weaken during U.S. trading hours, traders may begin targeting the $70,000 support floor directly.
Funding conditions across derivatives exchanges have also deteriorated. Several perpetual futures markets briefly flipped negative after the latest sell-off, showing traders are increasingly positioning for further downside rather than expecting a quick rebound.
Meanwhile, open interest has started declining alongside price, a sign that leveraged positions are being forcefully closed rather than rotated into fresh longs. Combined with negative Coinbase Premium readings and continued ETF withdrawals, the setup has left bulls with limited short-term catalysts ahead of expiry.
For now, traders remain focused on whether Bitcoin can defend the $72,000-$70,000 support range through Friday’s settlement window. Failure to hold that region could expose BTC to a deeper correction toward the mid-$60,000 area, while a recovery back above $75,000 may ease immediate pressure and reduce the risk of another liquidation cascade.
Disclosure: This article does not represent investment advice. The content and materials featured on this page are for educational purposes only.

George R.R. Martin’s New Game of Thrones Project Finally Launches in 2 Months

The 12 Best Self Care Gifts to Get New Moms in 2026

Prostate cancer screening: Final guidance recommends against testing all men


-

 Crypto World7 days ago
Blockchain.com files with SEC for U.S. IPO
-

 Fashion6 days ago
Holiday Weekend Open Thread – Corporette.com
-

 Politics3 days ago
Bridgerton Season 5: Cast, Release Date And Everything We Know So Far
-
 Crypto World6 days ago
Bitcoin Accumulation Weakens as BTC Realized Losses Hit $600M
-

 Tech3 days ago
Microsoft’s quiet Claude Code retreat and the real cost of enterprise AI
-

 Business6 days ago
Dell Technologies DELL Stock Surges 15% on AI Server Momentum and Analyst Upgrades in 2026
-

 Crypto World5 days ago
Robinhood crypto COO Tanya Denisova exits
-

 Business4 days ago
NYT Strands Answers May 24 2026 Revealed for Puzzle No. 812 Theme Summer Essentials
-

 Business6 days ago
Trump Invests $1M-$5M in Kura Sushi USA Chain With 27 California Locations
-

 Politics6 days ago
Makerfield: a tale of two social-media histories
-
 Crypto World6 days ago
Space X IPO Is ‘Bad News’ for Tech Stocks: But What About Bitcoin?
-

 Business1 day ago
Selena Gomez Reportedly Upset Over Benny Blanco’s Comments on Her ‘Terrible’ Diet
-
 Crypto World6 days ago
MicroStrategy’s Saylor Says Miners No Longer Set Bitcoin Price, Another Force Has Taken Over
-

 Tech7 days ago
WhatsApp ads could make Irish debut after discussions with DPC
-

 Business3 days ago
BTS Sells Out Four Las Vegas Shows at Allegiant Stadium for ARIRANG World Tour
-
Tech23 hours ago
The Samsung pay deal is the moment Korean unions changed register
-
 NewsBeat7 days ago
Charity run by Reform leader Malcolm Offord accused of ‘law breaking’ over Scottish registration
-
 Tech6 days ago
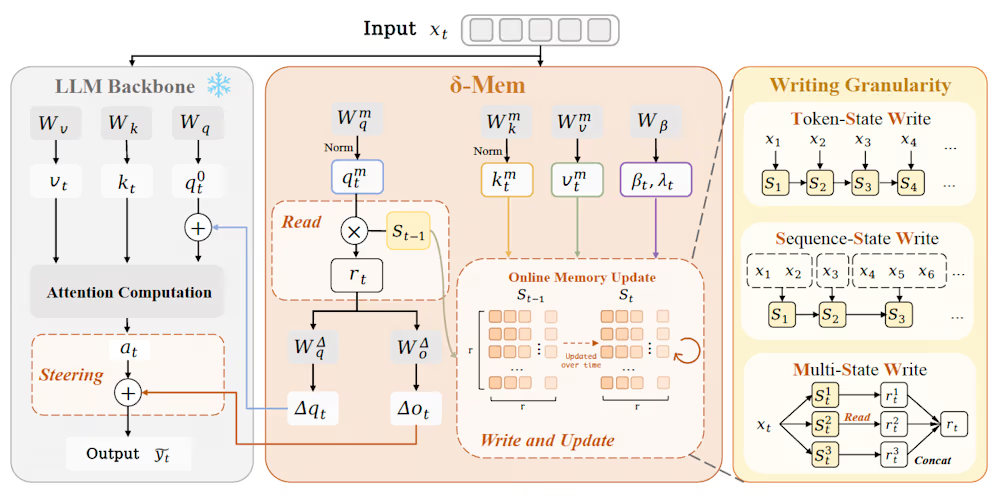
A 0.12% parameter add-on gives AI agents the working memory RAG can’t
-

 Crypto World6 days ago
AI infrastructure race heats up as IREN pitches full-stack strategy, WhiteFiber lands $160M deal
-

 Tech3 days ago
Westone Audio and Etymotic Acquired by Fidelity Collective in Major IEM Market Move
You must be logged in to post a comment Login