

Crypto World
Polymarket Exec Says KYC Limited To Beta Product

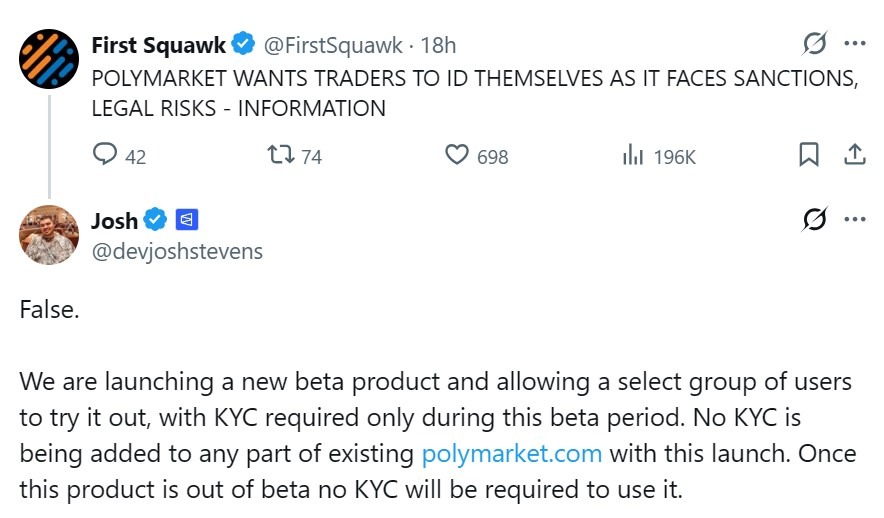
Polymarket’s vice president of engineering, Josh Stevens, clarified that the prediction market platform is not adding mandatory Know Your Customer (KYC) checks to its existing service, after a report said the company had considered user verification requirements.
Stevens said in an X response that Polymarket is launching a new beta product for a select group of users and that KYC is required only to access the beta during its early test period. “No KYC is being added to any part of existing polymarket.com with this launch,” Stevens wrote. He said that once the product is out of beta, no KYC will be required to use it.
He later addressed questions about whether KYC could be added later, saying “no” and clarifying that he was “just highlighting” that identity checks are tied to early access for a new beta product rather than a broader move away from pseudonymous trading on Polymarket’s main prediction market.
The clarification followed a report from The Information that said Polymarket had considered mandatory user verification requirements amid growing pressure from regulators.
Cointelegraph reached out to Polymarket and Josh Stevens for more information but had not received a response by publication.
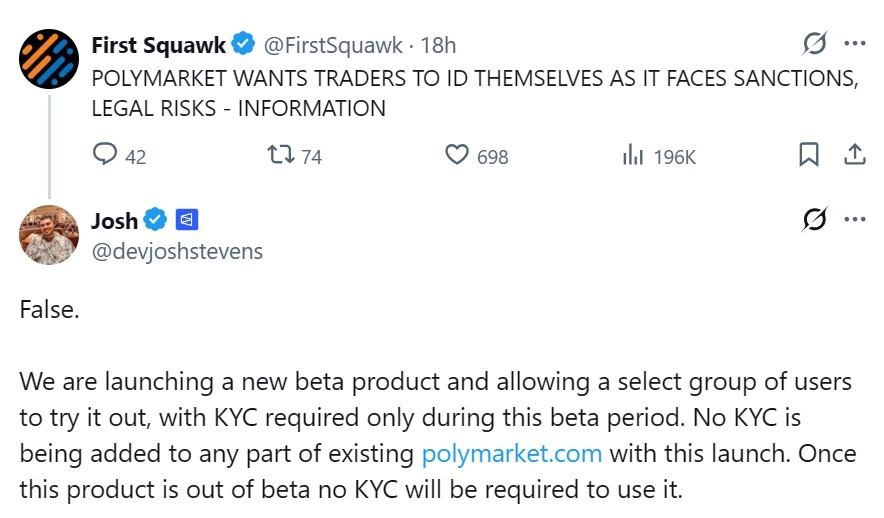
Source: Josh Stevens
Polymarket restrictions grow amid regulatory scrutiny
Polymarket’s clarification comes as the platform faces widening access restrictions across several jurisdictions.
As of Thursday, Polymarket listed dozens of restricted jurisdictions, including countries where users are blocked from placing orders and others where access is limited to closing existing positions.
Related: Monthly prediction market volume hits $25.7B as user activity shifts beyond one-off events
In April, Brazil moved to block 27 prediction market platforms, including Polymarket and Kalshi, after authorities said the services operated outside the country’s legal framework.
In May, Spain’s gambling regulator also blocked local users from Polymarket and Kalshi as a “precautionary measure” while authorities pursued legal proceedings over alleged unlicensed gambling activity.
Despite the restrictions, Polymarket has continued to pursue expansion in major markets. In April, the company was reportedly in talks with the US Commodity Futures Trading Commission over a broader US relaunch, and in May, it was reportedly seeking entry into Japan despite the country’s strict gambling laws.
Magazine: Big Questions: Do we really only need 2–5 cryptocurrencies?


Key Takeaways
- SPCX shares are sliding over 3% in early Monday trading, continuing a retreat from post-IPO highs reached earlier this month.
- Shares launched at $135 on June 12 and rallied strongly before dropping approximately 9% across the previous two trading sessions.
- Despite recent declines, SPCX remained 37% above its debut price through Thursday’s market close.
- KeyBanc launched coverage with Sector Weight, highlighting concerns over valuation multiples of 29x P/S and 71x EV/EBITDA.
- Wall Street consensus shows six Buy recommendations, with CFRA standing alone with a Sell rating.
SpaceX (SPCX) shares are experiencing a premarket decline exceeding 3% on Monday, hovering near $178 following consecutive losses of 5% and 3.6% on Wednesday and Thursday of last week.
Space Exploration Technologies Corp., SPCX
Shares reached $185 by Thursday’s closing bell — maintaining a 37% premium over the $135 IPO price — though the initial excitement surrounding the public debut appears to be waning. Many retail investors who entered positions following the June 12 listing have watched their profits largely disappear.
The company’s public offering became one of the most anticipated market events in recent history. Market capitalization briefly exceeded both Amazon and Microsoft during the initial trading days before retreating below both tech giants.
Financial reports show a $4.9 billion net loss for 2025, with an additional $4.28 billion loss recorded in Q1 2026. Optimistic shareholders are wagering on Elon Musk’s track record of building profitable ventures over time, despite current red ink.
Musk maintains a 42% ownership stake, subject to lock-up restrictions through June 2027. With approximately 5% of the total 13 billion shares available in the initial offering, trading volume remains constrained.
KeyBanc Raises Red Flags on Premium Pricing
KeyBanc launched coverage Monday with a Sector Weight designation — essentially a neutral stance. Analysts acknowledged SpaceX as “the dominant leader in space launch and space-adjacent verticals” while noting that current pricing offers balanced risk and reward.
Trading at approximately 29x price-to-sales and 71x EV/EBITDA based on 2027 projections, KeyBanc noted SPCX commands a significant premium compared to competitors in space technology, artificial intelligence, and communications sectors.
The research team identified Starship development as the critical factor to monitor. This next-generation launch vehicle is essential for deploying Starlink V3 satellites, reducing orbital delivery costs, and ultimately enabling space-based data centers. Starship’s thirteenth flight test is scheduled for June 29.
KeyBanc indicated it takes “a conservative approach” regarding development schedules, characterizing the coming 12–24 months as a “prove it phase.”
Revenue Stream Analysis
SpaceX operates through three primary divisions. Connectivity — anchored by Starlink — contributed 61% of 2025 revenue, producing approximately $11.4 billion with a robust 63% adjusted EBITDA margin. This division currently drives profitability.
The AI division, encompassing Grok and xAI operations following the February 2026 integration, continues operating at a loss. However, it has secured substantial contracts: an agreement with Anthropic valued at approximately $1.25 billion monthly, plus a separate Google partnership generating $920 million per month.
KeyBanc forecasts AI division revenue could surge to $50.6 billion by 2027. The challenge? Grok currently captures merely 3.1% of U.S. business adoption, trailing far behind Anthropic’s 41% and OpenAI’s 39.5% market share.
Current Wall Street consensus includes six Buy ratings on SPCX. CFRA remains the only firm maintaining a Sell recommendation. The upcoming Starship flight 13 on June 29 will serve as an important near-term milestone for investors.


Key Takeaways
- For the first time since 2000, SK Hynix momentarily surpassed Samsung Electronics in market valuation on Monday, both reaching approximately $1.35 trillion
- Export data from South Chungcheong Province shows Samsung’s HBM shipments increased 79% month-over-month in May, per Bernstein’s research
- Bernstein projects Samsung’s HBM revenue will experience 58% sequential growth in Q2 2026
- A 30% increase in Samsung’s “value per weight” metric during May indicates probable HBM4 production escalation, according to Bernstein
- While SK Hynix stock has jumped over 340% year-to-date, Samsung has posted a 200% gain
For over a quarter-century, Samsung Electronics maintained its position as South Korea’s largest company by market capitalization — that streak ended on Monday.
Samsung Electronics Co., Ltd., SMSD.L
SK Hynix temporarily claimed the top spot in market valuation, climbing 5.7% to reach 2,082.5 trillion won (approximately $1.35 trillion). Samsung followed closely at 2,081.3 trillion won, posting a modest 0.4% increase.
The valuation divergence between these semiconductor giants has intensified throughout the year. SK Hynix has skyrocketed more than 340% in 2026. Samsung’s approximately 200% appreciation, while substantial, reflects a widening performance gap.
This market cap reversal occurs as both chipmakers capitalize on artificial intelligence-fueled demand for high-bandwidth memory solutions. However, investors are increasingly favoring SK Hynix for its dominant position in HBM supply to AI semiconductor manufacturers.
Yet Samsung may be positioning for a comeback. Bernstein’s examination of South Korean trade statistics reveals that Samsung’s HBM shipments from South Chungcheong Province — its primary HBM packaging facility — soared 79% from April to May, representing a 55% increase compared to February levels.
Evidence of HBM4 Production Scaling
The acceleration in Samsung’s export numbers extends beyond simple volume metrics. Bernstein monitors a “value per weight” calculation that serves as a proxy for HBM pricing dynamics. Samsung’s reading climbed 30% in May while SK Hynix’s remained unchanged.
According to Bernstein, this pattern suggests Samsung is scaling production of HBM4 — its advanced-generation offering — rather than experiencing industry-wide price increases across all HBM products. Since HBM4 carries premium pricing, a product mix shift toward it would naturally elevate this indicator.
South Korea’s aggregate HBM exports reached unprecedented levels in May, advancing 13% month-over-month and 15% above February totals.
Bernstein’s current projections indicate Samsung’s Q2 2026 HBM revenue will expand 58% sequentially. While this represents robust growth, the firm acknowledges it remains below their internal expectations — potentially reflecting postponements connected to Nvidia’s Rubin platform timeline.
SK Hynix Maintains Advantage, But Samsung Gains Ground
SK Hynix’s May export patterns presented a contrasting narrative. Shipments from its North Chungcheong and Icheon facilities declined 9% versus April and dropped 3% compared to February. Despite this, Bernstein’s model anticipates 25% quarter-over-quarter HBM revenue expansion for SK Hynix in Q2, albeit marginally below the firm’s projections.
SK Hynix recently joined Samsung and Micron in achieving the $1 trillion market capitalization threshold during May, propelled by AI infrastructure demand.
HBM pricing remained stable throughout May despite significant fluctuations in traditional memory chip prices, which experienced sharp increases during the identical timeframe. HBM value per weight metrics maintained their established range, especially for SK Hynix.
Samsung’s stock advanced 0.14% on Monday. Micron (MU) surged 8.70% during the same trading session.
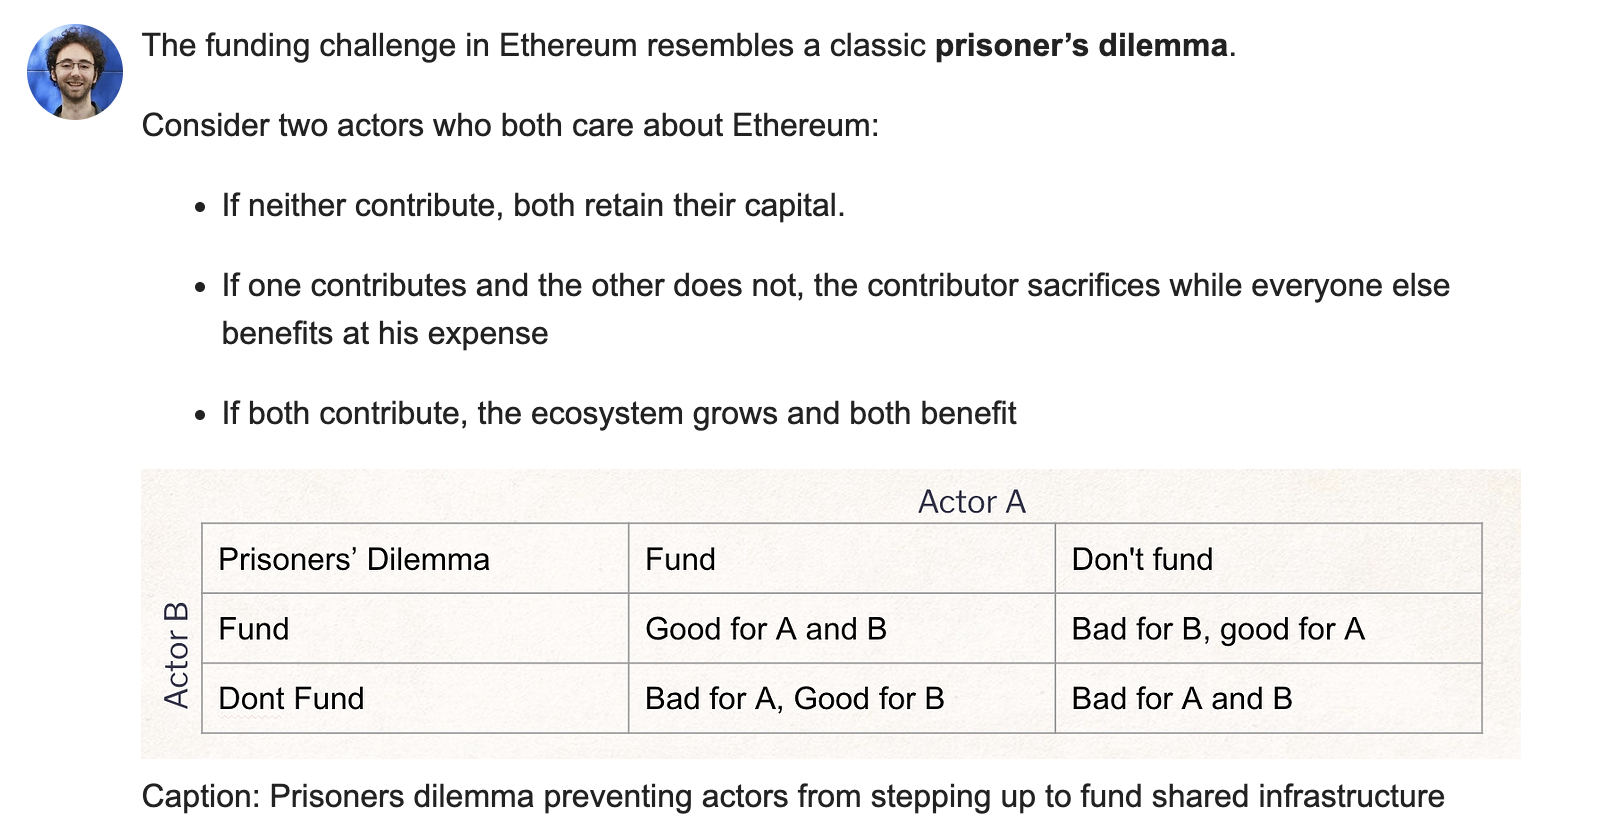
A tax proposal posted to the Ethereum Research forum by Kleros founder Clément Lesaege would let ETH validators vote to redirect up to 10% of staking rewards to public goods funding. If a majority of validators signal above zero, that rate becomes mandatory for every validator on the network, including those who voted for none.
For Bitmine (BMNR), which has staked 4.72 million ETH through its MAVAN platform and projects $258 million in annual net staking revenue, the exposure range is $50–100 million in lost income per year.
That figure is not speculative padding. It represents the direct arithmetic of applying a forced yield reduction to the single largest ETH staking position held by any public company. The proposal is still a forum post, not an EIP. That distinction matters – but so does the direction of travel.
Discover: The Best Token Presales
The ETH Validator Redirected Revenue Tax Proposal
Lesaege’s post, titled “Validator Redirected Revenue,” frames the mechanism as a solution to a coordination failure. According to his ETH tax proposal, Ethereum’s shared infrastructure generates value for everyone but is funded by no one in a structured, protocol-level way.
His proposed fix is a signaling system embedded in the consensus layer. Each validator declares a preferred redirect rate between 0% and 10% of their staking rewards. If more than 50% of total staked ETH signals are above zero, a single rate is selected and applied universally.
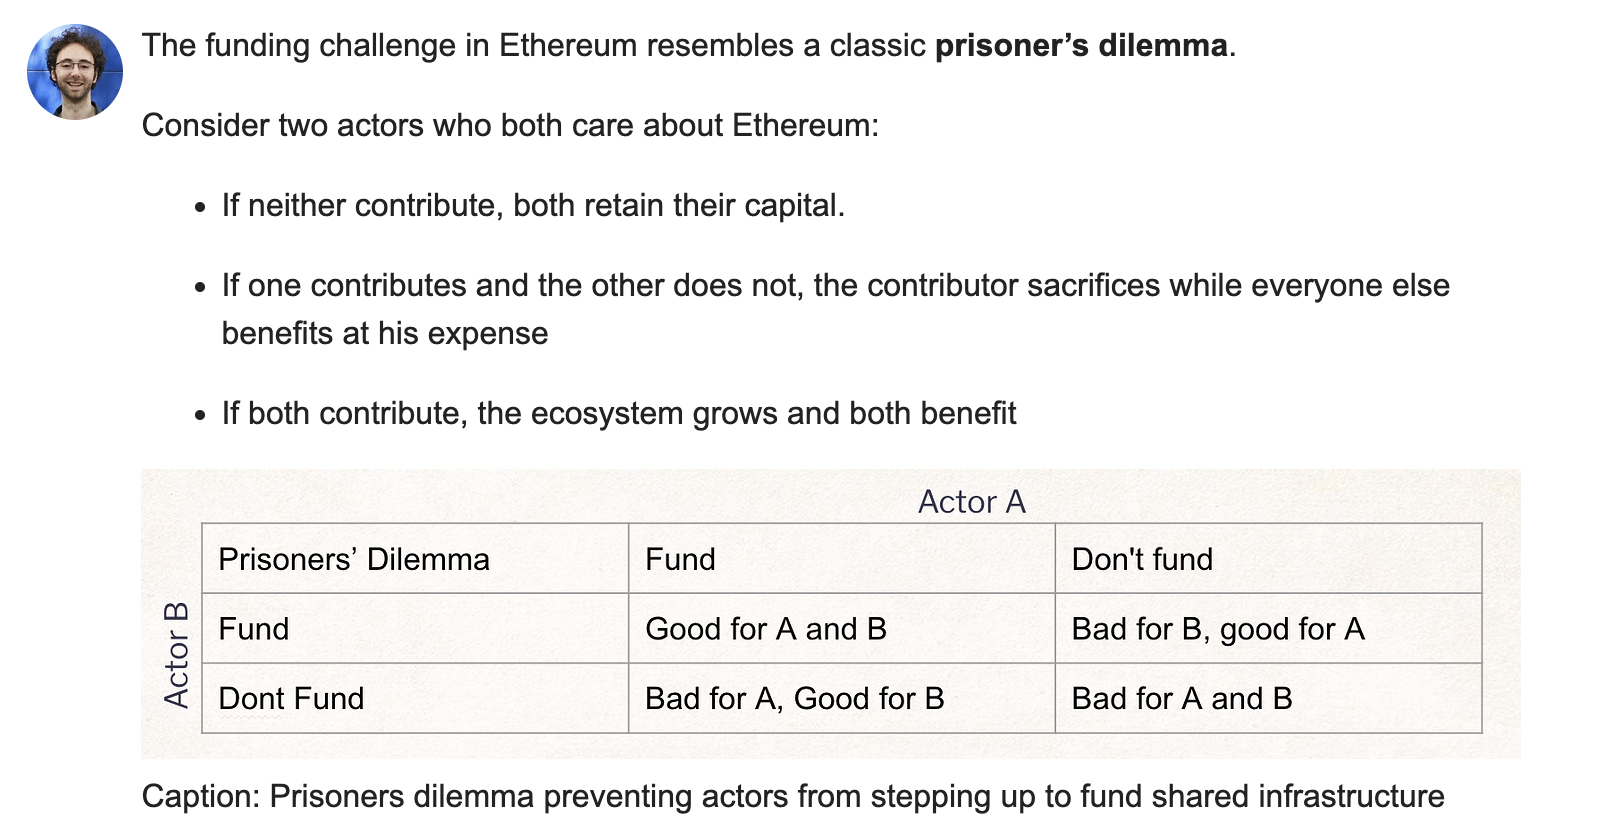
Now, a validator that voted for 0% redirection does not retain its full yield if the majority crosses the threshold, as it gets swept into the mandatory rate alongside everyone else. Funds flow automatically to an allocation smart contract, with a splitter routing capital to designated recipients such as Gitcoin, Octant, and audit organizations.
Lesaege explicitly described the post as a conversation-starter: “We seek further feedback before working on a technical implementation to put forth as an Ethereum Improvement Proposal.” As of now, no EIP number has been assigned.
A parallel mechanism called Validator Revenue Redistribution (VRR), presented by Ethereum Foundation researcher Devansh Mehta at EthCC, provides the technical plumbing layer. Mehta described the threshold dynamically, “If 51% put their flag up, all 100% of stakers have to part with a portion of their rewards.”

Discover: The Best Crypto to Diversify Your Portfolio
Bitmine’s MAVAN Platform: The $258M Revenue Thesis Exposed to Protocol Governance
Bitmine’s May 8-K reported 4,718,677 ETH staked via MAVAN, or 87% of its 5.42 million ETH total holdings and 4.49% of total ETH supply. The 7-day annualized yield at that date was 2.73%, against a CESR benchmark of 2.81–2.84%. At full deployment, Bitmine projects $296 million in gross staking rewards and $258 million in net staking revenues annually.
The math for a protocol-level redirect is straightforward. Each 1 percentage point reduction in effective annual yield on 4.72 million ETH costs approximately $94 million per year in gross rewards at an ETH price around $2,000.
However, a 10% redirect of the current 2.73% yield diverts 0.27 percentage points, translating to $25 million per year flowing away from BMNR’s validators. At this rate alone, the direct hit is meaningful but not existential.
The $50–100 million exposure range reflects a wider scenario set. If the mandatory redirect rate compounds with any secondary compression in overall validator economics like reduced participation incentives, institutional validators exiting to restaking or L2 yield strategies, or ETH price movement, the effective yield impact on 4.72 million ETH staked.
Staking revenue is not a secondary income line for Bitmine. It constituted more than 93% of quarterly revenue in Q2 FY2026, and the company declared a $0.01 annual dividend in January 2026. Bitmine is the first large-cap crypto company to do so, funded directly by staking income.
A material yield cut would pressure that commitment in a way that no operational decision by management can offset. The ETH validator tax is not a cost Bitmine can engineer around; it is a protocol-level deduction from the asset class itself.
Discover: The Best Token Presales
The post Kleros Founder’s ETH Tax Proposal Puts Bitmine’s $258M Revenue at Risk appeared first on Cryptonews.
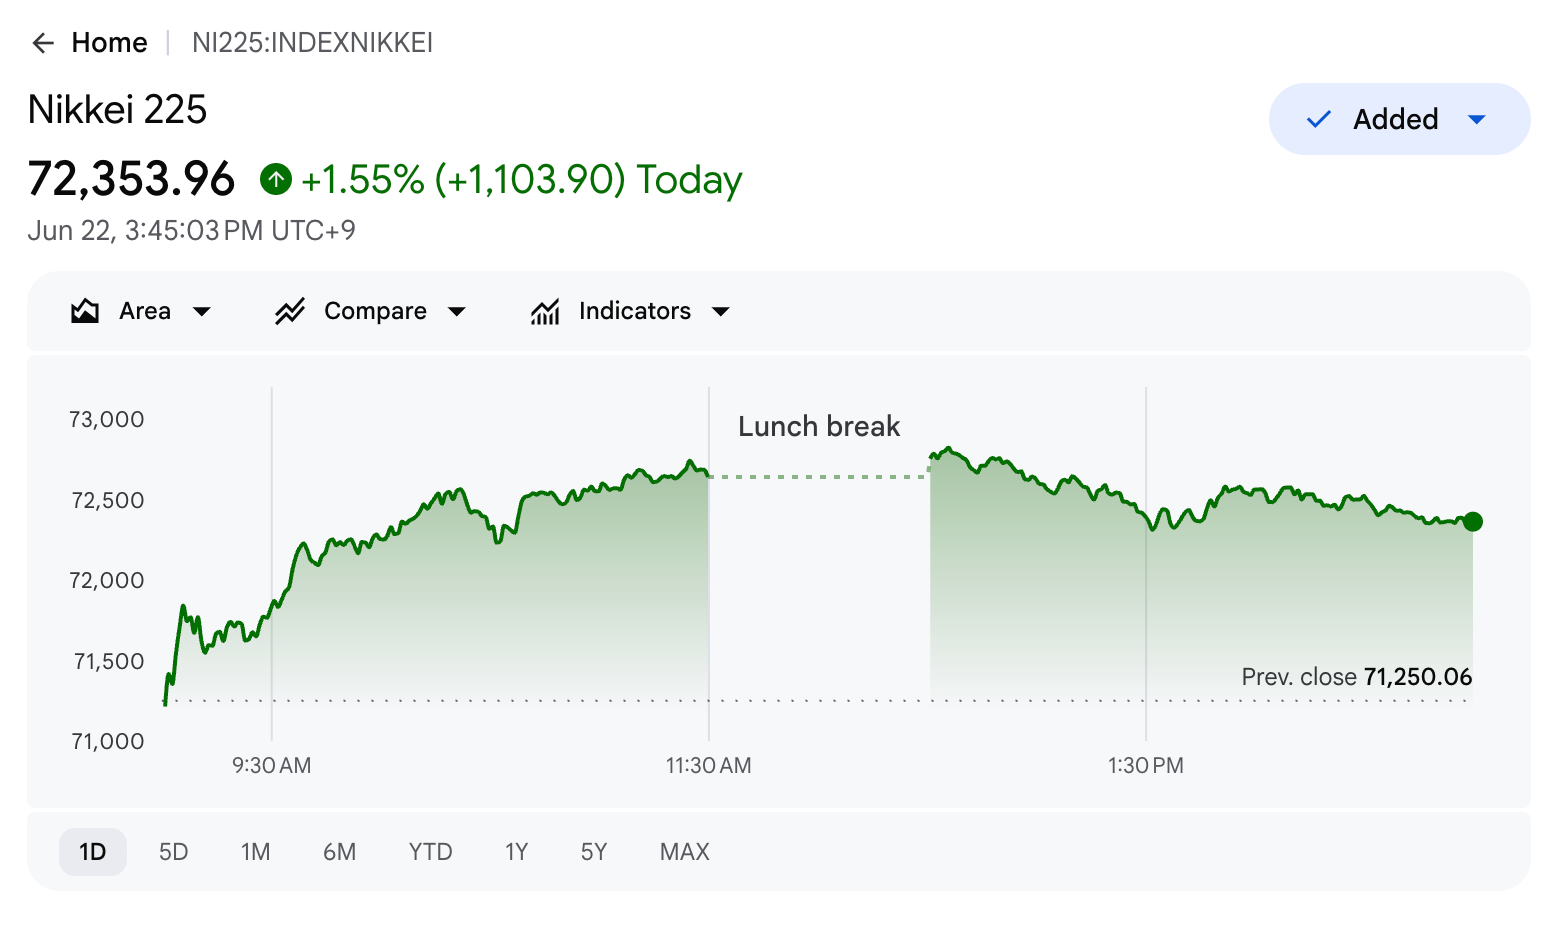
Japan’s Nikkei 225 recorded a new all-time high on Monday as the yen continued to slide.
The currency softened to 161.7 per dollar, just short of 161.96. A break past that mark would leave the yen at its weakest in nearly four decades and intensify pressure on Tokyo to respond.
Japan’s Nikkei Tops 72,000
Nikkei 225 closed at a record 72,353.96 on Monday, climbing 1.55% after hitting an intraday high of 72,831. The Topix rose 1.24% to 4,095.05.

The advance added more than ¥25.74 trillion ($156 billion) to the index’s market value, according to analyst Bull Theory. The rally extended across Asian equities, with South Korea’s KOSPI up 0.7% and China’s SSE Composite Index climbing 1.78%.
The advance followed constructive US-Iran talks in Switzerland, where technical negotiations will continue this week. Mediators Qatar and Pakistan confirmed progress, despite US President Donald Trump’s threats of military strikes.
Follow us on X to get the latest news as it happens
Yen Nears 40-Year Low
While stocks climb, Japan’s currency is heading the other way. The yen weakened to 161.7 per dollar, and a move past 161.96 would push it to its lowest point since 1986.
The decline persists despite Tokyo’s efforts to halt it. Japan spent a record ¥11.73 trillion ($73.4 billion) supporting the yen through late May.
Separately, the Finance Ministry’s reserve data showed the country’s foreign securities holdings fell by $75.6 billion from April to the end of May. That drop roughly matches the scale of Japan’s latest intervention to defend the currency.
The Bank of Japan has also tightened policy, lifting its benchmark rate to 1% from 0.75%, the highest since 1995. Higher rates typically support a currency, yet the yen’s weakness has continued regardless.
Subscribe to our YouTube channel to watch leaders and journalists provide expert insights
The post Japan’s Nikkei Hits Record High as Yen Slides Toward Its 1986 Low appeared first on BeInCrypto.
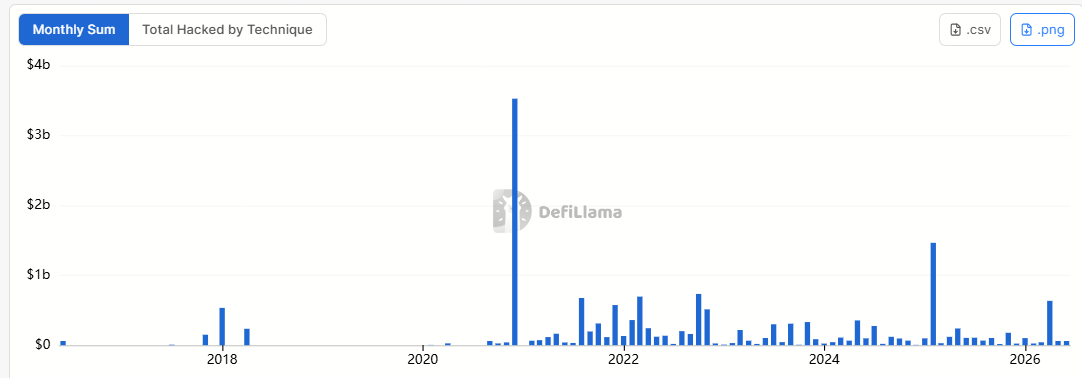
The second quarter of 2026 has already become the most-hacked quarter on record by incident count, with 83 exploits targeting cryptocurrency protocols, according to analysis by market insights platform Unfolded based on DefiLlama data.
However, the $755.3 million stolen during the quarter so far is significantly lower than the $3.56 billion lost in the fourth quarter of 2020, which remains the costliest quarter on record for crypto hacks.
KelpDAO’s $293 million hack and Drift Protocol’s $280 million exploit were the largest incidents of the quarter.
The figures suggest hacking activity is becoming more frequent, even as total losses remain below previous record levels.
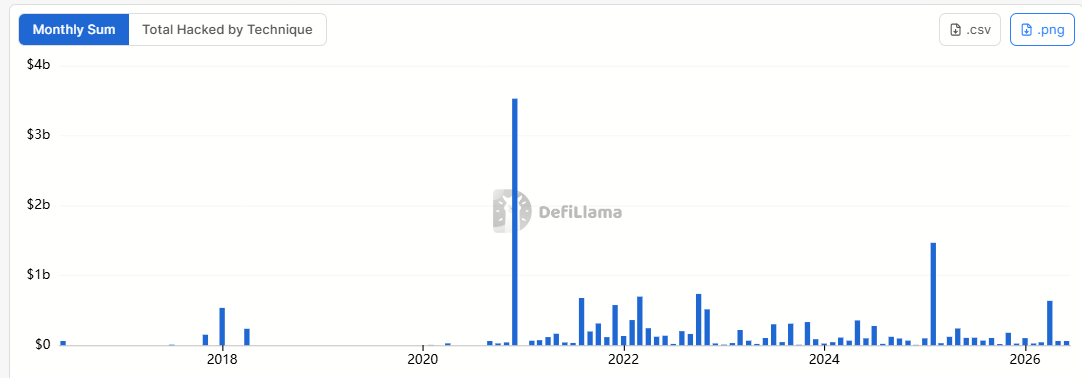
Cryptocurrency hacks by monthly sum, all-time chart. Source: DefiLlama
Bridge exploits emerged as leading attack vector in Q2 2026
Cross-chain bridge exploits emerged as the biggest attack vector of the quarter, with $351 million in value hacked from bridges alone.
The LayerZero OFT bridge exploit, which led to the $293 million KelpDAO hack, accounted for more than 38% of the value stolen during the quarter. Compromised admin attacks and fake token price manipulation accounted for 37% of losses, while private key compromises represented 5.66%.
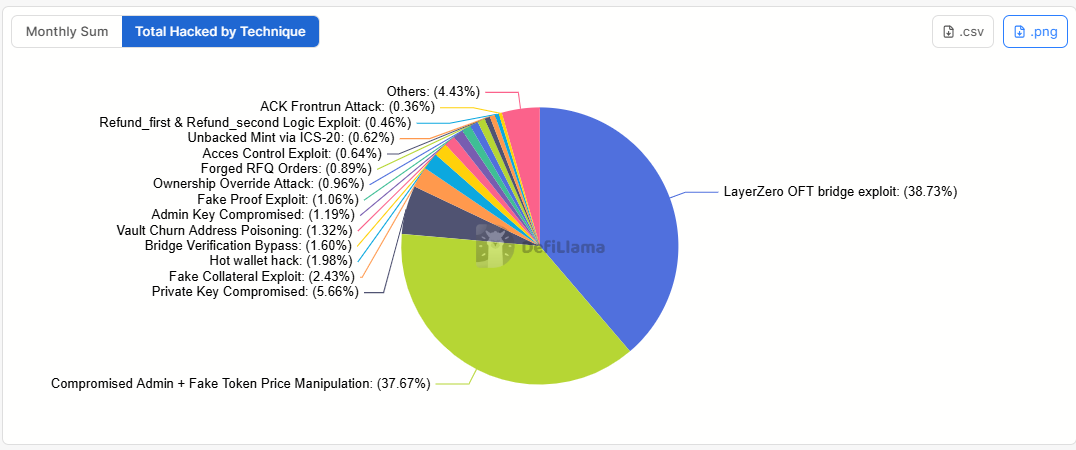
Total hacked by technique in Q2 2026. Source: DefiLlama
Ethereum layer-2 blockchain Taiko was the latest network to suffer an exploit on one of its bridge protocols, as hackers stole $1.7 million by compromising Taiko’s chain state verification mechanism.
Related: Humanity Protocol’s $36M loss tied to suspected North Korean hackers: Quantstamp
Other notable incidents of the past quarter include the $36 million stolen from Humanity Protocol on June 8 and the $10.7 million exploit on THORChain on May 15.
Other recent incidents include two exploits on Aztec Connect’s abandoned smart contracts, each resulting in $2.1 million stolen and $1.3 million stolen from decentralized exchange Raydium earlier in June.
The incidents add to the ongoing debate about whether the development of new artificial intelligence models has reshaped the crypto industry’s security landscape, concerns that arose from the series of exploits in April.
During a recent interview, Mitchell Amador, the CEO of bug bounty platform Immunefi, told Cointelegraph that the proliferation of new AI models has shifted the cybersecurity playing field in favor of attackers, causing a “vulnerability apocalypse” that led to the resurgence in exploits.
Magazine: Coinbase hack shows the law probably won’t protect you — Here’s why
Key Takeaways
- The greenback maintained positions near 12-month highs amid growing expectations of Federal Reserve rate increases
- Japan’s currency weakened to approximately 161.73 per dollar, approaching its lowest point since the mid-1980s
- British Prime Minister Keir Starmer’s resignation announcement triggered downward pressure on sterling
- Diplomatic progress between Washington and Tehran on nuclear negotiations led to crude oil dropping almost 2%
- Market positioning data reveals bullish dollar wagers have reached approximately $30 billion, the highest in over a year
The US dollar continues to maintain strength near its highest point in twelve months as financial markets anticipate the Federal Reserve will implement interest rate increases. Meanwhile, Japan’s currency hovers dangerously close to a four-decade nadir, and political developments in Britain have pressured the pound sterling.
Following last week’s Federal Reserve policy meeting, central bank officials indicated the possibility of rate hikes materializing before year-end. This messaging prompted market participants to adjust their timing expectations for monetary tightening.
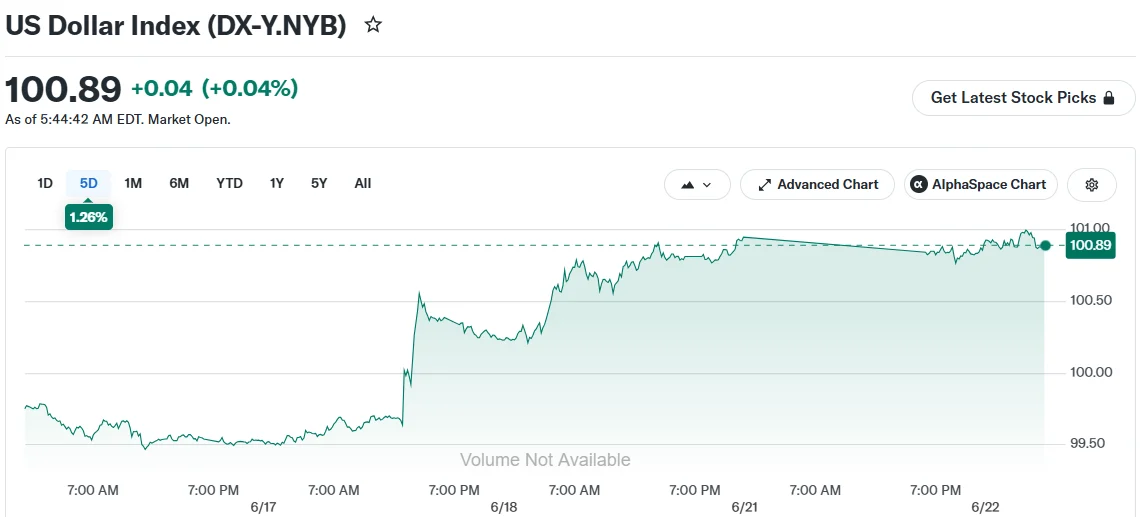
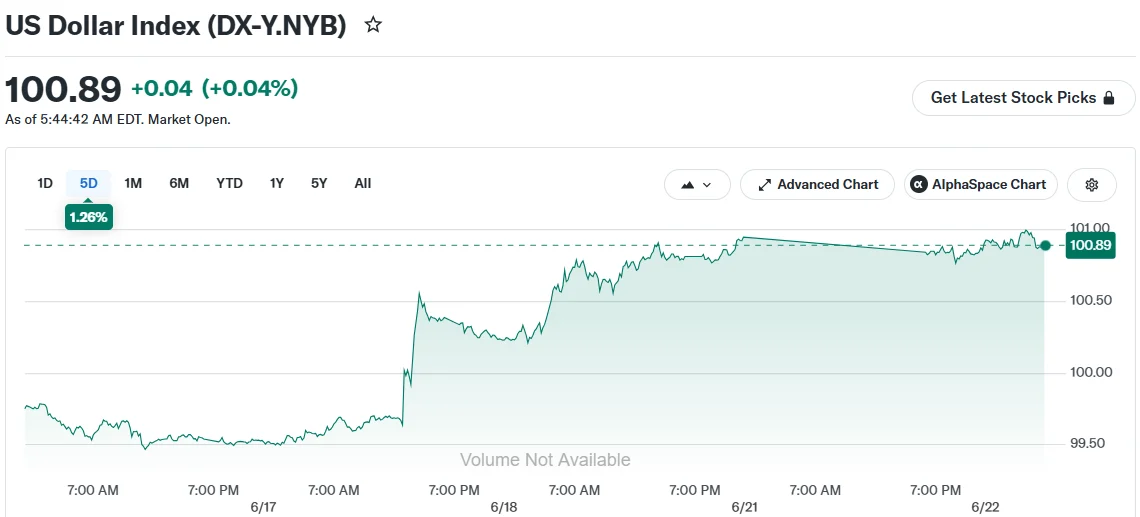
The dollar index, a benchmark measuring the greenback’s performance against a basket of six major global currencies, was hovering around the 101 mark. Year-to-date, the index has climbed nearly 3%.
Market speculators have significantly increased their bullish dollar positions. According to Commodity Futures Trading Commission data, these wagers have reached approximately $30 billion — representing the most substantial positioning in sixteen months.
Jeremy Stretch, who serves as head of G10 currency strategy at CIBC, indicated the dollar’s strength is likely to persist. He emphasized that market expectations for at least one Fed rate increase this year provide support for additional dollar appreciation.
Stretch further suggested that even aggressive action from the Bank of Japan may prove insufficient to halt the dollar’s advance against the yen.
Japanese Currency Approaches Four-Decade Weakness
The Japanese yen was changing hands at approximately 161.73 against the dollar during Monday trading sessions. A breach of the 161.96 level would mark the currency’s weakest position since 1986.
Satsuki Katayama, Japan’s Finance Minister, emphasized that government officials stand prepared to address currency market movements whenever necessary.
However, market observers remain doubtful about intervention effectiveness. Matt Simpson, a senior market analyst at StoneX, suggested Tokyo might feel “powerless” considering the substantial momentum driven by Federal Reserve rate expectations.
Japanese authorities deployed a record 11.7 trillion yen in market intervention efforts as recently as April 30. Despite this historic spending, those stabilization gains have been completely erased.
British Political Developments Impact Sterling
UK Prime Minister Keir Starmer announced his intention to step down on Monday, triggering a 0.1% decline in the pound to $1.322.
Andy Burnham, a Labour Party rival, has emerged as the leading candidate to succeed him. Burnham has reassured financial markets of his intention to maintain the United Kingdom’s existing fiscal framework.
Lee Hardman, an analyst at MUFG, noted this fiscal commitment has offered markets some comfort, helping to contain further sterling weakness in the immediate term.
Crude Prices Decline Following Diplomatic Breakthrough
Negotiations between the United States and Iran yielded a framework for reaching a comprehensive agreement within a 60-day timeline, according to statements from mediating countries Qatar and Pakistan. Oil prices responded with nearly 2% declines, pushing Brent crude down to $79.10 per barrel.
Iran simultaneously announced closure of the Strait of Hormuz, maintaining an element of market uncertainty.
Thu Lan Nguyen, an analyst at Commerzbank, observed that declining oil prices have not undermined dollar strength because interest rate expectations remain the primary market driver. Should crude prices rebound and intensify inflationary pressures, that development could further reinforce rate increase expectations — and consequently boost the dollar even more.
The dollar index touched a one-year peak of 101.127 on Friday before experiencing modest pullback during Monday’s trading.

Distributed AI training, validated for intercontinental workloads
Columbia University’s Department of Industrial Engineering and Operations Research has been involved in a research effort that, according to its organizers, demonstrates remote AI model training using GPU infrastructure located in Paraguay. The work is described as a first AI research project completed on HIVE Digital Technologies’ (NASDAQ: HIVE) GPU cluster in Asunción, with results submitted for consideration at NeurIPS, one of the largest machine learning conferences.
What the study claims
In the reported setup, researchers based in New York trained AI models on HIVE’s GPU infrastructure in Paraguay, a distance of more than 5,000 miles. The key theme is the feasibility of distributed AI training across geographies, where latency, network reliability, and software performance can materially affect training efficiency.
The organizers also say the study found that software optimizations allowed HIVE’s A40 GPU infrastructure to deliver performance that was comparable to newer-generation H100 systems once normalized for hardware capabilities. Normalization matters in these comparisons because raw throughput often varies by model, batch size, and the software stack, making apples-to-apples benchmarking difficult without explicit methodology.
Why NeurIPS submission matters
For the AI infrastructure market, peer-reviewed or conference-submitted research serves as a signal that performance claims are at least reproducible within a defined experimental framework. NeurIPS is typically used as a venue where methods, measurements, and system constraints are scrutinized by other researchers.
That said, the announcement describes a project completion and submission, not the final peer-reviewed acceptance of results. For investors and operators, the practical value will hinge on what eventually appears in the NeurIPS program, including details such as the models used, the distributed training configuration, the networking assumptions, and the definition of performance equivalence.
Intercontinental training as an infrastructure test
Beyond the headline GPU comparison, the underlying test is whether an intercontinental arrangement can support meaningful training workflows. Distributed training is typically constrained by more than compute availability. Network throughput and jitter, data movement patterns, and synchronization overhead can reduce the efficiency of scaling, especially when compute nodes are remote from model development and experiment management.
If the reported outcomes are consistent with the conference submission, they suggest that organizations do not necessarily need to locate training infrastructure next to their primary research teams to run distributed workloads. That can broaden the feasible footprint for compute capacity, including in regions where power, land, and data center expansion may be favorable.
Paraguay’s expanding role in compute availability
The announcement ties the research project to HIVE’s longer-term strategy of building GPU capacity in Paraguay using renewable power. Paraguay has drawn attention in parts of the energy and data center ecosystem for its hydropower-based generation mix, which can be relevant for power-intensive compute operations.
HIVE also describes additional infrastructure development, including a planned 100 MW substation in Yguazú intended to support a Tier III AI data center and high-performance computing campus. If completed as outlined, that would be designed to increase both the reliability and scale of power delivery for HPC and AI training workloads, which are often bottlenecked by electrical capacity and cooling requirements as much as by GPU count.
What this could mean for “sovereign AI” positioning
In the broader industry conversation, the idea of “sovereign AI compute” typically refers to building and operating compute capacity within a country or region, rather than relying entirely on external hyperscale cloud providers. For researchers and enterprises, the motivations can include data governance requirements, supply chain considerations, and resilience in procurement.
Distributed training over long distances, as described in this collaboration, could support a model where research teams remain in one geography while compute is provisioned elsewhere. Whether that becomes a mainstream workflow depends on cost, performance, and operational tooling, including orchestration, scheduling, and monitoring across networks.
Key points to watch next
- Conference details: When the NeurIPS submission is finalized, reviewers will be looking for clear methodology, model specifications, and the metrics used to compare A40 to H100 performance.
- Software and benchmarking scope: Performance comparisons that rely on “normalization” and “optimizations” should clarify what was changed and how generalizable the results are across workloads.
- Operational reproducibility: Distributed training results are strongest when they can be reproduced under different conditions, including varied network performance and dataset sizes.
- Infrastructure scaling: The next phase will likely center on whether planned power delivery and data center capacity translate into repeatable, enterprise-grade training availability.
Bottom line
The Columbia University collaboration described in connection with HIVE’s Paraguay GPU cluster adds to an emerging body of work focused on making AI training more flexible by decoupling where compute is located from where research occurs. For market participants, the most concrete validation will come from what ultimately lands in NeurIPS, particularly the technical specifics behind distributed training performance and the conditions under which newer-generation GPUs can be closely matched through software and system design.
Bitcoin (BTC) treads water at $64,000 to start the week, but market participants see plenty of catalysts coming.
Key points:
- The US dollar is on the rebound, and history shows that Bitcoin rarely enjoys a strong DXY.
- July often does the opposite of June, and this forms the case for BTC price relief next.
- PCE inflation data is due out against a backdrop of uncertain US-Iran peace.
- Bitcoin’s relationship to oil prices is boosting the odds of $60,000 support holding.
- Short-term holders may have sold off, but whales are not interested in “capitulation” at current prices.
Bitcoin traders eye new US dollar challenge
A familiar headwind for Bitcoin price action is back in focus this week amid ongoing efforts to end the US-Iran war.
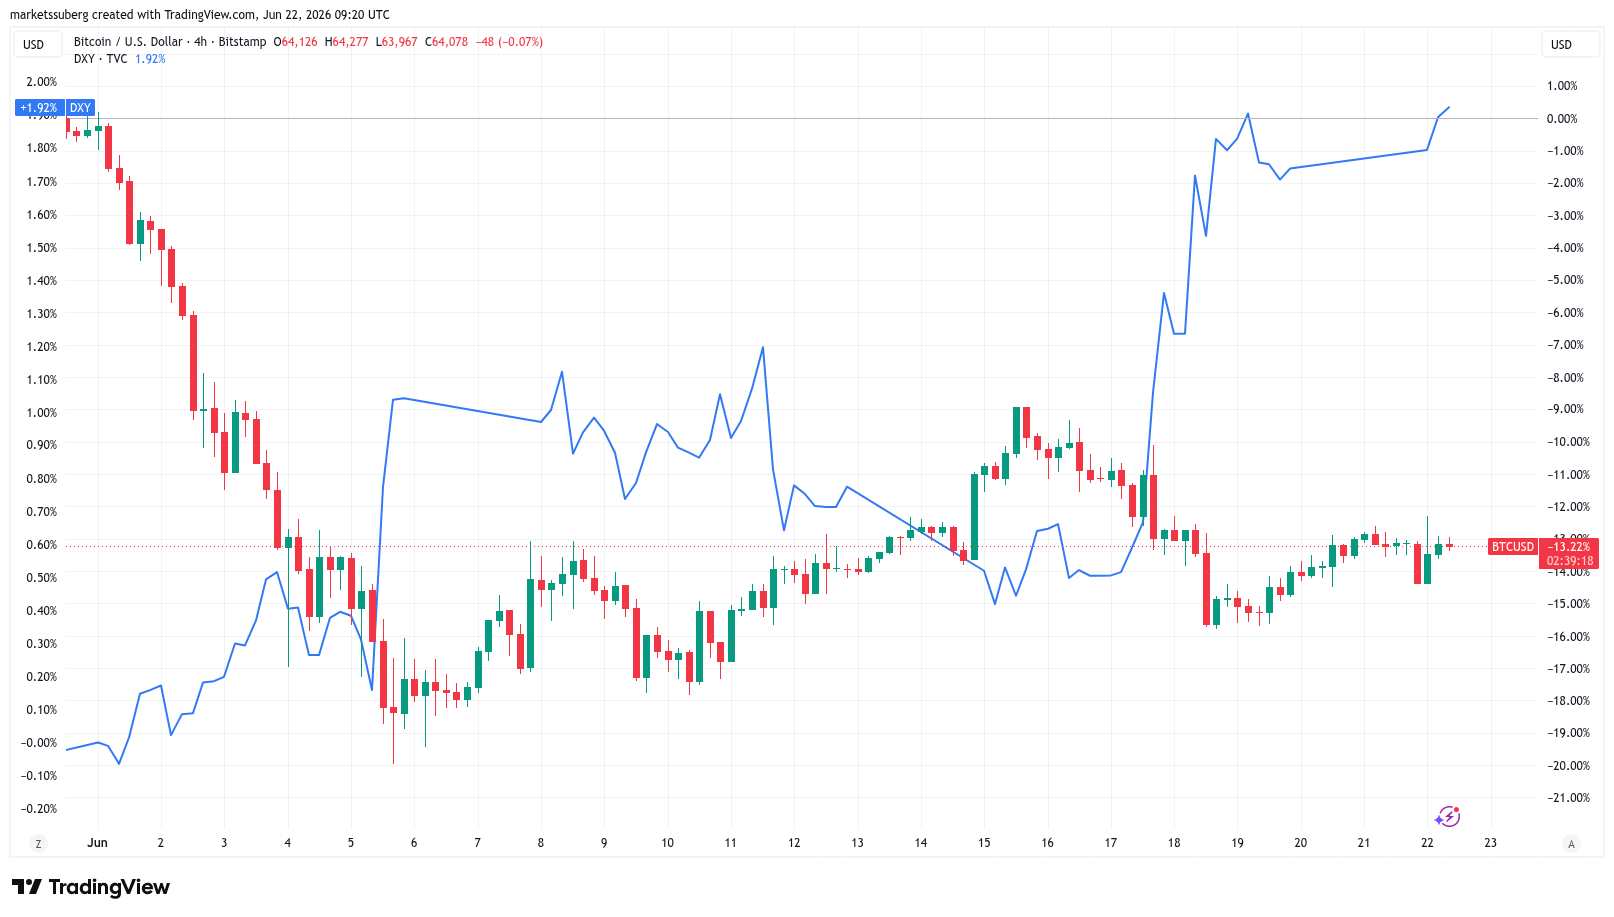
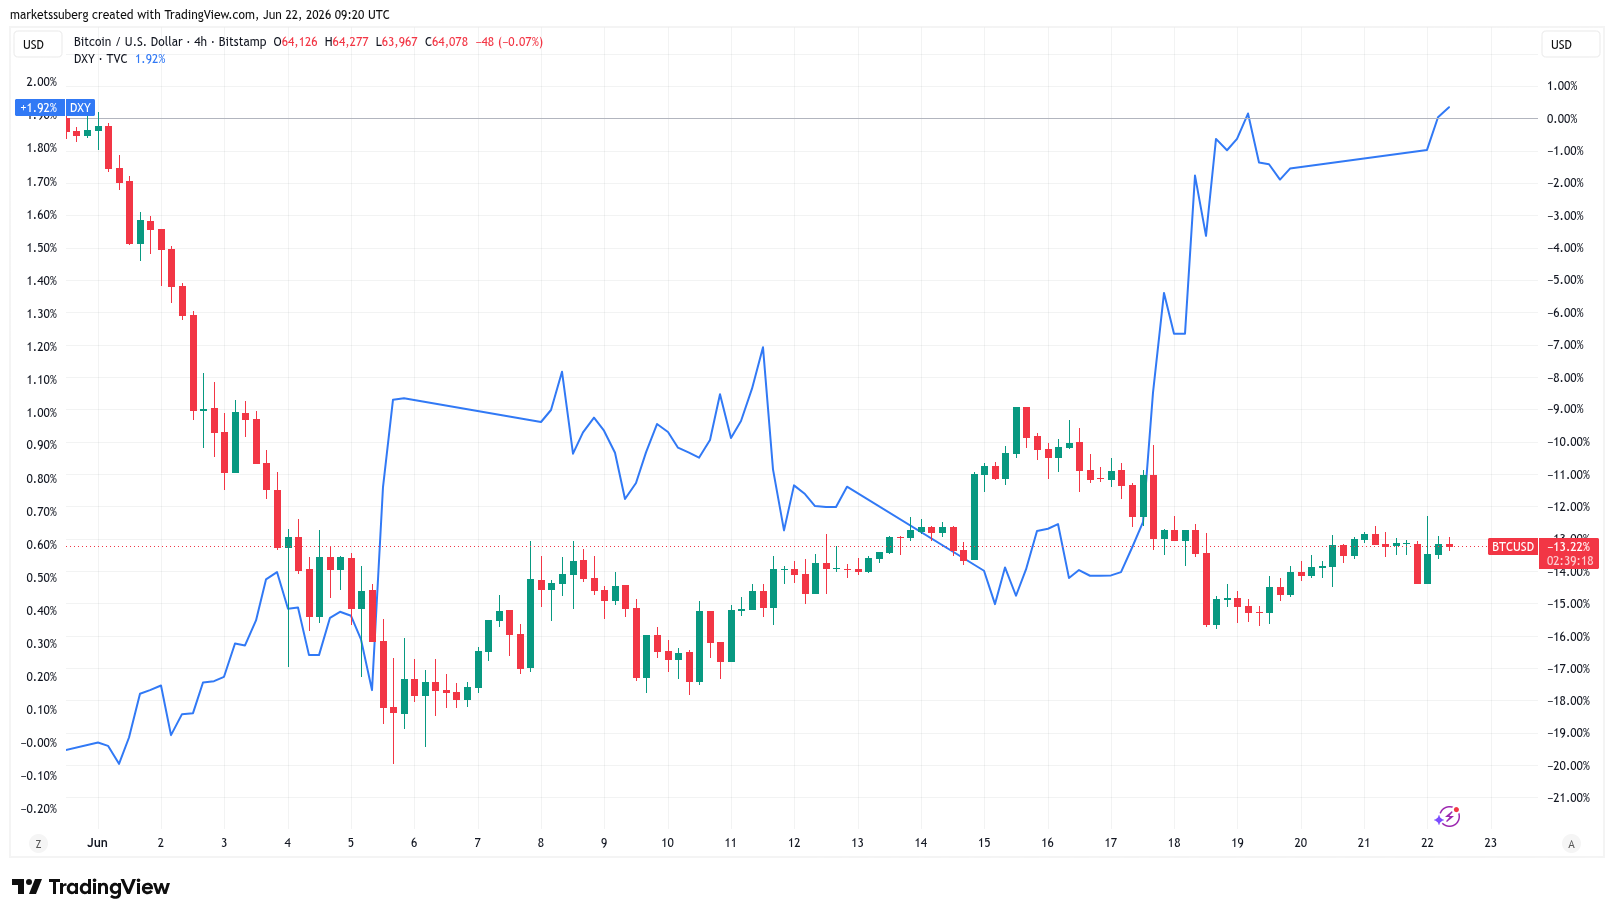
The US dollar index (DXY) is back above 100, and has hit its highest levels in over a year, per data from TradingView.
BTC/USD vs. US dollar index (DXY) four-hour chart. Source: Cointelegraph/TradingView
DXY, which measures dollar strength against a basket of US trading-partner currencies, is typically inversely correlated with crypto markets. Ongoing strength in the index thus poses a threat to broader upside in crypto and risk assets.
“Breaking the big 100 level while being supported by its Daily 200MA/EMA,” trader Daan Crypto Trades summarized in a post on X at the weekend, referring to the 200-day simple (SMA) and exponential (EMA) moving averages.
“If this ends up holding above 100, it would put some pressure on risk assets. So it’s good to watch.”
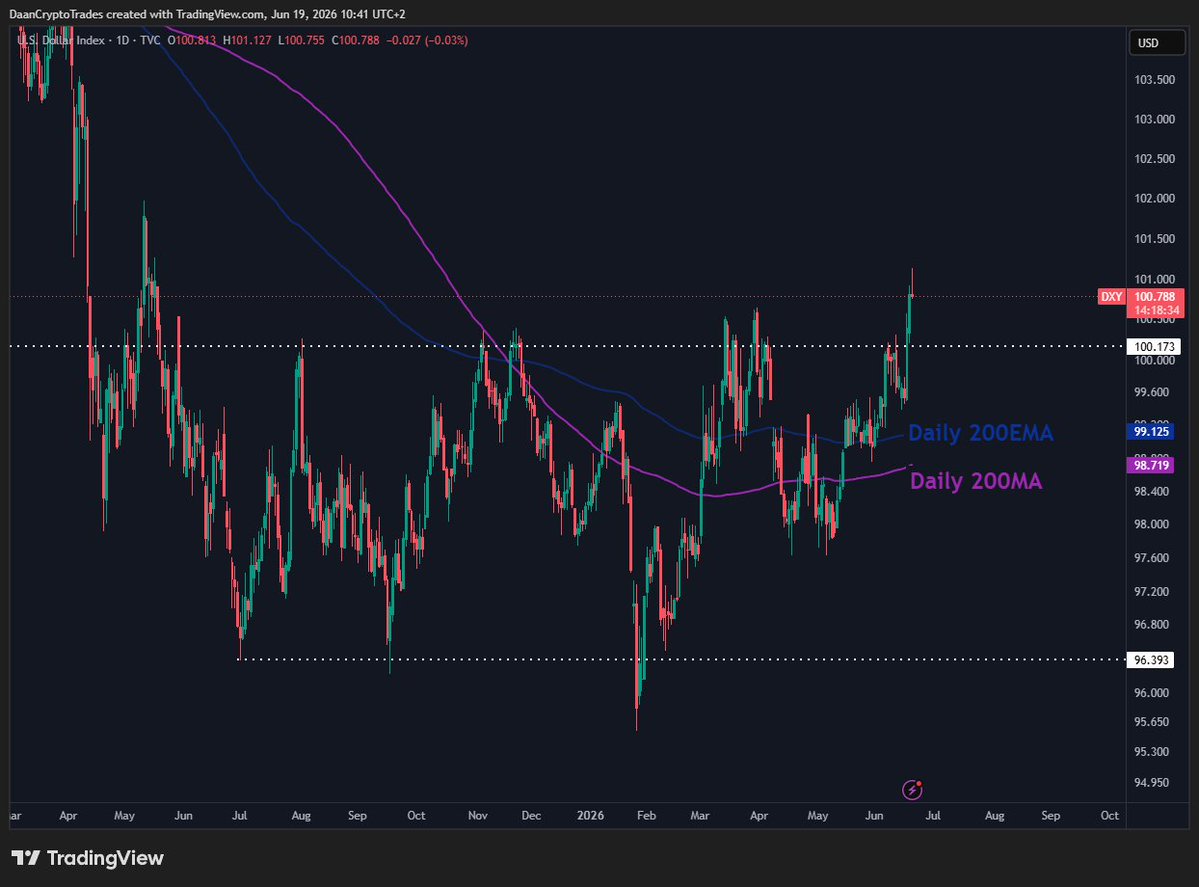
US dollar index (DXY) one-day chart. Source: Daan Crypto Trades/X
Trader Benjamin Cowen saw an ongoing DXY “bull case” into the latter half of 2026.
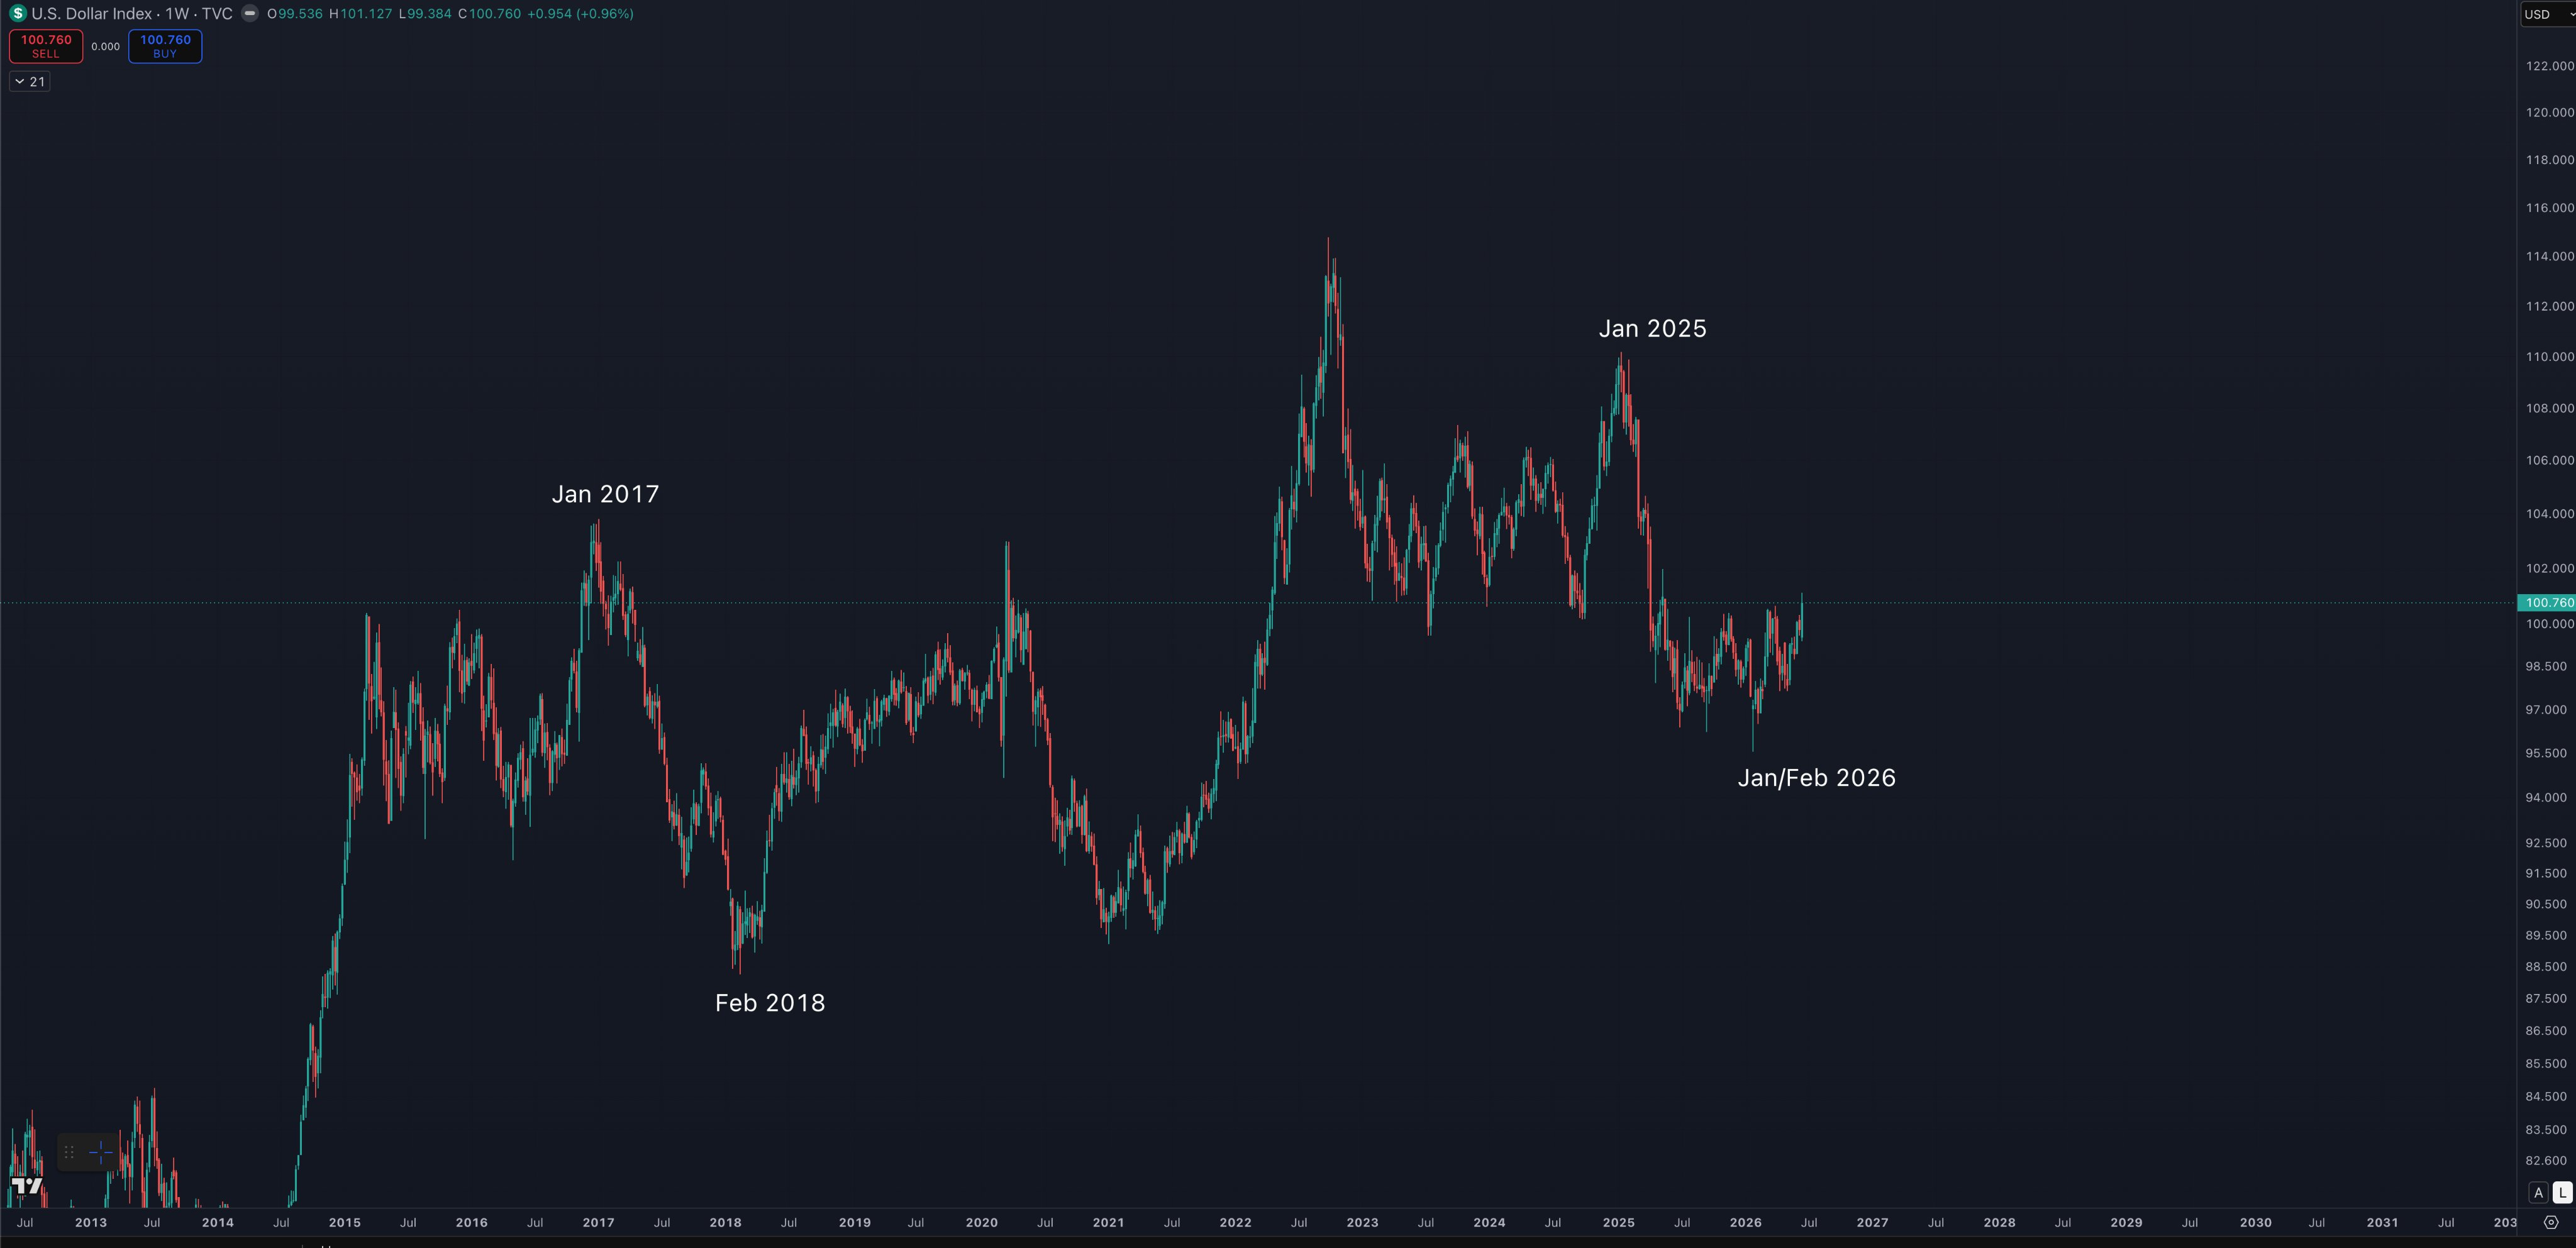
US dollar index (DXY) one-week chart. Source: Benjamin Cowen/X
“$DXY is currently testing the upper range of a megaphone aka broadening wedge pattern. If it breaks above this pattern instead of rejecting then that would be a pretty big upward target– somewhere around 106,” ColinTalksCrypto, creator of the YouTube channel of the same name, added.
“It would be bad for risk assets as well.”
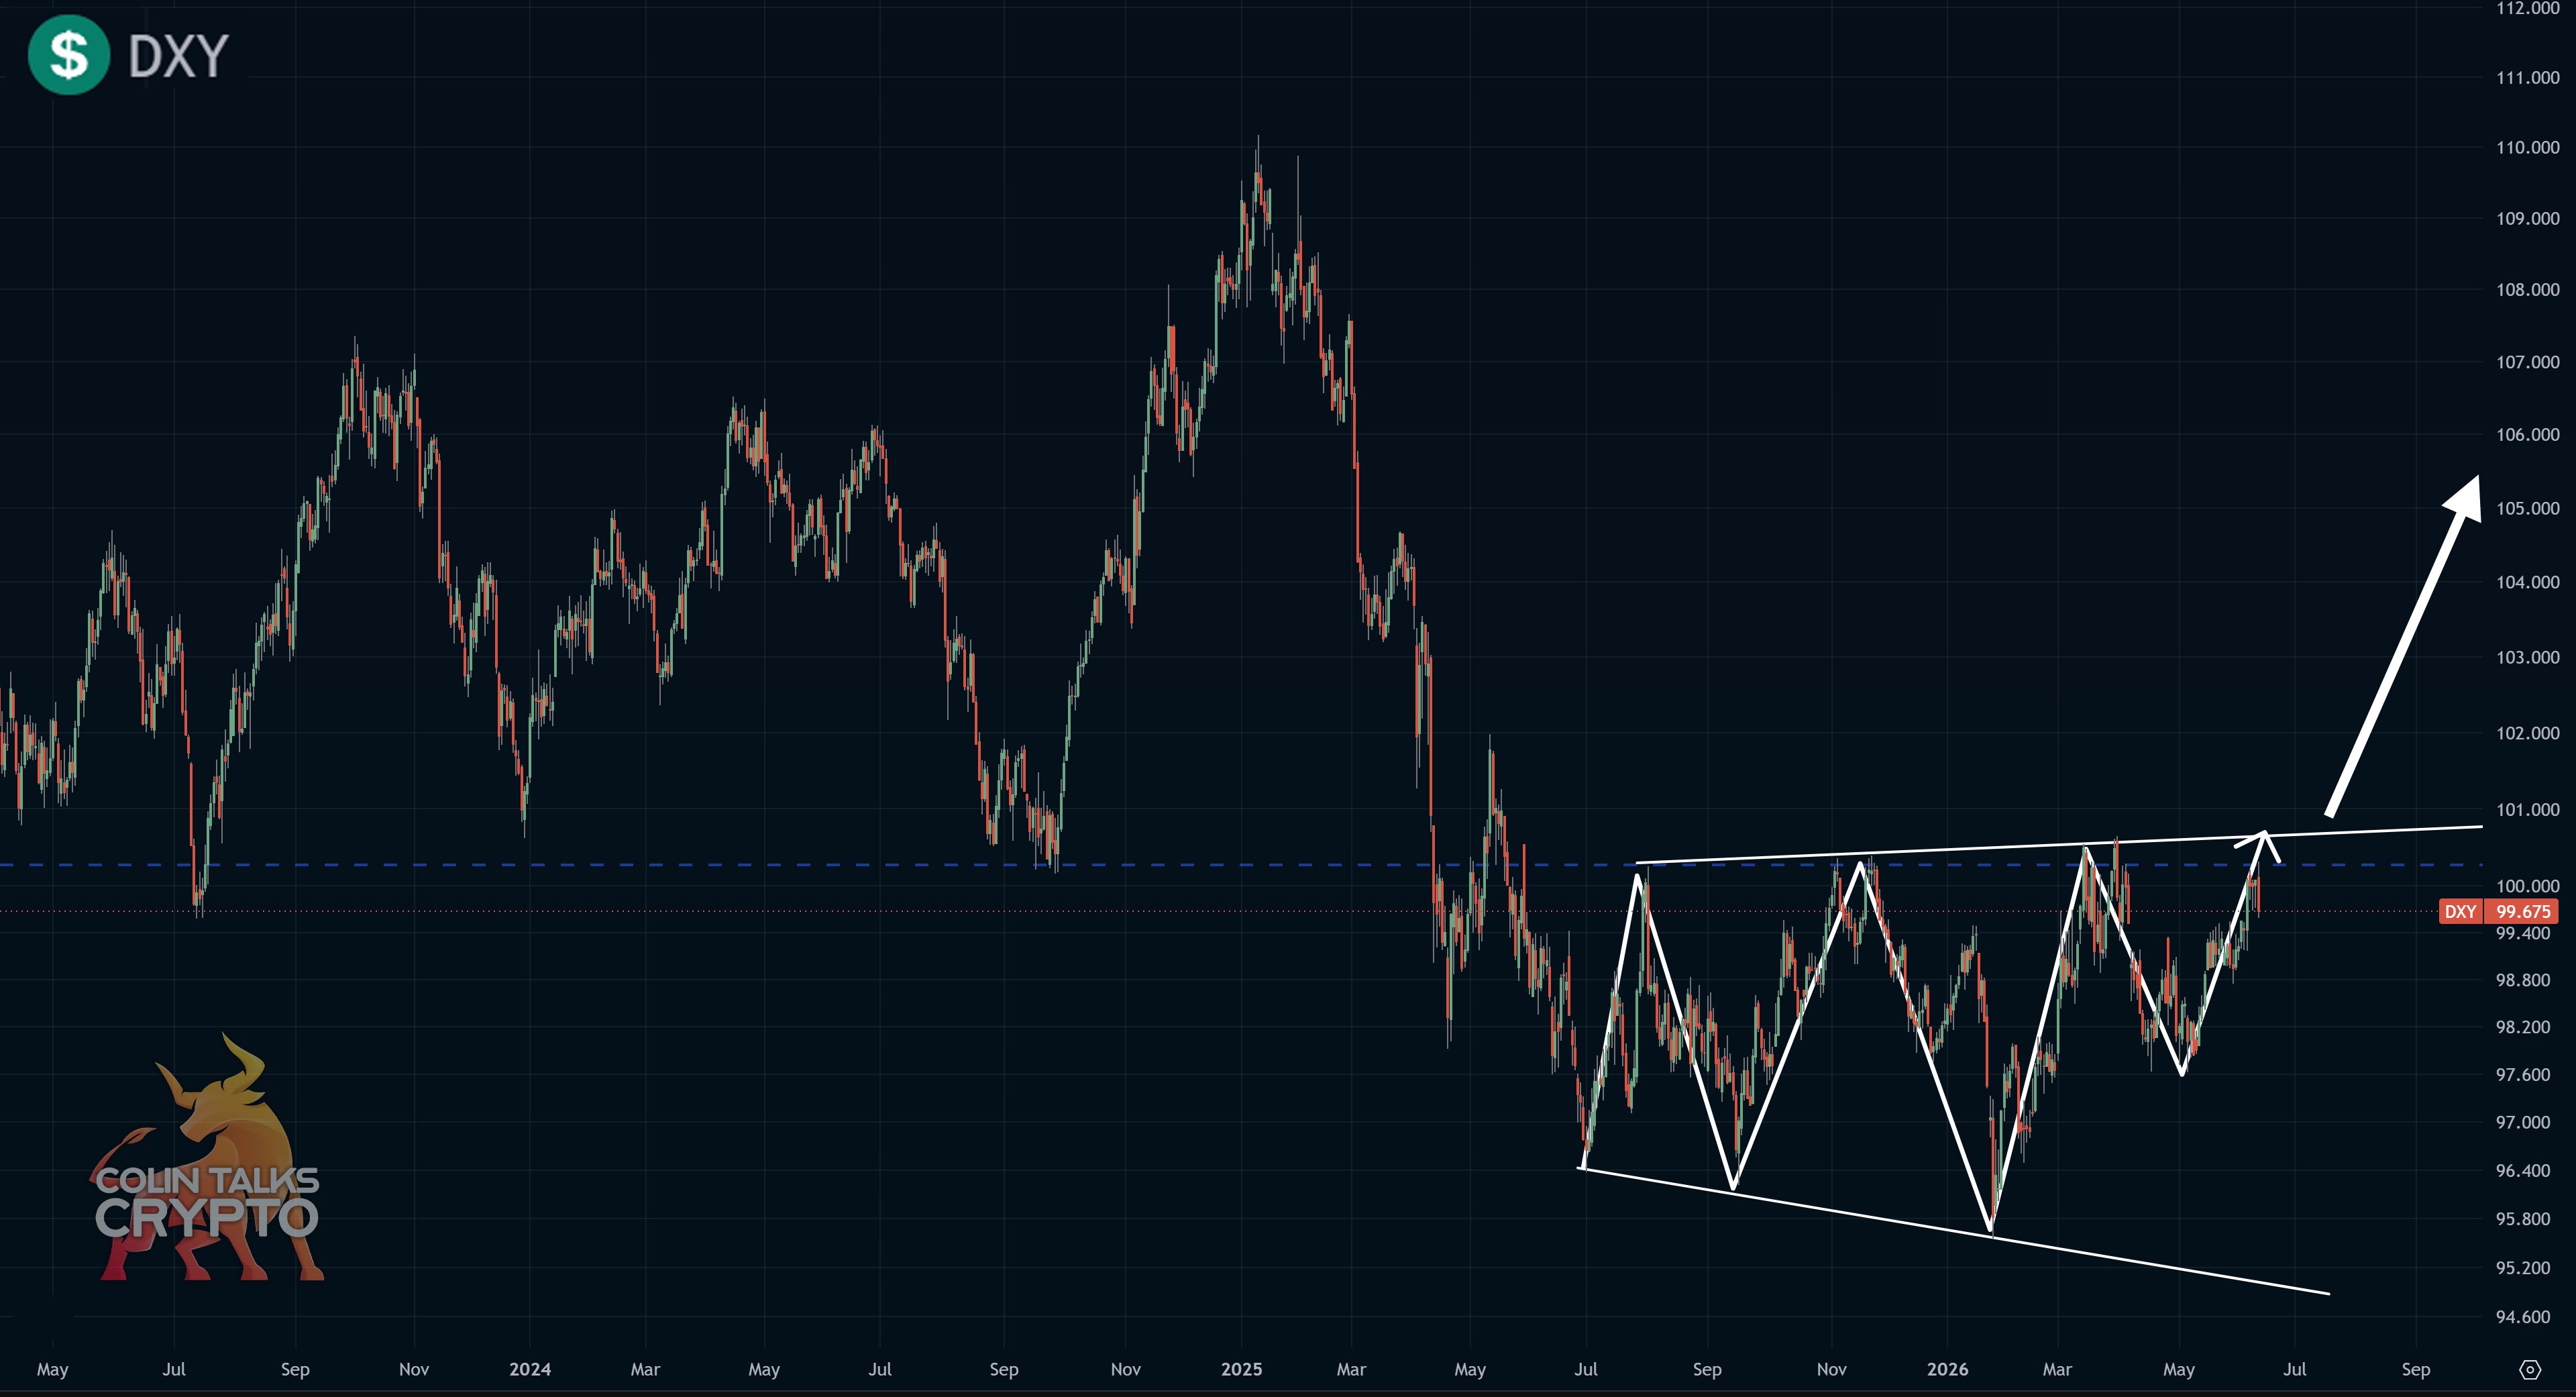
US dollar index (DXY) chart. Source: ColinTalksCrypto/X
Trader Aksel Kibar expected an “important week” for DXY, eyeing the end of a year-long period of consolidation.
Bitcoin continues to circle $64,000 following some brief volatility after the weekly close.
BTC price action eyes July benefits
In his latest market commentary, trader and analyst Rekt Capital had a silver lining for Bitcoin bulls.
Despite the BTC price weakness this month, the historical relationship between the months of June and July means that the pressure may soon ease.
“History suggests that whatever June does, July will do the opposite,” he told X followers this weekend.
“Therefore if June is red, July will likely be green.”
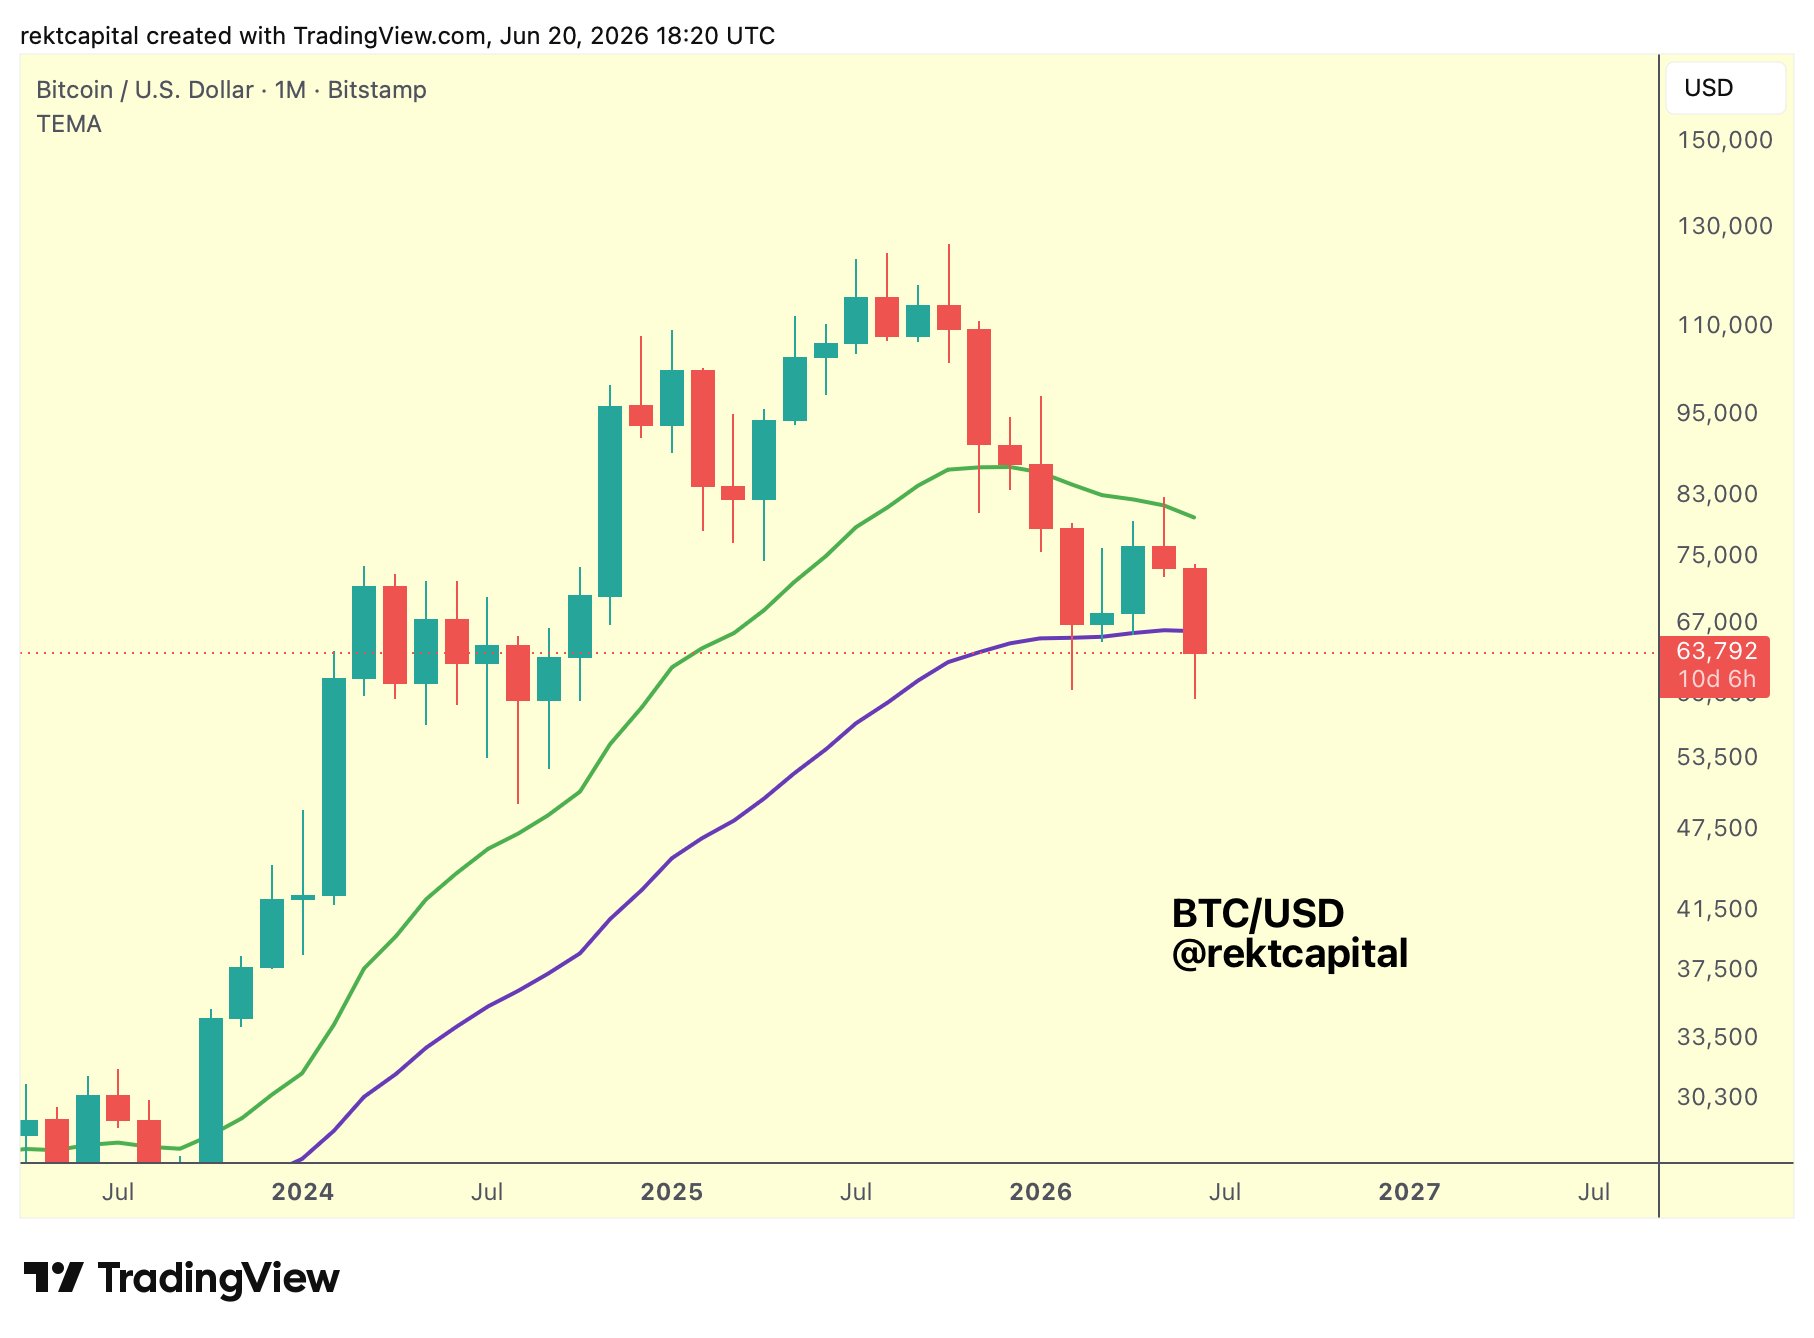
BTC/USD one-month chart with 21, 50EMA. Source: Rekt Capital/X
An accompanying chart showed BTC/USD acting in a range bordered by its 21-month and 50-month EMAs.
“So if June ends the month like this, it will confirm a loss of the 50-Month EMA as support. And so July will likely relief rally to turn the EMA into new resistance,” Rekt Capital added.
That implies that in future, bulls will have to contend with a fresh round of BTC price downside. Earlier, Rekt Capital suggested that the bear market should continue for some months to come, once again based on historical tendencies.
“History suggests there’s still time left and a bit more downside to go,” he reiterated on X while comparing previous bear markets.
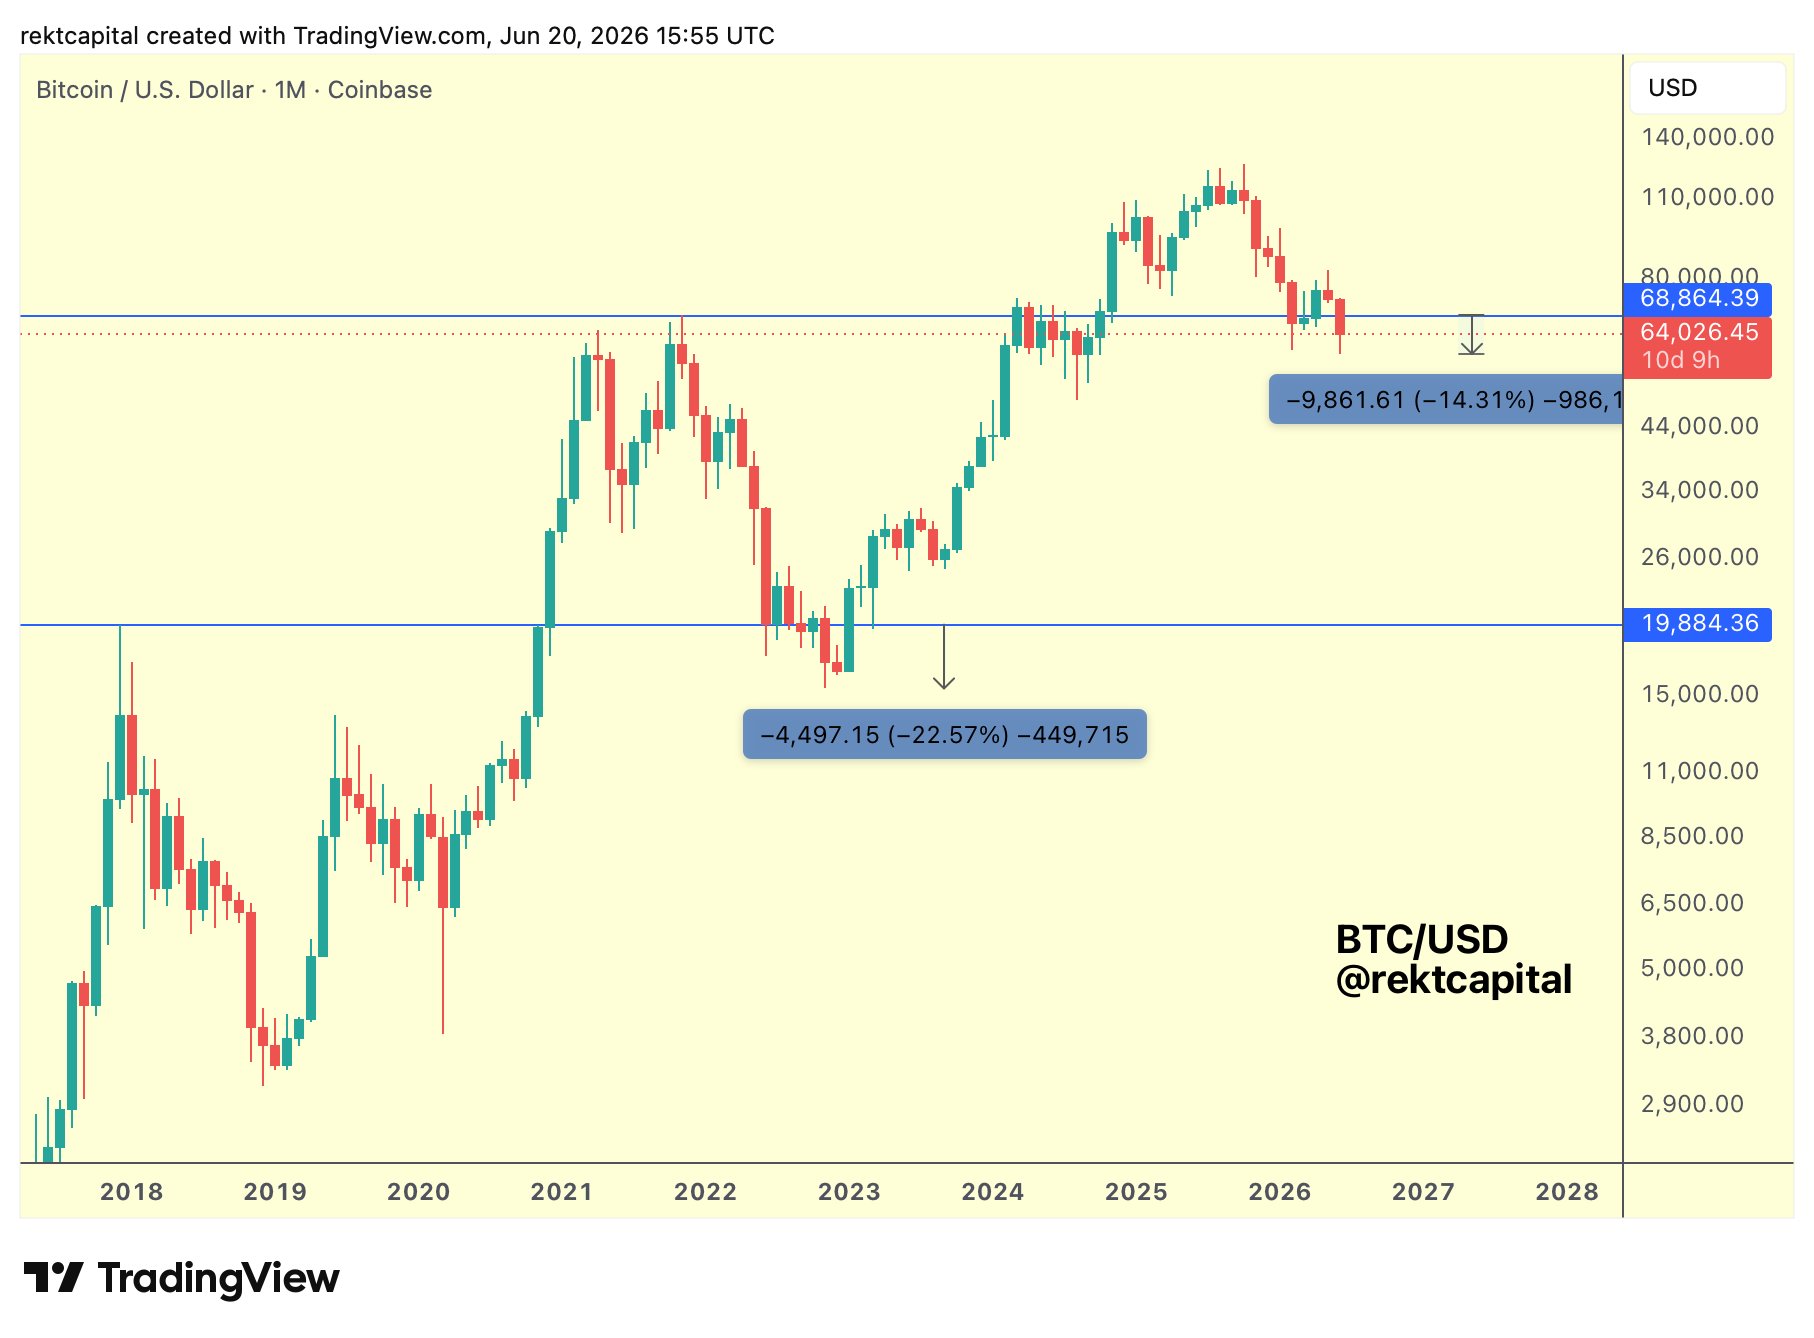
BTC/USD one-month chart. Source: Rekt Capital/X
PCE data due with US-Iran peace under pressure
Inflation remains the firm focus for markets this week as the US Federal Reserve’s “preferred” yardstick leads the macro data releases.
The May print of the Personal Consumption Expenditures (PCE) index is due out on Thursday.
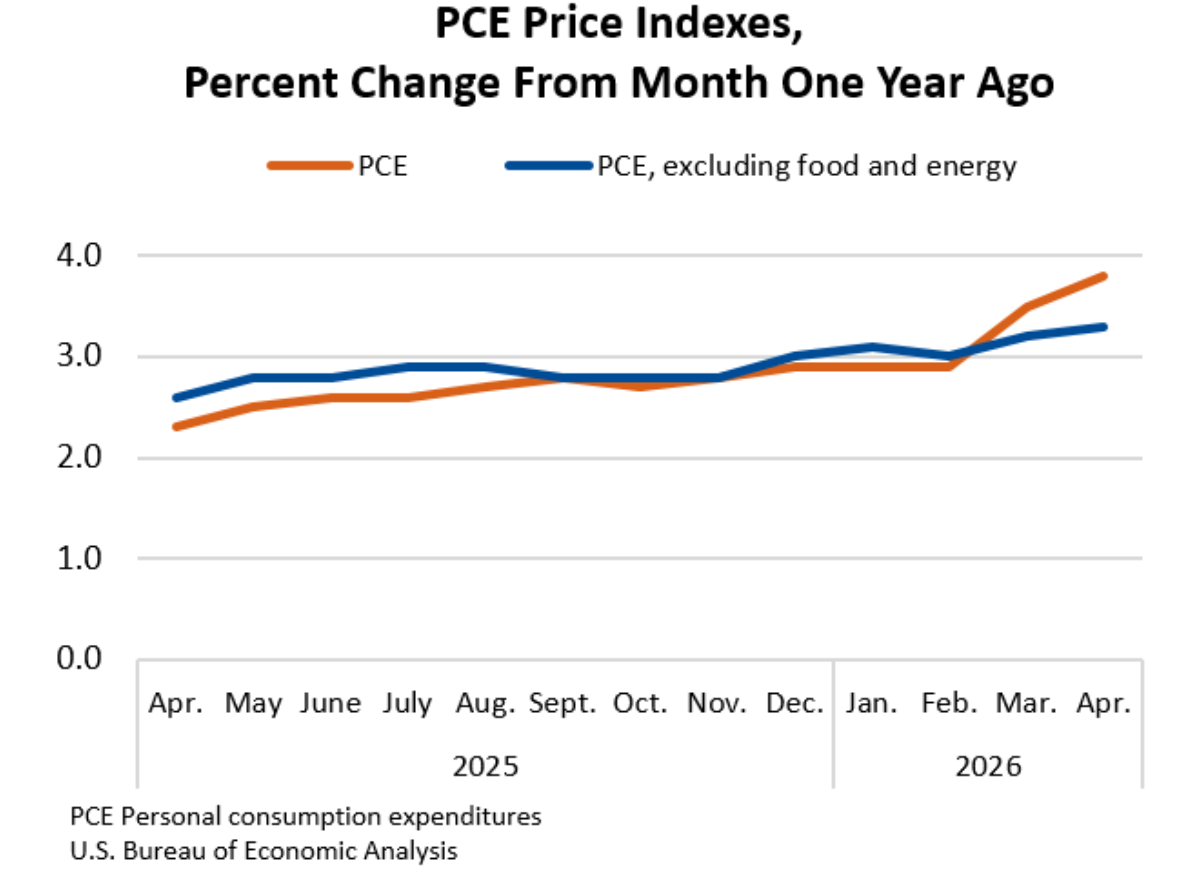
US PCE index % change (screenshot). Source: US Bureau of Economic Analysis
April saw PCE hitting three-year highs, reflecting the ongoing impact of the US-Iran war on inflation trends.
“While investors are hoping that the deal between the U.S. and Iran and corresponding pullback in oil prices will temper inflation, price pressures are spreading beyond energy,” trading resource Mosaic Asset Company wrote in the latest edition of its regular newsletter, The Market Mosaic.
“That’s because multiple catalysts are coming together at the same time to drive a jump in inflation.”
Mosaic highlighted “large” federal budget deficits and supply-chain issues contributing to cost upside.
“Cost increases from energy prices and upheaval following last year’s trade war are likely playing a key role,” it added alongside a chart of Producer Price Index (PPI) data.
“You can see that supply chain pressures tends to lead changes in producer prices.”
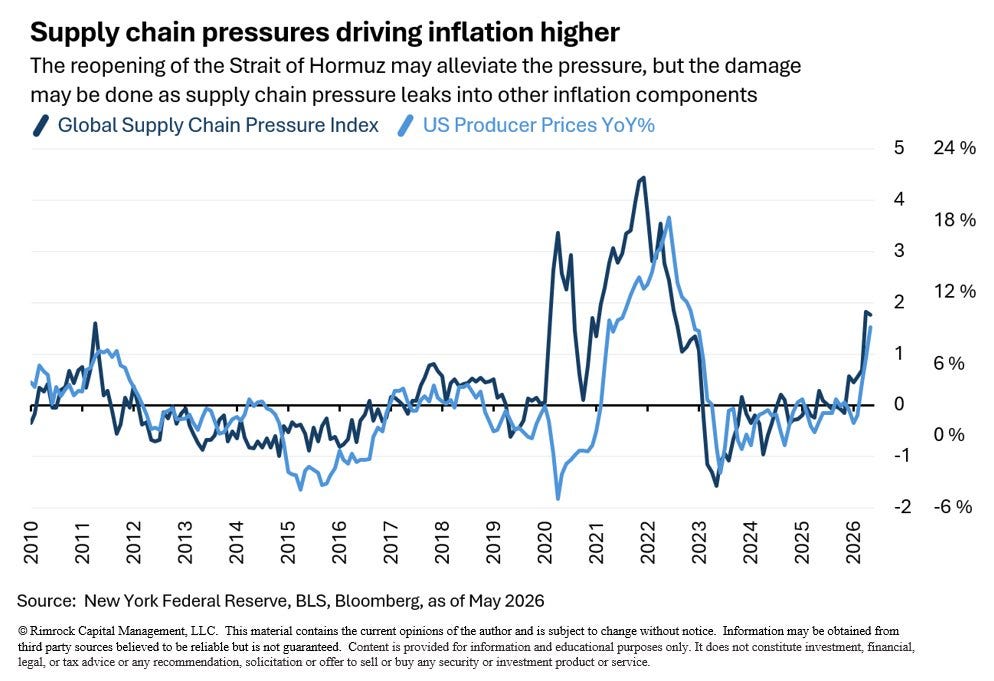
Global supply-chain and PPI data. Source: Mosaic Asset Company
Higher inflation means ostensibly less chance of the Fed cutting interest rates, which in turn creates a headwind for crypto and risk assets. As Cointelegraph reported, markets even see the Fed hiking rates before the end of the year.
The latest data from CME Group’s FedWatch Tool puts the odds of a hike at the Fed’s next meeting in late July at around 36%.
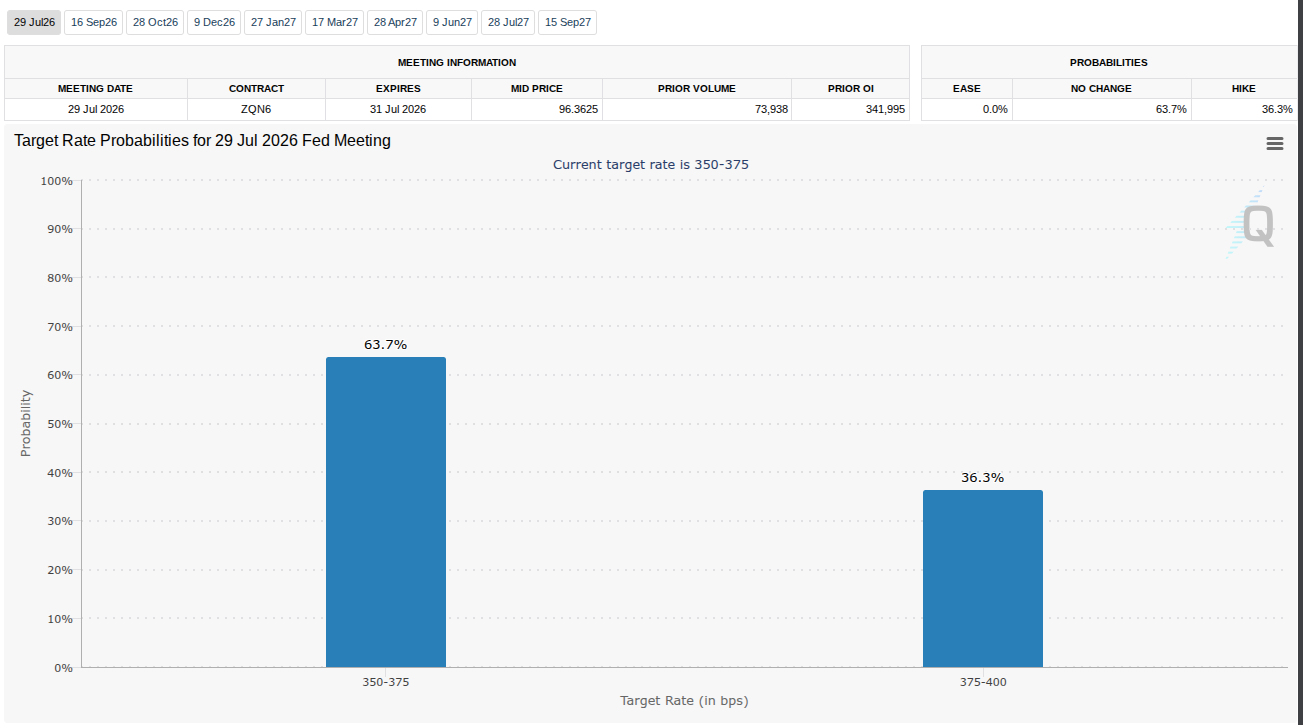
Fed target rate probabilities for July 29 FOMC meeting (screenshot). Source: CME Group
“Concerns over persistently high inflation isn’t the only reason for the Fed to consider hiking interest rates. Recent economic data has been surprising to the upside as well,” Mosaic noted.
Beyond PCE, Thursday will also see revised Q1 GDP data and initial jobless claims.
Oil helps preserve $60,000 support odds
The US-Iran peace deal, despite already showing signs of strain, has had a lasting impact on oil prices.
As the two parties signed it, US WTI crude fell to $73 per barrel, its lowest level since early March and nearly 40% below its local peak.
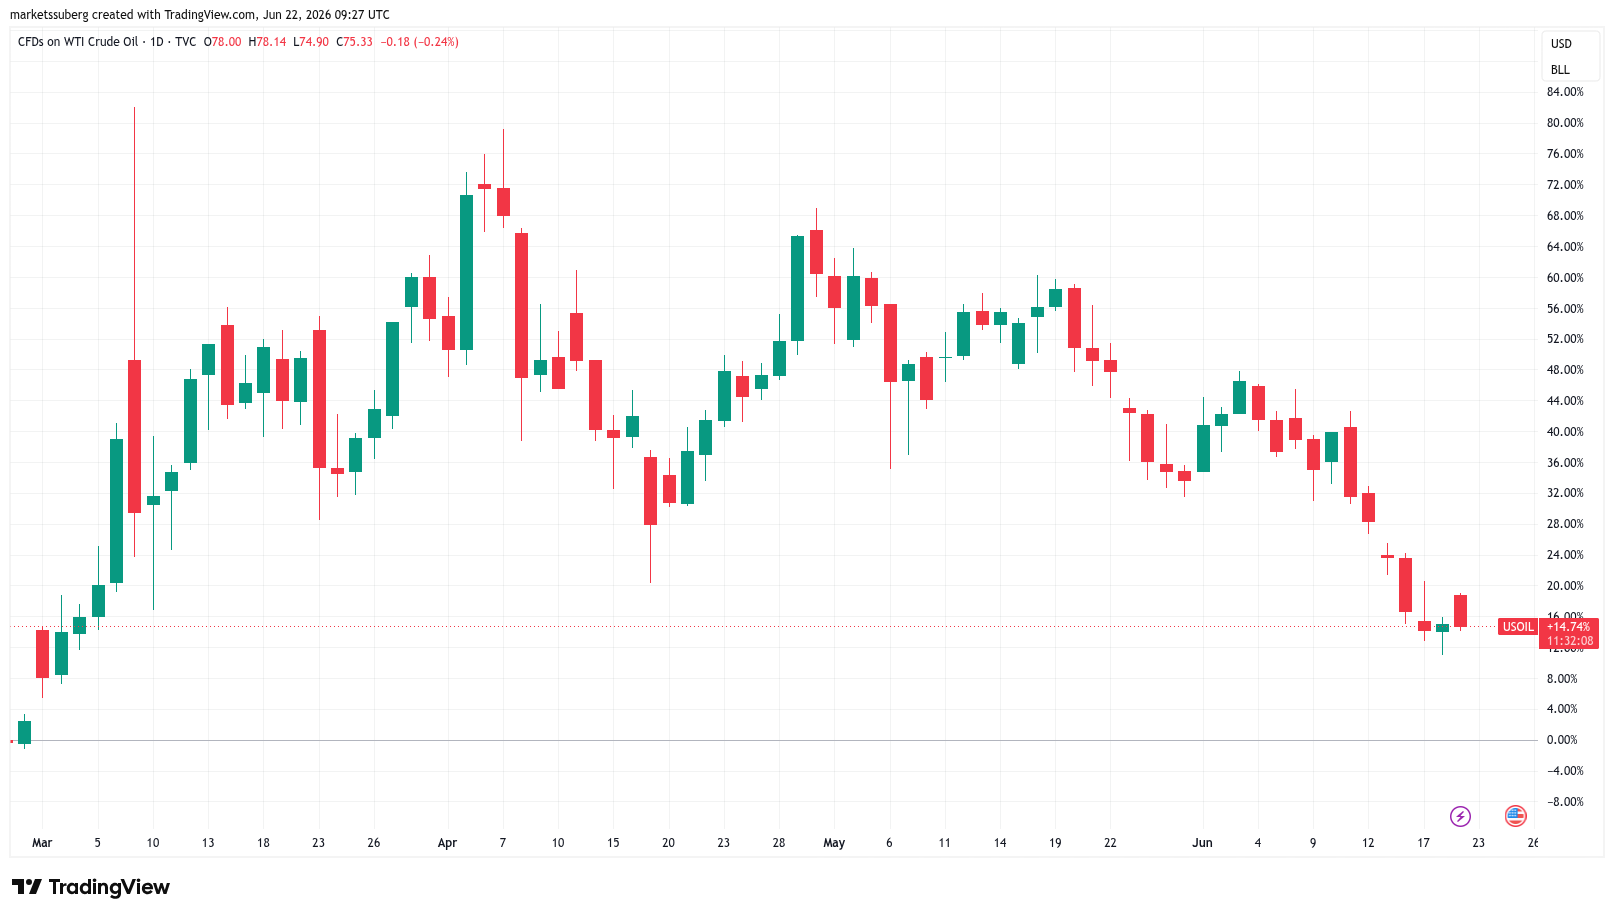
CFDs on US WTI crude oil one-day chart. Source: Cointelegraph/TradingView
Bitcoin has had a broadly inverse correlation to oil. Recent weeks have shown a different relationship in play as risk assets climb, while the peace deal still offers a step up to the mid-$60,000 zone.
Onchain analytics platform Glassnode believes that based on oil’s latest moves, there should be cause for Bitcoin bulls to relax in the short term.
“Bitcoin rallied, and also gold rallied,” it said in a video analysis late last week, adding that accumulation trends were helping support $60,000 as a local bottom.
Glassnode described “decent” buying-up of the supply at the lows.
“I believe there’s a chance that this may be a durable bottom, at least to a certain extent — maybe not the absolute bottom, but I think there’s a decent chance that that $60,000 level will be defended by quite a few different cohorts here,” it concluded.
Bitcoin speculators turn “emotional”
As Cointelegraph reported, largest global exchange Binance has been on the radar in recent days thanks to conspicuous Bitcoin selling pressure.
Related: Bitcoin market cap rebound to take ‘5-10 years’ after dropping 10 places since mid-2025
In its latest research, onchain analytics platform CryptoQuant sheds light on the scale of the offload, which notably involves newer investors.
“Once again, it was the STHs who suffered the most from this correction and reacted most sharply,” contributor Darkfost wrote on Sunday.
Darkfost referred to short-term holders (STHs) — investors hodling coins for up to six months. BTC/USD dropping back to February lows, which versus its May peak represented a drop of nearly 30%, resulted in an “emotional” response from the cohort.
“During the month of June, STH inflows on Binance exceeded 80,000 BTC over 7 days, representing approximately $5B in selling pressure,” he reported.
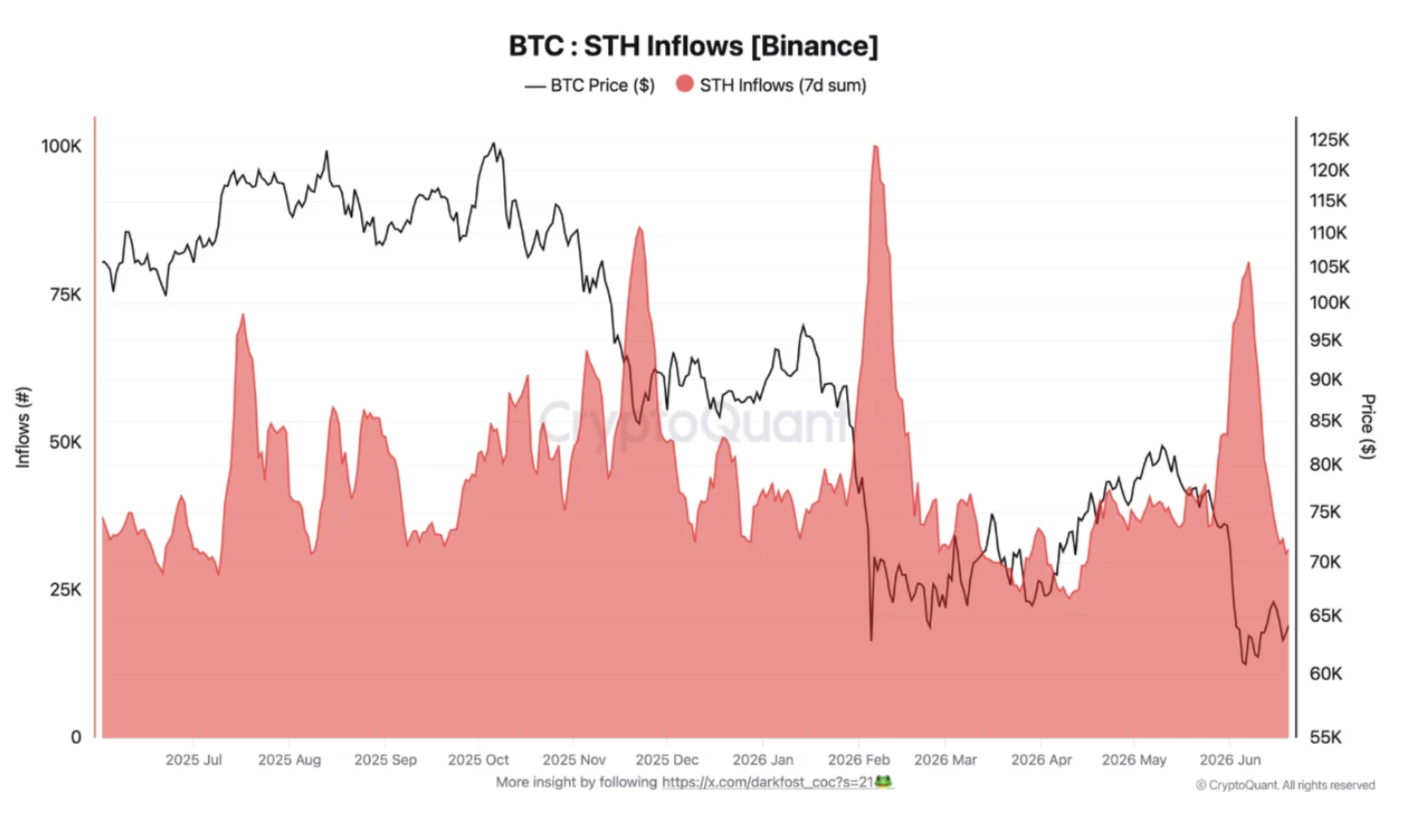
Bitcoin STH inflows (screenshot). Source: CryptoQuant
The impact of the selling has yet to be reflected in the actions of large-volume investors, who remain nonchalant in the current price range. Analyzing the profitability of older and newer Bitcoin whales, CryptoQuant contributor CryptoZeno suggested that the market has found a form of equilibrium.
“The gap between long-term and short-term whale profitability highlights a market transitioning through consolidation rather than capitulation,” they summarized.
“Long-term whales continue to hold positions despite reduced gains, while short-term whales remain largely neutral. This combination often reflects a period of market stabilization where speculative excess is gradually removed from the system.”
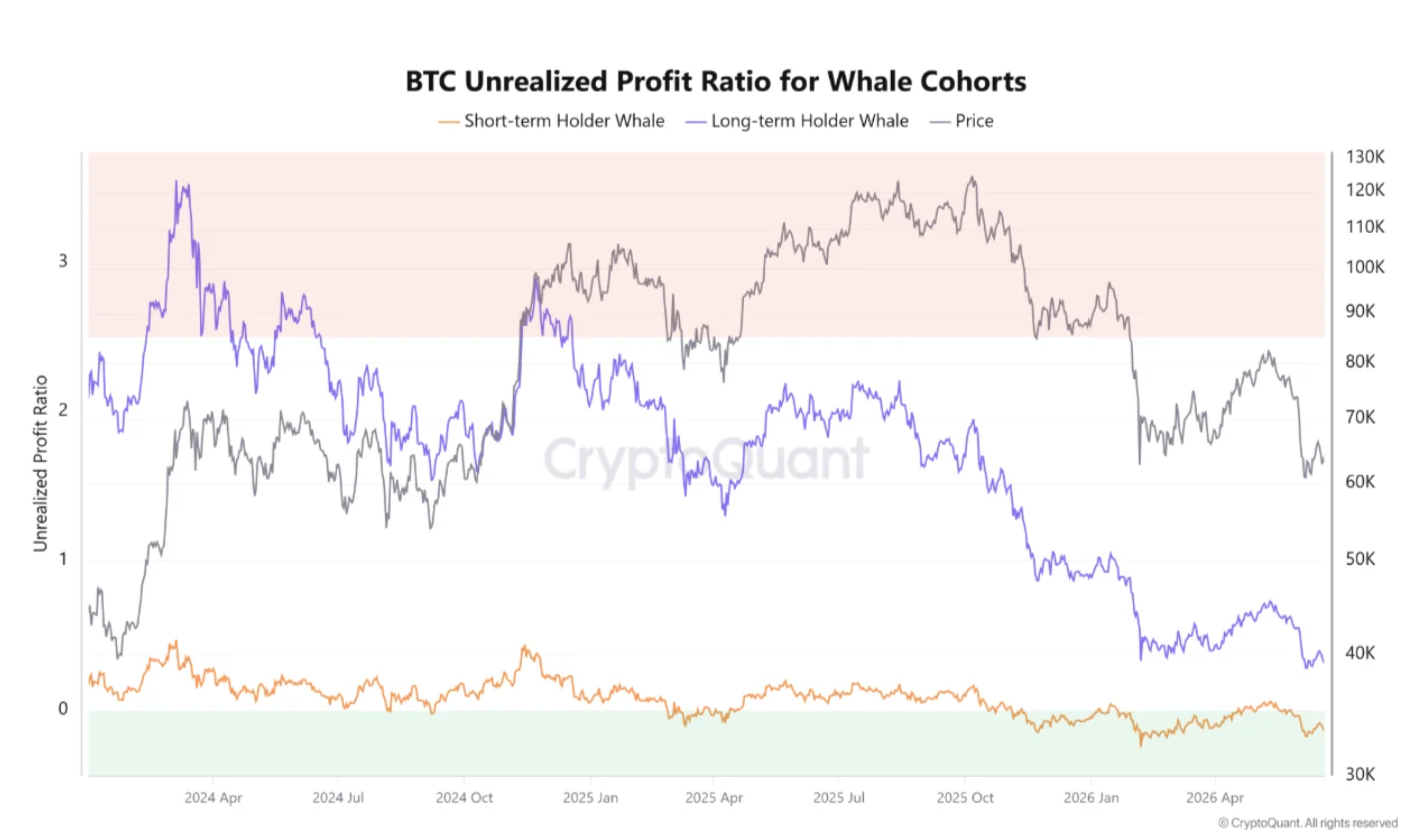
Bitcoin whale unrealized profit ratio (screenshot). Source: CryptoQuant
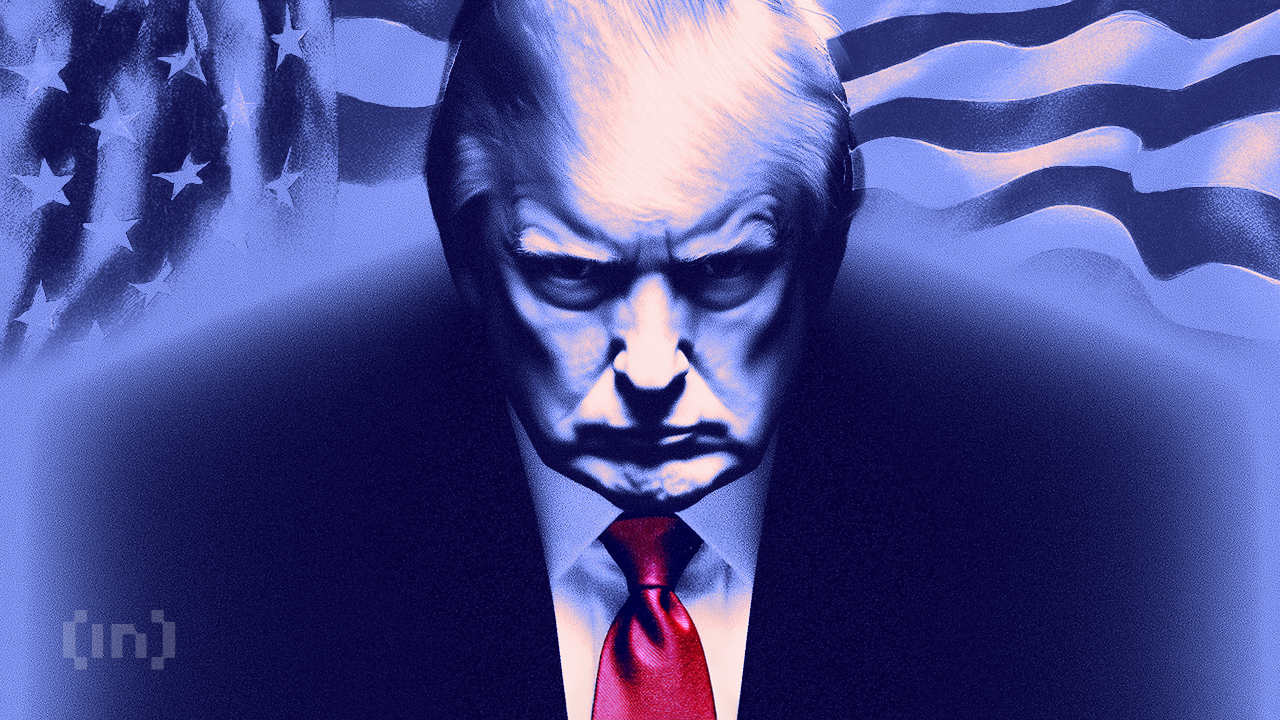

UK Prime Minister Keir Starmer resigned today. He stepped down as both party leader and head of government after Labour MPs staged an open revolt against his leadership.
Trump had predicted the move just one day earlier. In a Truth Social post Saturday, he said Starmer had failed badly on energy and immigration. He then demanded the UK open North Sea oil.
Starmer Resigns After Labour Party Revolt
Starmer’s fall ends a tenure that began with a historic Labour landslide in 2024. Since then, the party lost more than 1,000 council seats in May’s local elections. Around 100 Labour MPs formally wrote to Starmer, asking him to step down.
Welfare reform proposals added to the internal friction. So did the appointment of Peter Mandelson as US ambassador. His links to the late Jeffrey Epstein drew sharp criticism from MPs and deepened divisions inside the cabinet.
Starmer confirmed the news through his personal X account Monday morning. He said he would set out a departure timetable and begin a formal Labour leadership contest.
North Sea Ban Seen as Keir Starmer’s Biggest Miscalculation
In November 2025, the UK banned all new North Sea oil and gas exploration licenses. That made it the largest economy to take that step. Supporters framed the move as a clean energy commitment. However, critics warned it left Britain exposed to any commodity shock.
The Iran conflict that began in early 2026 sent Brent crude from around $73 a barrel to nearly $114. Ofgem then confirmed a 13% rise in household energy bills from July. The average annual bill climbed from £1,641 to £1,862.
Oxford’s Smith School found that full North Sea output would have cut bills by only £16 to £82 annually. In other words, oil trades at global prices regardless of origin.
Trump had flagged the same vulnerabilities in May 2026, citing failures on energy and immigration. His June 21 Truth Social post removed any ambiguity about Starmer’s political fate.
What Comes Next for UK Leadership
Meanwhile, Andy Burnham won the Makerfield by-election last week with 54.8% of the vote. He is the clear frontrunner to replace Starmer as Labour leader. Burnham openly backs digital assets and told Web3 founders he wants Manchester to lead the crypto sector.
His stance clashes with current Labour party policy. Starmer’s government placed a moratorium on crypto donations to political parties in March 2026. UK crypto voters will closely watch how Burnham shapes that policy if he wins the leadership race.
Prediction markets have moved sharply in Burnham’s favor. The US-Iran oil shock that accelerated Starmer’s resignation now poses the first major fiscal test for whoever leads Labour next.
The post Keir Starmer Resigns After Trump Predicted UK Leadership Departure appeared first on BeInCrypto.
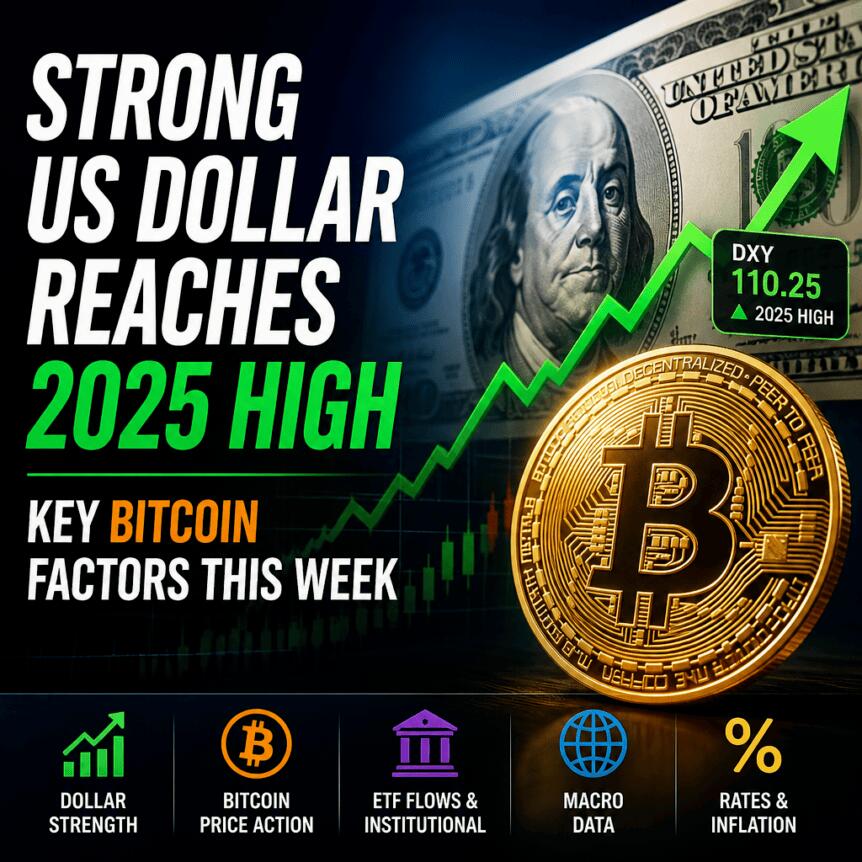
Bitcoin is starting the week around $64,000, as traders weigh fresh macro catalysts and renewed pressure from a strengthening US dollar. While some market participants are preparing for volatility around upcoming US economic releases, others are pointing to historical seasonal patterns and on-chain evidence that suggests key levels may still attract steady demand.
The near-term narrative is being shaped by two competing forces: a potential risk headwind from the dollar index (DXY) and a counterweight from markets watching oil and inflation data as geopolitical developments evolve.
Key takeaways
- The US dollar index is back above 100, and several traders warn that sustained strength in DXY typically weighs on risk assets, including crypto.
- Market commentary highlights a seasonal tendency for July to move opposite to June, which some see as a potential setup for a relief rally.
- PCE inflation data due this week is a key test for expectations around Federal Reserve rate cuts, with markets also pricing a non-trivial chance of a July hike.
- Oil’s reaction to a US-Iran peace effort has fed into a more supportive outlook around the $60,000 area, according to on-chain analysis.
- CryptoQuant data suggests short-term holders have been selling heavily on exchanges, but large “whale” behavior has not shifted toward capitulation at current levels.
Dollar strength returns as the dominant macro risk
A familiar headwind for Bitcoin is back in focus: the US dollar. The DXY has climbed above 100 and reached levels not seen for more than a year, according to TradingView data cited in trader commentary.
Because the dollar index often trades inversely to crypto risk sentiment, persistent DXY strength can limit the upside for Bitcoin and other risk assets. Trader Daan Crypto Trades, commenting on weekend price action, said DXY was breaking the “big 100 level” while staying supported by long-term moving averages on the daily chart, based on references to the 200-day simple and exponential moving averages.
“If this ends up holding above 100, it would put some pressure on risk assets. So it’s good to watch.”
Other analysts similarly framed the next moves in the dollar as a determining factor for broader market direction. ColinTalksCrypto, for example, discussed the possibility of DXY extending higher if it clears an upper range tied to a widening wedge pattern, which they suggested could point toward the 106 area. Benjamin Cowen also noted an ongoing “bull case” for the dollar into the latter half of 2026.
For Bitcoin traders, the takeaway is straightforward: even if crypto has its own internal drivers, the next leg higher may be harder if DXY continues to hold above key levels.
Seasonal setup: why some bulls are watching the June-to-July swing
While macro factors are still likely to dominate short-term price action, some traders are also pointing to historical seasonality. Rekt Capital argued that the relationship between June and July has often played out in an “opposite” direction for Bitcoin.
“History suggests that whatever June does, July will do the opposite,” Rekt Capital told X followers. The accompanying chart in the same commentary focused on BTC/USD trading within a range defined by longer-term exponential moving averages.
In that framework, a June close that confirms a loss of the 50-month EMA as support could lead to July acting as a “relief” period—potentially pushing the market back up to that moving average area, where it could then become resistance instead of support. Earlier, Rekt Capital had also suggested that bear-market conditions could persist for several months, again based on historical tendencies.
Even for traders who focus on technical and seasonal patterns, the context matters: seasonality is not a guarantee, and it can be overridden when macro data or liquidity conditions shift rapidly. Still, it provides a concrete lens for how bulls are positioning expectations for the coming month.
PCE and the rate question: inflation data in a tense geopolitical backdrop
Inflation is the central macro theme for the week. The US Personal Consumption Expenditures (PCE) index for May is due out on Thursday, and it is likely to influence expectations for Federal Reserve policy.
The article ties the current inflation debate to the broader impact of the US-Iran conflict on prices. As context, it notes that April’s PCE print reflected three-year highs, and it points to hopes that an eventual deal—and a corresponding pullback in oil—could reduce inflation pressure.
However, Mosaic Asset Company’s regular newsletter, “The Market Mosaic,” argued that inflation risks are not confined to energy. It said investors are expecting a tempering effect from oil, but that price pressures have been spreading beyond energy. Mosaic also pointed to large federal budget deficits and supply-chain issues as additional contributors to cost upside, citing producer price dynamics as evidence that supply-chain pressures tend to lead changes in producer prices.
Why this matters for Bitcoin is the link between inflation prints and the probability of rate cuts. Higher inflation typically reduces the likelihood of the Fed easing policy, which can weigh on crypto and other interest-rate-sensitive assets. Cointelegraph previously reported that markets even price the possibility of a rate hike before the end of the year, and CME Group’s FedWatch Tool put the odds of a hike at the Fed’s next late-July meeting (July 29) at roughly 36%.
Beyond PCE, Thursday’s calendar also includes revised Q1 GDP data and initial jobless claims, which could further shape the policy outlook—and therefore liquidity expectations for risk assets.
Oil’s move and on-chain signals: defending the $60,000 zone
Geopolitics is also feeding into commodity markets, and that connection has become part of the Bitcoin debate. The article notes that after the US-Iran peace deal was signed, US WTI crude fell to about $73 per barrel—its lowest level since early March and around 40% below a local peak.
Historically, Bitcoin has often shown an inverse correlation to oil. Yet the piece says recent weeks have shown a more complex relationship, with risk assets rising while the geopolitical deal still supports the mid-$60,000 area.
Glassnode argued that oil’s latest movement provides room for Bitcoin bulls to “relax” in the short term. In a video analysis posted on X, Glassnode said that both Bitcoin and gold rallied, and it pointed to accumulation trends helping support $60,000 as a local bottom. Glassnode described “decent” buying of supply at lower levels and said there is a chance the $60,000 area could hold as a durable bottom for at least some time, even if it may not represent the absolute bottom.
This matters to traders because it frames a key level not just as a chart artifact, but as a zone where on-chain supply dynamics suggest buyers have been willing to step in.
Exchange selling looks “emotional,” but whales aren’t capitulating
While macro pressures and historical patterns guide expectations, flow data helps explain how the market is actually absorbing drawdowns. The article points to CryptoQuant research examining selling pressure visible on Binance, noting that the offload appears to involve newer investors.
CryptoQuant contributor Darkfost wrote that short-term holders (STHs)—investors holding for up to six months—reacted most strongly to the correction. The piece states that during June, STH inflows on Binance exceeded 80,000 BTC over seven days, which Darkfost estimated at roughly $5 billion in selling pressure. It also describes Bitcoin’s drop back toward February lows, relative to its May peak, as a nearly 30% decline that helped trigger this “emotional” response.
Yet the selling impact has not fully translated into behavior from larger “whale” holders. CryptoQuant contributor CryptoZeno suggested the market has moved into consolidation rather than full capitulation by comparing profitability metrics across older and newer whale categories.
“Long-term whales continue to hold positions despite reduced gains, while short-term whales remain largely neutral. This combination often reflects a period of market stabilization where speculative excess is gradually removed from the system.”
For investors, the practical implication is that heavy exchange-related selling can coexist with stability in larger holdings—meaning the downside may be more likely to consolidate around demand zones than to spiral into a straight-line liquidation event.
Going forward, traders will likely focus on whether DXY can hold above 100 without extending higher, and how Thursday’s PCE inflation print reshapes Fed expectations for the rest of the month. The durability of the $60,000 area may also depend on whether on-chain support persists as short-term holders either pause selling or look to re-enter at lower prices.

‘Tutor’ Who Took Online Tests for 124 Students Jailed for Three Years

France sizzles in record temperatures

Aussie shares edge lower as WiseTech leads IT sell-off


-
 Tech6 days ago
The Adder At The Heart Of Intel’s 8087 FPU
-

 Fashion3 days ago
Weekend Open Thread: Miami – Corporette.com
-

 Entertainment2 days ago
Renter of Home in Anne Heche Crash Denies Settlement With Son
-

 Business2 days ago
Soccer-U.S. defends Iran World Cup travel restrictions, says discussions ongoing
-
 Business2 days ago
Wall Street Week Ahead: Investors see Micron earnings as pulse check of AI rally momentum
-
 Politics4 days ago
BBC Reporter Discusses Cross Party Criticism Of Trumps Iran Deal
-

 Crypto World2 days ago
HIVE shares jump as $220M AI deal speeds Bitcoin mining pivot
-

 Sports3 days ago
FIFA World Cup 2026: Canada beat 9-men Qatar 6-0 to register first ever win | FIFA World Cup 2026
-

 Crypto World2 days ago
Jake Chervinsky accuses CME of protecting derivatives monopoly
-
 Crypto World2 days ago
Can Charles Hoskinson Really Rescue Cardano?
-

 Business2 days ago
MHP SE 2026 Q1 – Results – Earnings Call Presentation (OTCMKTS:MHPSY) 2026-06-20
-

 Crypto World4 days ago
Anthropic’s Dario Amodei Urged AI Unity at G7, Even as US Banned His Models
-

 Business3 days ago
Brexit cost 6% of UK economy, Bank of England company data suggests
-

 Crypto World6 days ago
Robinhood opens AI-powered trading to all users, sending HOOD stock past $100
-

 Tech5 days ago
Weeks Of In-The-Field Testing And A Verdict
-

 Politics2 days ago
Andy Burnham and the meaning of Makerfield
-

 Tech4 days ago
Adobe adds its AI assistant to Premiere, Illustrator and InDesign
-
 Crypto World4 days ago
Iren (IREN) Stock Surges on Jefferies Buy Rating: AI Infrastructure Play Gains Momentum
-

 Tech3 days ago
Instagram Now Lets You Add A Unique Caption To Each Carousel Slide
-

 Crypto World5 days ago
Coinbase Stakes Out Brokerage Territory With SEC-Registered AI Advisor and Stock Options Push
You must be logged in to post a comment Login