

Crypto World
What led to Mark Cuban’s viral Bitcoin dump?



Mark Cuban has dumped most of his Bitcoin, calling it “not the hedge I expected” as the Iran war and dollar volatility exposed what he sees as a failed safe haven narrative.
Summary
Billionaire investor Mark Cuban has revealed he sold the majority of his Bitcoin holdings, declaring that the flagship cryptocurrency “has lost the plot” and “is not the hedge I expected” against war and inflation.
Speaking on the Portfolio Players podcast with Front Office Sports, Cuban said he offloaded roughly 80% of his BTC after watching gold rip to $5,000 during the U.S.–Iran conflict while Bitcoin dropped instead of behaving like “a better version of gold.”
“I always thought it was a better version of gold than gold,” Cuban said. “But gold just blew up and went to $5,000. Bitcoin dropped.”
“This might get some people upset,” he added. “I think Bitcoin has lost the plot.”
Cuban’s hedge thesis breaks, but the data fights back
Cuban framed his exit explicitly as a verdict on Bitcoin’s failure as a hedge during geopolitical stress and dollar weakness, pointing to the Iran war as the turning point. He argued that when “fiat is getting hit and there’s geopolitical turmoil,” Bitcoin should behave like a crisis asset, yet in his view “the hedging effect never materialized” while gold surged.
The timing is awkward. Since the start of the 2026 Iran war on February 28, Bitcoin has actually outperformed gold by roughly 35–36% on a relative basis, with BTC up about 7–10% while gold has been flat to down and the BTC/gold ratio has surged. separate analysis cited by Yahoo Finance noted that Bitcoin has gained more than 16% over the conflict period even as gold prices have declined by over 15%, undercutting Cuban’s claim that BTC “failed” as a hedge in aggregate.
At the time of Cuban’s comments, Bitcoin was trading near $77,500, down roughly 38% from its October 2025 all time high of $126,080 but still well above its pre war levels; gold, meanwhile, had pulled back to around $4,500 per ounce after briefly touching $5,000.
What about Bitcoin price
According to the Bitcoin (BTC) price page from crypto.news, BTC recently hovered in the mid $70,000s, reinforcing that the asset has recovered sharply from early conflict lows even if it remains below its peak.
Cuban’s own positioning underscores the reversal. Heading into 2026, he said his crypto portfolio was roughly 60% Bitcoin, 30% Ethereum and 10% other tokens, a structure he previously justified by calling BTC “a better store of value asset than gold.”
Now he says he still holds Ethereum for its “utility” while dismissing most altcoins as “junk,” effectively recasting Bitcoin as the disappointment in a portfolio he once described as anchored by BTC.
War, inflation and the safe haven narrative
The clash between Cuban’s experience and the data comes as the broader market reassesses what, exactly, Bitcoin hedges.
As crypto.news has previously reported in its coverage of how Bitcoin outperforms gold by roughly 36% since the Iran war began, BTC has behaved less like a classic “panic bid” asset and more like a high beta macro instrument that still managed to beat traditional havens over the war’s first months.
In its own report on Cuban’s remarks, crypto.news noted that “Bitcoin defenders” argue the billionaire cherry picked the worst window: BTC did sell off on initial Iran headlines, but from the first signs of conflict it has risen more than 16%, while gold has sagged.
Fortune similarly observed that “since the start of the war, the original cryptocurrency is up about 7%, and on Wednesday was trading at around $71,000,” even as gold drifted near $5,240 per ounce.
Cuban’s broader skepticism comes after years of vocal support, including a 2021 podcast appearance where he revealed that 60% of his crypto holdings were in Bitcoin and insisted he would “never sell it for anything” because it was superior to gold as a store of value.
With that stance now reversed, his sale has become a Rorschach test for the market: either a high profile confirmation that the “digital gold” story is broken, or, as some traders suggest and as earlier crypto.news coverage of Bitcoin’s performance during crises implies, an exquisitely mistimed capitulation top in a still evolving hedge narrative.
Other crypto.news reporting on war driven flows into gold tokenization and renewed institutional interest in Ethereum suggests that the safe haven debate is fragmenting across assets rather than converging on a single “digital bunker.”
For now, Cuban’s verdict is blunt: Bitcoin, he says, “lost the plot” – even as the numbers stubbornly refuse to give him the clean failure he thinks he saw in real time.

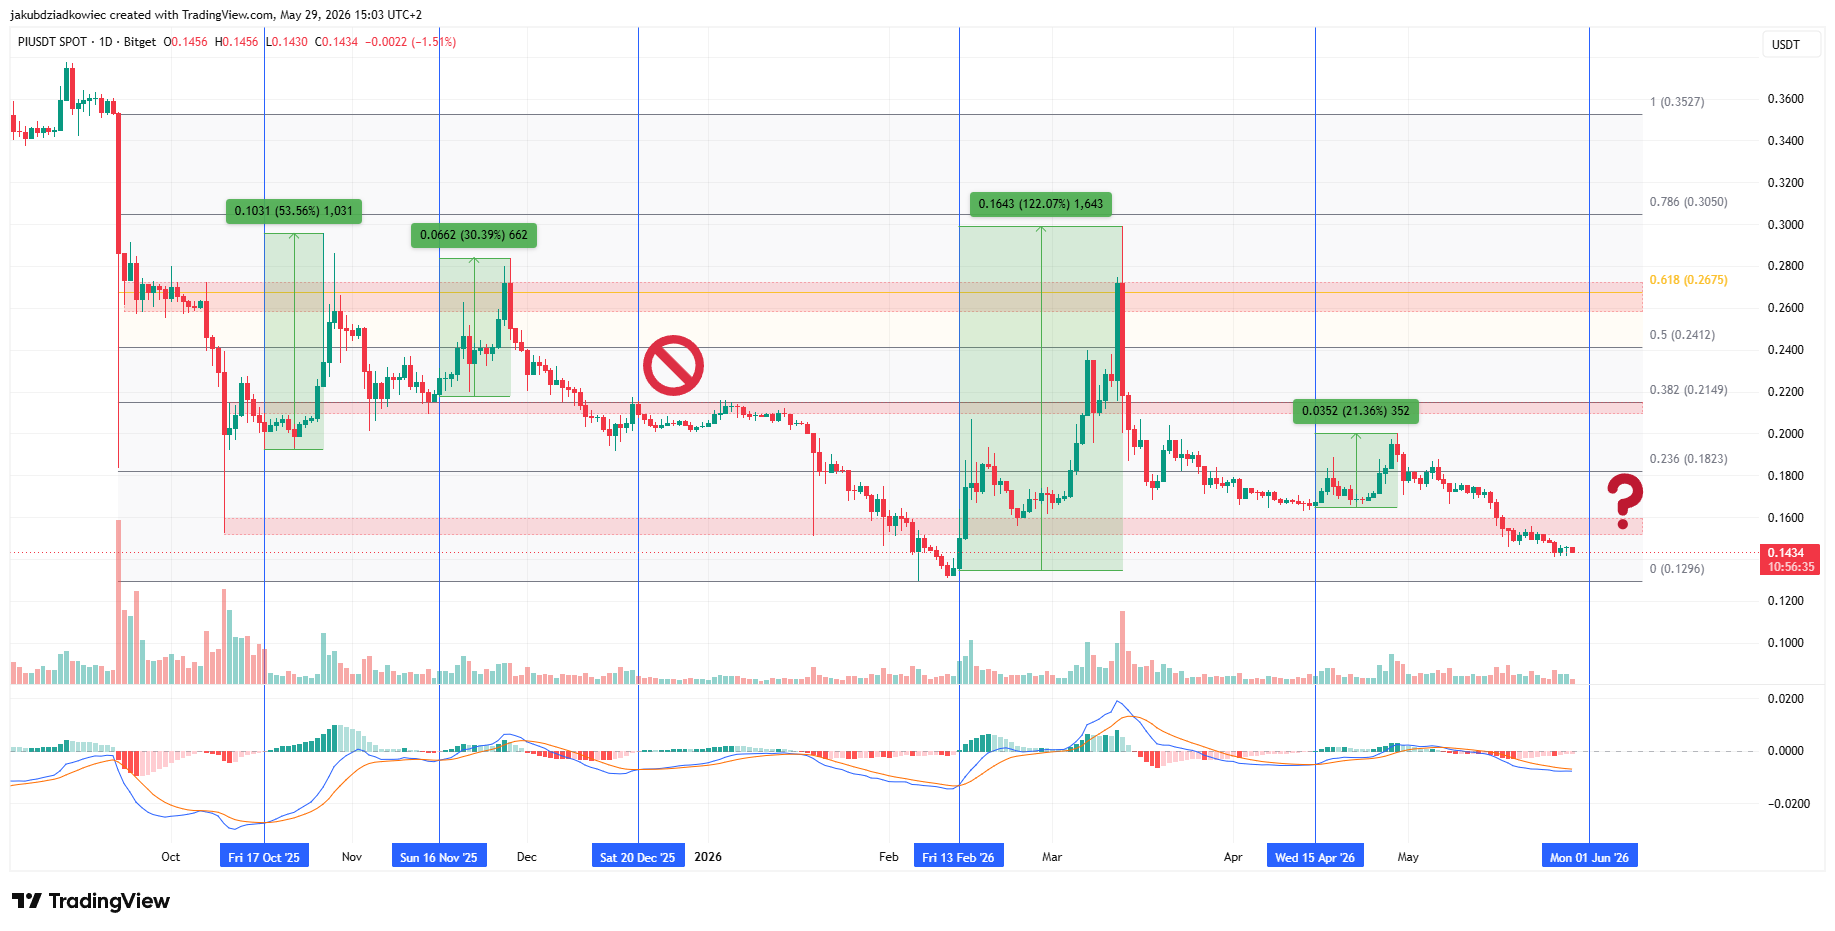
Pi Network (PI) heads into June with a single whale wallet that has crossed 400 million PI. The token still trades near $0.143, close to its all-time low and weighed down by daily unlocks.
The setup frames a clear test for June. Steady accumulation meets daily unlocks, three scheduled protocol upgrades, and a bearish chart with a single hint of a bounce.
MACD Setup Hints at June Bounce Despite Bearish Trend
PI’s daily chart leans bearish heading into June. Price action has carved lower lows since the February peak. The token now trades near $0.143, just above its $0.1296 all-time low, with volume tapering through May.
The Moving Average Convergence Divergence (MACD) on the daily timeframe offers a different read. Over the past eight months, each move from negative to positive on the indicator has preceded a sharp short-term rally.
Past bullish crosses on October 17 and November 16, 2025, produced gains of 53.56% and 30.39%. The signal failed on December 20. The February 13 cross delivered the largest move at 122.07%. The most recent crossover on April 15 produced 21.36%.

A fresh MACD cross is setting up for early June. The average of prior successful signals points to a potential 55.65% move, which would lift PI to around $0.22. That level aligns with the 0.382 Fibonacci retracement of the broader downtrend.
The pattern does not guarantee a repeat. December’s failed cross shows the signal can break in low-volume conditions.
Whale Wallet Keeps Buying Through the Drawdown
One PI address tracked as “GAS…ODM” has now crossed 400 million tokens, making it the largest single holder. Recent on-chain data shows the wallet adding more than 1.5 million PI in one day. The pattern of near-daily accumulation has held through May.
Some analysts have speculated the address could serve a buyback or treasury role. No party has confirmed ownership of the mysterious whale wallet. Several Pi commentators have framed it as a form of whale-driven price support absorbing supply during the drawdown.
PiScan data shows tagged exchange wallets now hold about 545 million PI in total, with a net inflow of roughly 1.5 million PI in the past 24 hours. Inflows to exchanges typically signal incoming sell pressure rather than accumulation. The whale’s buying has not been enough to offset the broader supply moving back toward trading venues.

Protocol Upgrades Anchor the Fundamental Calendar
Mainnet usage has expanded as more Pioneers complete Know Your Customer (KYC) verification and second migration steps. Pi Network reports 18.1 million verified users, 16.72 million migrations, and more than 119,000 second migrations completed.
Three upgrades anchor the June calendar. Pi Network has set June 2 as the deadline for Protocol 24 node upgrades. Protocol v25.1 follows on June 8, and v26.0 on June 22. The releases target node performance, scalability, and smart contract maturation after the Protocol 23 rollout in May.
Daily unlocks average around 6.5 million PI, adding roughly $29 million in new supply this month at current prices. The schedule reflects the same monthly token unlock pressure seen earlier in 2026.
June lines up as the first stretch in 2026 where four forces converge. A bearish trend, a building MACD signal, daily supply growth, and a buying whale all hit the same month. Whether the 0.382 Fibonacci level at $0.22 caps any bounce will set the tone for the next quarter.
The post What to Expect From Pi Network in June 2026 appeared first on BeInCrypto.

Bitcoin extended its six-week slide as Wall Street kicked off the week with fresh records, underscoring the growing gap between crypto prices and traditional risk assets. BTC traded around the low $72,000s, with a dip to about $72,395 on Bitstamp marking another test of near-term support as U.S. equity indices surged to new highs.
In a backdrop of upbeat stock performance — the S&P 500 and the Dow Jones Industrial Average both flirting with intraday records — traders weighed the persistence of the crypto weakness versus the risk-on appetite in conventional markets. The market narrative has increasingly centered on whether Bitcoin can hold key technical floors or if a broader rotation into risk assets could push prices lower in the near term. The week’s mood was further shaped by headlines around a potential durable ceasefire in a broader geopolitical front, which has historically fed risk-on sentiment in equities even as crypto liquidity and volatility persisted.
Key takeaways
- Bitcoin hovered around the $72,000 support zone as U.S. stocks touched fresh highs, highlighting a persistent crypto-equities divergence.
- A wide technical battleground exists in the $72,000–$74,000 range; a break below could push BTC toward new lows, while a rally above roughly $77,000 may rekindle the uptrend, according to prominent analysts.
- Trader Michaël van de Poppe warned that the level of support is crucial, suggesting that a break could set the stage for downside, whereas clearing the $77k mark could signal the start of the next leg higher.
- Derivative and risk metrics pointed to potential volatility ahead: long-position pressure and liquidations per market trackers indicate the risk of a squeeze remains elevated heading into weekend closes.
- The 100-day moving average near $72,972 remains a focal technical level, with traders watching for signals from weekly indicators and pattern formations that could guide the next move.
Bitcoin’s price action amid stock strength
Data compiled during the U.S. trading session showed BTC/USD slipping closer to the $72,000 zone, with Bitstamp recording a print near $72,395. Traders noted that the move comes during a period of broad stock-market strength, with a number of indices testing or setting new highs as investors priced in a continued risk-on environment. The discordance between a strong equity backdrop and a softer Bitcoin price has become a recurrent theme, reflecting ongoing debates about sector rotation, liquidity, and the drivers of institutional participation in crypto markets.
From a broader market standpoint, investors have been parsing headlines around a potential lasting ceasefire situation involving major geopolitical players. While such developments can lift stocks, Bitcoin has shown resilience to remain within a defined price corridor rather than breaking decisively in either direction. In this context, traders have been keenly watching how the technical landscape evolves as the weekend approaches.
Analyst views and potential trajectories
“Bitcoin is about to collapse to lows, if this level of support doesn’t hold. That’s just the reality.”
That assessment came from Michaël van de Poppe, who shared a nuanced view on the outlook for BTC in a post on X. While emphasizing the critical nature of support in the $72,000–$74,000 band, he also signaled that a breakout above $77,000 could mark the beginning of the next leg upward. The contrast in these two thresholds underscores the market’s current bifurcation: a construct where the next move is heavily contingent on whether buyers can defend key floors or whether sellers gain the upper hand and push Bitcoin toward new lows, especially if risk appetite shifts again.
Van de Poppe also drew attention to the broader macro setup, noting that even if BTC stabilizes here, price action remains tethered to the path of risk-on assets and macro catalysts. In his view, a sustained break above the $77,000 level could re-energize the bull case, while failure to hold support could expose BTC to renewed downside pressure and a potential widening gap against altcoins.
Derivatives, on-chain signals, and near-term risk
Market-commentary researchers and traders offered a cautionary read on the immediate horizon. CGT Trader highlighted a setup that could precede renewed volatility heading into the weekend, noting that extended long exposure and positive funding, coupled with declining open interest, could foreshadow a “long squeeze” if the price fails to sustain upward momentum. The assessment reflects a broader pattern in which traders appear to be holding risk-on bets even as some participants derisk and reduce exposure ahead of weekly closes.
Meanwhile, data aggregators signaled elevated risk in the near term. CoinGlass tracked more than $200 million in cross-crypto liquidations over a 24-hour window, illustrating persistent risk concentrations in the broader market backdrop. Such figures typically precede heightened volatility, reinforcing the sense that traders should be prepared for abrupt moves during the closing days of the week.
On the technical front, Market intelligence firm Material Indicators emphasized that volatility could spike as Sunday’s cluster of daily, weekly, and monthly closes arrived. In addition, its analytics flagged a potential head-and-shoulders pattern forming, with a possible pullback to the $68,000–$69,000 zone if current dynamics fail to sustain momentum. The note also pointed to the 100-day simple moving average, which sits around $72,972, as a critical pivot for the near term. “The big tells will be whether bulls can rally from the 100 DMA, and how Weekly RSI is trending after the weekly close,” the team observed, highlighting the macro tilt of the current price action.
These signals paint a nuanced picture: while there is still speculative appetite in the market, a constellation of risk indicators suggests a probability of continued volatility and potential retracements if key supports fail to hold or if the market fails to sustain a bid above important technical thresholds.
What to watch next
As the weekend approaches, the immediate focus for traders will be whether Bitcoin can defend the critical support zone around $72,000. A successful hold in this area could set the stage for a bounce toward the next meaningful resistance, potentially near $77,000, where bulls previously signaled a renewed push higher. Conversely, a decisive break below the $72,000 floor could open downside momentum toward mid- to upper-$60,000s, particularly if the broader risk-on backdrop falters or if liquidity conditions tighten further.
Beyond price levels, market participants will be watching the interaction between spot volumes, derivatives activity, and on-chain signals. The combination of high liquidations and positive funding conditions suggests a delicate balance between bullish intent and the risk of a sudden squeeze if the price fails to sustain a directional move. The upcoming weekly close will be a focal point for traders who rely on pattern recognition and moving-average confluences to gauge the next phase of the cycle.
For investors and builders in the space, the key takeaway remains: the immediate path for Bitcoin hinges on defending critical technical floors while macro narratives and liquidity dynamics continue to influence the pace of gains or retracements. The next few sessions could clarify whether Bitcoin resumes its longer-term uptrend or remains ensnared in a choppy range as market participants reassess risk budgets.
As always, readers should stay tuned to market developments and monitor how the price behaves around the 100-day moving average and around the outlined support and resistance thresholds, as the weekend closes and the new week begins.

Global stocks have been making new highs recently, but Bitcoin (BTC), the biggest cryptocurrency based on market capitalization, is trading at almost 42% below its lifetime highs.
This split has left crypto investors searching for answers, especially since the market has lumped the two asset classes together under the “risk-on” label.
Diverging Drivers Between Equities and Bitcoin
According to market researchers at XWIN Japan, the reason for the divergence is simple: stocks and BTC are running on “different engines.”
They noted that equity gains are tied to growth in AI-linked earnings, capital spending from firms like Nvidia, and share buybacks, as well as steady ETF inflows. As such, investors can point to profit growth that is real and visible.
However, Bitcoin does not carry earnings or cash flow, with its price depending on new capital entering the market, which leaves it more exposed to liquidity shifts.
Right now, per XWIN’s assessment, that capital isn’t arriving. Recall that spot Bitcoin ETFs have recorded notable outflows during the second half of May, with data from SoSoValue showing that since May 15, the funds have lost more than $3.5 billion. In that time, the biggest outflows were recorded on May 18 ($648.64 million) and May 27 ($733.43 million). There hasn’t been a single green day since the $131.31 million that flowed in on May 14.
XWIN’s analysts also pointed out that in past strong cycles, the price of Bitcoin was often backed by growing user activity. But currently, the asset is increasingly resembling a market where price is elevated while participation is fading. And that, they said, is the key difference.
“Stocks rise because companies generate profits. Bitcoin rises when new liquidity and new participants return,” they explained.
As a result of the above, investors have been allocating more funds to stocks, which they see as “profit growth assets,” while taking away from those that depend on liquidity, including BTC.
And it’s not all talk. As noted by analyst Ash Crypto earlier today, the Nikkei crossed 66,500 for the first time ever on May 29, with Japanese stocks adding about $3.2 trillion this year alone. The story was the same in Korea, whose KOSPI also hit a new all-time high, adding 150 trillion won to its total market value.
What Bitcoin Needs
As the Nikkei and KOSPI shone, Bitcoin yesterday crashed to about $72,600 per CoinGecko data, with market watchers suggesting it may have been affected by the resumption in hostilities between the USA and Iran, as well as someone offloading a huge $1.3 billion position in BlackRock’s spot Bitcoin ETF, IBIT.
The flagship crypto has since dragged itself back above $73,000, but that’s hardly impressive, considering that it had been trading close to $78,000 at some point in the last seven days. The current price also represents a drop of more than 4% in the past month, as well as a nearly 32% decline year-on-year.
To turn things around, XWIN’s analysts stated that Bitcoin needs stronger ETF flows, a rise in its on-chain activity, and improvement in the Coinbase Premium. They also believe that a weaker dollar could help bring about a more sustained revival for the cryptocurrency.
The post Why Bitcoin Is Falling Behind Record-Breaking Stocks appeared first on CryptoPotato.

Key Highlights
- Dell Technologies stock jumped approximately 32% on Friday, tracking toward its strongest single-day performance on record
- First-quarter revenue climbed nearly 88% compared to last year, with AI server sales reaching $16.1 billion — an explosive 757% surge
- Adjusted earnings per share of $4.86 significantly exceeded the Street’s $2.94 forecast
- Susquehanna elevated Dell to Positive with a new price target of $700, up from $138
- J.P. Morgan increased its target to $500 from $280, while Morgan Stanley acknowledged missing the mark on Dell’s potential
Dell Technologies delivered a jaw-dropping earnings report Thursday evening, propelling its shares approximately 32% higher on Friday in what’s shaping up to be the company’s strongest trading session since its return to public markets in 2018.
The results were nothing short of spectacular. First-quarter revenue soared nearly 88% year over year, fueled by unprecedented demand for AI infrastructure. Revenue from AI-optimized servers alone reached $16.1 billion — representing a staggering 757% jump compared to the year-ago period.
Adjusted earnings per share landed at $4.86, crushing Wall Street’s consensus forecast of $2.94.
Ben Reitzes, who leads technology research at Melius, didn’t mince words: “They beat every line in the model — so this wasn’t just AI, it was great execution.”
Wall Street Rushes to Adjust Forecasts
The blowout results triggered a flurry of target price increases Friday morning.
Susquehanna delivered the most dramatic revision, elevating Dell to Positive from Neutral while boosting its price target to $700 from $138. The investment firm highlighted AI server growth occurring without margin compression, expanding opportunities in inferencing workloads, and stronger-than-anticipated performance across client solutions.
J.P. Morgan maintained its Overweight stance while increasing its target to $500 from $280. Analyst Samik Chatterjee observed that Dell’s revised fiscal 2027 guidance was lifted “materially once again,” with customer demand running significantly ahead of projections and order pipeline clarity extending deeper into the calendar.
Dell’s revised full-year AI revenue forecast of $60 billion suggests 144% annual growth, per J.P. Morgan’s analysis.
Citi maintained its Buy recommendation and boosted its target to $475 from $290, characterizing the quarter as an “exceptional beat and raise” with customer demand persistently outpacing available supply.
Morgan Stanley Acknowledges Misjudgment
Morgan Stanley, currently rated Underweight with a $170 target, offered a rare mea culpa in Friday’s research note.
“We got this one wrong, and our model/PT are under review,” wrote analysts headed by Erik Woodring. They described it as “one of the most impressive quarters we’ve seen in our time covering Hardware.”
Conventional server revenue nearly doubled year over year. Storage solutions recorded their fastest expansion in three years. PC division operating margins reached near-peak levels. Full-year guidance received an approximately 40% upward adjustment.
Dell also secured a Pentagon contract valued at $9.7 billion earlier this week to deliver software solutions to U.S. military operations.
Heading into Thursday’s earnings announcement, Dell’s stock had already climbed nearly threefold over the preceding twelve months.
J.P. Morgan acknowledges that Dell’s second-half outlook incorporates a $10 billion sequential revenue deceleration — though analysts emphasize this reflects supply constraints rather than weakening demand, and anticipate continued guidance increases as production capacity expands.
Dell increased its full-year revenue projection to reflect approximately 50% annual growth.

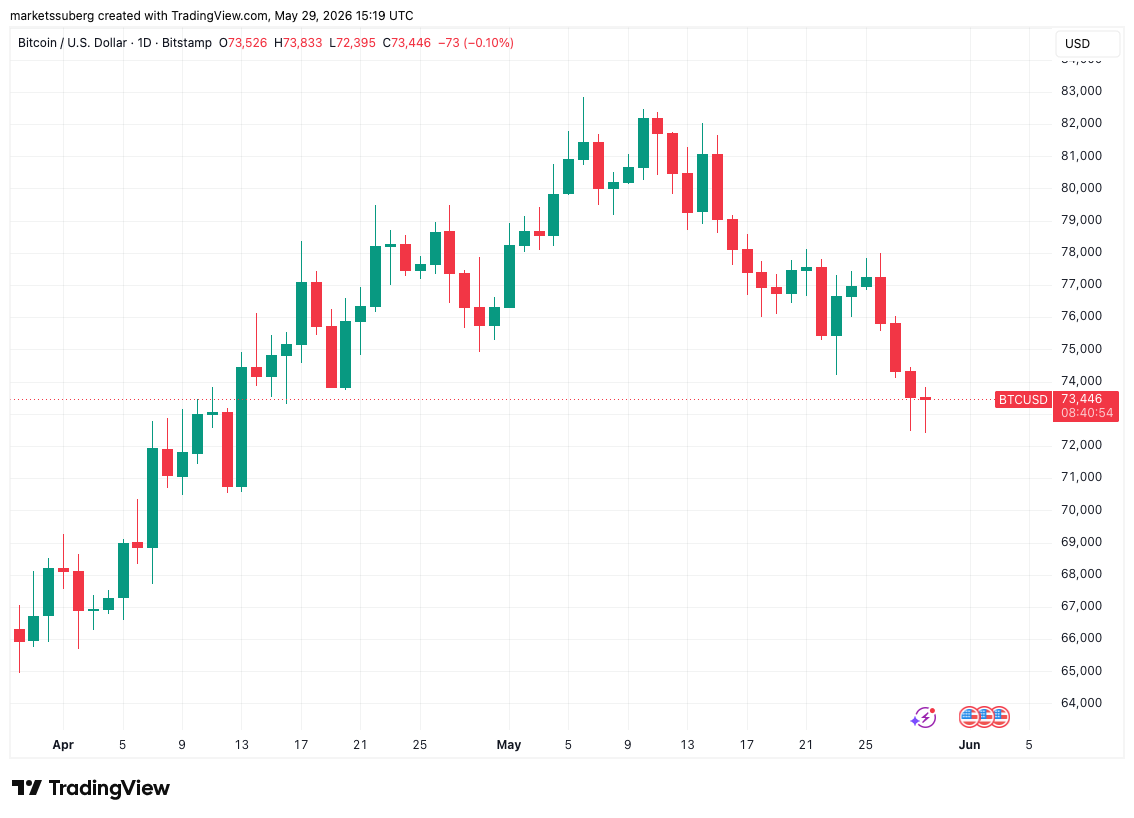
Bitcoin (BTC) deepened six-week lows at Friday’s Wall Street open as US stock markets diverged to all-time highs.
Key points:
- Bitcoin sinks closer to $72,000 as analysis eyes “crucial” BTC price levels.
- US-Iran ceasefire talks send stocks to even higher records as the crypto divergence continues.
- Bitcoin’s 100-day moving average gains significance as a battleground for bulls.
BTC price analysis sees “crucial” range now in play
Data from TradingView showed BTC/USD dropping to $72,395 on Bitstamp to start the US TradFi trading session.
BTC/USD one-day chart. Source: Cointelegraph/TradingView
Continuing a losing streak from recent weeks, the pair again saw downside pressure, even as stocks surged further into price discovery.
The S&P 500 started Friday with new record highs, while the Dow Jones Industrial Average did likewise.
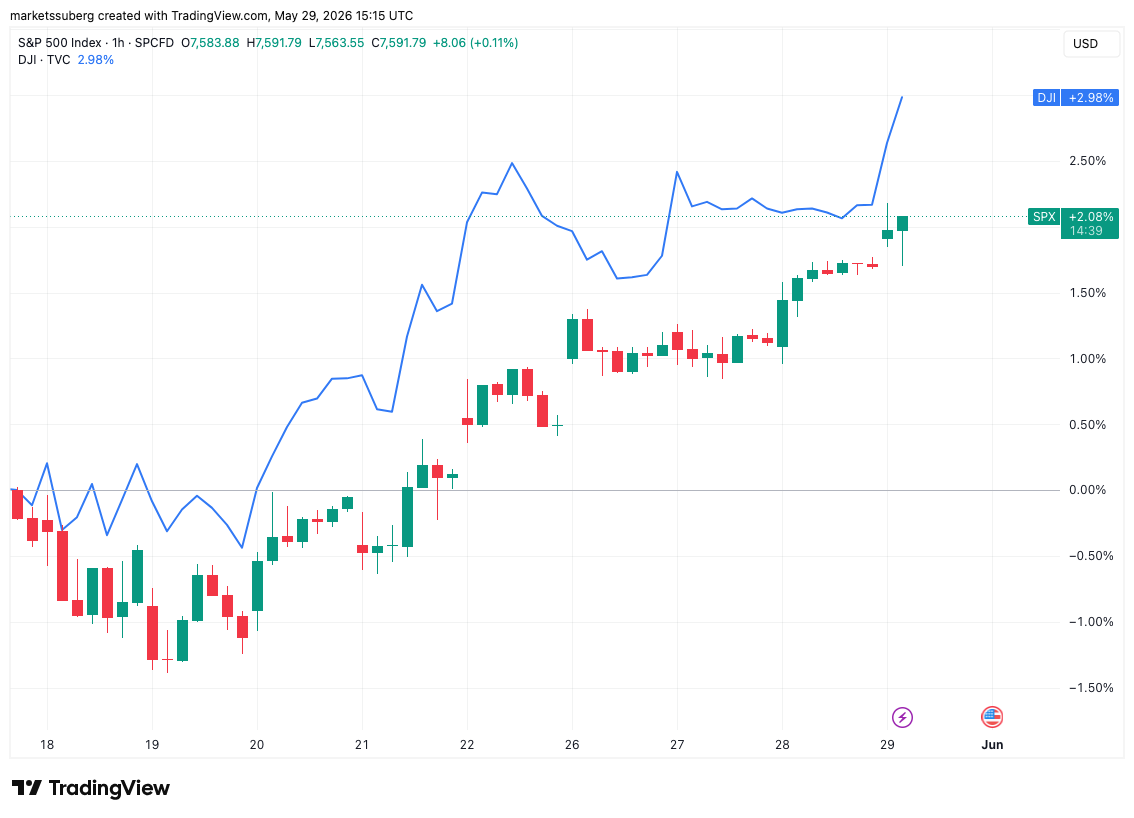
S&P 500 vs. Dow Jones one-hour chart. Source: Cointelegraph/TradingView
Anticipation of a lasting ceasefire between the US and Iran drove the momentum, even as military strikes continued.
Commenting, trader and analyst Michaël van de Poppe argued that geopolitical changes could still save the Bitcoin price trend.
“Bitcoin is about to collapse to lows, if this level of support doesn’t hold. That’s just the reality,” he wrote in a post on X.
“Anything between $72,000-74,000 is crucial and could be the end of the correction, especially if Trump comes with a new deal –> rates go down –> oil goes down –> risk-on assets (especially crypto) go higher.”
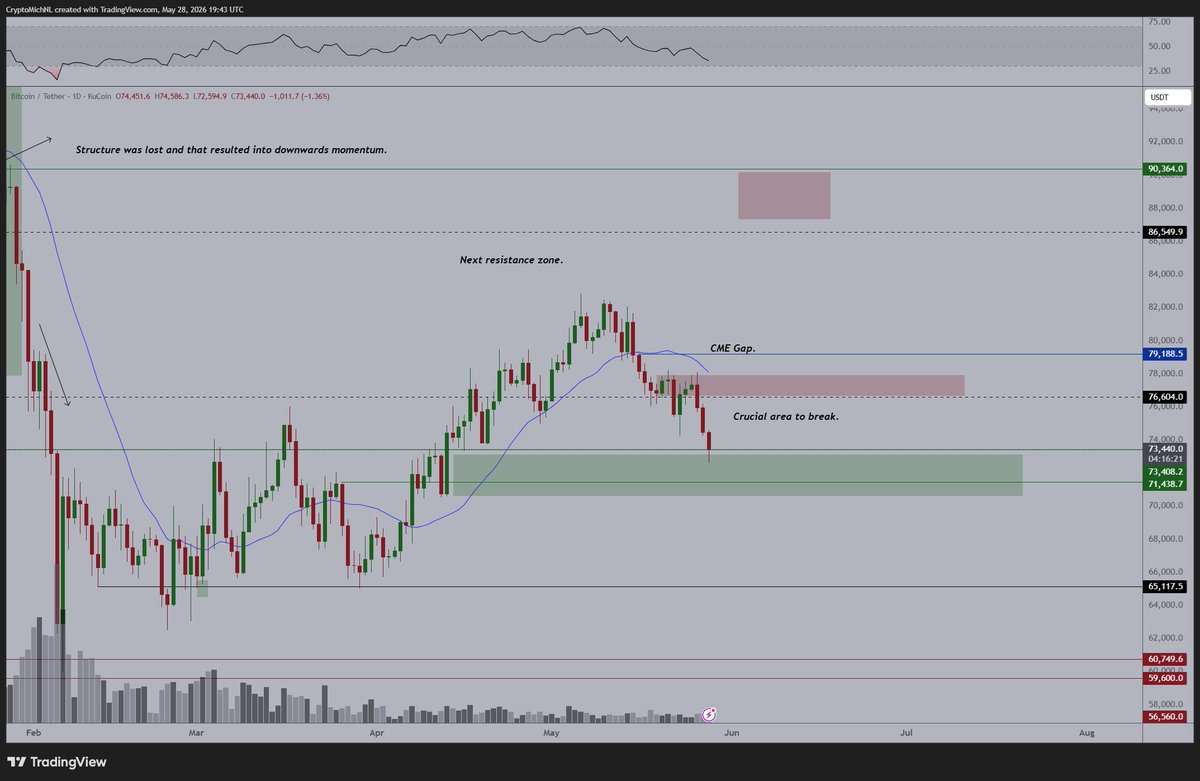
BTC/USDT one-day chart. Source: Michaël van de Poppe/X
Van de Poppe suggested that $77,000 was the line in the sand to start the “next leg upwards.”
“If that doesn’t happen, then we’re about to witness another leg towards the lows and probably new lows on the altcoin markets,” he added.
Weekly close tipped to see extra volatility
Continuing the general sense of caution among Bitcoin market participants, trading account CGT Trader warned that BTC long positions could face liquidation next.
Related: Bitcoin bids farewell to CME futures gaps with $67K still on radar
“Long squeeze loading …. Price continues to range while funding stays heavily positive and open interest keeps declining. That usually suggests the market is still leaning aggressively long, even as some participants are already closing positions and derisking,” an X post read.
“At the same time, spot volume continues to fade, which points toward underlying weakness. Given these conditions, a long squeeze looks increasingly likely.”
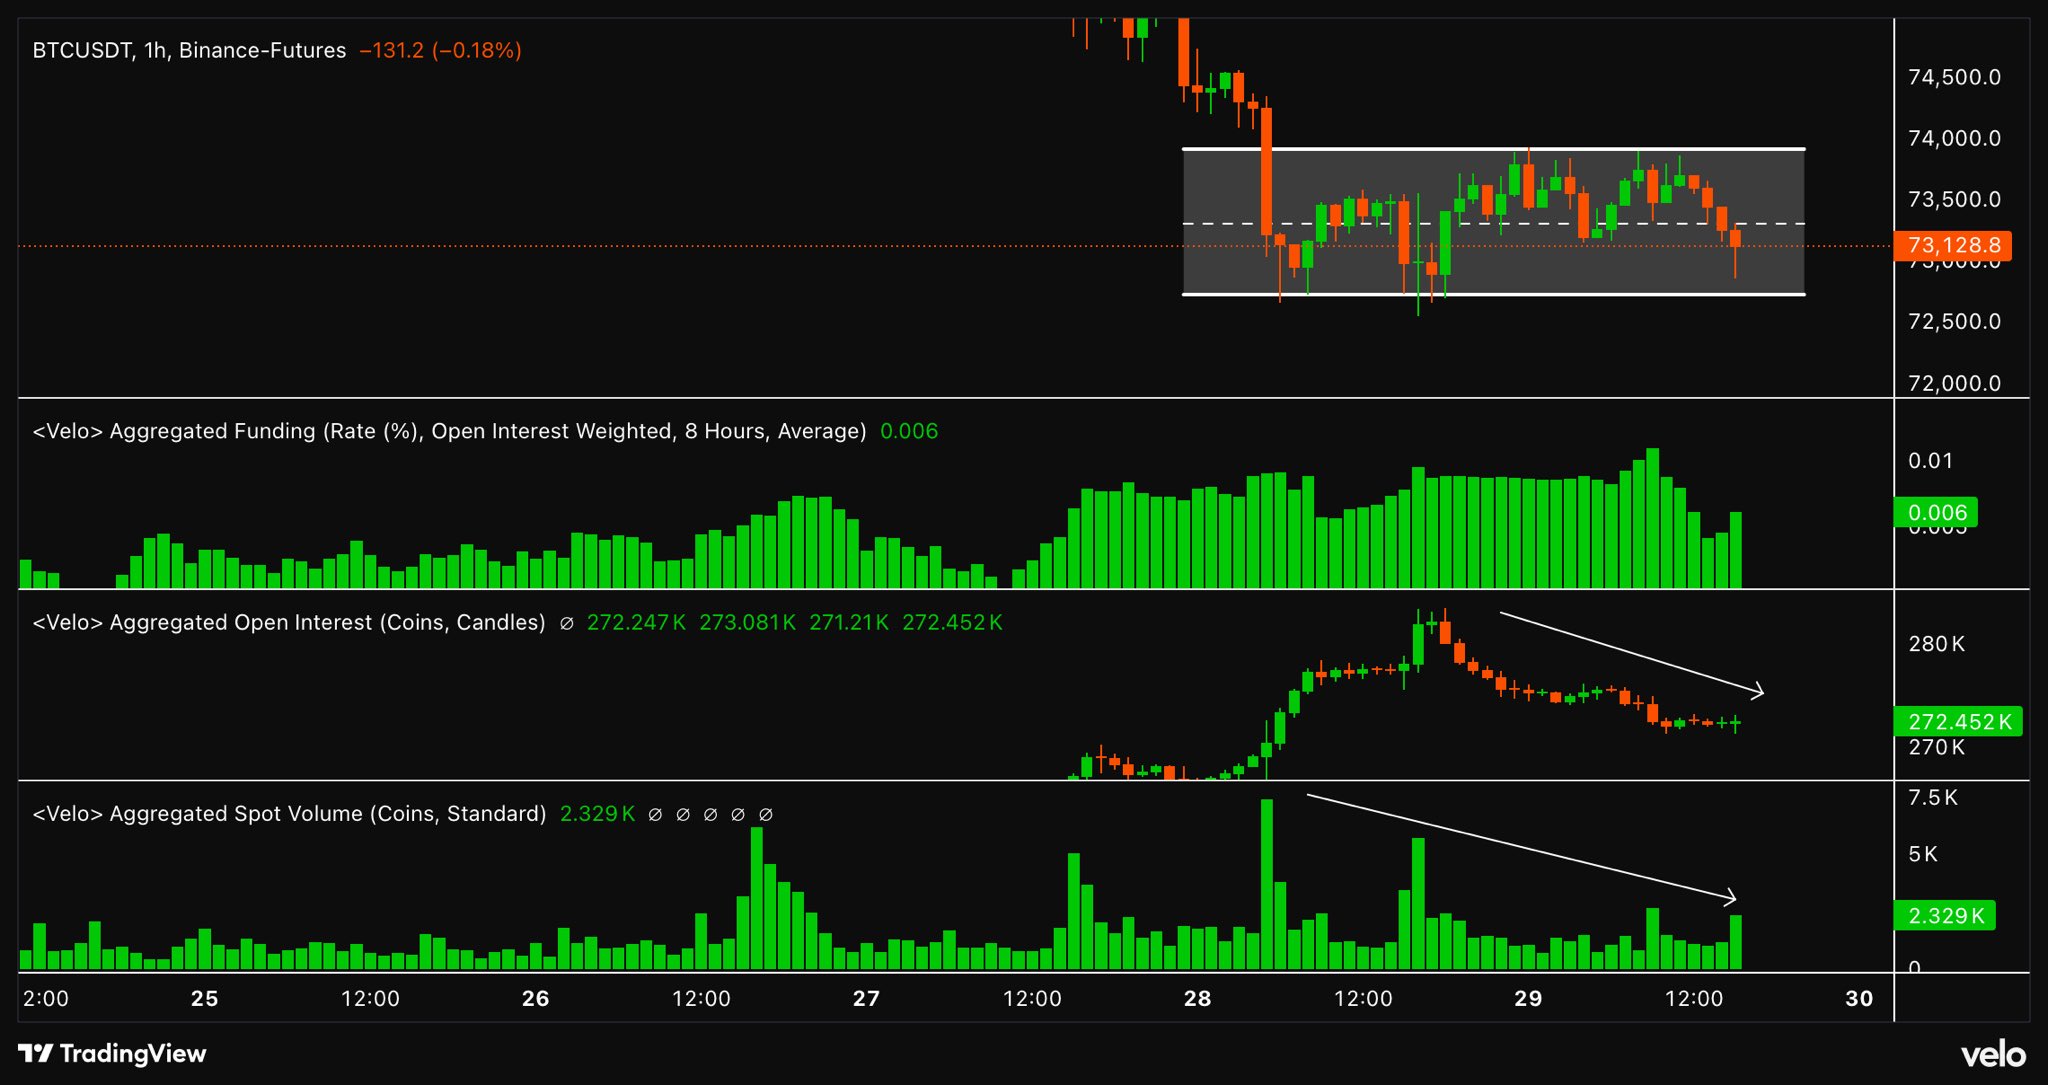
Binance BTC/USDT futures order-book data. Source: CGT Trader/X
Data from CoinGlass showed the total 24-hour cross-crypto liquidations passing $200 million at the time of writing.
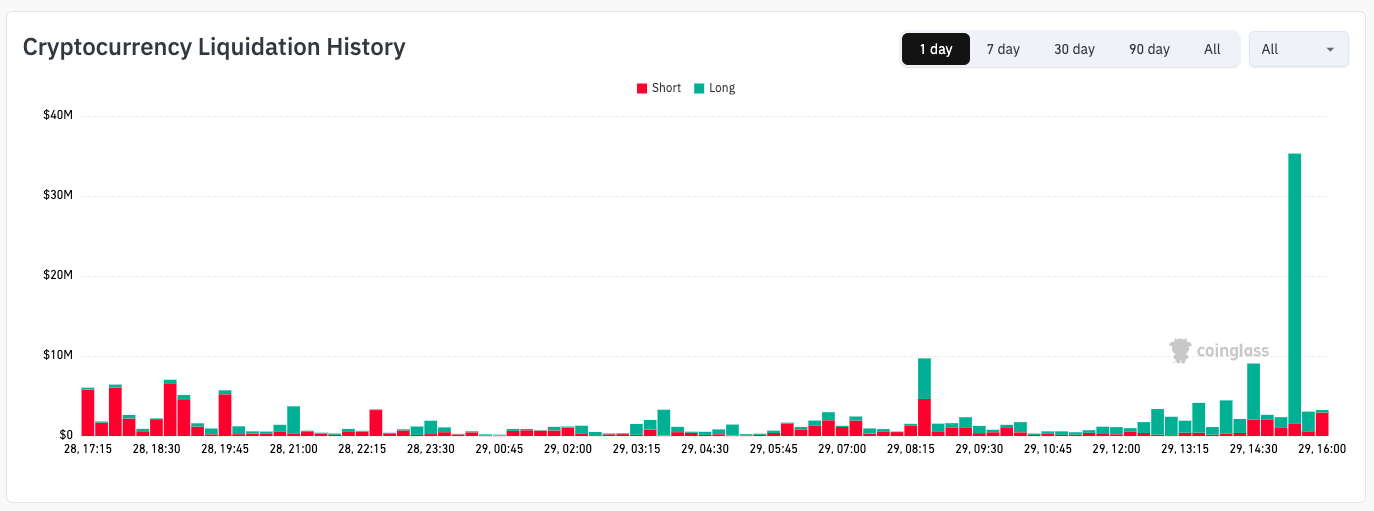
Crypto liquidation history (screenshot). Source: CoinGlass
Looking ahead, trading resource Material Indicators told followers to “expect volatility” on Bitcoin as Sunday’s joint daily, weekly and monthly close approached.
“We have a cluster of liquidations around $76k and a developing H & S pattern that could take price down to the Q2 Timescape R/S Levels in the$68k – $69k range,” it noted, referring to data from its proprietary trading tools.
“The big tells will be whether bulls can rally from the 100 DMA, and how Weekly RSI is trending after the W close.”
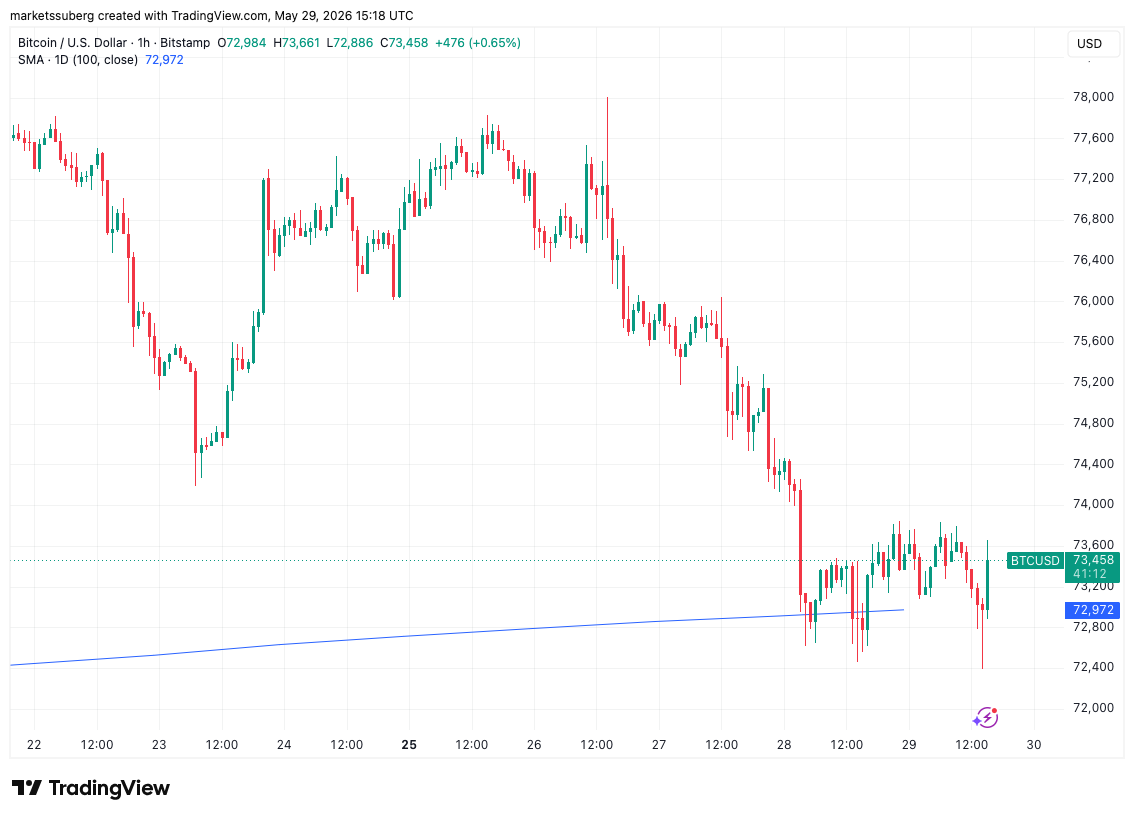
BTC/USD one-hour chart with 100-day SMA. Source: Cointelegraph/TradingView
Material Indicators referenced the 100-day simple moving average, currently at $72,972.

TLDR:
- Bitcoin ETF outflows surpassed $4 billion during one of 2026’s largest withdrawal phases.
- Santiment data shows major ETF outflow spikes often emerge close to Bitcoin market bottoms.
- Whale wallets and retail traders are simultaneously increasing spot Bitcoin accumulation activity.
- Thin liquidity above $74K may accelerate Bitcoin price movement if bullish momentum strengthens.
Bitcoin ETF outflows have crossed $4 billion since May 7, reflecting rising caution among institutional and retail investors.
However, fresh CVD data and weakening sell-side liquidity suggest Bitcoin could be approaching a critical turning point after weeks of aggressive market pressure.
Bitcoin ETF Outflows Signal Investor Capitulation
According to Santiment data, cumulative withdrawals from spot Bitcoin ETFs now exceed $4.013 billion within three weeks.
The heavy selling pressure reflects a sharp decline in confidence across mainstream investment markets. Institutional investors, hedge funds, wealth managers, and retail traders have all contributed to the latest wave of capital exits.
Santiment noted that extreme Bitcoin ETF outflows historically appeared during emotionally driven market conditions.
Similar patterns emerged during November 2025, when ETF products recorded nearly $903 million in daily withdrawals before Bitcoin staged a recovery rally.
Another major outflow event occurred on May 27, 2026, when roughly $738 million exited spot Bitcoin ETFs. The latest selling trend now ranks among the largest sustained withdrawal periods since spot Bitcoin ETFs launched in the United States.
The analytics platform also pointed out that previous inflow spikes coincided with overheated market conditions. In July and October 2025, billion-dollar ETF inflows arrived near local Bitcoin highs as bullish sentiment intensified across the market.
By contrast, current Bitcoin ETF outflows suggest investors are reducing exposure after prolonged uncertainty and weakening momentum. Market fear has increased steadily as traders react to broader macroeconomic pressure and persistent volatility.
Bitcoin CVD Data Shows Buyers Returning
Despite continued Bitcoin ETF outflows, recent cumulative volume delta data paint a more constructive market structure beneath the surface. Santiment reported that buying activity has started increasing across nearly every major order cohort.
Retail traders executing smaller orders have returned to spot accumulation. At the same time, whale-level participants between $100,000 and $10 million are also rebuilding exposure after earlier distribution phases.
This alignment between smaller investors and larger wallets often strengthens bullish momentum during recovery periods. Historically, synchronized spot buying has preceded stronger Bitcoin expansion phases when liquidity conditions remain favorable.
The report also identified the $74,000 region as a key resistance level for Bitcoin. Market heatmaps indicate relatively thin sell-side liquidity above that zone, reducing the number of major sell walls overhead.
Analysts often describe such conditions as a liquidity gap, where aggressive buying pressure can trigger faster upward price movement.
If Bitcoin breaks above resistance with strong volume, short covering and renewed momentum could accelerate price action quickly.
While macroeconomic risks remain, current CVD trends suggest stronger hands are quietly absorbing supply during the latest phase of market weakness.
Dell stock trades at $317.05 after a 138% rally driven by Trump’s May 8 endorsement and a record Q1 FY27 earnings beat.
The internal signals on the chart and in the options market, however, suggest the move may need a pause before the next leg higher.
Dell Q1 FY27 Earnings Crush Every Estimate
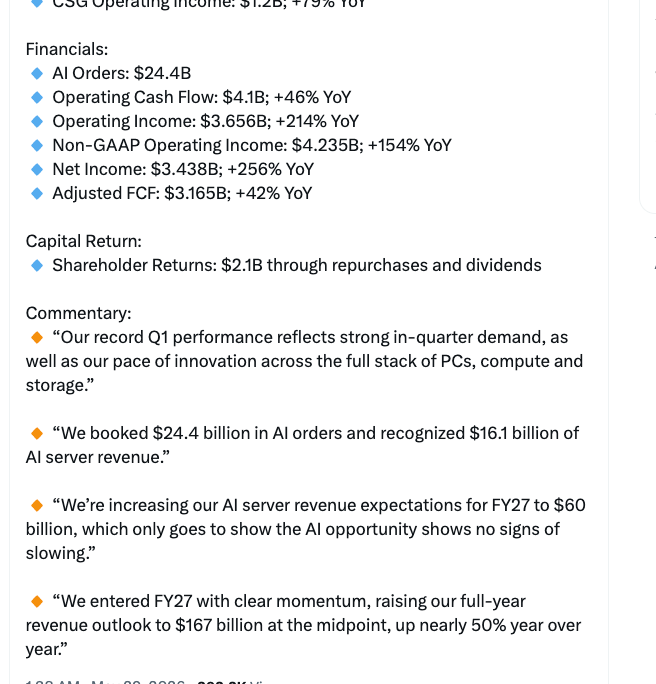
Dell Technologies (NYSE: DELL) reported Q1 FY27 revenue of $43.8 billion, far above the $34.81 billion consensus estimate. Adjusted earnings per share (EPS) came in at $4.86 against the $2.88 estimate. EPS measures company profit divided by outstanding shares. The result was a 214% year-over-year jump.
Want more insights like this? Sign up for Editor Harsh Notariya’s Daily Newsletter here.
The AI server segment carried the print. AI-Optimized Servers revenue reached $16.1 billion, up 757% year over year. Dell also booked $24.4 billion in AI orders during the quarter.
Management raised the FY27 AI server revenue expectation to $60 billion from $50 billion. Full-year revenue guidance moved to $165 to $169 billion, well above the $143.9 billion analyst expectation.

The size of the beat explains why options activity and institutional flow on the chart became the next questions. Such a large positive surprise can leave the stock briefly stretched, which is what later signals appear to confirm.
Trump Endorsement and Pentagon Contract Drive the 138% Rally
The earnings beat is the third leg in a story that began outside the company. On May 8, 2026, President Trump publicly urged investors to “go out and buy a Dell.” The shoutout came mid-rally as Dell stock was already climbing off its early-year base.
Less than three weeks later, on May 27, Dell was awarded a $9.7 billion US Pentagon contract. The contract added a fundamental anchor to what had started as political momentum.
By Thursday, Dell stock had rallied 138% from its early-March base. The chain looks like a clean bullish catalyst. The internal market signals that emerged on the same chart, however, suggest the move may be running ahead of itself.
CMF Double Top and Lower Volume Hint at a Pullback
Dell’s chart began flashing internal weakness even as the price hit fresh highs. Chaikin Money Flow (CMF) measures institutional money moving in and out of a stock using price and volume.
The CMF reading peaked at 0.40 earlier in May and has since dropped to 0.24. The drop forms a double-top structure on the indicator itself, even though the price kept climbing.

The CMF is still positive but is testing an ascending trend line that has supported the rally since mid-April. A break of that trend line would confirm that institutional money is stepping back.
Volume tells a similar story. The May 28 earnings session printed strong 26.61 million share volume. Yet the rally’s overall volume profile has trended lower compared to the early March surge.
Rising price on falling volume often precedes a near-term pullback. The doji candle that closed Thursday’s session adds confirmation. A doji forms when buyers and sellers finish nearly flat, signaling indecision after a strong move.

If institutional flow is leaving while the chart shows indecision, options market data is the next confirmation point.
Put-Call Volume Ratio Doubles Around Q1 Earnings
The options market shifted noticeably around the Q1 print. The put-call volume ratio compares daily put buying to daily call buying. A ratio below 1 means more calls trade than puts and is generally read as bullish.
On May 20, Dell’s put-call volume ratio sat at 0.34, a very bullish reading. The open interest ratio at the same date was 1.28. Open interest measures total contracts still open, so the 1.28 reading meant existing puts already outnumbered existing calls.

By May 28, the day of the earnings release, the volume ratio climbed to 0.80. The open interest ratio inched up to 1.29. The volume ratio more than doubled in eight days even as the stock rose.

Heavy put buying on a strong earnings day usually reflects hedging rather than directional bearish trades. Large holders buy protection while keeping their stock exposure. The signal aligns with the CMF and volume picture from the chart.
Wall Street analysts also weighed in post-earnings. Mizuho Securities reiterated a BUY rating while raising its target. Truist Financial held its HOLD stance.

Bullish news flow, weakening institutional flow, and a rising put hedge now sit together. The price chart becomes the final piece.
Dell Stock Price Prediction and Key Levels Post-Earnings
The post-earnings setup leaves Dell stock with a clear roadmap on the chart. The current price sits at $317 after closing higher yesterday with a session high above $326. The $326 rejection level clearly aligns with the technical levels from the last completed swing and showcases the validity of the current pattern.
The 0.618 Fibonacci level of the recent swing sits at $305 and has to be a key support level. The $290 marks the next support cluster below if the expected pullback decides to run deeper. A pullback will put the Dell stock price in a falling channel, invoking the bullish flag-and-pole pattern. The pole assumes the 138% rally since early-March.
A drop to $275, the 0.382 Fibonacci, would still keep the bullish flag pattern intact. The pattern starts to weaken below $256. A close under $227.00 would invalidate the structure entirely.

On the upside, a successful pullback rebound from $305 or $290 sets up a continuation. The pattern projection aligns at $431, the 1.618 Fibonacci extension. That level sits within reach of Mizuho Securities’ updated $435 price target, raised from $350 on May 28.
The next move depends on whether buyers defend $305 cleanly. A bounce at $305 separates a continuation toward $431 from a deeper pullback to $275 and $256.
The post Dell Stock Up 138% on AI and Trump Push, But Pullback Risk Builds appeared first on BeInCrypto.
TLDR:
- Kalshi secured approval for the first regulated bitcoin perpetual futures contract in the U.S.
- Coinbase received CFTC relief to route clients into offshore crypto perpetual futures markets.
- The CFTC classified certain crypto perpetuals as foreign futures under Regulation 30.1.
- Regulators introduced leverage safeguards while expanding crypto derivatives market access.
CFTC crypto perpetual futures entered a new regulatory era after the agency approved Kalshi’s bitcoin perpetual contract and cleared Coinbase’s foreign derivatives structure.
The decisions establish the first workable framework for regulated crypto perpetual trading in the United States. This will help in expanding institutional access to offshore markets.
CFTC Opens Door for Regulated Bitcoin Perpetual Futures
CFTC crypto perpetual futures moved into the spotlight after regulators approved Kalshi’s BTCPERP contract on Friday.
The approval creates the first regulated pathway for bitcoin perpetual futures trading inside the United States. Until now, most crypto perpetual activity operated through offshore platforms beyond direct U.S. oversight.
The Commodity Futures Trading Commission confirmed that Kalshi’s contract must comply with the Commodity Exchange Act and existing market standards.
The agency described the move as part of a broader effort to create a workable structure for digital asset derivatives products.
Bitcoin perpetual futures differ from traditional futures because they carry no expiration date. Traders can maintain positions indefinitely while speculating on future crypto price movements.
These contracts have become one of the most actively traded products across global crypto exchanges because they offer constant market exposure.
Kalshi CEO Tarek Mansour said the approval represents the company’s expansion beyond prediction markets into regulated derivatives trading.
In a company statement, Mansour noted that regulated perpetual contracts could improve capital allocation and strengthen risk management for U.S. businesses seeking crypto exposure.
CFTC Chairman Mike Selig also backed the development, describing perpetual futures as an important tool for risk management and price discovery across crypto markets.
He added that bringing crypto perps onshore aligns with broader efforts to position the United States as a major digital asset hub.
Coinbase Gains Access to Offshore Crypto Perpetual Markets
Alongside the Kalshi approval, the CFTC issued a no-action letter involving Coinbase Financial Markets and Deribit FZE.
The guidance allows Coinbase’s registered futures commission merchant subsidiary to connect customers with foreign perpetual futures and options products through Coinbase Bermuda.
The agency confirmed that the perpetual contracts referenced in the letter qualify as foreign futures under Commission Regulation 30.1.
The arrangement also permits certain customer-owned crypto assets, including bitcoin, ether, and payment stablecoins, to serve as margin collateral under specific conditions.
Coinbase Chief Legal Officer Paul Grewal called the decision a major step for the crypto industry. The guidance gives U.S.-linked clients broader access to offshore perpetual markets while operating within a defined regulatory framework.
The announcements arrived shortly after President Donald Trump criticized previous U.S. crypto policies for pushing perpetual trading activity offshore.
Trump argued that earlier regulatory pressure weakened domestic innovation while global crypto derivatives markets continued expanding outside the country.
Despite the approvals, the CFTC’s current position remains guidance-based rather than fully codified under permanent rules.
Still, the latest actions establish a clearer framework for crypto derivatives firms seeking regulated access to perpetual futures markets in the United States.

Key Highlights
- First-quarter FY2027 product revenue reached $1.334 billion, marking a 33.9% year-over-year increase and exceeding consensus by 5.3%
- Cortex Code (CoCo), Snowflake’s AI-powered product, expanded to more than 7,100 customer accounts following its February 2026 launch
- HSBC elevated its rating to Buy with a price target increase from $176 to $289
- Analyst price targets climbed across the board, with Monness, Crespi, Hardt establishing the highest at $320
- The company strengthened collaborations with AWS and OpenAI while revealing acquisition plans for AI company Natoma
Shares of Snowflake (SNOW) climbed approximately 3.6% to the $239.20 level following the cloud data company’s first-quarter fiscal 2027 earnings release, which exceeded analyst projections for both top-line and bottom-line performance. The advance comes on top of a 39% rally during the week preceding the earnings announcement.
The company reported product revenue of $1.334 billion for the quarter, representing a 33.9% gain from the same period last year. This figure surpassed the FactSet consensus estimate by 5.3%. Operating income exceeded expectations by 35.2%.
Management increased full-year projections and enhanced operating margin guidance by 100 basis points. The company maintained its FY2027 product gross margin outlook at 75%.
Much of the quarter’s outperformance stems from robust adoption of Snowflake’s artificial intelligence offerings, particularly Cortex Code, known internally as CoCo. Since becoming generally available in February 2026, the solution has expanded to over 7,100 client accounts.
Executives identified CoCo as the primary catalyst for upgrading FY2027 guidance. The rapid adoption trajectory is notable given the product has been widely available for less than half a year.
The company’s foundational data platform consumption has also accelerated. Enterprises are migrating workloads to Snowflake more aggressively to enable governed AI revenue applications, which simultaneously boosts direct AI-related revenue and overall platform utilization.
Wave of Bullish Analyst Revisions
HSBC delivered the most significant rating change, elevating SNOW from Hold to Buy while raising its price objective from $176 to $289. Analyst Stephen Bersey highlighted CoCo as the most tangible evidence of Snowflake’s capacity to generate revenue from artificial intelligence.
Monness, Crespi, Hardt established an even more ambitious target of $320. Benchmark increased its forecast to $270, pointing to unprecedented sequential dollar expansion. Cantor Fitzgerald set a $282 target. Truist Securities positioned its estimate at $275, while Freedom Broker projected $300.
This coordinated wave of upgrades signals a fundamental reassessment of Snowflake’s growth potential across the analyst community.
Strategic Partnerships and M&A Activity
The company unveiled expanded strategic relationships with AWS and OpenAI, strengthening its footprint within the enterprise artificial intelligence infrastructure. Snowflake also disclosed intentions to purchase Natoma, an emerging AI firm, though financial details remain undisclosed.
These strategic initiatives broaden Snowflake’s presence throughout the AI landscape — spanning both cloud computing infrastructure and practical AI application development.
During the earnings call, leadership acknowledged potential headwinds. Escalating AI infrastructure costs and execution risks related to scaling recently launched products were identified as areas requiring close monitoring.
Snowflake continues to operate at a loss on a trailing twelve-month basis. Nevertheless, analysts currently project the company will achieve profitability during the current fiscal year, with consensus EPS estimates of $2.83 for FY2027.
InvestingPro noted that the stock may be trading above fair value at present levels, despite the strong earnings performance and elevated guidance.
Year-to-date, SNOW shares have advanced 9.04%, with the company’s market capitalization standing at approximately $60.75 billion based on recent trading data.
TLDR:
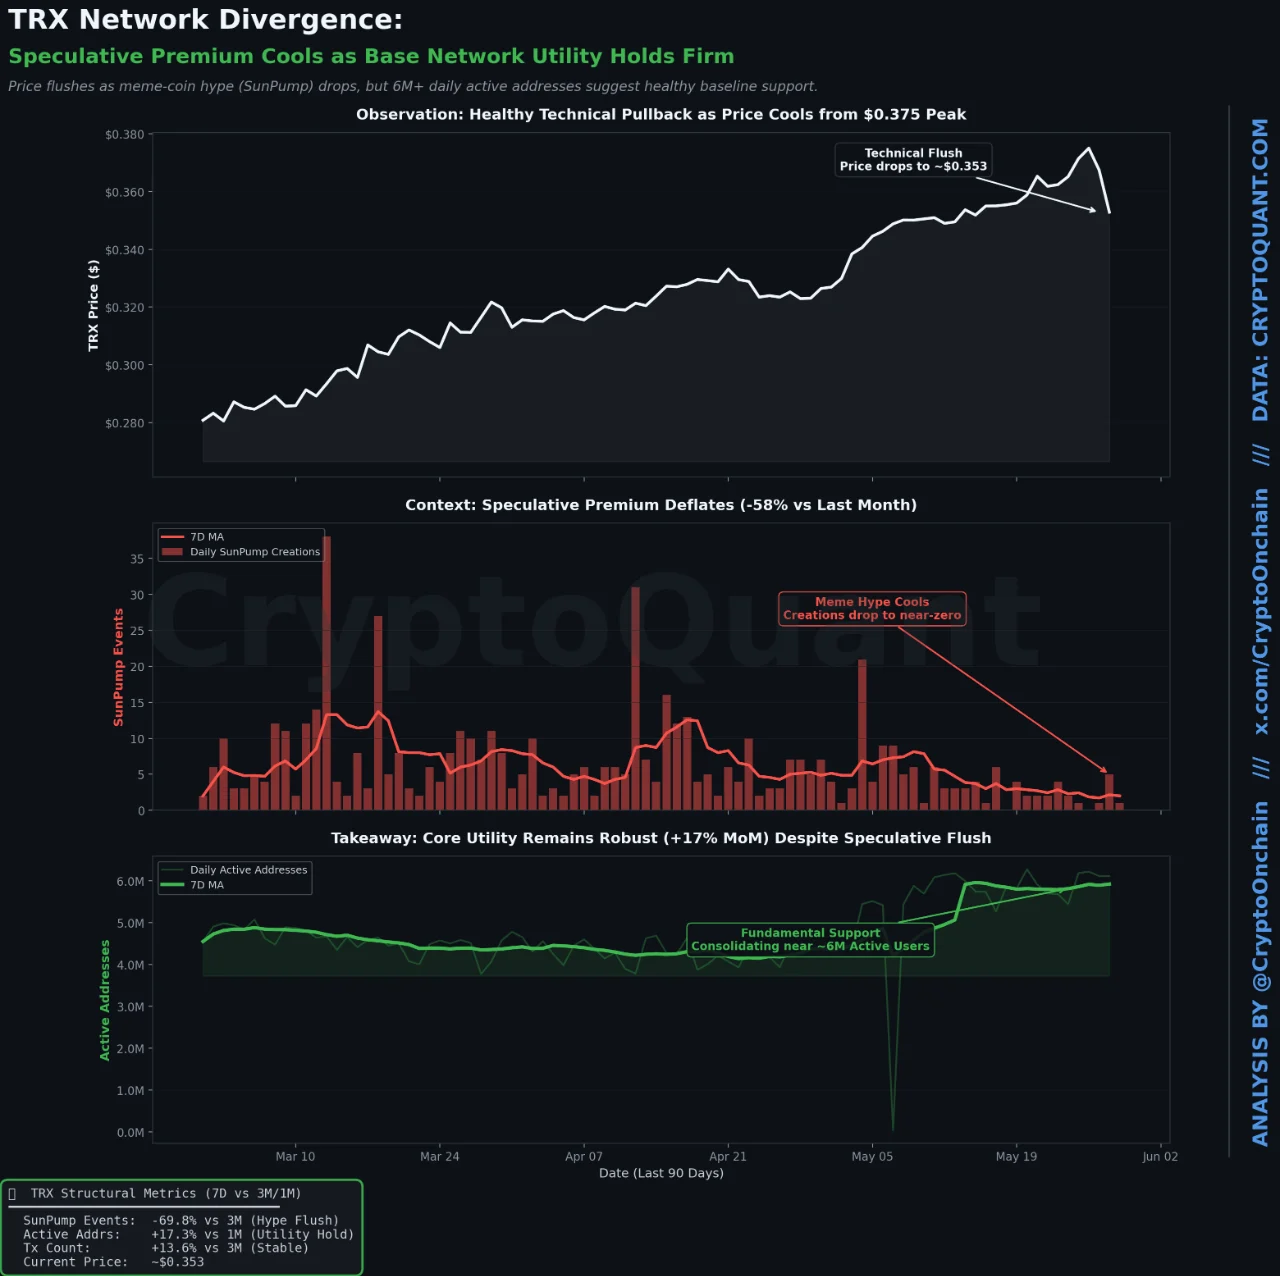
- TRX price dropped from $0.375 to $0.346, resetting the daily RSI from above 74 down to nearly 43.
- SunPump Token Create Events collapsed nearly 70% vs. its three-month baseline, signaling fading meme-coin hype.
- TRON active addresses rose 17% month-over-month, holding a strong daily average of roughly 6 million users.
- Tron Inc. bought 141,433 TRX at $0.3535, pushing total treasury holdings past 698 million TRX tokens.
TRX, the native token of the TRON blockchain, has retreated sharply over the past 48 hours. The price has slid from a local high near $0.375 to around $0.346.
Alongside this drop, the RSI on the daily chart has reset from overbought levels above 74 to approximately 43.
On-chain data, however, tells a more nuanced story — one where base utility continues to hold even as speculative activity cools.
SunPump Activity Collapses as Meme-Coin Hype Retreats
The most telling signal behind this TRX correction is the steep decline in meme-coin creation on the TRON ecosystem.
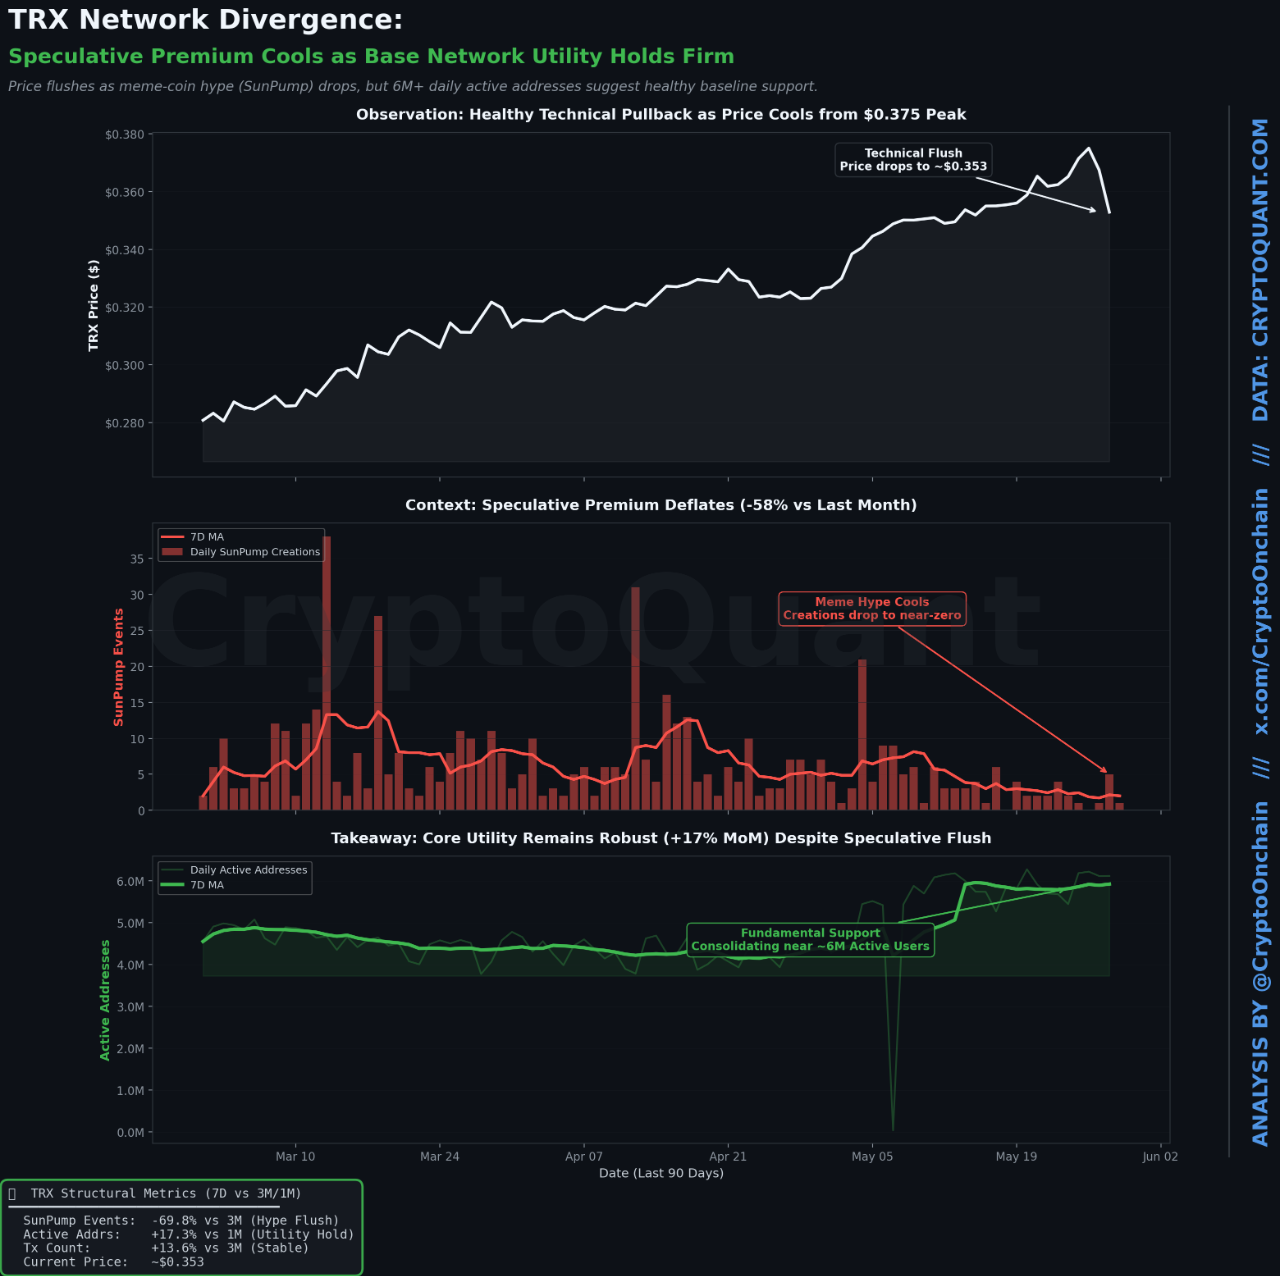
SunPump Token Create Event Count has fallen by 58% compared to last month. Against its three-month baseline, the drop is even steeper — nearly 70%, with near-zero events recorded in recent days.
This kind of speculative pullback is not unusual following a sharp price run-up. Markets often attract short-term participants drawn by momentum rather than fundamentals. When that momentum fades, token creation activity tends to dry up alongside it.
Source: Cryptoquant
What makes this particular data point relevant is that SunPump activity had been one of the visible drivers of elevated TRX sentiment. As that layer of hype deflates, the price naturally adjusts to reflect a lower speculative premium on the asset.
The sharp decline in meme-coin events does not mean the TRON network is losing users or transaction volume. It simply removes a layer of froth that had been priced into TRX during the run-up phase.
Active Addresses and Transaction Volume Remain on Solid Ground
Despite the retreat in speculative metrics, TRON’s core usage data has held firm. Active addresses have actually grown by 17% over the past month. The network continues to process a strong daily average of roughly 6 million active addresses.
Total daily transaction counts are also stable, maintaining more than 12 million transactions per day. This level of consistent on-chain activity points to a network that is still in active use beyond the meme-coin cycle.
Adding another layer to the picture, Tron Inc. (NASDAQ: TRON) disclosed a fresh treasury purchase. The company acquired 141,433 TRX tokens at an average price of $0.3535, bringing its total TRX treasury holdings to over 698 million TRX. The move reflects ongoing institutional conviction in the token even through the price correction.
This structural divergence — collapsing speculative activity alongside stable core usage — sets up a potential reset toward sustainable pricing.
Traders are now watching whether the $0.34 zone can establish itself as a fundamental support level rather than a temporary liquidity flush.

Matthew Perry Fans Can Soon Own A Piece Of His Legacy

Chris Hansen has cryptic response to Robert Pattinson playing him in To Catch A Predator movie

A Practical Guide for Modern Business Leaders


-

 Business5 days ago
NYT Strands Answers May 24 2026 Revealed for Puzzle No. 812 Theme Summer Essentials
-

 Politics4 days ago
Bridgerton Season 5: Cast, Release Date And Everything We Know So Far
-

 Crypto World6 days ago
Robinhood crypto COO Tanya Denisova exits
-

 Tech4 days ago
Microsoft’s quiet Claude Code retreat and the real cost of enterprise AI
-

 Business3 days ago
Selena Gomez Reportedly Upset Over Benny Blanco’s Comments on Her ‘Terrible’ Diet
-
Crypto World3 days ago
Micron Crosses $1 Trillion Market Cap as AI Demand Reshapes Memory Sector
-

 Politics7 days ago
Makerfield: a tale of two social-media histories
-

 Business4 days ago
BTS Sells Out Four Las Vegas Shows at Allegiant Stadium for ARIRANG World Tour
-
Tech2 days ago
The Samsung pay deal is the moment Korean unions changed register
-

 Tech4 days ago
Westone Audio and Etymotic Acquired by Fidelity Collective in Major IEM Market Move
-

 Tech14 hours ago
Waymo dominates autonomous vehicle registrations as Tesla trails behind
-

 Tech3 days ago
Millions of AI agents imperiled by critical vulnerability in open source package
-
 Crypto World4 days ago
Nvidia (NVDA) CEO Calls on Super Micro to Strengthen Export Controls Amid Smuggling Probe
-
 Tech4 days ago
China assigns ID codes to 28,000+ humanoid robots
-
Crypto World2 days ago
SpaceX’s $2 Trillion IPO: Why Tech Giants Nvidia (NVDA), Apple (AAPL), and Microsoft (MSFT) May Face Pressure
-

 Tech2 days ago
NASA taps Blue Origin to deliver lunar rovers for Moon Base initiative
-
 Entertainment4 days ago
‘Breaking Bad’ Star’s Easy-to-Binge 6-Part Crime Series Spin-Off Is Finally Heading to Free Streaming
-
Crypto World5 days ago
Brian Armstrong Outlines Crypto Vision for the Future Financial System
-

 Business4 days ago
Yatra Online, Inc. 2026 Q4 – Results – Earnings Call Presentation (NASDAQ:YTRA) 2026-05-25
-

 Crypto World3 days ago
Spain blocks prediction markets Polymarket Kalshi
You must be logged in to post a comment Login