

Crypto World
Solana price prediction as tokenized assets drive network activity to record highs

Solana has extended its July rally after record on-chain activity, tokenized stock issuance, and steady ETF inflows revived bullish sentiment.
Summary
- Solana climbed above $81 after tokenized stock issuance and record network activity boosted buying interest.
- Technical charts show bulls defending $80 support while traders watch $83 and $90 as the next resistance levels.
- Analysts remain optimistic on long-term upside, though macro risks and liquidity could limit near-term gains.
According to data from crypto.news, Solana (SOL) extended its recovery this week, gaining roughly 11% over several sessions to trade around $81 after briefly reclaiming the $82 level. The rally accelerated as institutional adoption on the network continued to expand, led by Securitize tokenizing $295 million worth of New York Stock Exchange-listed common stock on Solana following its SPAC debut.
The development arrived alongside the launch of the Solana Foundation’s Governance Proposals framework, introducing formal on-chain validator voting and adding another utility milestone for the ecosystem.
Network activity has expanded at the same time. Solana processed more than one billion weekly non-vote transactions for the first time, while tokenized asset spot volume reached an all-time quarterly high of $5.77 billion, reinforcing the network’s growing role in real-world asset issuance.
Institutional demand also remained positive, with spot Solana ETFs recording approximately $5.75 million in net inflows even as several other crypto investment products experienced persistent capital outflows.
Technical structure has shifted back in favor of buyers
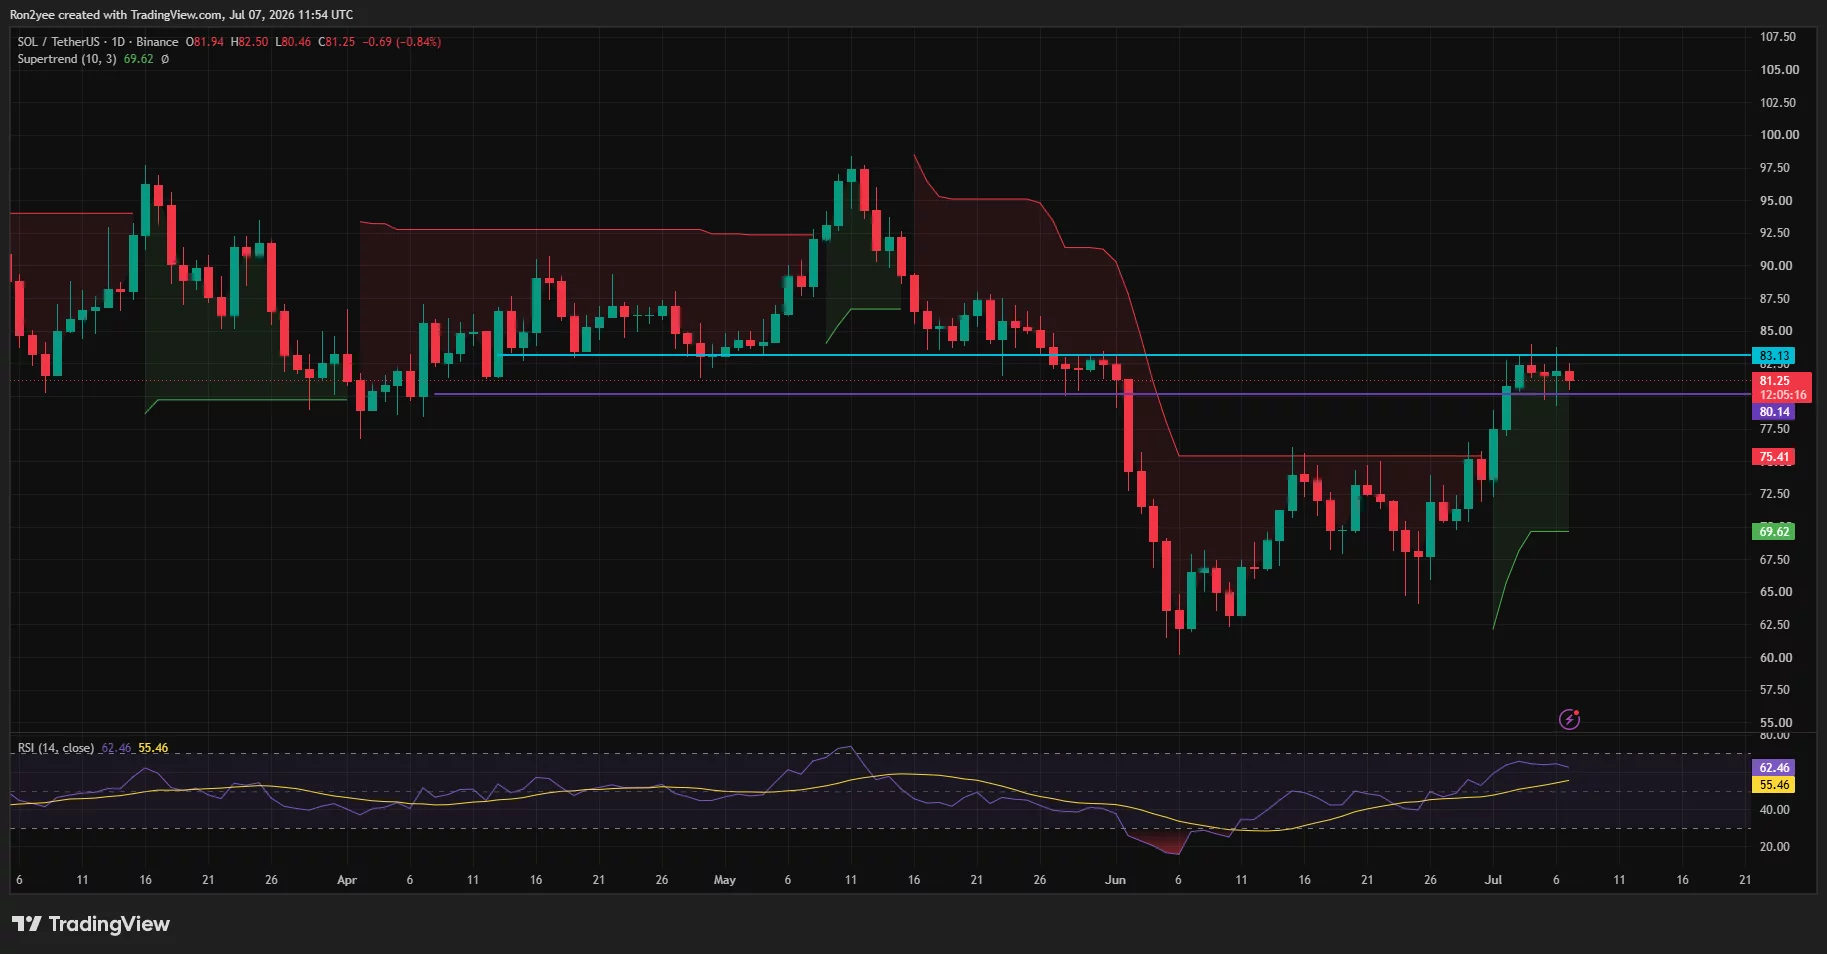
The daily chart shows Solana recovering from its June selloff after buyers defended the long-term support zone near $73, close to the 0.786 Fibonacci retracement level referenced by many traders during last month’s decline. Price has now reclaimed the previous breakdown area around $80.14 and is attempting to convert it into support while approaching horizontal resistance near $83.13.
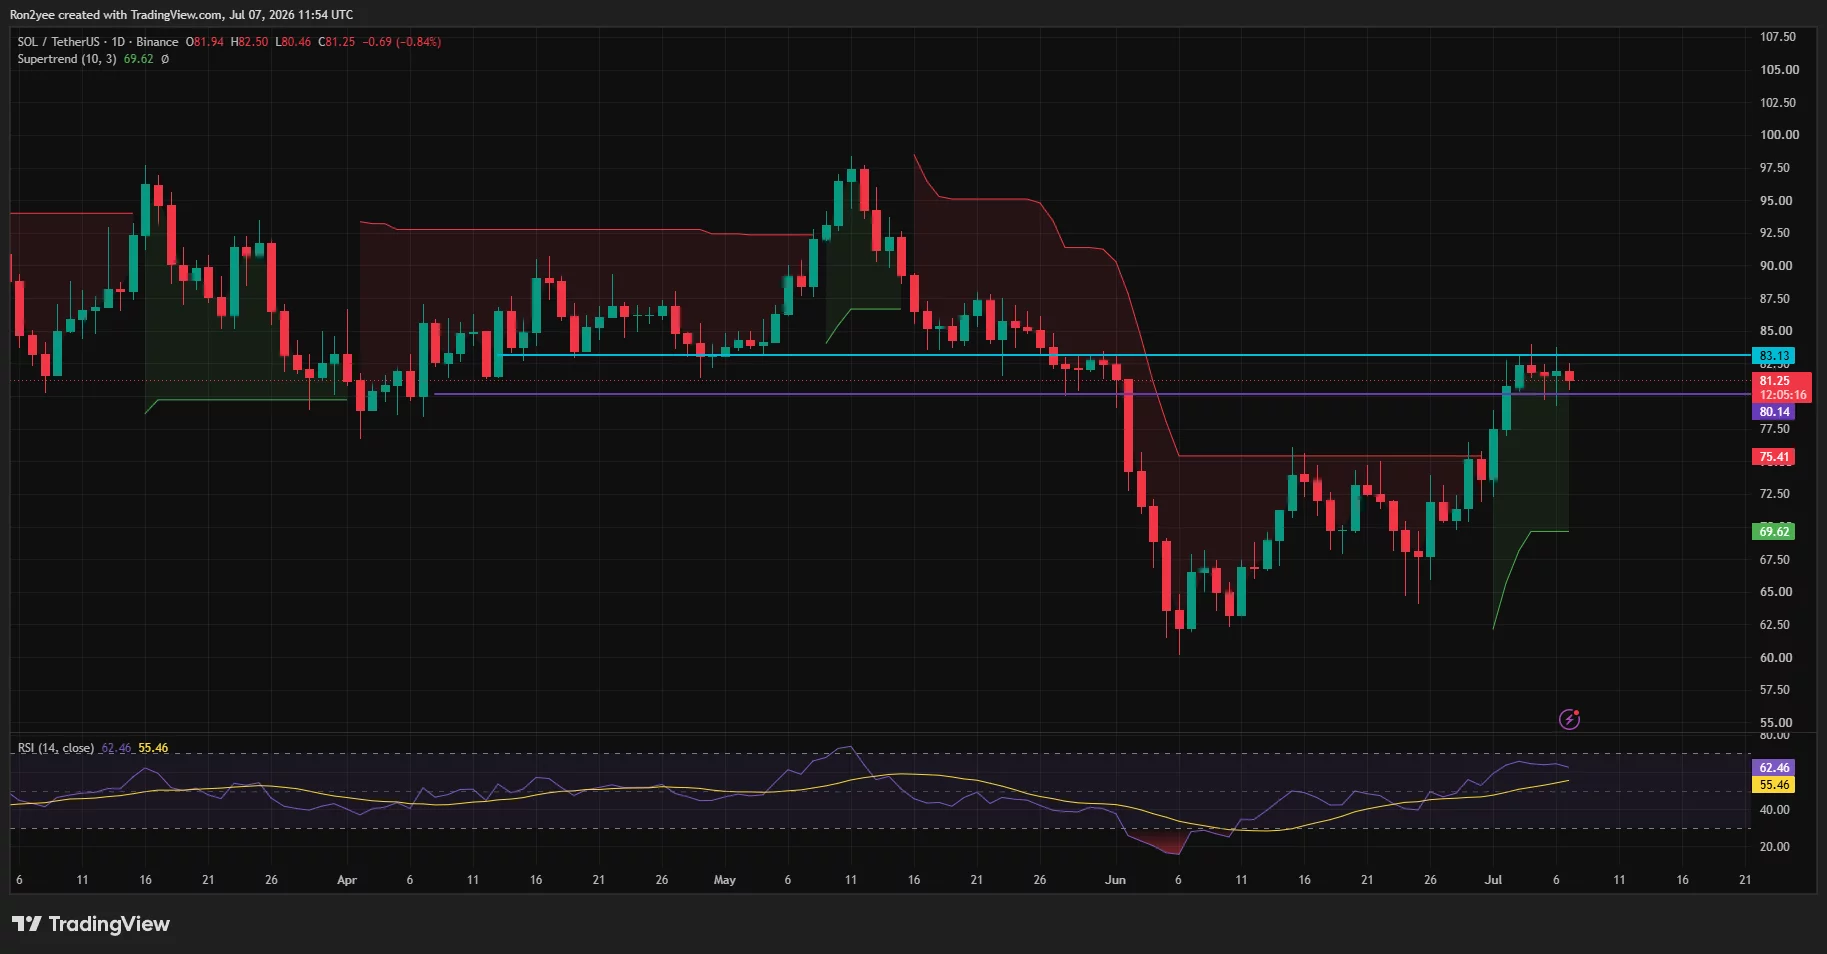
Momentum indicators have improved alongside the rebound. The daily RSI has climbed above 62 after recovering from oversold conditions in June, while the Supertrend indicator has remained bullish with dynamic support near $69.6. A successful close above $83 could expose the next resistance around $90, whereas failure to hold above $80 may invite another test of the $75.4 support region.
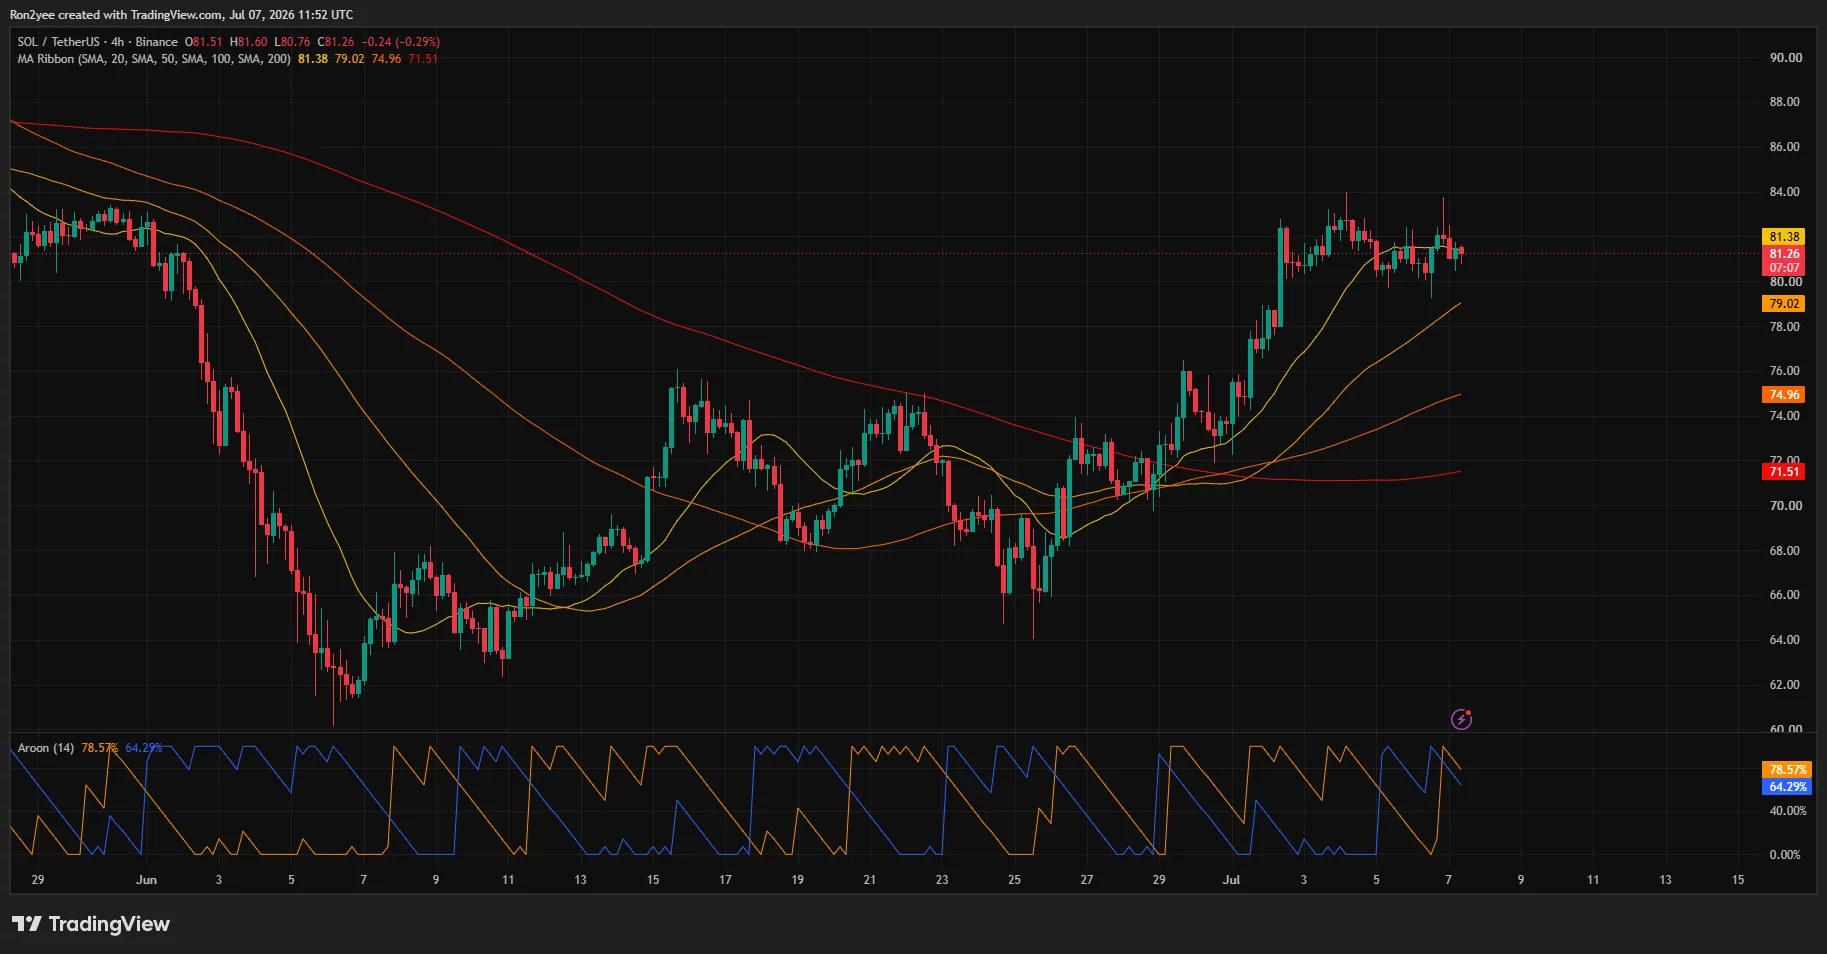
Shorter-term charts also favor bulls. On the 4-hour timeframe, SOL continues trading above its 20-, 50-, 100- and 200-period moving averages, with the 20 SMA near $81.4 providing immediate dynamic support. The moving average alignment remains constructive even as price has entered a brief consolidation after last week’s sharp advance. The Aroon indicator still favors buyers, although the slight decline in Aroon Up suggests momentum has slowed while the market waits for another catalyst.
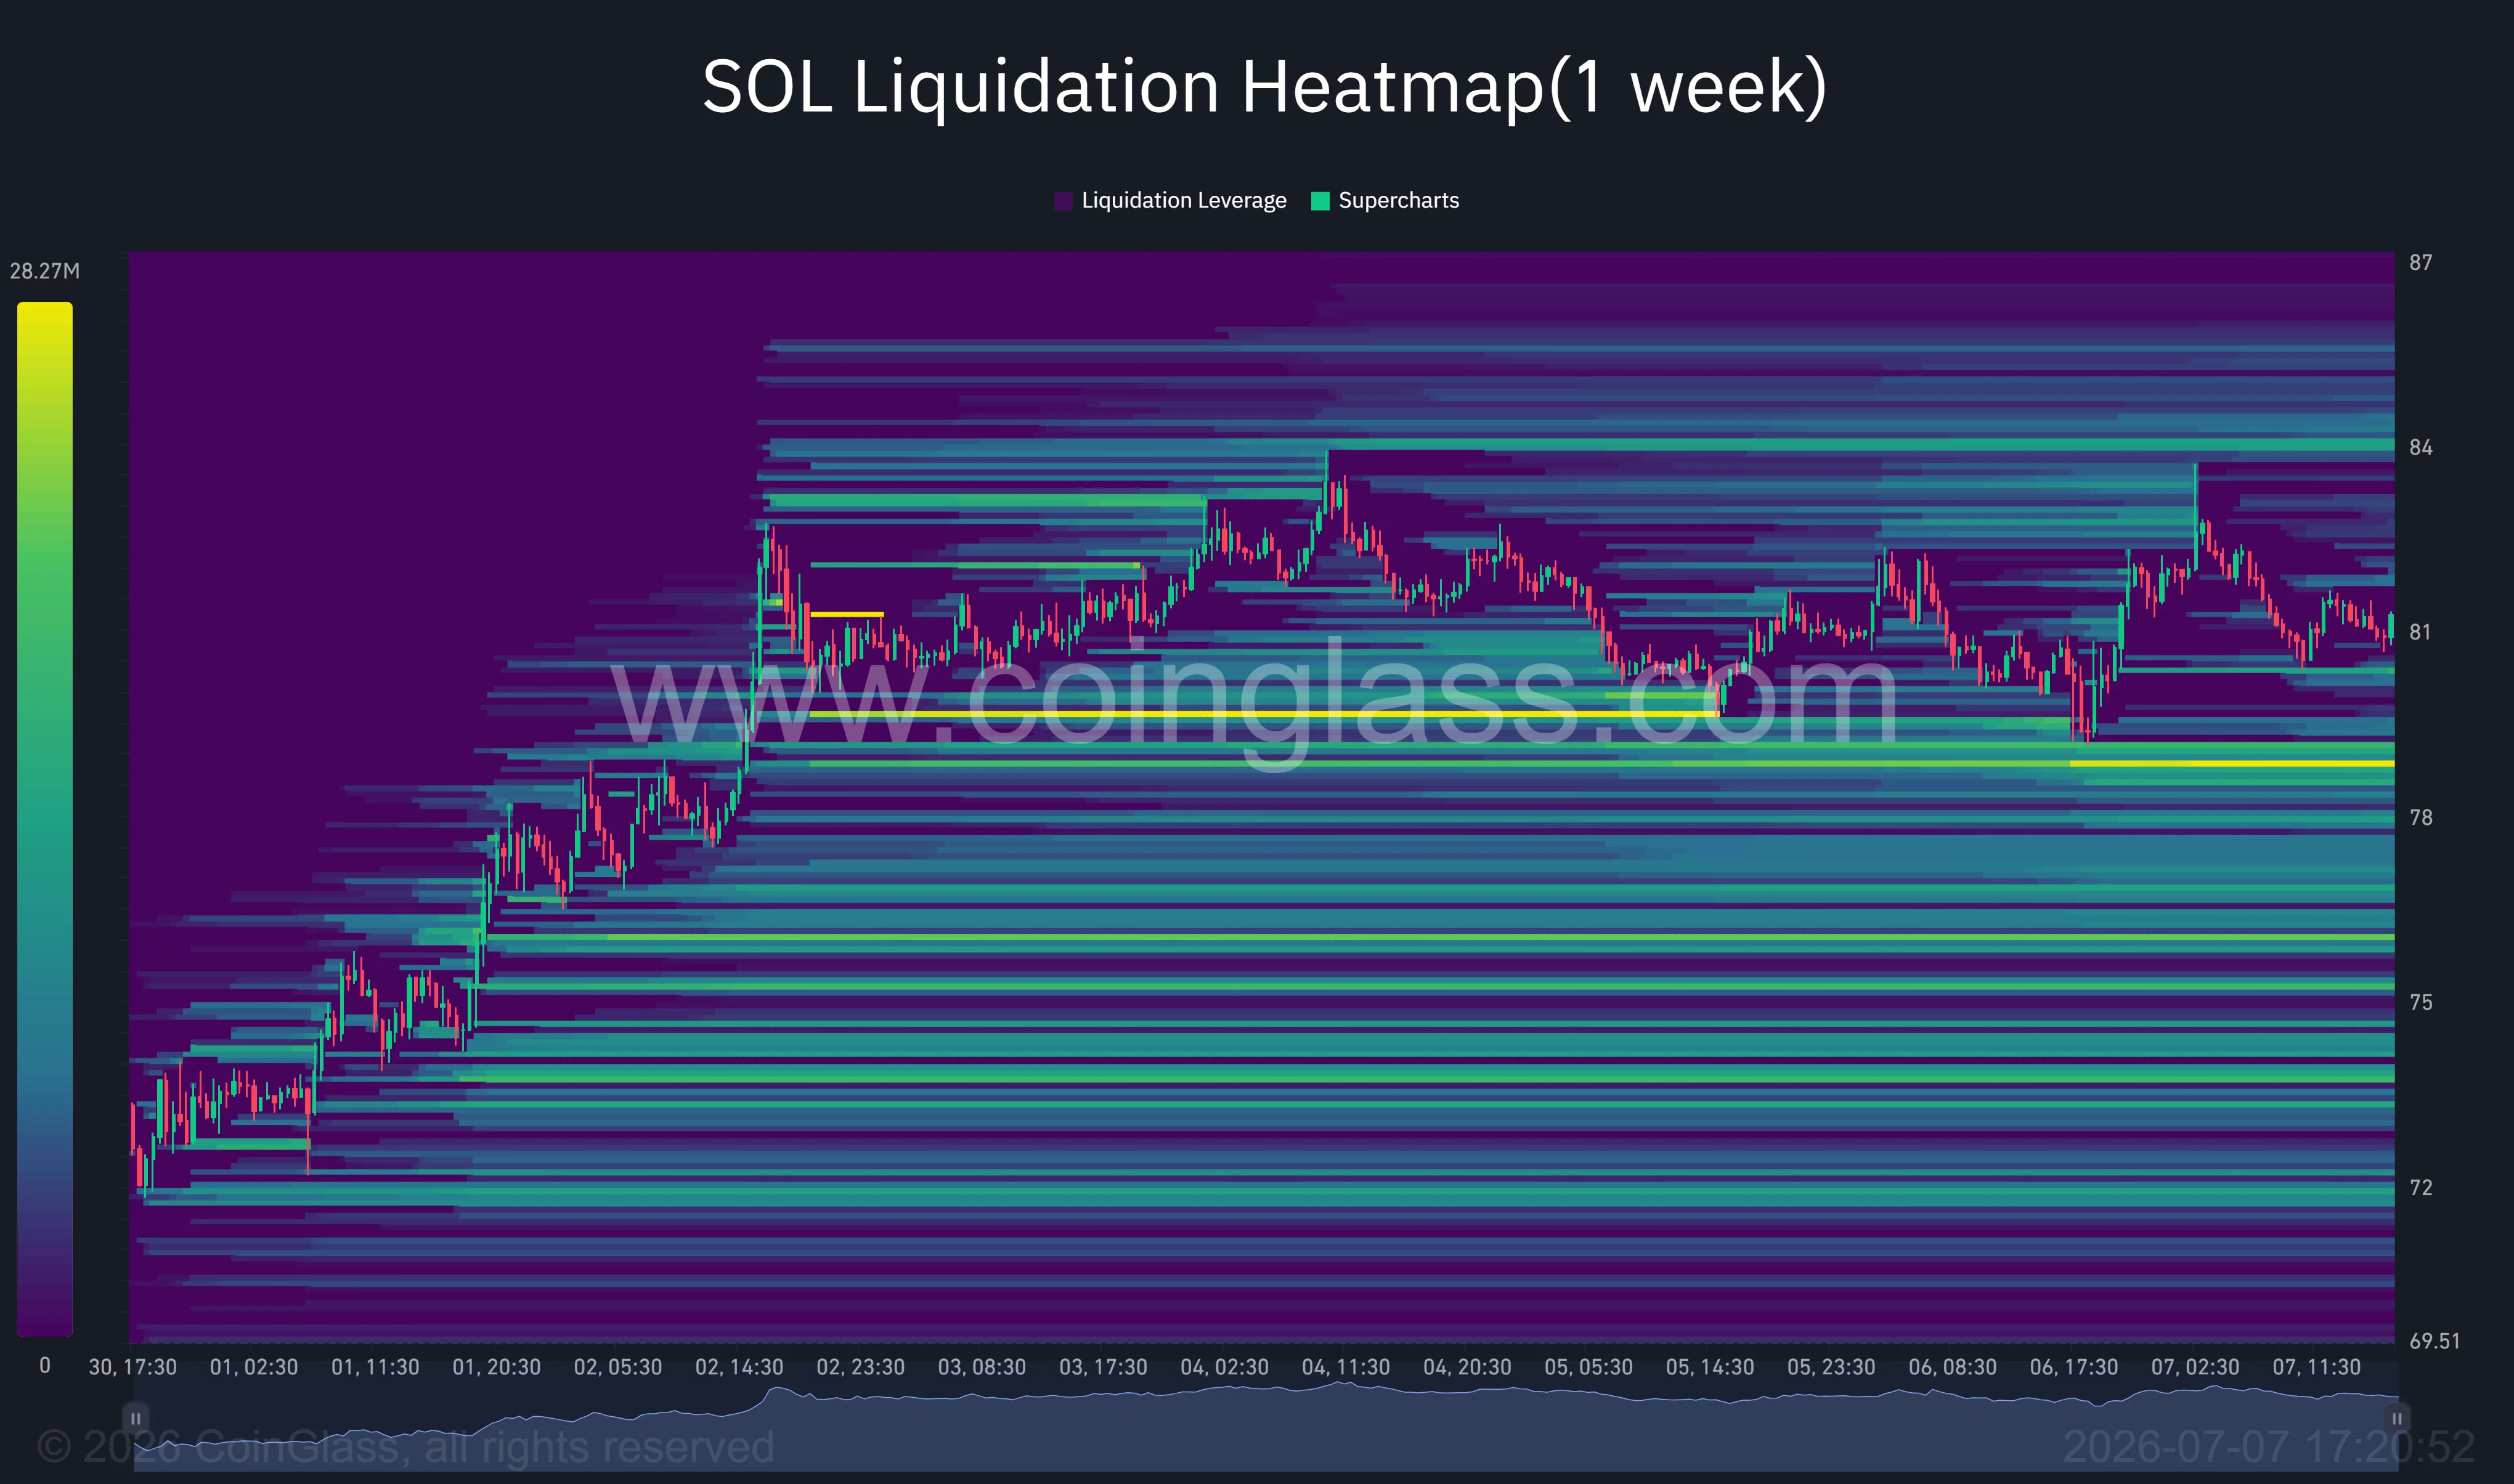
Derivatives positioning presents a similar picture. CoinGlass liquidation heatmaps show one of the largest nearby short liquidation clusters sitting around the $84 level. A decisive move through that zone could trigger forced short covering and accelerate upside toward the upper liquidity pocket near $87. On the downside, dense long liquidation levels have accumulated between $78 and $79, making that area an important support if profit-taking intensifies.
Analysts target triple-digit prices while key resistance remains intact
Market participants have also become more optimistic after Solana strengthened against Bitcoin. Commenting on the latest structure, analyst Michaël van de Poppe wrote that SOL “is still in an uptrend here,” adding that it has broken its year-long downtrend versus Bitcoin.
“I don’t think that we’ll stall, I do think that we’ll continue to see strength happening here,” he wrote, adding that he would buy lower levels if a deeper correction develops before concluding that “it’s a matter of time until $SOL regains the $100+ levels.”
Despite the improving technical backdrop, Solana remains roughly 74% below its all-time high near $293 and more than 40% lower year to date. Macro uncertainty surrounding future Federal Reserve policy, geopolitical risks, and relatively thin crypto spot liquidity continues to limit aggressive positioning. Until bulls establish sustained closes above the $90 and $100 resistance zones, the current recovery is likely to remain vulnerable to renewed selling pressure despite the network’s strengthening institutional fundamentals.
Disclosure: This article does not represent investment advice. The content and materials featured on this page are for educational purposes only.

Futures for the Dow Jones Industrial Average and the other major stock indexes traded mixed ahead of Tuesday’s open. Nasdaq-100 futures dropped in overnight trading after South Korean memory giant Samsung Electronics reported preliminary earnings. Astera Labs (ALAB), Bloom Energy (BE), Nvidia (NVDA) and Tesla (TSLA) were winners Monday. Space Exploration Technologies (SPCX), known as SpaceX, dropped ahead of its…
Copyright ©2026 Investor’s Business Daily, LLC. All rights reserved. 87990cbe856818d5eddac44c7b1cdeb8
Crypto World
Apple (AAPL) Inks Massive $30B+ Chip Deal with Broadcom (AVGO) for Domestic Manufacturing

Key Highlights
- Apple has entered into a major multiyear partnership with Broadcom exceeding $30 billion in value, focused on custom semiconductor components and wireless connectivity solutions.
- Over 15 billion chips will be manufactured domestically as part of this arrangement.
- Broadcom plans to commit $1.5 billion toward upgrading its Fort Collins, Colorado production plant.
- The agreement centers on FBAR radio frequency filtering technology, a product line the two companies have jointly engineered since 2023 at minimum.
- This represents Apple’s most substantial American Manufacturing Program (AMP) initiative yet, contributing to its comprehensive $600 billion domestic investment plan spanning four years.
Apple has finalized its most significant U.S.-based manufacturing partnership to date, entering into a multiyear collaboration with Broadcom valued at over $30 billion to manufacture specialized semiconductors and wireless components domestically.
Revealed this Wednesday, the partnership will lead to the domestic fabrication of no fewer than 15 billion semiconductor units, creating employment opportunities for hundreds of Americans throughout the manufacturing ecosystem.
Shares of Apple (AAPL) declined 0.64% during trading, while Broadcom (AVGO) dropped 0.83%, though neither movement seemed directly connected to the partnership reveal.
Broadcom initially revealed the extended supply arrangement this past Monday, verifying it had finalized a contract with Apple extending to 2031. Wednesday’s statement provided the comprehensive specifics.
The semiconductors forming the partnership’s foundation are FBAR filters — specialized radio frequency elements that enable wireless connectivity in Apple’s product lineup. The two technology giants have jointly developed these components since 2023 or earlier.
This partnership falls under Apple’s American Manufacturing Program, an initiative the corporation introduced previously to strengthen domestic supply chain capabilities. This latest agreement represents Apple’s most significant undertaking within that framework.
To accommodate the increased manufacturing capacity, Broadcom will allocate $1.5 billion for renovating and enhancing its Fort Collins, Colorado manufacturing campus. This location will manufacture the FBAR filters alongside other sophisticated wireless connectivity solutions.
Tim Cook described the Fort Collins-produced components as “essential to delivering the incredible performance and connectivity our customers expect.” He additionally expressed appreciation to the Trump administration for backing the initiative.
Broadcom’s CEO Hock Tan stated the company is “pleased to expand our manufacturing footprint in Fort Collins,” emphasizing that the facility manufactures technology that “connects people around the world.”
Apple’s $600 Billion Domestic Investment Strategy
The Broadcom deal forms part of a broader financial pledge Apple has undertaken regarding the American economy. The technology leader has committed to directing $600 billion domestically across four years, encompassing manufacturing operations, employment generation, and technological advancement.
Wednesday’s revelation furthers Apple’s declared objective of establishing a comprehensive silicon supply infrastructure within U.S. borders — an initiative that has gained increased importance amid continuing trade tensions and tariff considerations.
A Multi-Decade Collaboration
Apple and Broadcom have maintained a collaborative relationship spanning many years, with Broadcom furnishing wireless semiconductor solutions utilized throughout iPhone models and additional Apple hardware. This latest agreement substantially strengthens that partnership and prolongs it considerably into the coming decade.
The supply contract running through 2031 provides Broadcom with demand forecasting certainty and validates the capital expenditure in Colorado. From Apple’s perspective, it secures a reliable domestic supplier for critical components during a period when American semiconductor production capacity ranks as a strategic imperative.
Apple verified the partnership on Wednesday, July 8, 2026, with manufacturing of the Fort Collins-produced components anticipated to expand across multiple Apple product categories moving forward.

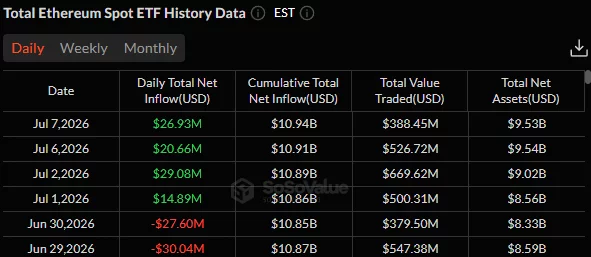
Ethereum has weakened for a second straight session as a bearish rounding-top pattern and renewed selling pressure threaten a move toward $1,650.
Summary
- Ethereum fell below $1,750 after failing to break above key resistance near the 50-day EMA around $1,800.
- A bearish rounding-top pattern, weakening momentum indicators, and liquidation clusters point to $1,650 as the next support.
- Despite four straight days of spot ETF inflows, analysts say the recent rally has been driven mainly by spot demand rather than leverage.
According to data from crypto.news, Ethereum (ETH) was trading near $1,737 at press time, down nearly 2% over the past 24 hours after a wallet linked to a large holder transferred roughly $26.9 million worth of Ether to a centralized exchange.
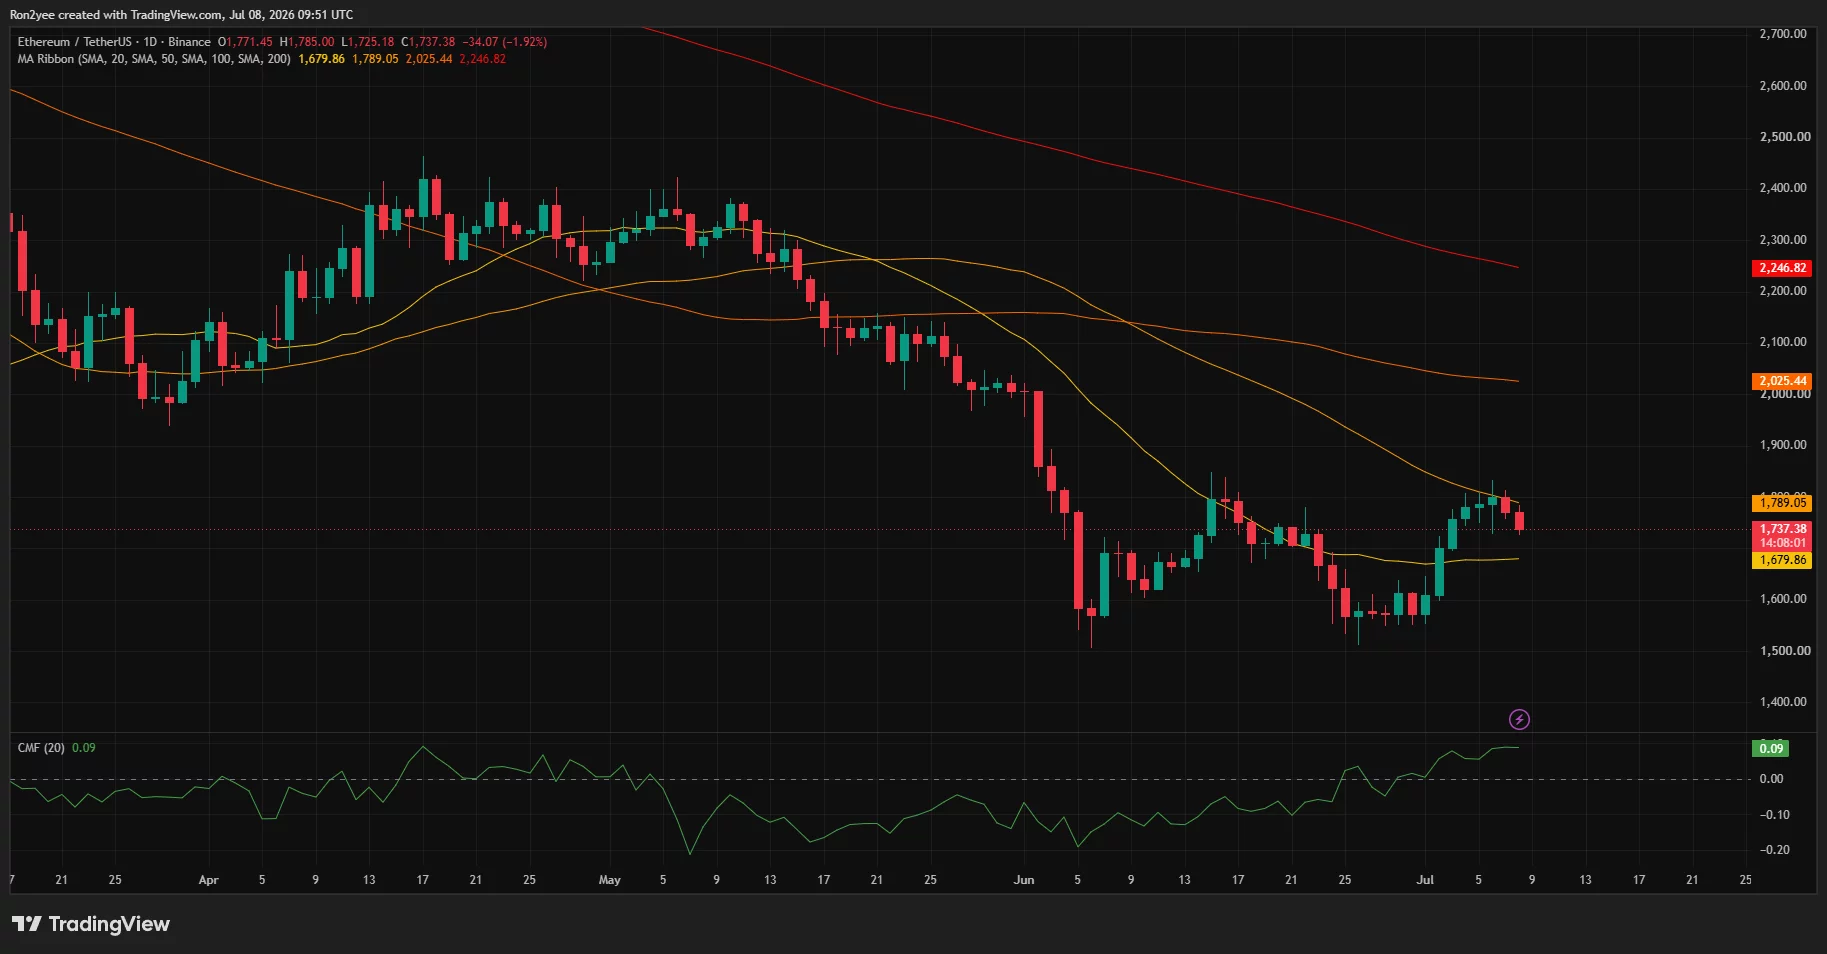
The move triggered fresh profit-taking after Ethereum’s recent recovery stalled just below a major technical resistance zone between $1,800 and $1,806, where the daily Supertrend indicator and the 50-day exponential moving average converged.
Geopolitical tensions have added another layer of pressure. Oil prices climbed after fresh U.S. military action targeting Iranian energy infrastructure, reviving inflation concerns and lifting Treasury yields. Risk assets weakened across global markets as technology stocks retreated, with cryptocurrencies moving lower alongside equities.
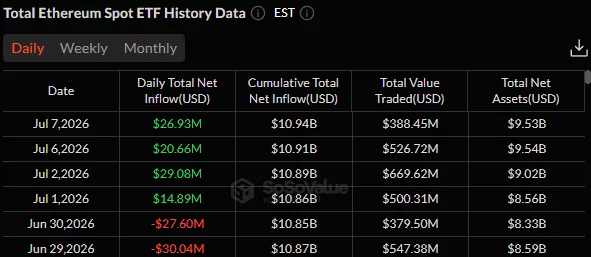
Exchange-traded fund demand has nevertheless remained constructive. U.S. spot Ethereum ETFs have now posted four consecutive days of net inflows, while Coinbase Premium has continued recovering from recent lows, suggesting institutional demand has improved even as price struggles to reclaim overhead resistance.
Derivatives positioning also paints a mixed picture. According to analyst Rain, Ethereum’s recent advance has come primarily from spot buying rather than leveraged speculation.
“$ETH is up 10% this week and open interest barely moved: the actual signal,” Rain wrote on X. “Leverage ratio hasn’t recovered from June, this bounce comes from spot demand.”
Rain added that net taker volume turned positive on June 28, while roughly $76.2 million in positions were liquidated over the past day, with long traders accounting for most of the losses after ETH failed to hold above $1,800.
Ethereum technical structure favors a move toward $1,650
Ethereum’s 4-hour chart has formed a bearish rounding-top pattern after the recovery from late June stalled near $1,830. Price has already broken below the ascending trendline that supported the rally and slipped beneath the 61.8% Fibonacci retracement level around $1,724 after repeated rejection near the 78.6% level at roughly $1,772.
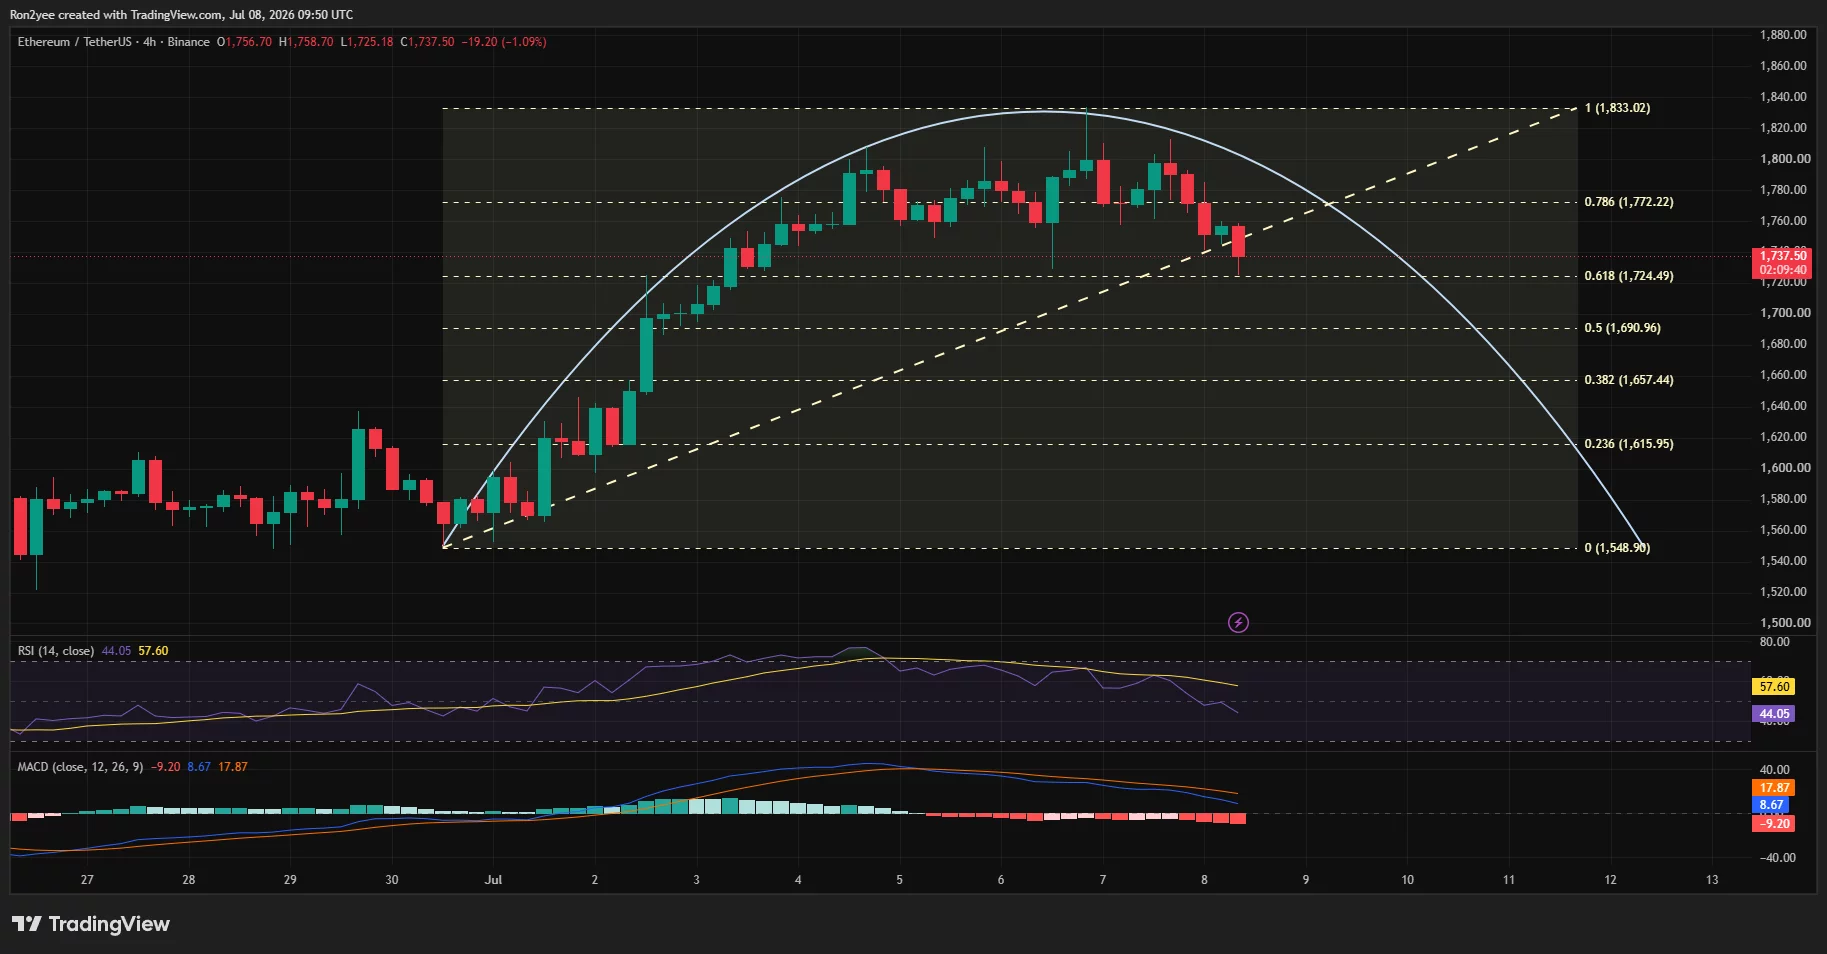
Momentum indicators have also turned weaker. The 4-hour RSI has fallen to around 44 after approaching overbought territory earlier this week, while the MACD remains below its signal line with expanding negative histogram bars. If sellers maintain control, the next major technical objective sits near the 0.382 Fibonacci retracement at approximately $1,657, aligning closely with the projected rounding-top target around $1,650.
The daily chart offers little relief for bulls. Ethereum remains below the 50-, 100-, and 200-day moving averages near $1,789, $2,025, and $2,247, respectively, keeping the medium-term trend under pressure. Chaikin Money Flow has stayed slightly above zero, suggesting spot demand has not disappeared entirely, but buyers have yet to generate enough momentum to reclaim key moving averages.
CoinGlass liquidation data also identifies an important support zone between $1,700 and $1,720, where a large concentration of leveraged long positions remains. A decisive break below that range could force another wave of liquidations and accelerate a decline toward the $1,650 region.
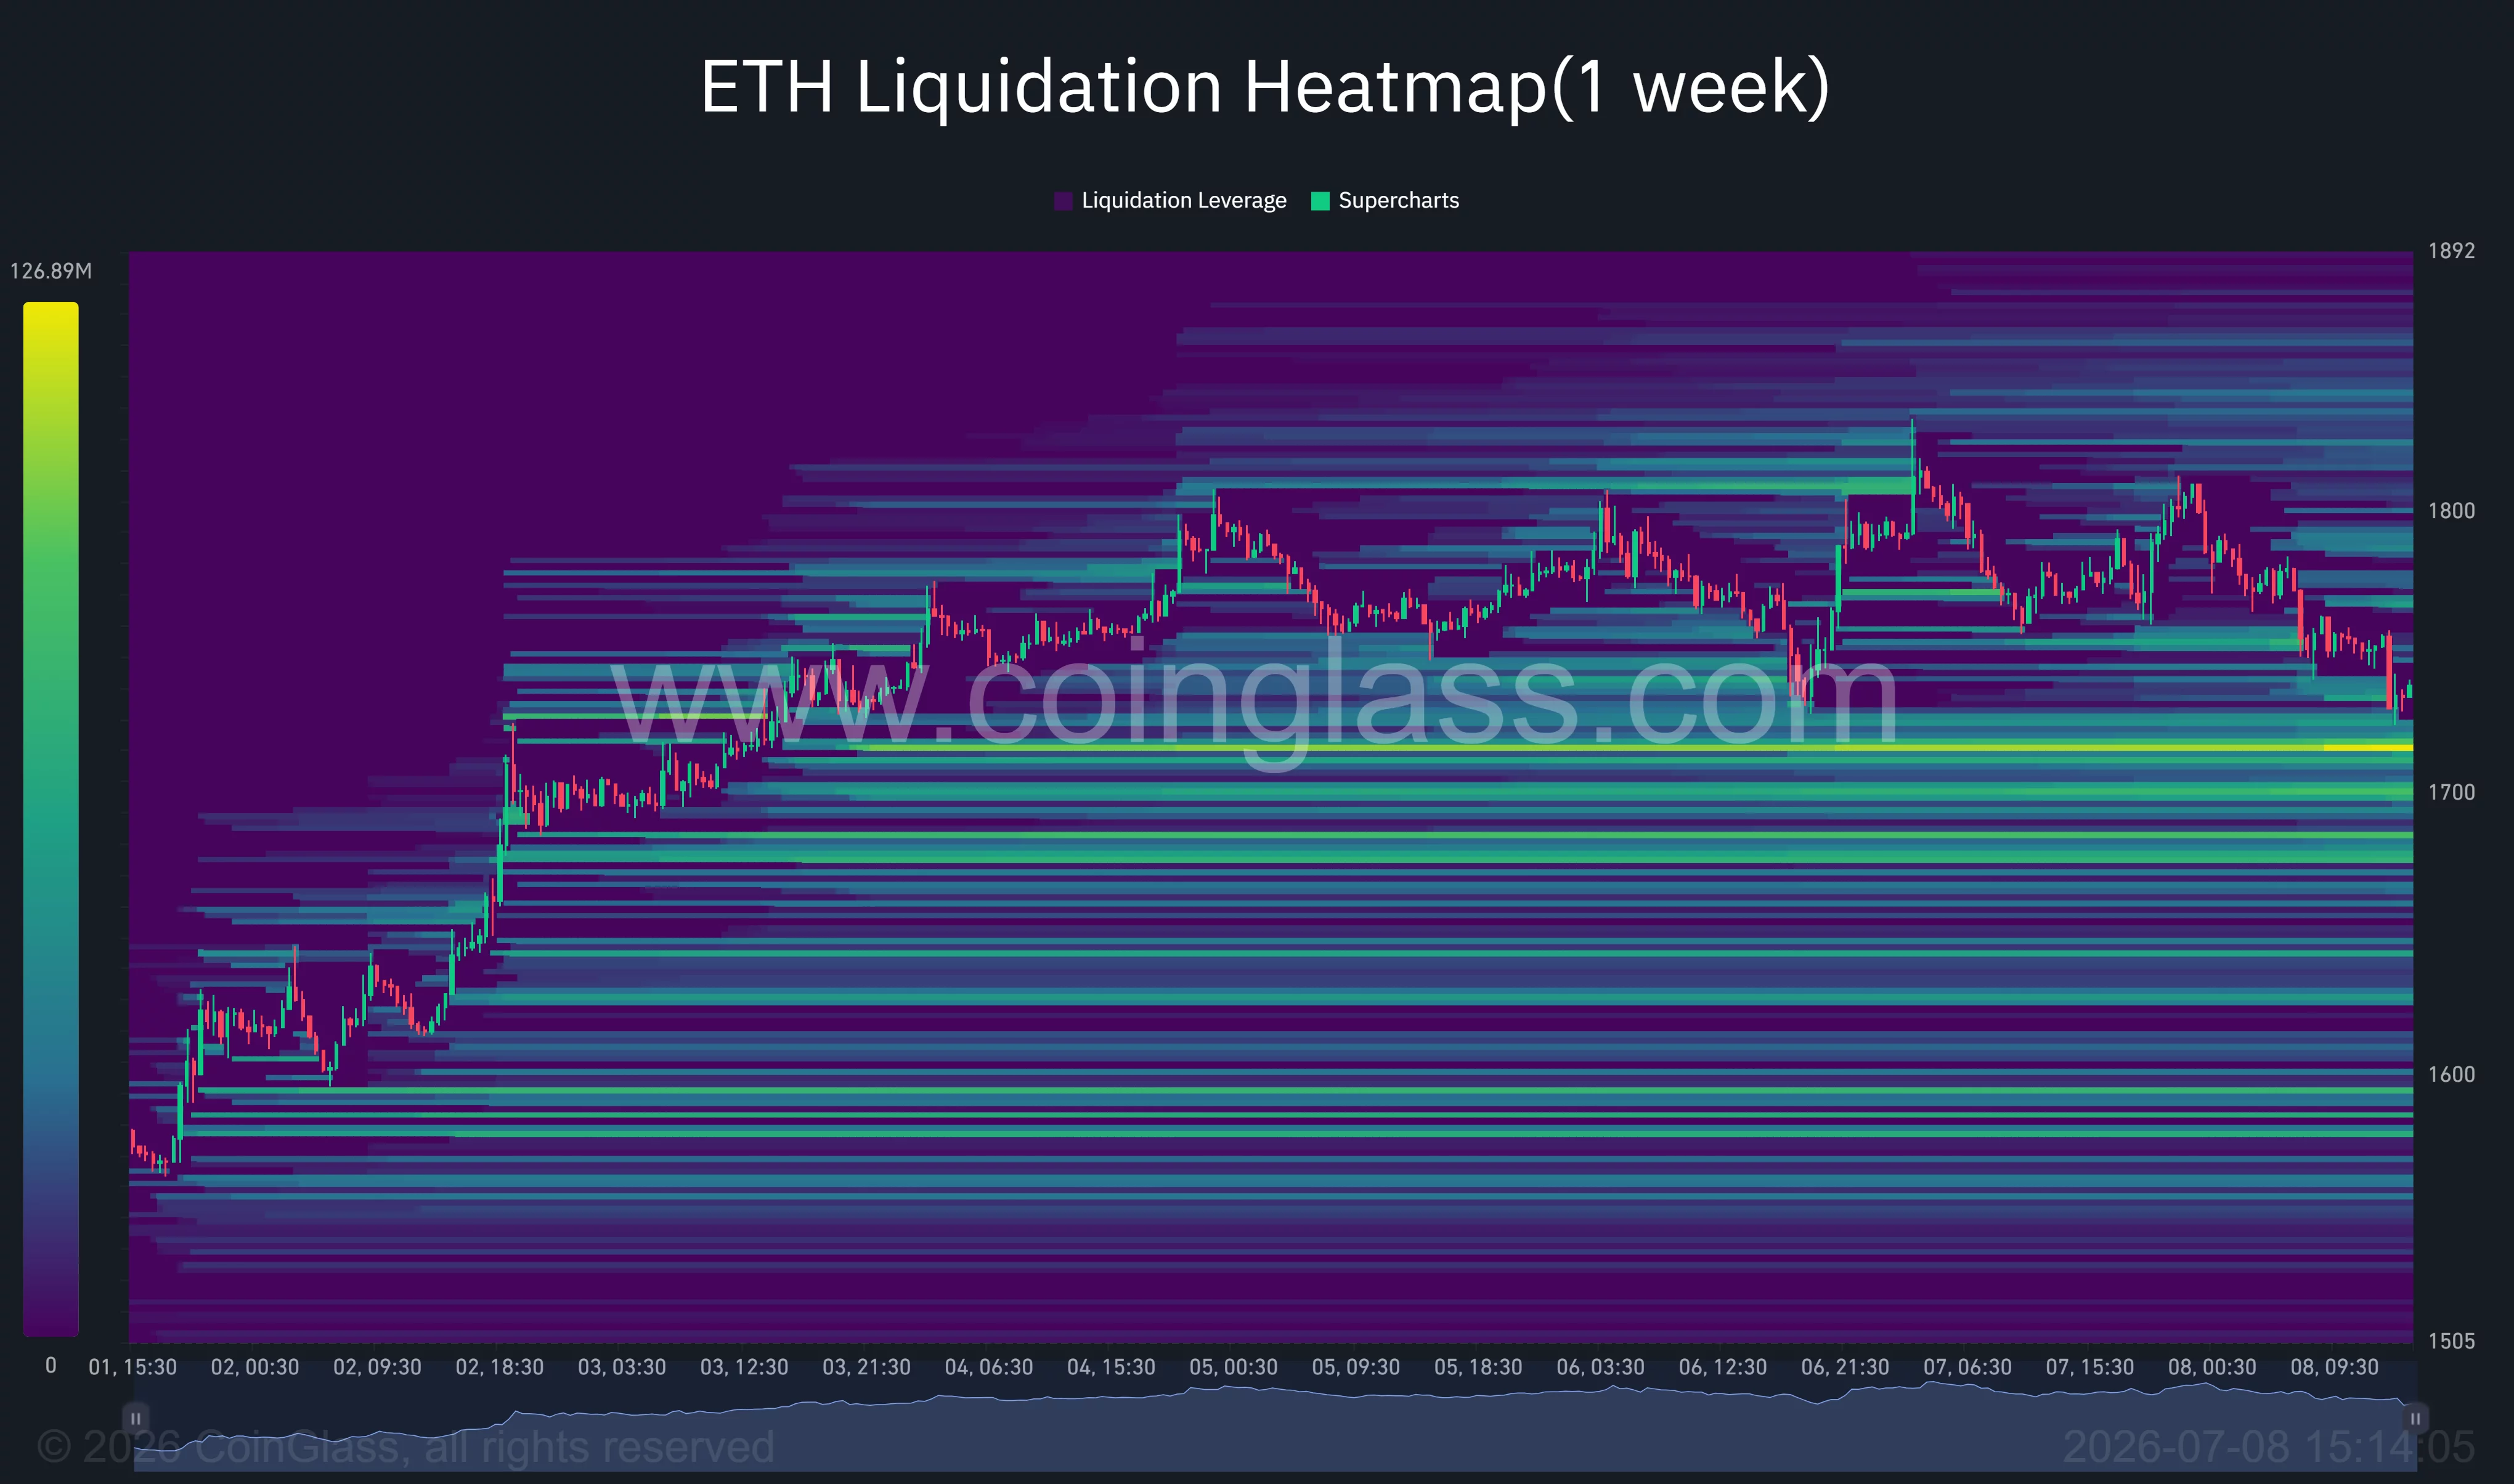
Holding above $1,700 remains critical for bulls
Analyst Ted Pillows believes Ethereum has already lost an important technical level.
“$ETH has lost the $1,750 support zone. A daily close below the level would be really bad for Ethereum.”
A sustained close below the $1,700-$1,720 support band would strengthen the bearish setup and expose Ethereum to additional losses toward $1,650, with the June low near $1,550 becoming the next major support. Renewed geopolitical tensions, elevated bond yields, or another wave of whale selling could add further pressure if risk appetite weakens again.
The bearish outlook would lose momentum if ETH quickly reclaims the $1,800-$1,806 resistance area. A breakout above that zone would invalidate the rounding-top pattern, shift attention back to the recent high near $1,833, and improve the chances of another attempt toward the psychological $1,900 level, particularly if ETF inflows continue and leverage returns to the futures market.
Disclosure: This article does not represent investment advice. The content and materials featured on this page are for educational purposes only.


The Reserve Bank of India (RBI), the country’s central bank, has reiterated its support for a cryptocurrency policy that favors a prohibition-oriented approach.
The RBI wants banks and financial institutions barred from any exposure to crypto assets and privately issued stablecoins.
Why India’s Central Bank Leans Toward Crypto Prohibition
The RBI has warned about crypto risks repeatedly and now argues for policies “leaning towards prohibition,” according to documents reviewed this week by Reuters. It wants digital assets kept outside the regulated financial system. Officials say the aim is to limit contagion risks to lenders.
The stance revives a fight the RBI lost in 2018, when a court struck down policies that had effectively banned crypto dealings. Since then, digital assets have existed in a grey zone.
Indian banks are currently allowed to engage with cryptocurrencies. However, most major lenders have stayed away from the sector after repeated cautionary statements from the RBI.
The containment line echoes caution seen across global frameworks, though most now favor regulation over isolation.
Government figures put the number of crypto traders at nearly 39 million. They held about $2.1 billion in digital assets at the end of May, according to the tax department estimates.
Follow us on X to get the latest news as it happens
Stablecoins and Offshore Trading Raise the Stakes
The RBI extended its warning to stablecoins, tokens pegged to fiat currencies. It said foreign-currency versions threaten monetary sovereignty. Rupee-backed tokens could cut the government’s currency income and strain stability during market stress.
It added that permitting stablecoins could make it harder to identify and tax cryptocurrency profits, as users would have less need to convert their holdings into fiat currencies.
Moreover, the tax department flagged offshore exchanges and private wallets as issues for tracking. Those channels make it harder to identify beneficial owners. Peer-to-peer trades in rupees also make taxable income difficult to trace.
Compliance already lags. Fewer than a quarter of the 645,000 people who traded crypto in the year ending March 2023 reported it on tax returns. India taxes crypto gains at 30% and levies a 1% tax on each trade.
The coming months will show whether the government turns the RBI’s prohibition lean into law or keeps crypto in limbo.
Subscribe to our YouTube channel to watch leaders and journalists provide expert insights
The post India’s Central Bank Renews Push to Keep Crypto Out of the Financial System appeared first on BeInCrypto.
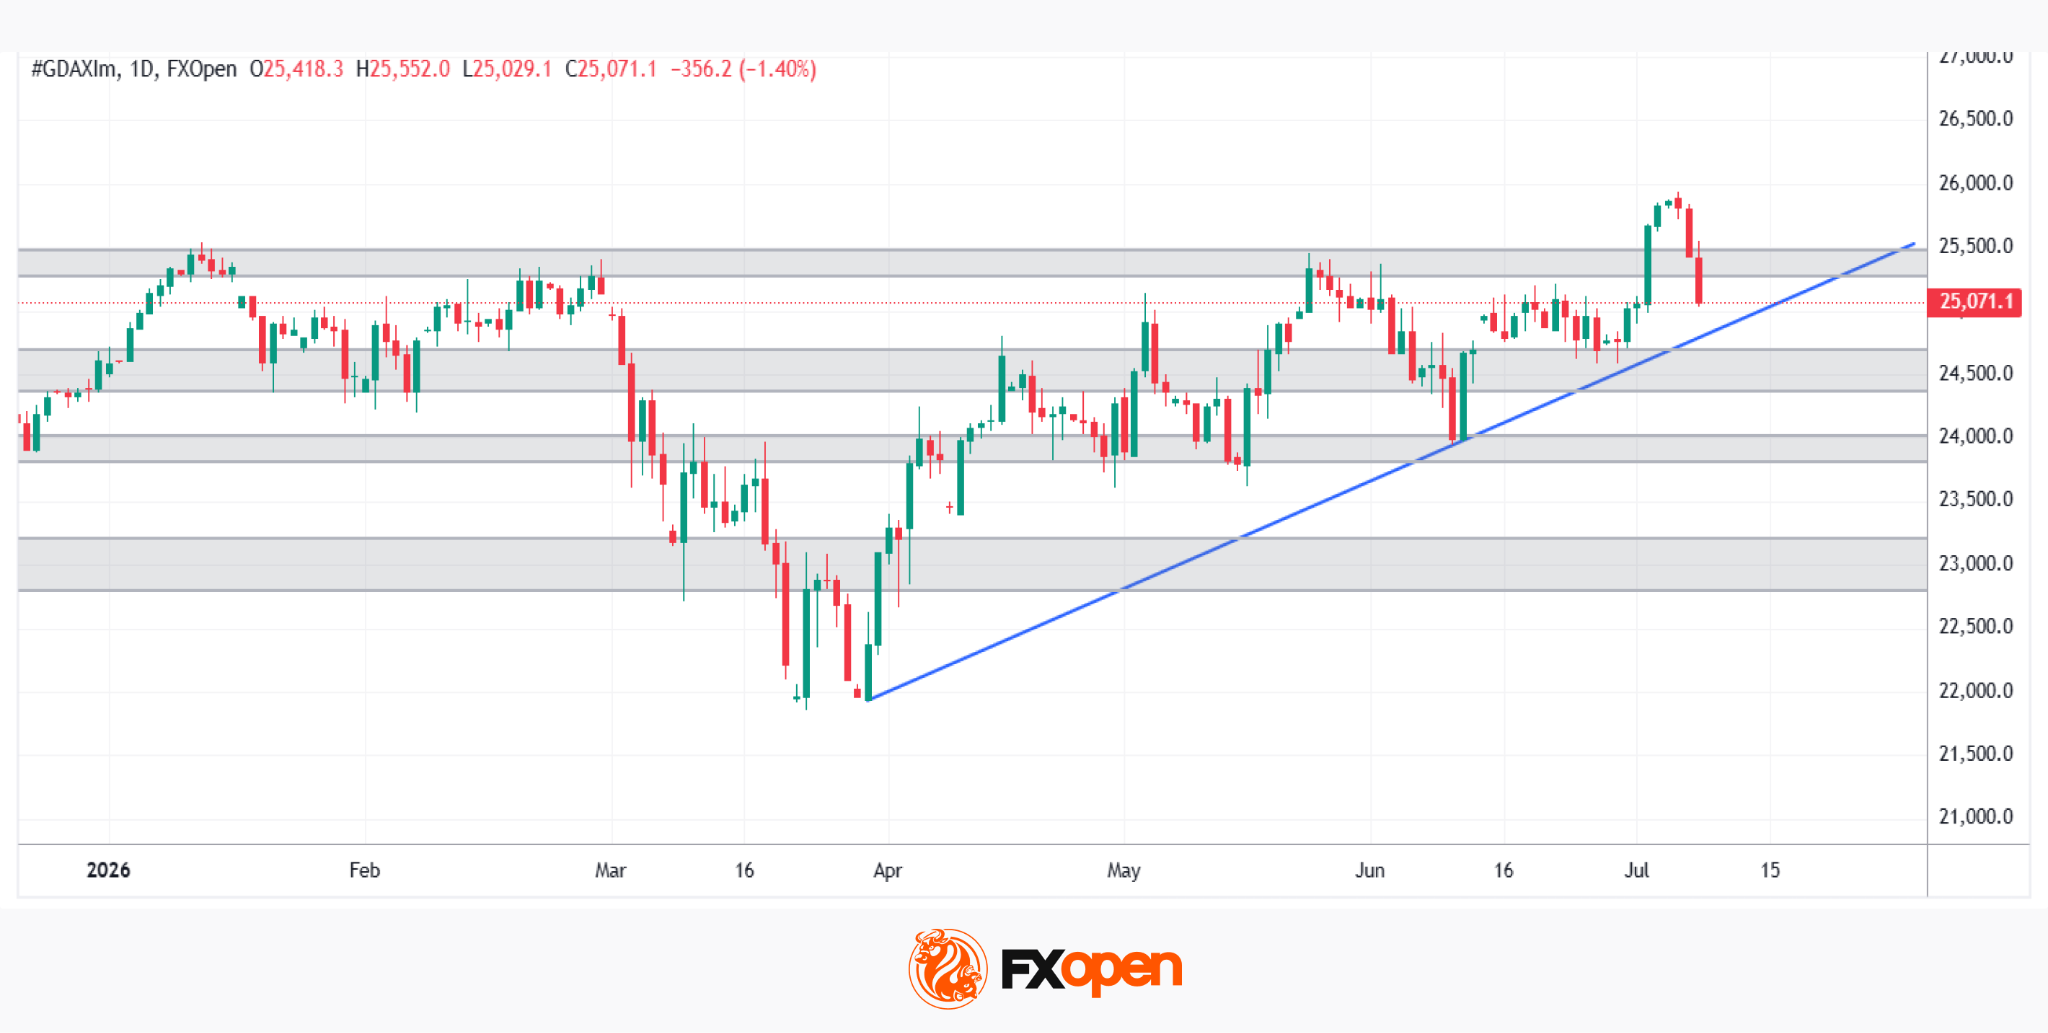
The DAX 40 has shed more than 2% over the past several sessions, breaking a rally that had pushed the index to record highs on the back of Germany’s fiscal pivot toward defence, infrastructure and climate spending. The pullback raises a legitimate question: is this a healthy pause within an intact uptrend, or the start of a deeper correction?
On the macro front, the picture remains mixed but constructive. German durable goods orders surprised meaningfully to the upside, hinting that domestic industry may finally be turning a corner. That said, a portion of this year’s projected GDP growth stems from calendar effects rather than genuine demand recovery.
Monetary policy offers the clearest explanation for the recent weakness. The ECB delivered its first hike since 2023 in June, and the shift in tone alone unsettled rate-sensitive DAX sectors like Financials and real estate, while a firmer euro added pressure on export-driven industrials.
Technical Analysis
As the chart shows, DAX 40 (GDAXI on FXOpen) has climbed steadily from April’s lows along a well-respected ascending trendline, recently pushing to new record highs near 26,000 before the sharp two-session pullback that triggered this correction. Price has now retraced heading to that same trendline, which converges with the 24,500-24,600 support zone—making this an important decision point for the index.
Bullish Scenario
If buyers step back in and defend the trendline together with the 24,500-24,600 zone, the broader uptrend structure remains intact. In this case, the recent drop would look more like a routine shakeout than a genuine reversal. From there, a renewed push back above the 25,400-25,550 resistance area—where the index broke down during the pullback—would be the first sign that momentum is returning. A clean break above that zone would put fresh record highs firmly back on the table, extending the rally that has defined the DAX since April.
Bearish Scenario
On the other hand, a decisive daily close below the trendline and the 24,500-24,600 support would be a meaningful technical signal, suggesting the correction has more room to run. Losing this zone would likely trigger further selling, as it has acted as a springboard for the rally since spring. In that scenario, the index would probably drift toward the 24,000 area first, with 23,000-23,200—the last major support tested back in April—becoming the key downside target if selling pressure intensifies.
With price now sitting exactly on this critical trendline, the coming sessions look set to decide whether the DAX’s record-breaking run continues, or whether this correction has only just begun.
Trade global index CFDs with zero commission and tight spreads (additional fees may apply). Open your FXOpen account now or learn more about trading index CFDs with FXOpen.
This article represents the opinion of the Companies operating under the FXOpen brand only. It is not to be construed as an offer, solicitation, or recommendation with respect to products and services provided by the Companies operating under the FXOpen brand, nor is it to be considered financial advice.


Middle East de-escalation now looks severely threatened. US President Donald Trump declared the memorandum of understanding with Iran “is over,” sending Bitcoin below $62,000 and oil sharply higher within minutes.
Here is what Trump said, how markets reacted, and why Bitcoin moved in the opposite direction to oil.
What Trump’s Iran MoU Statement Actually Means
A memorandum of understanding, or MoU, is a formal but non-binding agreement outlining shared intentions between two parties before a permanent deal. Trump declared the Iran MoU “is over” after both sides failed to reach a lasting agreement, according to CNN.
The collapse followed a fresh wave of airstrikes. Both parties resumed attacks across the region, shattering the fragile calm. Furthermore, the breakdown reignited fears of a wider and prolonged conflict in the Middle East.
Follow us on X to get the latest news as it happens.
The escalation stems from recent military action. The Islamic Revolutionary Guard Corps said it responded to US attacks by striking American targets. Moreover, it hit an air base in Bahrain hosting US forces, plus targets in Kuwait.
The United States began its assault earlier in the standoff. Washington also reimposed sanctions on Iranian oil sales as punishment for attacks on ships near the strategically vital Strait of Hormuz.
Trump left little room for renewed diplomacy. Speaking at the NATO summit in Ankara, he said he does not want to re-engage Tehran for further peace talks after the previous rounds collapsed entirely.
Why Did Bitcoin Fall While Oil Soared?
The market reaction split sharply along risk lines. Oil surged immediately after the news, while Bitcoin sank. This classic divergence reflects how each asset responds to geopolitical shocks and supply fears.
Starting with oil, USOIL jumped to $75 for the first time since June 22. The rally reflects fears of supply disruption near the Strait of Hormuz. Notably, prices had fallen below $67.50 days earlier as markets priced in de-escalation.
Turning to Bitcoin, the asset moved in the opposite direction as tensions flared. It had peaked above $64,000 earlier in the session. However, it gradually lost value after the initial attacks rattled global risk sentiment.
Trump’s message accelerated the slide. The cryptocurrency dipped below $62,000 within minutes of the statement going live, according to BeInCrypto data. As a result, traders rushed toward safety as uncertainty gripped the broader market.
The pattern is familiar during conflict. Bitcoin typically behaves as a risk asset during geopolitical shocks, falling alongside stocks. Meanwhile, oil rises on supply concerns, creating the mirror-image move seen across markets today.
The post Donald Trump Declares the Iran MoU “Is Over”: Bitcoin Plunges and Oil Soars appeared first on BeInCrypto.

Arkham Intelligence reported today that a SpaceX-tagged wallet has made a small test transaction after roughly six months of being inactive.
The address, identified as SpaceX (15atF), sent about $88 worth of BTC to another wallet that begins with bc1q9.
The transaction itself is very minor, but the market is starting to pay attention because corporate-linked Bitcoin wallets rarely move BTC without a reason. Small transactions are usually used to test address control or custody setup.
SPACEX JUST MOVED BITCOIN
A tagged SpaceX address just moved Bitcoin for the first time in 6 months. SpaceX (15atF) made a test transaction of $88 of BTC to SpaceX (bc1q9).
Is SpaceX about to move more BTC? pic.twitter.com/vQITSDKtGI
— Arkham (@arkham) July 8, 2026
There is no confirmation that the company is preparing to sell. The fact that it sent the BTC to another one of its own wallets could also suggest that this is simply a matter of rotation.
That said, SpaceX currently holds 18,712 BTC worth around $1.16 billion, making it the 8th-largest corporate holder.
It’s also worth noting that the firm recently went public in a historic IPO and joined the Nasdaq 100 index yesterday. The index is one of the world’s most widely-followed technology benchmarks, and is also serving as the foundation of countless funds and investment products designed to track its performance.
The post SpaceX Bitcoin Wallet Wakes Up With a Tiny Transaction: What’s Next? appeared first on CryptoPotato.


Tax authorities, meanwhile, are concerned about widespread underreporting. In the financial year ended March 2023, fewer than a quarter of the 645,000 individuals who transacted in crypto actually declared those gains on their tax returns.
Transactions executed on offshore exchanges and peer-to-peer platforms, especially those denominated in rupees, remain difficult to track, trace and tax.
Indian crypto investors have been operating in a regulatory grey zone since the Supreme Court struck down the RBI’s 2018 ban. It is neither outright illegal nor clearly regulated. A 2021 draft bill to ban private cryptocurrencies was never presented and policy discussions have been repeatedly delayed.
While the government has spoken of balancing innovation with risk management, the latest internal documents suggest key agencies are still not ready to embrace digital assets.
India’s reluctance can partly be explained by its heavy dependence on energy imports and persistent current account deficits. The fragility of this position was recently exposed when tensions with Iran drove oil prices higher, inflating the energy import bill and pushing the rupee to record lows. Authorities are concerned that widespread crypto adoption could accelerate capital outflows, bypassing traditional banking channels and worsening the external deficit.
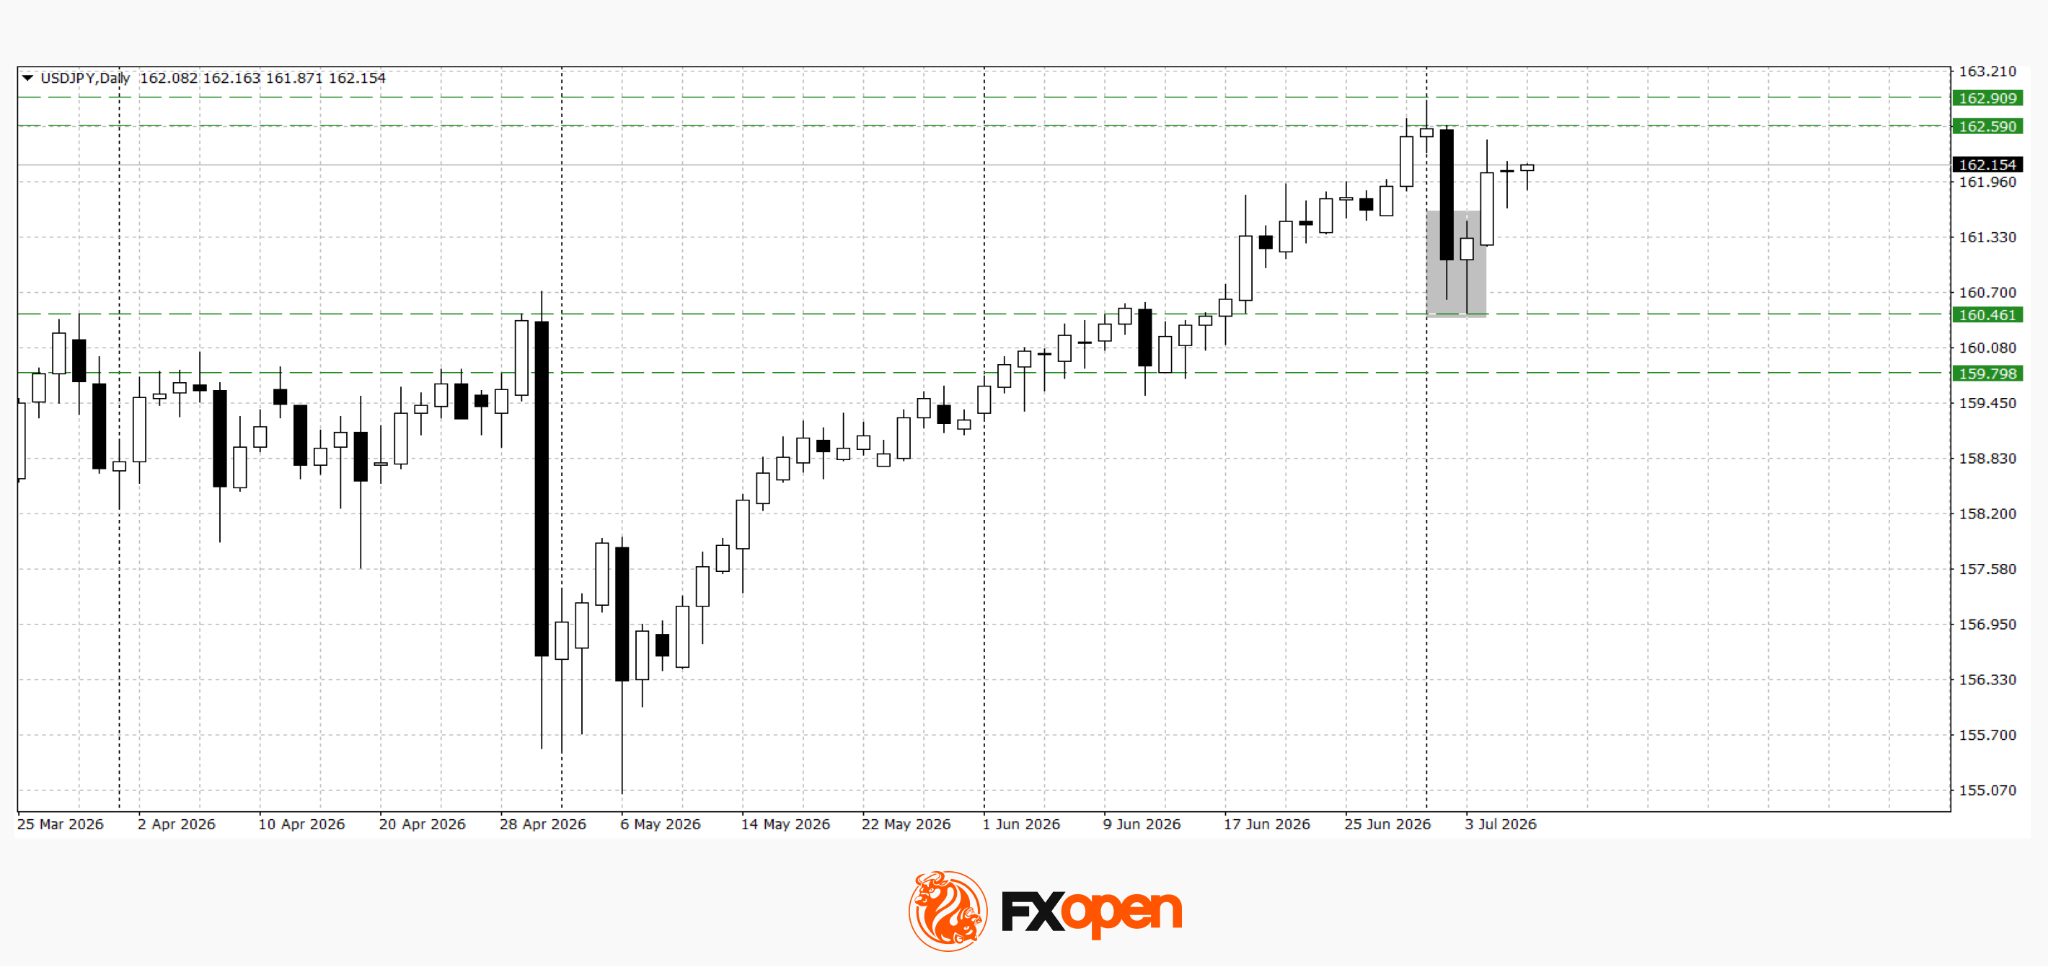
The US dollar has entered a period of consolidation following last week’s sharp price swings, as market participants turn their attention to the release of the Federal Reserve’s latest meeting minutes. Investors are looking for additional guidance on the future path of interest rates and whether support for a hawkish monetary policy stance remains widespread within the Fed.
Further uncertainty was created by last week’s mixed US labour market data, which raised concerns about the resilience of the US economy but did not trigger a significant reassessment of Federal Reserve policy expectations. Attention has now shifted to the FOMC minutes, with traders focusing on the Fed’s assessment of inflation risks and its outlook for future interest rate decisions. Confirmation of a hawkish stance could provide fresh support for the US dollar, while a more cautious assessment of economic conditions may strengthen expectations of future policy easing.
USD/JPY
Against this backdrop, USD/JPY is consolidating after retreating sharply from multi-year highs. The yen remains under pressure due to the wide interest rate differential between the United States and Japan. However, with the pair trading close to multi-year highs, concerns over possible intervention by the Japanese authorities continue to limit further upside.
From a technical perspective, USD/JPY may retest the 162.60–162.90 area after forming a Piercing Line candlestick pattern on the daily chart following the recent pullback. A deeper correction would become more likely if the pair closes decisively below 160.50.
Key events for USD/JPY:
- Today, 14:00 (GMT+3): MBA Weekly Mortgage Applications (US)
- Today, 21:00 (GMT+3): FOMC meeting minutes
- Tomorrow, 02:50 (GMT+3): Japan Foreign Bond Investment
USD/CAD
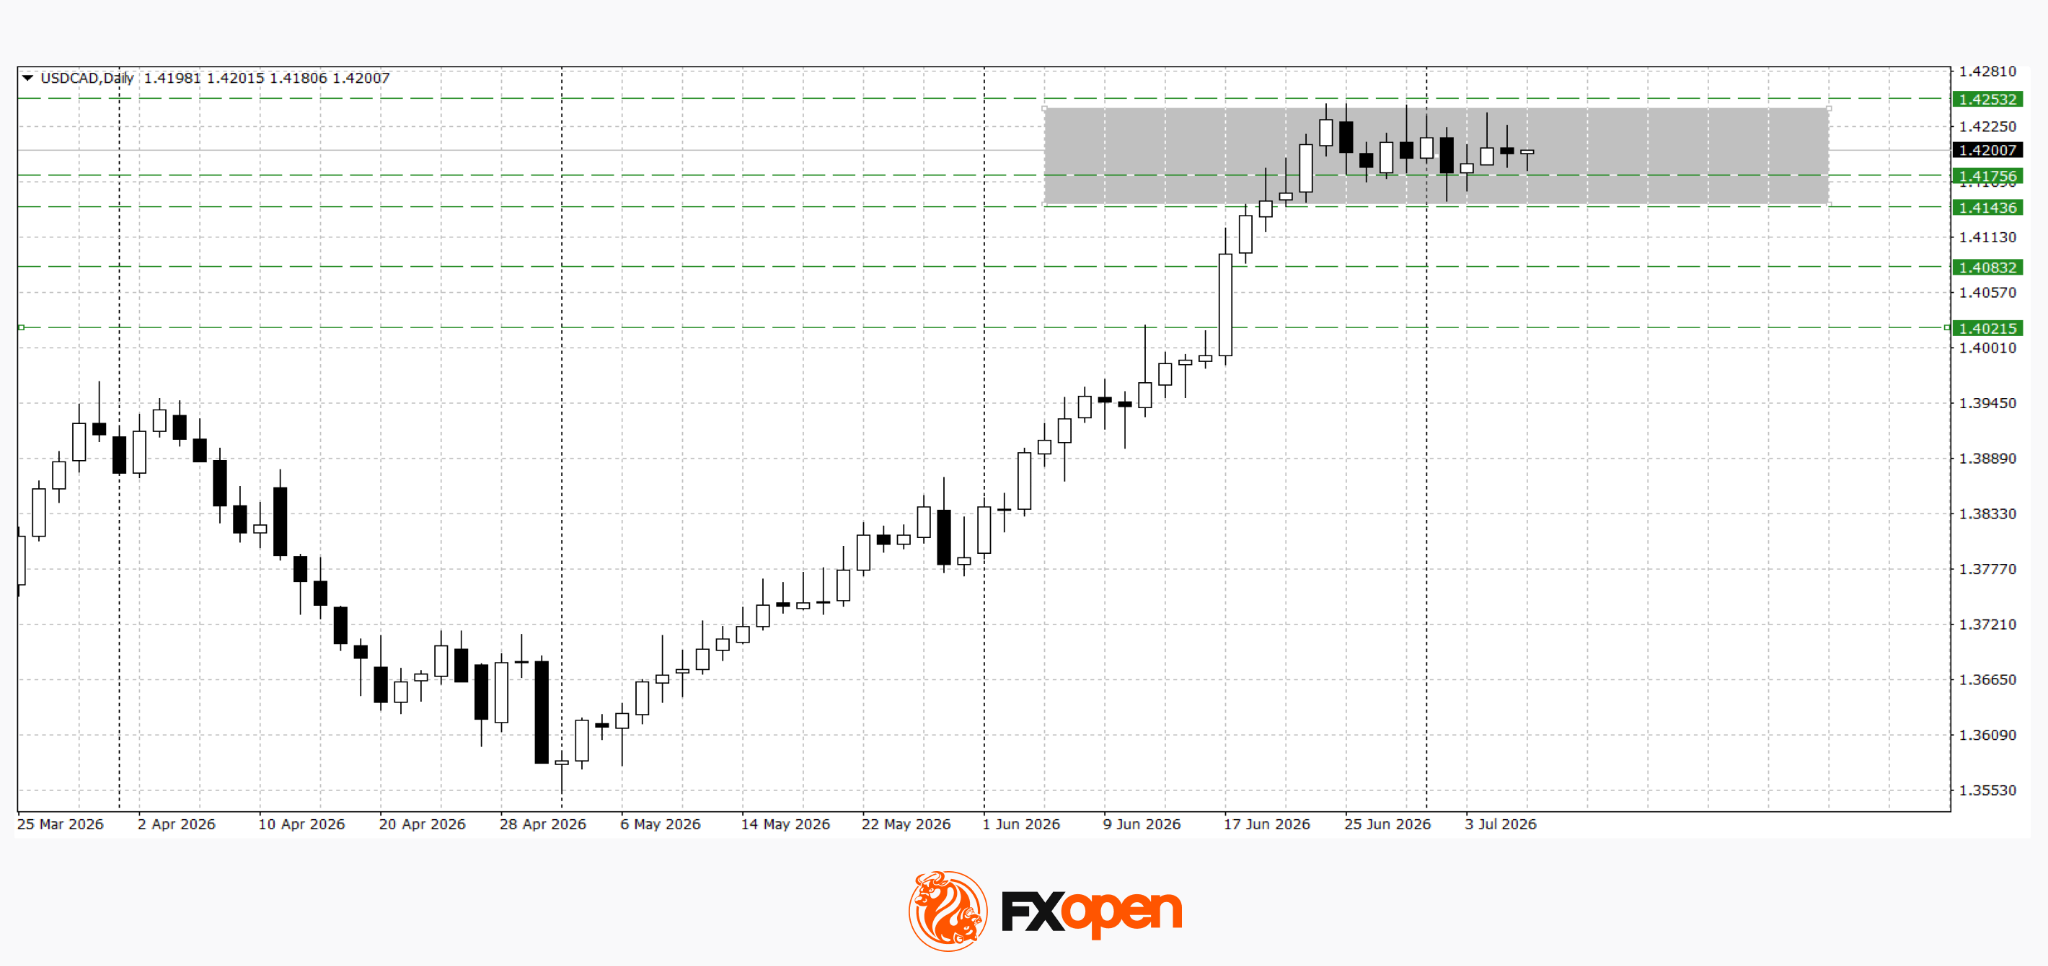
USD/CAD continues to trade sideways within the 1.4140–1.4250 range, suggesting the market is building momentum for a potential breakout. A sustained move above 1.4250 would open the door for further gains towards 1.4300–1.4400. Conversely, a break below 1.4140 could trigger a deeper correction towards the 1.4020–1.4080 region.
Key events for USD/CAD:
- Today, 17:30 (GMT+3): US Crude Oil Inventories
- Tomorrow, 15:30 (GMT+3): US Initial Jobless Claims
- Tomorrow, 17:00 (GMT+3): US Existing Home Sales
The US dollar remains in a holding pattern ahead of the release of the FOMC minutes, which could become the key catalyst for its next move. If the document confirms that Fed officials remain concerned about persistent inflation and continue to favour a hawkish policy stance, the dollar could receive renewed support. On the other hand, a more cautious assessment of the economy and the monetary policy outlook may encourage profit-taking on long dollar positions and lead to a broader corrective move.
Trade over 50 forex markets 24 hours a day with FXOpen. Take advantage of low commissions, deep liquidity, and spreads from 0.0 pips (additional fees may apply). Open your FXOpen account now or learn more about trading forex with FXOpen.
This article represents the opinion of the Companies operating under the FXOpen brand only. It is not to be construed as an offer, solicitation, or recommendation with respect to products and services provided by the Companies operating under the FXOpen brand, nor is it to be considered financial advice.


Kenya has moved to procure a blockchain surveillance platform capable of tracking transactions across more than 20 blockchain networks as the country prepares to supervise licensed crypto businesses under its new virtual assets law.
Summary
- Kenya plans to deploy blockchain surveillance software as it prepares to regulate licensed crypto businesses.
- The proposed platform would track transactions across more than 20 blockchains and flag suspicious wallets and transfers.
- The move follows Kenya’s new virtual asset law and proposed reporting rules for crypto service providers.
According to tender documents reviewed by Capital FM Africa, Kenya’s Capital Markets Authority (CMA) is seeking an advanced blockchain analytics system that can monitor digital asset activity in both real time and retrospectively.
The proposed platform would support regulatory investigations, identify suspicious transactions, and strengthen compliance oversight as the country’s crypto licensing framework moves toward implementation.
Under the tender specifications, the system must support Bitcoin, Ethereum, and at least 20 other blockchain networks. It would generate automated alerts for high-risk wallets, unusually large transfers, coin mixers, darknet-linked addresses, and entities listed on sanctions databases maintained by the United Nations and the U.S. Office of Foreign Assets Control.
The regulator also wants software capable of mapping wallet relationships, rebuilding transaction histories, tracing funds across multiple blockchains, and assigning risk scores linked to money laundering, ransomware, fraud, and terrorism financing. In addition, the CMA plans to use the platform to identify the cryptocurrency exchanges most frequently used by Kenyan residents and detect offshore platforms serving local users without regulatory approval.
Surveillance tools to support new crypto rules
The surveillance purchase comes after Kenya introduced its first comprehensive legal framework for digital assets. President William Ruto signed the Virtual Assets Service Providers Act into law in October, with the legislation taking effect the following month.
The law divides regulatory responsibilities between the Central Bank of Kenya and the CMA. While the central bank oversees payment services, stablecoins, and custodial wallet providers, the CMA is responsible for regulating cryptocurrency exchanges, brokers, investment advisers, and tokenization platforms as Kenya aligns its regulatory framework with anti-money laundering standards set by the Financial Action Task Force.
Although the legal framework is already in force, no crypto firms have received licences so far. The National Treasury released draft regulations in March, and existing operators have until November 2026 to meet the new compliance requirements.
Earlier this year, Kenya’s Finance Bill 2026 proposed additional reporting obligations for Virtual Asset Service Providers. Under the proposal, crypto firms would submit annual reports to the Kenya Revenue Authority containing information on reportable users and controlling persons, while the country would also be able to exchange virtual asset transaction data with foreign tax authorities under international reporting standards, according to an analysis published by KPMG Kenya.
Kenya joins global regulators using blockchain analytics
The capabilities outlined in the CMA’s tender closely match commercial blockchain intelligence platforms offered by companies including Chainalysis, TRM Labs, and Elliptic, which supply transaction monitoring software to regulators and law enforcement agencies in several countries.
Kenya remains one of Africa’s largest cryptocurrency markets. According to Chainalysis, users in the country received roughly $19 billion worth of crypto between July 2024 and June 2025, placing Kenya fourth on the continent. The report also estimated that more than six million Kenyans use digital assets, with a significant share of activity taking place through peer-to-peer trading channels.
Similar blockchain monitoring tools are already being used elsewhere. In the United States, Immigration and Customs Enforcement moved last year to acquire forensic software from TRM Labs and Chainalysis, while both companies already provide services to agencies including the FBI, DEA, and IRS. Britain’s tax authority, HMRC, has also contracted TRM Labs to assist in tracing suspicious cryptocurrency transactions.

BA flight to UK is cancelled after crew members got so drunk the night before one of them collapsed in hotel bar

Alinta signs Scarborough gas deal with LNG Japan

Tech Futures Slide On Samsung Earnings; SpaceX Falls| Investor’s Business Daily


-

 Fashion5 days ago
Weekend Open Thread: High Hopes
-
 NewsBeat3 days ago
Taylor Swift and Travis Kelce wedding staffer hilariously struggles to keep her cool while checking in megastars
-
 Crypto World7 days ago
Airdrop Registration Becomes Key Focus For Remittix As RTX Launch Updates Approach
-

 Fashion2 days ago
Open Thread: What Great Books Have You Read Recently?
-

 Politics5 days ago
The House | “Reframing the debate from a binary discussion of winners and losers”: Yuan Yang reviews ‘We Are Not Machines’
-
 Crypto World5 days ago
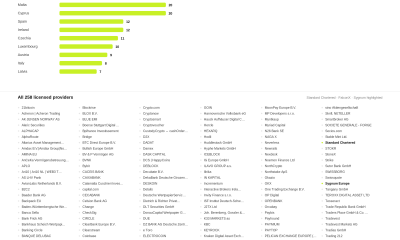
Standard Chartered Secures MiCA License as ESMA Adds 37 New Crypto Firms
-

 Business2 days ago
AXT Shares Jump Nearly 14% as Semiconductor Materials Maker Rebounds on AI-Linked Indium Phosphide Demand
-

 Sports7 days ago
Broncos roster: OL Ben Powers (No. 74) entering final year of contract
-

 Crypto World6 days ago
Binance stock trading tops $1B in first month after launch
-

 News Videos1 day ago
Whats Hidden Inside This Cash Register? #treasure #reselling #money
-

 Crypto World6 days ago
Alibaba-affiliate Ant Group enters the humanoid robot market with 12 deals
-

 Crypto World3 days ago
South Africa proposes crypto tax guidance under existing rules
-
Crypto World2 days ago
SK hynix (000660.KS) Stock Dips as $28B Nasdaq ADR Offering Drives AI Memory Expansion
-

 News Videos2 days ago
Best Time to Enter Small Caps Right Now? Another Bull Run? | Financially Free
-
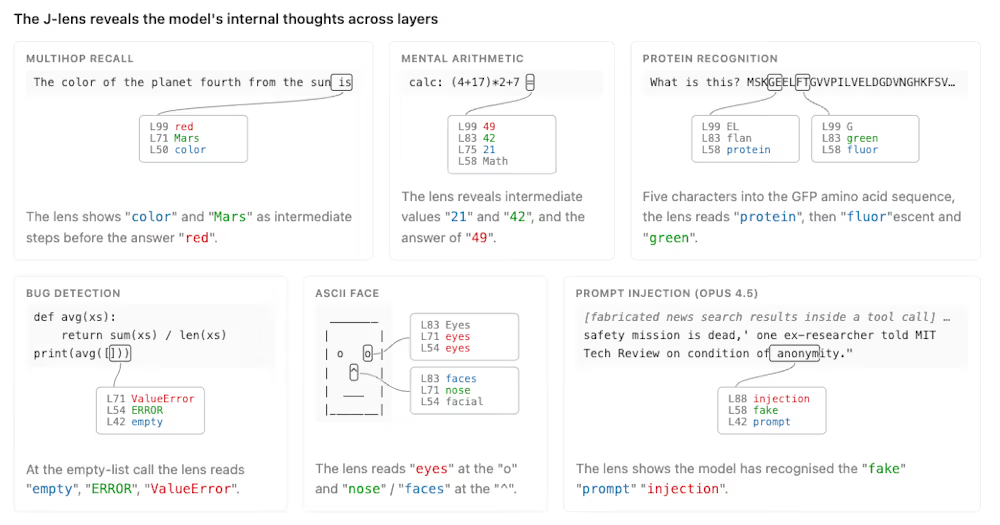 Tech1 day ago
Anthropic’s new “J-lens” reveals a silent workspace inside Claude that mirrors a leading theory of consciousness
-

 Tech3 days ago
Lenovo laptops are now shipping with YMTC SSDs, a sign of Chinese NAND entering the mainstream
-

 Business6 days ago
Meta Platforms Stock Jumps 7% Today as Bloomberg Reports Company Plans to Enter the Cloud Business
-
 NewsBeat6 days ago
New exhibition reflects five decades of movement between island of Ireland and GB
-

 Business5 days ago
What a 10 Percent Drop Means for Buyers, Sellers and Renters
-

 Crypto World6 days ago
Binance Re-Enters Philippines As EU MiCA Rules Restrict Access
You must be logged in to post a comment Login