
Crypto World
Treasury's 5-Year Auction Hits 20-Year Yield High: What This Means for Bitcoin

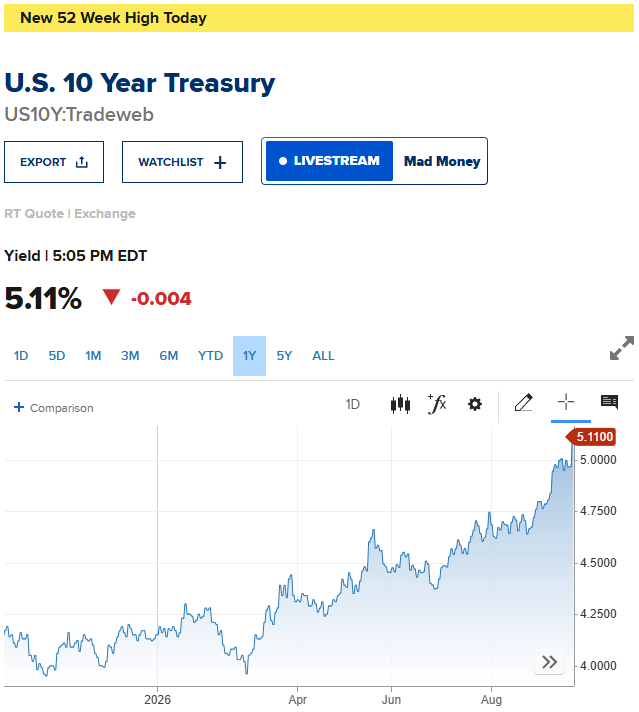
The US Treasury paid its highest yield on a 5-year note since June 2006, a sign that demand for government debt is weakening even as yields stay elevated across the board.
Rising yields raise borrowing costs across the economy. They also tend to pressure stocks, bonds, and other risk assets as investors demand more compensation for holding debt.
Rising Yield, Dropping Interest
Wednesday’s $70 billion auction priced at 5.033%, above the 5.002% when-issued level, according to Dow Jones. That is up from 4.393% at the prior sale in August.
The bid-to-cover ratio measures how many bids came in for each note sold. It fell to 2.212, the lowest since December 2018.
Indirect bidders, a group that includes foreign central banks, took just 54.3% of the sale. That is down from 61.5% at the last auction and the lowest share since March 2020.
Yields Are Rising Across the Curve
The pressure was not limited to 5-year debt. The 10-year Treasury yield also climbed to 5.12% on Wednesday, its highest level since 2007, while the 30-year touched 5.37%.

CNBC’s Rick Santelli called the 5-year results weak, saying traders had little time to adjust before the sale. Business activity accelerated at its fastest pace since July 2021, according to flash survey data, adding to the pressure on yields that morning.
Federal Reserve governor Michael Barr said Wednesday that further rate hikes are still needed to bring down inflation. Traders have since pushed the odds of an October hike to 70%.
Santelli noted 10-year Treasury yields have averaged roughly 5.5% since 1980. That history suggests current levels are less extreme than they appear. Still, he flagged the next resistance level for 5-year yields near 5.19%.
What It Means for Bitcoin
Higher long-term yields raise the opportunity cost of holding non-yielding assets like bitcoin (BTC). Bitcoin already fell below $84,000 after a separate hot data print pushed the 10-year yield above 5%.
A soft 5-year auction adds to that pressure. Bitcoin has increasingly traded in step with tech stocks, making it sensitive to shifts in the rate outlook.
The sell-off follows a broader pattern of global bond yields surging to multi-decade highs across major economies this year.
Traders will now watch whether yields keep grinding higher across the curve. Santelli still expects the current sell-off to prove temporary rather than the start of a deeper repricing.
The post Treasury's 5-Year Auction Hits 20-Year Yield High: What This Means for Bitcoin appeared first on BeInCrypto.

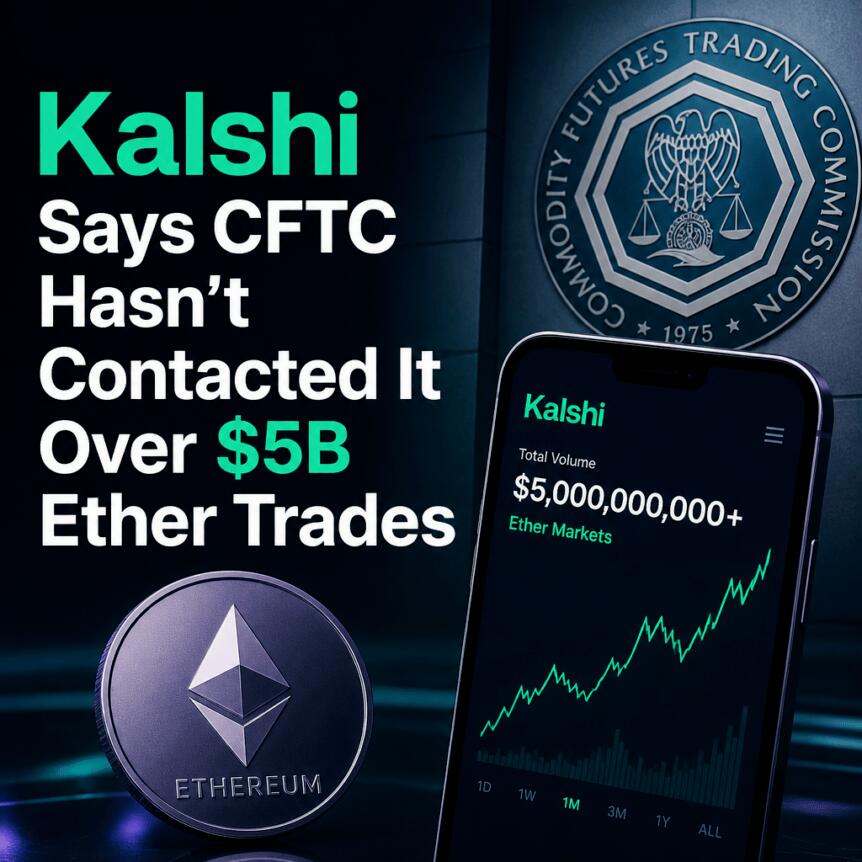
Kalshi, a prediction markets operator that launched Ether perpetual futures in May, says it has not been contacted by the U.S. Commodity Futures Trading Commission (CFTC) and does not believe the regulator is formally examining its market activity. The statement follows a Wall Street Journal report claiming the CFTC is reviewing a pattern of rapid, highly clustered trades in Kalshi’s Ether perpetual futures.
According to the Journal, the trades appeared in repeated blocks clustered around roughly $5,500 and have led to allegations of wash trading. Kalshi disputes that framing, arguing the pattern is consistent with liquidity incentives and market-making behavior common across financial markets.
Key takeaways
- Kalshi says the CFTC has not contacted it and that it does not think there is a formal examination of its Ether perpetual futures activity.
- The Wall Street Journal reported regulator interest tied to rapid trade clusters around approximately $5,500 and alleged wash trading.
- Kalshi points to liquidity incentive programs paying market makers for maintaining quoted orders, not for the volume of trades filled.
- Kalshi’s response argues repeated fixed-size trades can occur when resting orders meet demand from many takers.
- The company recently reported rapid growth, with perpetual futures volume surpassing $1 billion about a week after the May launch.
CFTC review claims come amid Kalshi growth
The controversy centers on Kalshi’s Ether perpetual futures markets—trading venues where participants speculate on Ether’s price without necessarily taking spot ownership. The Wall Street Journal reported that the CFTC is examining a sequence of fast trades clustered around $5,500, citing a person familiar with the matter.
The Journal’s reporting also noted the trade clustering raised wash-trading concerns—an accusation generally tied to the idea that trading volume inflates without genuine economic risk-taking by either side.
Kalshi’s push into perpetual futures has been rapid. About a week after launching its perpetual futures markets in May, the company told CNBC that trading volume had surpassed $1 billion. That growth backdrop is part of why the Journal’s regulator story has drawn attention to how Kalshi’s markets are being supported by liquidity providers.
Kalshi denies wash trading and says it wasn’t contacted
Elisabeth Diana, head of communications at Kalshi, told Cointelegraph that the company has not been contacted by the CFTC and does not believe there is any formal examination.
“We have not been contacted by the CFTC and don’t believe there is any formal examination,” Diana said. She described the discussion as “rumors seeded by competitors,” adding that liquidity incentives can produce data patterns that are common in traditional financial markets. Diana also urged readers not to rely on social media chatter.
In its own explanation, Kalshi argues that the observed fixed-size trades align with a single market maker supplying resting orders at a set size and price band, which then get executed by many other participants.
What the trade pattern appears to show
According to the Wall Street Journal, trades of roughly $5,500 each summed to more than $5 billion in Ether perpetual futures volume over the prior month. The Journal also reported that Kalshi had offered some traders opportunities to buy equity in the company if they reached specific trading-volume targets. It further said Kalshi waived trading fees and provided monthly cash payments to encourage large traders to supply liquidity.
Kalshi did not address the equity-purchase possibility directly in its subsequent explanation, but in a blog post published on Wednesday the company attributed the repeated trade sizes to liquidity programs that reward market makers for keeping buy and sell orders available at predetermined sizes and within a specified price range.
In that post, Kalshi said the payments are intended to reward the presence of orders—liquidity readiness—rather than to compensate traders based on the volume of executions. It framed the recurring trade sizes as a mechanical outcome of how market makers can quote in chunks, and how those quotes can get hit by takers.
Kalshi also said that the executions involved hundreds of distinct traders, with takers repeatedly accepting the market maker’s orders. In Kalshi’s view, takers were “pretty consistently right” while the maker was “pretty consistently wrong,” which would not fit a wash-trading setup where both sides would be expected to behave differently if the goal were not genuine trading risk.
Why liquidity incentives can matter—and what to watch next
Market makers play a central role in derivative markets by continuously posting bids and offers, creating counterparties for traders who want immediate execution. The key distinction—at least in Kalshi’s argument—is whether a market’s activity is driven by incentives that support quotes (market structure and execution availability) versus incentives that could encourage artificial volume.
Kalshi’s position is that fixed-size fills can be economically legitimate: if a resting order sits on an order book, it may be executed repeatedly by multiple takers, creating clusters of similar trade sizes. That explanation matters for investors and traders because it affects how market quality is interpreted—specifically, whether patterns in reported volume indicate healthier liquidity or potential manipulation.
For now, the public record is defined by two competing narratives: the Journal’s report that the CFTC is looking into the trade clustering, and Kalshi’s insistence that the activity is consistent with liquidity incentive programs and normal market-making mechanics. Readers should watch for any formal CFTC action, additional regulatory statements, or further disclosures from Kalshi clarifying how its incentive structures interact with execution data—especially around the reported volume targets.
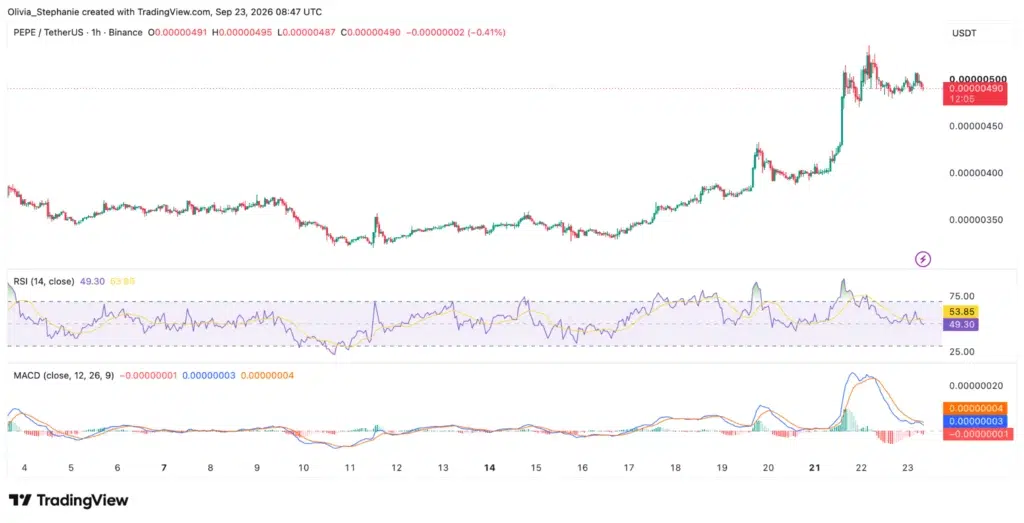
PEPE has held above its early-September breakout zone near $0.0000044 despite pulling back from a seven-day high around $0.00000534, leaving the meme coin roughly 45% higher over the week as momentum indicators cool.
Summary
- PEPE remains roughly 45% higher weekly despite retreating from its recent $0.00000534 seven-day price peak.
- CoinGlass shows PEPE open interest near $393 million as derivatives activity remains elevated after breakout.
- RSI has cooled toward neutral while MACD signals weakening momentum after PEPE’s sharp September rally.
- PEPE’s breakout remains above $0.0000044, with $0.0000047 acting as the first important support zone now.
- September golden cross supports the bullish structure, though the signal does not guarantee gains ahead.
CoinGecko shows PEPE trading near $0.00000492 on Sept. 23, with its market capitalization around $2.07 billion and seven-day performance at approximately 45.2%. Its seven-day trading range extended from roughly $0.00000329 to $0.00000534.
The current price is therefore around $0.0000049, not $0.054934. CoinGlass placed PEPE near $0.00000492 in a separate Sept. 23 snapshot, down roughly 3.3% over 24 hours while remaining more than 44% higher over seven days.
PEPE breakout remains intact above $0.0000044
PEPE broke through $0.0000044 after spending much of late August and early September trading beneath the level. The rally pushed through the August high near $0.0000046 and extended to approximately $0.00000534 before sellers slowed the move.
The sequence produced a higher high on the daily chart, while the former resistance area around $0.0000044-$0.0000047 now forms the first area traders are watching during the pullback.
CoinGecko historical data shows PEPE closed around $0.00000341 on Sept. 16, $0.00000361 on Sept. 17 and $0.00000400 on Sept. 20 before reaching $0.00000477 on Sept. 21. The Sept. 22 close stood near $0.00000498.
A move back toward $0.0000047 would therefore place PEPE close to the area where the latest leg accelerated. Holding that zone would keep price above the August resistance that was cleared during the rally.
Below it, $0.0000044 remains the more important structural support. A daily move beneath that level would return PEPE into its earlier trading range and weaken the higher-high structure created this week.
Price has not yet produced such a breakdown. PEPE remains several percentage points above $0.0000044 despite retreating from the weekly peak.
The latest surge coincided with a strong cryptocurrency-market rebound. As previously reported, PEPE’s earlier golden-cross setups have coincided with sharp price swings and changing whale activity, though previous crossovers did not guarantee sustained gains.
RSI and MACD show PEPE momentum cooling
Momentum indicators have weakened since PEPE’s sharp advance.
TradingView data supplied for the latest chart places the 14-period relative strength index at 51.37, below its moving average around 54.00. RSI had previously reached 78.09 during the breakout, placing the token in overbought territory before the indicator retreated.
An RSI near 50 indicates that the earlier buying imbalance has largely normalized. The fall from above 78 does not by itself confirm a bearish reversal, but it shows that the momentum behind the initial surge has faded.
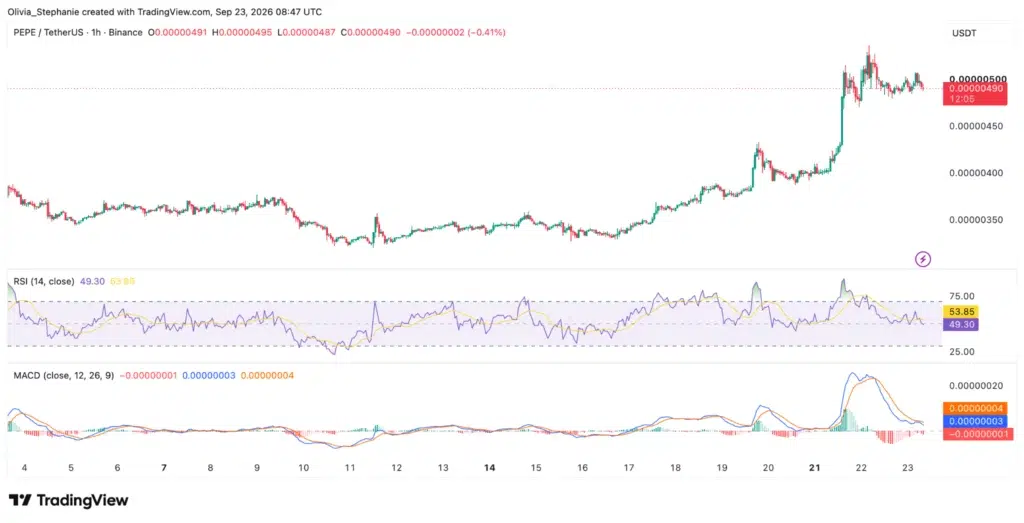
MACD gives a similar reading. The MACD line sits around 0.00000003, below the signal line near 0.00000004, while the histogram is marginally negative at approximately -0.00000001.
The crossover indicates softer short-term momentum following the Sept. 21-22 rally. Price, however, remains close to the upper end of its recent range instead of retracing the full breakout.
Combining the two indicators produces a mixed setup. RSI has returned to neutral conditions while MACD has turned mildly bearish. Price structure remains firmer because PEPE continues to trade above $0.0000044 and its previous August high.
Such divergence between price structure and momentum can persist while an asset consolidates after a large move. Confirmation would require subsequent price action: holding $0.0000047 would preserve the immediate breakout area, while a loss of $0.0000044 would give the weakening momentum readings more weight.
Independent chart analysis found that PEPE’s 50-day moving average crossed above its 200-day moving average around Sept. 19, producing the pattern commonly called a golden cross. The study placed PEPE substantially above both averages after the rally.
The same analysis cautioned that PEPE’s historical golden-cross sample is small. Previous examples produced very different results, including one period in which price fell heavily during the following 90 sessions.
PEPE futures activity remains elevated after rally
Derivatives traders remain heavily involved even as spot momentum cools.
CoinGlass reports PEPE open interest around $393 million, with approximately $912 million in 24-hour futures volume in one Sept. 23 snapshot. Spot volume in the same dataset stood near $267 million.
Other CoinGlass snapshots taken during the morning placed open interest between roughly $395 million and $402 million, showing that the total changes continuously as traders open and close positions.
The derivatives turnover is several times larger than spot turnover under CoinGlass’s methodology. High futures activity can increase sensitivity to rapid moves when leveraged positions become crowded, although open interest alone does not show whether traders are positioned net long or net short.
CoinGlass recorded roughly $1.96 million of PEPE futures liquidations over 24 hours in one snapshot. Its open-interest methodology counts both long and short positions that remain unsettled, meaning rising or elevated OI cannot independently identify bullish positioning.
Open interest has risen considerably from earlier in September. A CoinGlass page captured last week showed roughly $219 million in PEPE open interest when the token traded near $0.00000325. Current figures close to $400 million indicate far more derivatives exposure remains in the market after the price rally.
Such an increase can accompany a strong trend, but it can raise liquidation risk when price momentum slows because more leveraged positions remain exposed to sudden moves.
Exchange flows give a mixed picture
Available exchange-flow data does not point uniformly toward either accumulation or distribution.
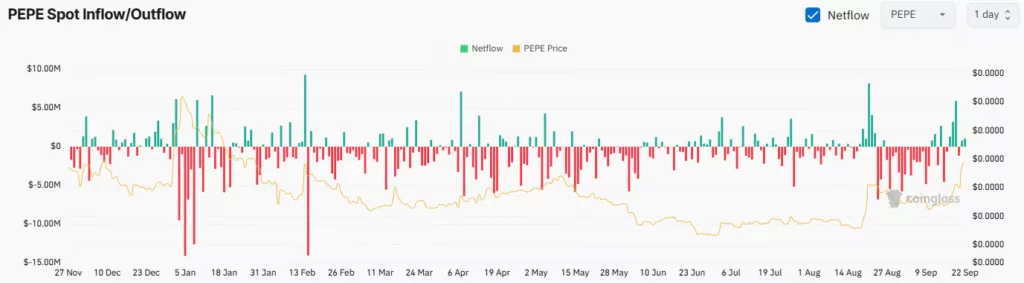
One recent independent whale study covering activity through Sept. 20 tracked 83 large PEPE wallets moving $57.7 million. The study recorded $34.1 million in exchange withdrawals and $23.6 million in deposits, leaving approximately $10.5 million net leaving exchanges among the wallets it followed.
The dataset covers only the wallets tracked by the researcher and cannot represent every PEPE holder or exchange flow.
A separate analysis of more recent transactions reported heavy deposits on Sept. 20, nearly balanced flows on Sept. 21 and roughly 6.9 billion tokens net leaving exchanges on Sept. 22. The changing daily readings show why a single flow session does not establish a persistent accumulation or selling trend.
CoinGlass’s current spot page lists exchange-level net-flow data but did not expose a complete aggregate flow figure in the public snapshot retrieved Sept. 23. Its live data nevertheless places spot turnover near $200 million while futures activity remains several times larger.
Earlier crypto.news coverage documented how changes in PEPE exchange balances have repeatedly accompanied price moves. In one prior cycle, falling PEPE exchange balances coincided with whale accumulation and a completed golden cross, while later periods saw exchange balances rise as holders reduced exposure.
Current price action therefore leaves two levels doing most of the technical work. The first sits around $0.0000047, close to the recent breakout and consolidation area. The second lies near $0.0000044, where the earlier resistance zone could become support.
Above the market, the recent high around $0.00000534-$0.00000536 remains the first resistance. A sustained move through that area would create another higher high. Failure to reclaim it while RSI stays around neutral and MACD remains below its signal line would keep PEPE consolidating beneath the latest peak.
CoinGecko’s current seven-day range still places PEPE’s high at roughly $0.00000534 and its low near $0.00000329, leaving the token well above where the weekly move began despite the latest pullback.
Disclosure: This article does not represent investment advice. The content and materials featured on this page are for educational purposes only.
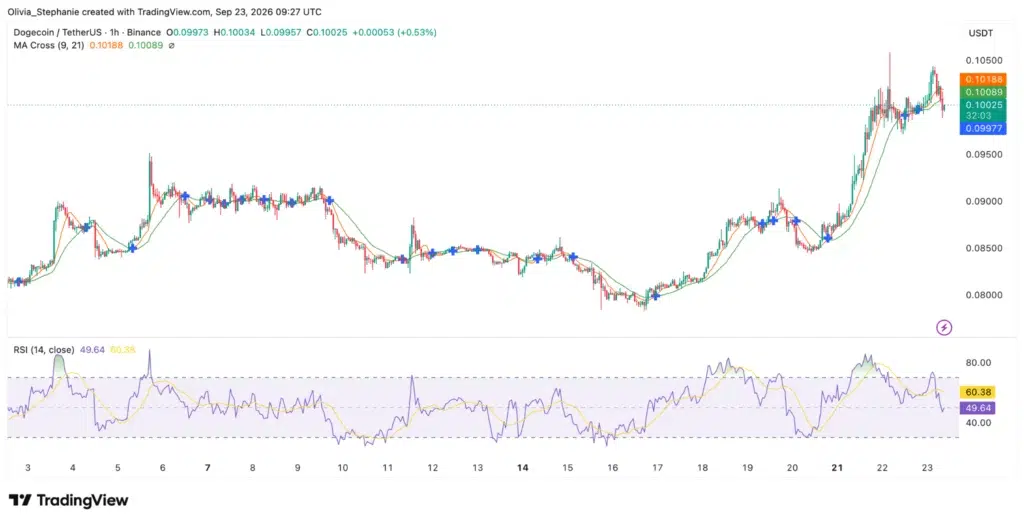
Dogecoin has climbed roughly 25% over seven days and returned to the $0.10 region for the first time since early June, though short-term momentum has weakened after the latest rally.
Summary
- Dogecoin has gained 25% in seven days while trading around the psychological $0.10 level again.
- CoinGlass shows Dogecoin futures open interest near $1.67 billion as derivatives volume exceeds $3 billion.
- DOGE trades below its nine-period and 21-period averages despite their remaining bullish short-term alignment today.
- RSI has cooled to 48.40 after previously reaching overbought territory, showing weaker short-term momentum now.
- Whale wallets accumulated more than 240 million DOGE during the September pullback, according to analysts.
CoinGecko shows DOGE trading near $0.10 on Sept. 23, up around 1% over 24 hours and 25.2% over the past week. The token carries a market capitalization of roughly $15.6 billion, with 24-hour trading volume near $1.8 billion.
The move follows a recovery from approximately $0.080 on Sept. 15. DOGE traded near $0.081 on Sept. 16 before moving through $0.087 during the weekend and reaching the $0.10 area on Sept. 21-22.
Dogecoin price holds $0.10 as momentum cools
The latest technical readings show a bullish short-term moving-average structure that has begun losing momentum.
The nine-period moving average stands at $0.10185, above the 21-period average at $0.10088. The positive alignment keeps the recent short-term trend structure intact, but DOGE has slipped beneath both averages while trading close to $0.10.
Price moving below the two averages indicates weaker immediate buying pressure after the sharp advance. Reclaiming $0.10088 and $0.10185 would put DOGE back above its short-term trend gauges, while continued trading beneath them would keep sellers in control of the immediate timeframe.
The RSI gives a similar reading. The 14-period indicator has fallen to 48.40, below its moving average of 60.29, after moving above 70 during the rally.
An RSI close to 50 is neutral and does not signal an oversold market. Its decline from overbought territory shows that the strength behind the initial move has eased while DOGE consolidates around $0.10.
Historical price data shows DOGE rose from $0.08005 on Sept. 15 to $0.09980 on Sept. 21, a gain of nearly 25% in less than one week.
As previously reported, Dogecoin had reclaimed its 200-day moving average near $0.09 earlier this month before the latest move carried price through the previous resistance zone.
Analysts watch $0.1175 and $0.15 after breakout
Several traders are now watching whether DOGE can turn the $0.10 region into support.
Analyst Cyriptoman4 said a decisive move above $0.10 could open a path toward $0.1175 and then $0.15. Both levels remain analyst targets and are not confirmed price outcomes.
#DOGE kısa vadeli görünüm 👀📈$DOGE, 0,080 $ destek bölgesinde iyi tutundu ve bu seviyeden tepki aldı.
🔹 0,080 $: Destek bölgesi — Cyriptoman4 (@Cyriptoman4) September 21, 2026
🔹 0,10 $: Kritik direnç
0,10 $ direncinin kırılması ve üzerinde kalıcılık sağlanması halinde yükseliş hareketinin devam etmesi ve 0,1175 – 0,15 $… pic.twitter.com/d3oLkajKKY
The $0.10 area carries immediate importance because DOGE has repeatedly traded around that psychological level since breaking higher. CoinGecko’s current seven-day range extends from roughly $0.0784 to $0.1056, placing the recent local high just above $0.10.
BSC Gems Alert described the higher-timeframe setup as a developing higher-low structure pressing against the upper boundary of a descending pattern.
The analyst said a break and hold above $0.22 could support a move into higher resistance zones, while failure to maintain support would invalidate the bullish setup. With DOGE near $0.10, $0.22 sits more than twice the current market price and represents a longer-term scenario rather than an immediate resistance target.
More aggressive projections have emerged after the weekly rally.
Bark claimed that “the DOGE breakout to $1 has begun” and said the move could occur faster than traders expect.
MikybullCrypto forecast a $1-$3 bullish target range, saying the stronger move was about to begin.
Neither forecast is supported by a timetable or a guaranteed technical outcome. DOGE would need to rise around tenfold from $0.10 to reach $1 and roughly thirtyfold to reach $3.
Dogecoin futures open interest stays above $1.6B
Derivatives markets remain active as traders position around the rally.
CoinGlass reports DOGE near $0.0999, with futures open interest around $1.64 billion. Futures turnover reached roughly $3.05 billion over 24 hours, compared with approximately $531 million in spot volume.
The derivatives data means futures turnover is running several times above reported spot activity. CoinGlass recorded around $5 million in DOGE futures liquidations over the same 24-hour period.
Open interest measures unsettled long and short positions, so a high figure does not establish that traders are predominantly betting on further gains. It does show that substantial leveraged exposure remains open while DOGE trades near its three-month high.
CoinGlass’s open-interest figure has risen from levels seen during earlier periods of weakness. Crypto.news previously reported that DOGE derivatives open interest had fallen toward $1.4 billion during a softer period this year, leaving the current reading above that earlier level.
Leverage can amplify moves in either direction. A sharp decline through support can force long liquidations, while a breakout through resistance can pressure short sellers to close positions.
Whales accumulated 240 million DOGE during pullback
Large-holder activity preceded the latest recovery.
On-chain data shared by analyst Ali Martinez showed whale wallets adding more than 240 million DOGE during the September correction. Holdings attributed to the cohort rose toward 19 billion DOGE as price traded in the low-$0.08 range.
The accumulation occurred while DOGE fell from around $0.091 toward $0.081 between Sept. 9 and Sept. 14. Santiment-based data cited in subsequent market reports indicated the large wallets increased exposure while price weakened.
Whale accumulation alone does not establish future price direction. Large wallets can hedge positions through derivatives, move coins between entities or reduce exposure after accumulating.
Exchange activity has presented another potential source of selling pressure. The market data provided for the recent sessions showed exchange inflows exceeding outflows on several days, indicating some DOGE moved from private wallets toward centralized platforms.
Tokens deposited on exchanges become more readily available for trading or sale, though exchange inflows do not prove that the owner eventually sold them.
The contrasting signals leave DOGE with large-holder accumulation on one side and increased exchange availability on the other.
DOGE faces $0.10 retest while ETF demand remains mixed
The $0.10 region remains the immediate technical test after the token reached a three-month high.
Holding above that level would keep DOGE near the top of its current range and place $0.1056, the latest seven-day high, as the first nearby price barrier.
A failure to hold $0.10 would bring the short-term moving averages back into focus. The nine-period average at $0.10185 and 21-period average at $0.10088 currently sit slightly above price, while RSI around 48 shows no strong momentum advantage for either buyers or sellers.
DOGE’s regulated U.S. investment products present a separate picture from the spot rally.
As previously reported, Bitwise plans to close its Dogecoin ETF after roughly ten months of trading. BWOW’s final trading day is expected on Oct. 14, with remaining shareholders scheduled to receive cash based on the Oct. 21 net asset value around Oct. 22.
Bitwise had roughly $722,000 in fund assets as of Sept. 8, backed by approximately 8.2 million DOGE. The manager said it was optimizing its product range and did not attribute the closure directly to DOGE’s price.
For the spot market, the next technical confirmation remains closer. DOGE needs to regain the nine- and 21-period moving averages while keeping price near $0.10 if the short-term momentum readings are to strengthen again.
Disclosure: This article does not represent investment advice. The content and materials featured on this page are for educational purposes only.

Join Our Telegram channel to stay up to date on breaking news coverage
Binance bought $100 million of Circle stock under a five-year deal that pays the exchange to promote the USDC stablecoin, according to a filing with the US Securities and Exchange Commission published September 22.
Circle issued Binance 1,237,011 Class A shares at $80.84 each in a private placement that closed September 17, the filing states. The stock went at a discount to Circle’s market price before the sale, though the filing does not say how large. Because the shares were sold unregistered, Binance cannot resell them unless they are registered or an exemption applies.
A five-year promotion pact with a monthly fee
Under the commercial agreement, Circle will pay Binance a monthly incentive fee calculated as a percentage of the USDC held through Circle’s Modular Smart Contract Wallet service, while Binance carries out promotional activities for the stablecoin. The fee percentage is not disclosed. Either company can end the five-year partnership early if specified events occur.
Binance cannot sell, transfer, pledge or hedge the shares for up to two years, subject to customary exceptions, unless it terminates the commercial arrangements under certain circumstances. It keeps the right to vote the shares during the lockup.
The arrangement supersedes and replaces agreements the two companies signed in November 2024 and August 2025, making this the third version of the tie-up in under two years. The first deal, announced at Abu Dhabi Finance Week in December 2024, had Binance making USDC available across its products and holding it in its treasury.
Richard Teng, co-CEO of Binance, called the investment and five-year commitment “long-duration conviction” in a statement.
The deal lands amid regulatory pressure
The filing was published one day after Bloomberg reported that federal prosecutors are investigating whether Binance breached US sanctions on Iran.
Circle’s stock has slid during the partnership’s expansion, closing at $94.29 on the NYSE on Monday, according to Yahoo Finance data, after trading in the mid-$80s when the placement closed. CRCL is down about 34% over 12 months, against a 16.5% gain for the S&P 500.
Jeremy Allaire, Circle’s co-founder, chairman and CEO, said Binance has become “the most widely used wallet for dollar stablecoins.”
Join Our Telegram channel to stay up to date on breaking news coverage

Binance has moved to support Zilliqa’s EVM network for ZIL deposits and withdrawals as the blockchain retires its legacy transaction system following a security incident that exposed thousands of accounts.
Summary
- Binance will migrate ZIL from the legacy Zilliqa network to Zilliqa EVM at a 1:1 ratio and handle the process for users.
- Zilliqa is retiring its legacy transaction system after a Ledger app flaw exposed 6,772 accounts and led to at least 683.13 million ZIL being stolen.
- ZIL trading on Binance will remain unaffected, while future deposits and withdrawals will be processed through Zilliqa EVM.
- Self custody holders are being moved through a separate zero knowledge proof based migration process designed to retire exposed legacy keys.
Binance said ZIL will be migrated from legacy Zilliqa mainnet addresses to the Zilliqa EVM network at a 1:1 ratio, with the exchange handling the technical process for users who hold the token on its platform.
Deposits and withdrawals through the legacy Zilliqa network have remained suspended on Binance since Aug. 5 at 01:00 UTC. Once its migration is complete, the exchange will open ZIL deposits and withdrawals through Zilliqa EVM without issuing a separate announcement.
Legacy Zilliqa deposits and withdrawals will no longer be supported after the migration. Spot trading, margin trading, futures and Binance Earn products involving ZIL will remain available during the process.
The Binance move forms part of Zilliqa’s ongoing effort to migrate exchanges, custodians and individual holders away from its legacy Schnorr based transaction system after a flaw in the Zilliqa Ledger application left some private keys vulnerable.
Zilliqa migration follows Ledger signing flaw
The migration stems from a vulnerability in Zilliqa’s Ledger application that affected native, non EVM transactions signed using Ledger devices.
As crypto.news previously reported, the problem involved the way the application generated Schnorr signatures. Each signature requires a random secret number, known as a nonce, but the affected application incorrectly copied the generated data into the signing buffer.
Zilliqa’s Aug. 20 post mortem found that the error left the top 64 bits of each nonce fixed at zero, reducing the randomness needed to protect a private key. An attacker could use several public signatures from the same account to reconstruct its private key.
The defect had been present in every released version of the Zilliqa Ledger application between 2019 and 2026. Zilliqa said the first proven theft occurred on March 4, months before the problem was detected.
Activity picked up in July, and KuCoin notified Zilliqa on July 19 after finding unusual outgoing transactions from one of its cold wallets. Zilliqa disabled legacy transactions on July 20 before identifying the root cause the following day.
The project later confirmed at least 683.13 million ZIL had been stolen across 66 transactions. A total of 6,772 accounts were identified as exposed, while 51 accounts were drained. Zilliqa described both figures as minimum confirmed totals because further exposed accounts could still be identified.
Initial details were much more limited when ZIL transfers were suspended in July. At the time, Zilliqa disclosed that an exchange partner had suffered a cold wallet theft but had not identified the attack method or the amount involved.
Zilliqa EVM transactions were not affected by the vulnerability. The project said software wallets using its supported SDKs generated nonces correctly, while the recovery phrase stored on Ledger devices was not exposed.
ZIL balances are moving to EVM addresses
Fixing the Ledger application could prevent new weak signatures, but Zilliqa said it could not secure private keys that had already been exposed through signatures stored permanently onchain.
The project consequently chose to retire the legacy non EVM transaction system and move users to Zilliqa EVM. Legacy addresses are being retired as balances are reassigned at the protocol level to EVM addresses.
Exchange migrations have been carried out in batches because each participating platform must provide and verify its EVM wallet addresses before balances can be reassigned.
The first exchange migration hard fork took place on Sept. 2, moving balances held in legacy Schnorr based wallets to EVM addresses supplied by participating exchanges.
KuCoin, MEXC, OKCoin, Binance US, Bitvavo, Korbit, Indodax, Bitrue, WhiteBIT, CoinSpot and CoinSwitch were included in the first batch. Users holding ZIL on the participating exchanges were not required to take any action.
A second hard fork was scheduled for Sept. 22 and covered CoinEx, HTX, Bitkub, GOPAX, Coinone, OKX, LBank, Crypto.com, Gate, Paribu, CEX.IO and Bitget.
Bybit and Bithumb were expected to join a third migration hard fork, while Zilliqa said it remained in contact with other platforms as address mappings were collected and verified.
Binance had remained outside the earlier batches. Its latest announcement now confirms that the exchange will stop supporting the old network and move its ZIL deposit and withdrawal infrastructure to Zilliqa EVM.
Self custody holders have a separate ZIL migration route
Exchange customers are not the only holders affected by the retirement of legacy addresses.
Zilliqa has developed a zero knowledge proof based migration system for users who hold ZIL in their own legacy wallets. The system is designed to allow a holder to prove ownership of an old address and transfer the associated balance to an EVM address without giving Zilliqa a seed phrase or private key.
The audit of the ZKP migration tool has been completed, according to a September update from Zilliqa, with internal testing following the security review. Its rollout was targeted for Sept. 22 alongside activation of an escrow contract required for the migration process.
The project has warned users against attempting to move funds through exposed legacy keys. Once an attacker reconstructs a private key from old signatures, both the legitimate holder and attacker can sign transactions from the account.
Legacy transactions were therefore disabled for all holders, including accounts that were never exposed. Zilliqa said freezing the old transaction system prevented attackers with reconstructed keys from moving funds while the migration process was being prepared.
Balances linked to ZIL already stolen during the incident are being handled separately and are not automatically restored through the exchange migration hard forks.
Zilliqa has been working with exchanges and law enforcement to trace the stolen assets. Its post mortem said an exchange account used to liquidate part of the stolen funds had been identified and frozen, while the project was working with Singapore Police and a law firm on the recovery process.
The team has separately proposed a community vote on changes to ZIL tokenomics that could include minting tokens to compensate affected holders. Zilliqa said details covering eligibility, amounts and mechanics would be released with the governance proposal because any new issuance would change ZIL supply.
Zilliqa EVM becomes the network’s production environment
Zilliqa’s move toward EVM infrastructure began before the Ledger incident.
The blockchain transitioned to Zilliqa 2.0 in June 2025, bringing full Ethereum Virtual Machine compatibility alongside a proof of stake consensus system and changes to the network’s architecture.
Its six month testing period involved 21 external validators, with the proto mainnet processing 7.5 million blocks and completing 15 client upgrades before the transition.
Legacy transaction support continued after Zilliqa 2.0 went live, leaving the blockchain with both the older native transaction infrastructure and its EVM environment.
Zilliqa said the Ledger incident brought forward a decision it had already been considering to retire the old infrastructure completely. The project described the legacy stack as an increasing development and security liability and said Zilliqa EVM would become its sole production environment.
The security incident came after several earlier technical problems involving the blockchain, though Zilliqa has not linked those outages to the Ledger vulnerability. A January 2025 network outage was attributed to problems involving lookup nodes, while a separate bug in September 2024 had halted block production.
Zilliqa’s post mortem said the patch for the Ledger application was submitted on July 24 and merged by a Ledger engineer on July 27. The corrected version restores full nonce generation for new signatures, while private keys already exposed through earlier legacy signatures must be retired.

Raiffeisen Bank International has partnered with Bitpanda Enterprise to create a common digital asset framework for its Central and Eastern European banking network, potentially bringing crypto services within reach of up to 18 million customers.
Summary
- RBI and Bitpanda Enterprise have partnered to build a digital asset framework that could serve up to 18 million banking customers across Central and Eastern Europe.
- Bitpanda will provide the underlying crypto infrastructure, while individual RBI network banks will decide their products and rollout plans based on local market and regulatory requirements.
- The agreement expands a model already used by Raiffeisen banks in Austria, where customers can access digital assets through their existing banking services.
- RBI operates subsidiary banks across 11 Central and Eastern European markets, giving the framework the potential to support crypto services across a large traditional banking network.
According to Bitpanda, the agreement will give RBI network banks the infrastructure needed to introduce digital asset services in their respective markets, while individual banks will decide what products to offer and when to launch them based on local regulations and market conditions.
The arrangement expands a model already used by Raiffeisen banks in Austria, where customers have been given access to cryptocurrencies through their existing banking environment. Instead of requiring customers to open a separate account with a crypto platform, Bitpanda provides the infrastructure behind the service offered through the bank.
RBI operates subsidiary banks across 11 Central and Eastern European markets and serves more than 18 million customers. Bitpanda Enterprise will provide the underlying digital asset technology for the network, creating a common setup that participating banks can use when introducing their own services.
RBI Bitpanda partnership builds on Austrian crypto rollout
Raiffeisen’s work with Bitpanda began at Raiffeisenlandesbank Niederösterreich-Wien, or RLB NÖ-Wien, which became one of the early traditional European Union banks to give customers access to cryptocurrencies within its existing banking setup.
Bitpanda supplied the technology behind that service, allowing customers to access digital assets while continuing to use their bank as the main point of contact. The latest RBI agreement takes the same approach beyond an individual Austrian bank and creates a framework that can be used across multiple markets.
Other Raiffeisen banks in Austria have since moved in the same direction. Raiffeisen Landesbank Tirol introduced access to digital assets through Bitpanda Enterprise in June, adding another regional bank to the infrastructure provider’s growing list of traditional banking partners.
The new arrangement does not mean crypto services will become available to all RBI customers at the same time. Each network bank will determine its product offering and launch schedule based on demand, local rules and its operating requirements.
RBI’s footprint gives the partnership considerably more potential reach than the earlier individual integrations. The banking group has around 42,000 employees and roughly 1,300 business outlets, with most of its customer base located in Central and Eastern Europe.
Bitpanda is building its banking infrastructure business
The RBI deal comes as Bitpanda has been expanding the institutional side of its business beyond its original retail crypto platform.
Bitpanda Enterprise provides banks and other financial companies with infrastructure for trading, custody, liquidity, payments, stablecoins and tokenization. Its systems can be integrated into a financial institution’s existing products instead of requiring the institution to build its own crypto infrastructure from the ground up.
Earlier in September, Bitpanda Enterprise expanded its work with BW-Bank as European banks continued adding digital asset products to existing financial services.
Bitpanda has worked with other major financial institutions as well. In May, IG Europe selected Bitpanda to provide liquidity, trading connectivity and market data for its planned European crypto trading expansion.
The Austrian company has maintained ties with Deutsche Bank since 2024, when the German lender began providing local IBANs and real time payment infrastructure for Bitpanda customers in Germany. The relationship has since expanded into other areas of digital asset infrastructure, with Deutsche Bank preparing crypto custody services for Bitcoin and Ethereum.
Bitpanda reported €371 million in adjusted revenue for 2025, up 16% from the previous year, while its user base reached 7.4 million. Crypto.news previously reported that the company was expanding its white label infrastructure business alongside its retail operations.
European banks are adding more regulated crypto services
RBI’s framework comes during a period of growing participation by traditional banks in the European Union’s regulated crypto market.
Banks represented nearly 23% of entities listed on the European Securities and Markets Authority’s crypto provider register by Sept. 16, after their number roughly doubled from around 40 in late June to about 80. The total number of listed crypto providers rose from 243 to 349 over the same period.
German cooperative banks have accounted for part of that growth. Six more institutions joined the register in August, taking Germany’s total number of authorized crypto asset service providers to 79 at the time.
EU rules give banks a separate route into the crypto market under the Markets in Crypto Assets Regulation. Credit institutions can provide covered crypto services after submitting the required information to their home regulator, while crypto companies generally need authorization as crypto asset service providers.
Bitpanda has positioned its regulated infrastructure as a way for banks and financial companies to enter that market without developing their own trading and custody systems. The company operates under MiCA licenses in Europe and has continued supplying infrastructure to institutions expanding their digital asset offerings.
Its regulatory record has faced scrutiny as well. Austria’s Financial Market Authority fined Bitpanda €70,000 in August over breaches involving crypto asset white paper and marketing requirements. The proceedings were completed through an expedited procedure and became the Austrian regulator’s first published final penalty under MiCA.
At the same time, traditional banks have continued taking a larger role in regulated crypto services. ESMA data showed banking institutions accounting for almost one in four listed crypto providers by mid September, though the services permitted for each institution differ and can include custody, transfers, order execution, portfolio management or exchanges between crypto assets and funds.
For RBI, the Bitpanda framework leaves those product decisions with its individual network banks. Participating institutions can introduce digital asset services when their local regulatory and operating conditions allow, using Bitpanda Enterprise as the common infrastructure layer behind their customer offerings.

The race to build artificial intelligence (AI) chips is no longer just about who can make the fastest processor. Now, it is increasingly becoming a China-U.S. technology contest, with companies on both sides pushing to build more of their own AI-computing capabilities as U.S. government restrictions limit China’s access to advanced U.S. chips.
Huawei just gave that race another jolt. The Chinese tech giant is reportedly moving up the launch of its next-generation Ascend 960DT AI chip to the first quarter of 2027 from its previously planned Q3 timeline. Huawei also plans to launch the Ascend 960PR in Q3 2027, accelerating its broader Ascend roadmap as it works to expand China’s domestic AI infrastructure.
More News from Barchart
Huawei is not stopping at individual chips, either. The company is developing UnifiedBus technology to connect groups of AI processors so that they work as larger computing systems. Huawei has developed 11 chips around the technology for its supernode and supercluster systems and has reportedly already shipped more than 1,000 supernode systems.
That matters because Nvidia (NVDA) has become almost synonymous with the AI infrastructure boom. The company’s GPUs power the training and running of advanced AI models, while its advantage stretches beyond chips into networking and the broader software ecosystem. Huawei is now aiming at that system-level advantage, particularly in China, where U.S. export restrictions have made access to Nvidia’s most advanced hardware more difficult.
So, is Huawei’s faster roadmap just another headline, or could it eventually change the competitive landscape for Nvidia? Let’s take a closer look at what the move could mean for Nvidia and where NVDA stock stands from here.
About Nvidia Stock
Nvidia hardly needs an introduction these days. Once known mainly for making graphics chips for gamers, the company has become one of the biggest names in the AI revolution, and one of Wall Street’s favorite ways to play it. Founded in 1993 and headquartered in Santa Clara, California, Nvidia spent decades building its expertise in GPUs before the technology suddenly became central to the AI boom.



Ripple CTO Emeritus David Schwartz has compared a new Connecticut firearms lawsuit with Ripple’s former SEC battle, arguing that both disputes raise questions about businesses determining whether their conduct complies with unclear regulatory standards.
Summary
- David Schwartz compared Connecticut’s Glock dispute with Ripple’s former SEC battle over regulatory clarity concerns.
- Glock filed its federal lawsuit September 21, seeking relief before Connecticut’s October 1 law starts.
- Judge Kari Dooley scheduled a federal September 29 hearing on Glock’s emergency preliminary injunction request.
- Connecticut’s attorney general says the convertible-pistol law is lawful and will be defended in court.
- Ripple and the SEC ended their appeals in August 2025, leaving the final judgment intact.
Schwartz said on Sept. 23 that the situation described in the Glock litigation appeared “grossly unfair,” after attorney Kostas Moros drew attention to Glock’s claim that Connecticut officials had not clearly told the manufacturer whether redesigned pistols comply with a law taking effect Oct. 1. Schwartz added: “Ask me how I know.”
His comparison refers to Ripple’s years-long dispute with the U.S. Securities and Exchange Commission, but the Connecticut case does not involve cryptocurrency, securities law or the SEC. No court has found that Connecticut officials used the same legal strategy as the federal securities regulator; Schwartz’s comments describe his personal interpretation of the two disputes.
Ripple veteran sees familiar uncertainty in Glock case
Glock filed Glock, Inc. v. Griffin et al. in the U.S. District Court for the District of Connecticut on Sept. 21, naming Chief State’s Attorney Patrick Griffin and state prosecutors responsible for enforcing the law. The company brought the case under 42 U.S.C. § 1983 and challenged Connecticut’s new restrictions on “convertible pistols.”
The manufacturer has asked the court for emergency relief before the statute becomes effective. Judge Kari A. Dooley ordered Glock to serve the complaint and injunction papers by noon Sept. 24, gave defendants until 5 p.m. Sept. 28 to respond, and scheduled a hearing for 9:30 a.m. Sept. 29 in Bridgeport.
Connecticut Public Act 26-41 makes it a Class D felony to knowingly import, advertise, sell, offer or expose for sale certain newly manufactured “convertible pistols” beginning Oct. 1. The statute defines the category around semiautomatic pistols with a cruciform trigger bar that can be readily altered and converted into machine guns using a pistol converter.
Glock contends its redesigned Slimline, V Series and Gen 6 handguns should fall outside that definition because the company says they were engineered to resist illegal conversion devices. Its lawsuit seeks a declaration covering those products or, alternatively, relief against enforcement if the court finds the statutory terms too vague. The claims remain allegations and have not been decided.
Schwartz focused on the uncertainty Glock says it faces before the criminal provision becomes enforceable. In his post, he characterized a system where a company “cannot possibly know whether you are complying with the law” as unfair, then connected that complaint to his experience during Ripple’s litigation.
When another X user asked how he knew such tactics, Schwartz replied, “A little birdie told me,” while pointing readers back to the SEC v. Ripple dispute.
Connecticut rejects Glock’s challenge to new law
Connecticut Attorney General William Tong has taken the opposite position on the statute.
Tong said on Sept. 21 that Connecticut’s gun laws are “lawful and lifesaving” and that his office would “aggressively defend” the state against the lawsuit. His statement did not address Schwartz or the Ripple comparison.
The law emerged from H.B. 5043, which Gov. Ned Lamont signed in May. Connecticut’s legislative analysis says the measure applies to newly manufactured convertible pistols and provides a maximum five-year prison term, a fine of up to $5,000, or both for a Class D felony conviction.
A second federal challenge arrived the same day as Glock’s filing. The National Shooting Sports Foundation, Shadow Systems and Blue Trail Range Corporation filed NSSF et al. v. Griffin et al., arguing that the same restrictions violate the Second Amendment. NSSF has described the law as an unconstitutional ban on widely sold striker-fired handguns, a characterization Connecticut disputes.
The federal court calendar currently lists both cases for motion hearings at 9:30 a.m. on Sept. 29 before Judge Dooley.
Schwartz ties dispute back to Ripple’s SEC history
Ripple’s regulatory fight began in December 2020 when the SEC alleged that Ripple Labs, Brad Garlinghouse and Chris Larsen conducted more than $1.3 billion in unregistered XRP securities offerings.
Throughout the case, Ripple disputed the agency’s interpretation of XRP transactions and argued that market participants lacked clear notice about how federal securities law applied to digital assets.
Judge Analisa Torres issued a split ruling in July 2023. She found that Ripple’s institutional XRP sales constituted investment contracts under the circumstances presented, while programmatic exchange sales and certain other distributions did not satisfy the same test.
Schwartz has continued discussing the distinction since leaving Ripple’s full-time CTO role. As previously reported, Schwartz argued that the SEC repeatedly described XRP itself as a security during the litigation, while former SEC officials have said the legal case ultimately concerned Ripple’s transactions and offers rather than an abstract classification of the token.
Ripple officially identifies Schwartz as CTO Emeritus and an XRP Ledger co-creator.
The original SEC case no longer remains active. The SEC announced on Aug. 7, 2025 that both sides had agreed to dismiss their appeals, ending the Commission’s civil enforcement action. The district court’s final judgment stayed in force.
That judgment requires Ripple to pay a $125.035 million civil penalty and subjects it to an injunction concerning future violations of the Securities Act’s registration provisions. The SEC’s own litigation release confirms that dismissal of the appeals did not erase those terms.
In related coverage, Ripple and the SEC formally ended their appellate fight in August 2025 after nearly five years of litigation.
Regulatory clarity remains part of Ripple’s policy message
Schwartz’s latest comment arrives while Ripple continues calling for clearer statutory rules governing digital assets in the U.S.
After the Senate failed to advance the CLARITY Act on Sept. 15, Ripple said the legislation had offered Congress a chance to create “clear, predictable rules of the road.” The company argued that XRP’s existing legal position was not changed by the Senate vote.
Recent comments from Schwartz have kept the old SEC litigation in public view. In July, he said the Commission’s original complaint frequently used language describing XRP as the security, while critics of that reading argued the court’s ultimate focus remained on specific offers and sales.
As previously reported, the final Ripple judgment preserved restrictions on direct institutional XRP sales while leaving exchange-based transactions outside the court’s securities finding.
Ripple executives have separately described how disruptive the case became internally. CEO Brad Garlinghouse said this year that the company seriously considered shutting down after the SEC sued in 2020. Schwartz said outside lawyers at one stage viewed the business as difficult to save, accounts that describe Ripple executives’ recollections and do not establish the SEC’s intent.
The Connecticut litigation now has its own immediate procedural timetable. Glock must complete service by Sept. 24, Connecticut’s defendants must file their response to the requested preliminary injunction by Sept. 28, and Judge Dooley is scheduled to hear arguments Sept. 29 before Public Act 26-41 takes effect Oct. 1.
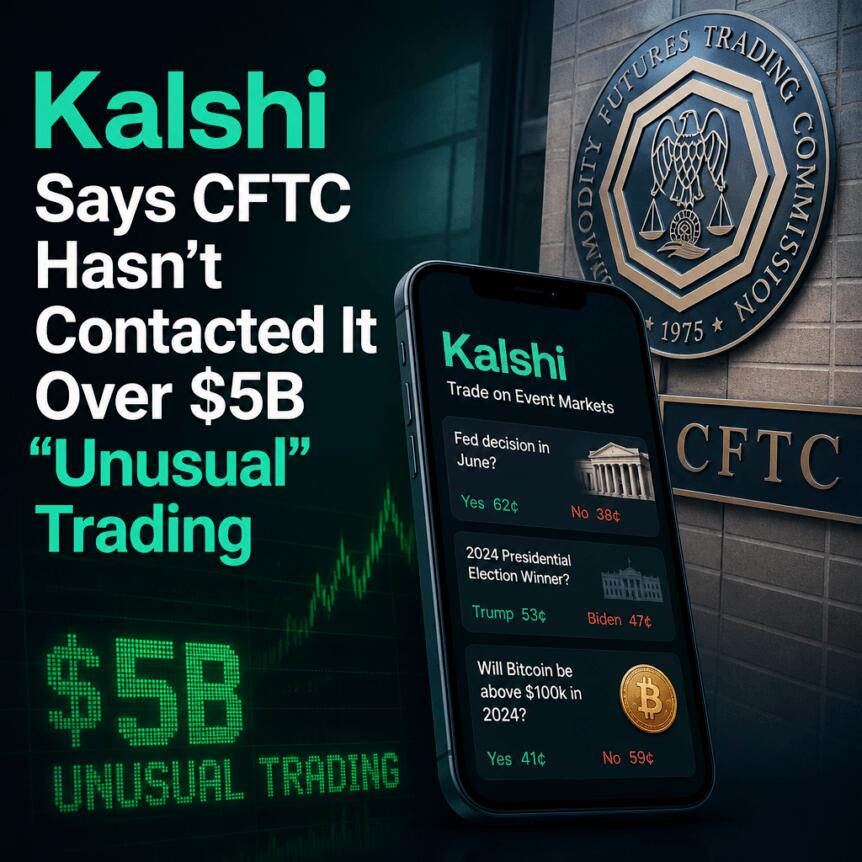
Kalshi has pushed back against reports that the U.S. Commodity Futures Trading Commission (CFTC) is reviewing a suspicious pattern of trading in its Ether perpetual futures market. The exchange says it has not been contacted by regulators and doubts there is any formal examination underway.
The controversy centers on a reported cluster of rapid, nearly identical trades around roughly $5,500 each, allegations that some observers are framing as potential wash trading. The dispute comes as Kalshi’s perpetual futures business has expanded quickly since its May launch.
Key takeaways
- Kalshi says it has not received contact from the CFTC and does not believe a formal review is taking place.
- The CFTC scrutiny described by the Wall Street Journal relates to a repeated $5,500 trade-size pattern in Ether perpetual futures.
- Kalshi attributes repeated order sizes to liquidity incentive programs that reward makers for resting orders within a price band—not to rewards for executed trade volume.
- Kalshi argues the activity reflects normal market-making dynamics with many takers hitting a fixed-size resting order, rather than wash trading.
- The Journal also reported equity-linked incentives tied to trading-volume targets, which Kalshi’s response did not directly address.
CFTC review report meets Kalshi denial
On Tuesday, The Wall Street Journal reported that the CFTC is examining a pattern of rapid trades clustered around $5,500 in Kalshi’s Ether perpetual futures. The report cited a person familiar with the matter and said the trading behavior has sparked allegations of wash trading.
Kalshi responded by disputing the premise of any regulatory action. Elisabeth Diana, head of communications at Kalshi, told Cointelegraph that the company “has not been contacted by the CFTC” and “doesn’t believe there is any formal examination.” She further characterized the chatter as “rumors seeded by competitors,” adding that the behavior is consistent with liquidity incentive programs common in financial markets.
Diana urged people not to rely on social media claims, stating: “Don’t believe everything you read on X.”
What the reported trade pattern suggests
The trades described by the Journal occurred within one of Kalshi’s perpetual futures markets, where participants speculate on the price of an underlying asset without taking spot ownership. In this case, the underlying is Ether.
According to the Journal, trades of roughly $5,500 each accounted for more than $5 billion in Ether perp volume over the past month. The scale of the repeated-size activity is important because wash trading allegations typically emerge when volume appears to rise without genuine economic risk transfer between independent parties.
The Journal also reported that Kalshi offered some traders opportunities to buy equity in the company if they met trading-volume targets. It said the incentives included waived trading fees and monthly cash payments designed to encourage large traders to provide liquidity.
While those incentive structures may be familiar in traditional markets, the details matter in crypto derivatives—particularly when regulators or market observers are trying to determine whether activity is driven by genuine hedging and price discovery or by self-referential execution designed to simulate demand.
Kalshi’s explanation: liquidity programs and market-maker resting orders
In a blog post published on Wednesday, Kalshi sought to clarify why trade sizes appeared repeatedly similar. The company said the recurring $5,500-sized trades reflect programs that pay market makers to keep buy and sell orders available at specified sizes and within set price ranges.
Kalshi’s central claim is that incentives reward the availability of resting orders rather than the volume of trades that ultimately execute. In other words, the firm argues that the structure of its liquidity mechanism can naturally produce repeated execution sizes when many takers interact with a maker’s fixed quotes.
However, Kalshi’s post did not directly address the equity-purchase opportunity tied to trading-volume targets as described by the Wall Street Journal. That omission leaves an open question for readers: even if the trade-size pattern can be explained by market-making design, how equity- or cash-linked targets influence participant behavior remains a separate issue worth watching.
Market-making dynamics vs. wash trading allegations
Kalshi’s response leaned heavily on how derivatives markets function. The company noted that market makers support trading by continuously quoting prices they are willing to buy and sell at, offering other traders ready counterparties. In that framework, market makers can earn from spreads but face losses if prices move against their quoted levels.
In contrast, “takers” are the traders who accept the resting prices offered by market makers. Kalshi argued that the reported fixed-size executions align with a market maker posting orders of a consistent size, then being hit by many takers.
Kalshi also said traders could profit when prices moved on other exchanges, by buying or selling at a market maker’s outdated price. The company further claimed that the activity involved “hundreds of distinct traders,” with takers “pretty consistently right” and the maker “pretty consistently wrong.”
On that basis, Kalshi characterized the pattern as evidence of “genuine economic activity rather than wash,” explaining that wash trading typically shows volume increase without either side taking meaningful profit or loss in the way expected from independent risk-taking.
In essence, Kalshi is arguing that the direction of outcomes—rather than the repetition of trade sizes alone—helps distinguish real liquidity provision from trades that are structured to look active without reflecting true trading interest.
What to watch next
If regulators pursue inquiries, the key remaining uncertainty is whether investigators focus on the liquidity mechanism itself or on the broader incentive ecosystem—especially any elements tied to trading volume targets and equity access. Market participants will likely watch for additional clarification from the CFTC, further documentation from Kalshi, and whether similar patterns appear consistently as perpetual futures markets mature.
Crypto World
How Is Gen Digital’s Stock Performance Compared to Other Software – Infrastructure Stocks?


Valued at a market cap of $17.4 billion, Tempe, Arizona-based Gen Digital Inc. (GEN) is a global company focused on enabling Digital Freedom through trusted consumer brands including Norton, Avast, LifeLock, and MoneyLion. The company provides products and services spanning cybersecurity, online privacy, identity protection, and financial wellness.
Companies valued at $10 billion or more are generally classified as “large-cap” stocks, and Gen Digital fits this criterion perfectly, exceeding the mark. Gen Digital serves nearly 500 million users across more than 150 countries, helping consumers live their digital lives safely, privately, and confidently.
More News from Barchart
Shares of Gen Digital have dipped 9.9% from its 52-week high of $31.65. The stock has increased 25% over the past three months, outperforming the broader iShares Expanded Tech-Software Sector ETF’s (IGV) return of 22.4% during the same period.

Gen Digital’s shares have risen 5.8% on a YTD basis, outpacing IGV’s 1.1% gain. The stock has declined marginally over the past 52 weeks, compared to IGV’s 9.3% drop over the same time frame.
GEN stock has been trading above its 50-day moving average since May.

Gen Digital shares rose 3.8% following its Q1 2027 results on Aug. 6 as adjusted revenue increased 11% to $1.34 billion, bookings grew 11% to $1.28 billion, and adjusted EPS jumped 19% to $0.71, reflecting broad-based growth across both segments. The company also generated $430 million in free cash flow and delivered $668 million in adjusted operating income, up 9%, including EPS surged 65% to $0.36.
In addition, Gen Digital raised its fiscal 2027 revenue guidance to $5.38 billion – $5.48 billion and adjusted EPS guidance to $2.87 – $2.97.
In comparison, rival Microsoft Corporation (MSFT) has underperformed GEN stock. Shares of Microsoft have gained 3% on a YTD basis and declined 3.2% over the past 52 weeks.
Despite the stock’s outperformance relative to its industry peers, analysts are cautiously optimistic, with a consensus rating of “Moderate Buy” from 10 analysts. The mean price target of $33.60 suggests a premium of 17.6% to current levels.
On the date of publication, Sohini Mondal did not have (either directly or indirectly) positions in any of the securities mentioned in this article. All information and data in this article is solely for informational purposes. This article was originally published on Barchart.com

Crypto Par Double Maar! Clarity Act Fail+ Aaj Raat Fed Ka Faisla

Police issue statement and close multiple Edinburgh roads after ‘serious’ collision

Hidebound builders, outdated regulations exacerbate housing shortage




-

 Fashion5 days ago
Weekend Open Thread: Talbots – Corporette.com
-

 Tech3 days ago
Researchers escape OpenAI Codex sandbox to run commands on host
-

 Crypto World5 days ago
Circle launches Arc Studio AI agent for building onchain apps
-

 Crypto World3 days ago
Who Needs CLARITY Anyway? ARB Could See 70X Increase: Hodler’s Digest
-
 NewsBeat5 days ago
Trump says US has reached an agreement to take permanent control of Greenland’s security
-

 Crypto World5 days ago
Trading Bitcoin on Robinhood? Why 2% Spread Has Traders Worried
-
 Crypto World1 day ago
Goldman Sachs and Deutsche Bank Agree: The S&P 500 Rally Isn't Over
-

 Crypto World6 days ago
Mortgage and refinance interest rates today, Thursday, September 17, 2026
-
 Crypto World5 days ago
Bitcoin price breaks channel as RSI climbs to 63
-

 Tech2 days ago
Google’s $899 Googlebook is a bet that you’ll buy a new laptop for Gemini
-

 Business3 days ago
Analog Devices (ADI) Bets $1.35 Billion on Chips that Let Machines Think for Themselves
-

 Crypto World3 days ago
Coinbase, Robinhood, Circle Seen as Tokenized-Stock Winners
-

 Crypto World5 days ago
World Money launches in 150+ countries with Stripe
-

 Crypto World6 days ago
Silver prices recover quickly, hitting weekly high today
-

 Tech4 days ago
Trump suggests rebranding AI with a new name, says he’s also creating an AI Force
-
 Business24 hours ago
Oil Price Today (September 23): Crude oil below $100 on hopes of US-Iran talks. What did Trump say?
-

 Tech6 days ago
GPT-6 Astra Reached the Nether in Minecraft, Lost Its Stash to a Creeper, and Farmed Potatoes for Hours
-
 NewsBeat5 days ago
US was ‘on brink of war’ with China over false AI report of nukes moving in Middle East
-
 Crypto World2 days ago
Meta Jumps 11% As Muse Shines and Investors Show an Appetite for Advancing AI
-

 Crypto World5 days ago
CFTC sends crypto market structure rulemaking to White House
You must be logged in to post a comment Login