
Crypto World
Bitcoin Crashes to $63K as US, Israel Bomb Iran
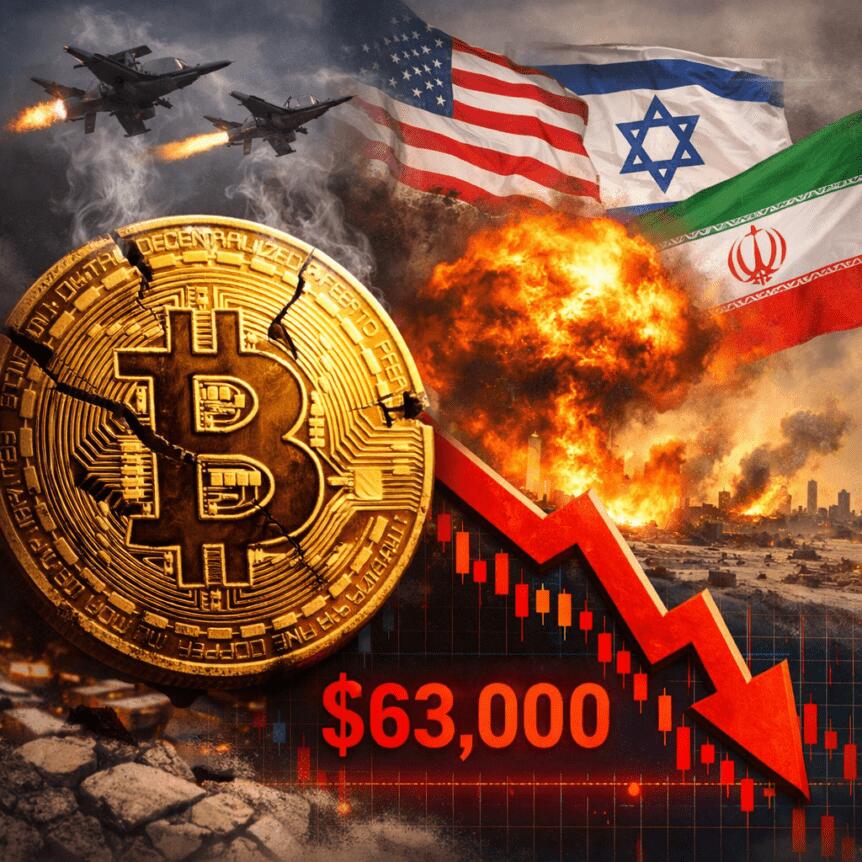
Bitcoin (CRYPTO: BTC) faced renewed geopolitical turbulence over the weekend as reports of a joint U.S.-Israel operation targeting Iran intensified market chatter. The move came as traditional markets remained in a holding pattern, leaving crypto traders to assess the implications in a vacuum. On Saturday, BTC slid toward the lower end of a key trading band, briefly testing the $63,000 region as investors weighed the potential fallout from a campaign aimed at Iran’s nuclear infrastructure. The timing coincided with a quiet moment in traditional markets, where futures and other risk assets had not yet resumed full trading, underscoring how crypto can move on its own schedule during periods of geopolitical stress.
Key takeaways
- BTC traded around the mid-$60,000s, probing the $63,000 level as weekend escalation unfolded and U.S. and Israeli actions were reported against Iran.
- Liquidations tied to the move surpassed $250 million within a four-hour window, highlighting heightened risk-off dynamics within crypto despite a pause in broader market activity.
- Trump’s remarks—calling on Iranians to take over their government after describing the objective as targeting Iran’s nuclear infrastructure—added a political overlay to the headline-led move.
- Crypto markets moved independently of TradFi during the period, with traditional market activity disrupted or delayed, amplifying a crypto-driven narrative around safe-haven + risk-off tension.
- Historical echoes surfaced in trading chatter, referencing prior Iran-related shocks in 2025 that produced outsized volatility across crypto and risk assets, a pattern that some traders cited as context for the current reaction.
Tickers mentioned: $BTC
Sentiment: Neutral
Price impact: Negative. The weekend developments contributed to a near-4% drop and a test of notable support around the $63,000 area.
Trading idea (Not Financial Advice): Hold. Price action remains within a framework of key support and the potential for a renewed test of higher levels will hinge on evolving geopolitical signals and macro cues.
Market context: The episode underscored how geopolitics can drive crypto-specific volatility even when traditional markets are quiet or paused, with liquidity dynamics shaping the immediate response and sentiment.
Why it matters
The unfolding weekend episode reinforces the role of Bitcoin as a potential nonlinear reaction to geopolitical stress. While equities and other traditional assets were not fully pricing in the latest headlines, BTC moved with a decisive tilt, testing an important round-number barrier and illustrating how market participants treat crypto as a distinct risk-on/risk-off instrument during times of international tension. The magnitude of intraday liquidations—reported to exceed $250 million in a short span—highlights the rapid, leveraged dynamics that can accompany sudden shifts in sentiment, even when broader markets remain comparatively subdued.
Beyond the immediate price action, the incident raises questions about liquidity and correlation in the current macro environment. The absence or delay of traditional market participation on the weekend left a vacuum that crypto markets often fill with their own narratives, sometimes amplifying moves beyond what fundamentals would suggest. The juxtaposition of a hawkish geopolitical headline with a crypto market that has recently faced a prolonged drawdown in prior cycles adds texture to the analysis of BTC’s resilience near blocks of support, including around the $60,000 level that traders view as a psychological and technical hinge in this cycle.
The episode also nods to a broader history of Iran-related shocks in the crypto space. A notable note from observers cited a previous Iran-focused episode in 2025 that sparked a surge in volatility across risk assets—an echo that keeps some traders attentive to the potential for follow-through moves as headlines evolve. In this sense, the latest escalation becomes part of a longer-running narrative about how geopolitical risk translates into crypto-specific dynamics, particularly as markets approach monthly or quarterly closes where liquidity and risk sentiment can tighten further.
Against this backdrop, traders remained mindful of the broader inflation and macro data cycle that can compound or cap spikes in volatility. Prior to the weekend move, hot U.S. inflation data had already given Bitcoin bulls a reason to tread carefully, underscoring that price resilience often coexists with a fragile narrative around sustained upside. The combination of a fresh geopolitical shock and sticky inflation metrics paints a complex picture for BTC, where sharp short-term moves coexist with a longer arc of price discovery that is still trying to chart a sustainable path above key support levels.
As the situation evolved, the narrative around Bitcoin’s behavior during geopolitical flare-ups continued to gain traction. Analysts emphasized the importance of monitoring $63,000 as a test point—an inflection that, if held, could set the stage for a cautious rebound or a renewed consolidation. Conversely, a break of that level would invite a fresh wave of risk-off selling and raise the possibility of retesting lower cushions established earlier in the year, particularly given the sensitive macro backdrop and ongoing concerns about liquidity if volatility persists into the February close.
On the ground, observers also noted the role of media framing and social chatter in shaping short-term expectations. A post from political commentators and market analysts alike threaded together the weekend’s headlines with the technical narrative, underscoring how crypto markets continue to operate at the confluence of macro, policy, and technology-driven factors. The result is a market environment where BTC can diverge from traditional assets for stretches, but remains tethered to the same fundamentals that govern risk appetite, funding conditions, and liquidity availability as traders size up the next significant catalyst.
What to watch next
- February monthly close: Watch for whether BTC can defend the $60,000–$63,000 range or if a break below sharpens the downside bias.
- Geopolitical updates: Any new statements or actions from the U.S. or allied governments, and Iran’s official responses, could redraw the risk landscape for crypto markets.
- Liquidity metrics: Monitor liquidity flows and liquidation data from trackers like CoinGlass as markets digest new headlines and potential policy signals.
- Regulatory signals: Any regulatory commentary or policy signals that could affect crypto markets in the wake of geopolitical events.
Sources & verification
- BTC price action near $63,000 and intraday dynamics as reported by market data aggregators (e.g., TradingView) for BTCUSD.
- Public statements from U.S. President Donald Trump regarding the weekend operation and his remarks about Iran.
- Liquidation data tracked by market observatories (CoinGlass) during the four-hour window cited.
- Analysis and context provided by commentators referencing the Kobeissi Letter and its remarks on related Iran-related episodes.
- Historical references to prior Iran-related events affecting crypto and risk assets, including related coverage from Cointelegraph.
Geopolitical shock and Bitcoin’s path
Bitcoin (CRYPTO: BTC) moved to absorb fresh geopolitical headlines as a joint U.S.-Israel operation targeted Iran’s nuclear infrastructure. In the immediate aftermath, price action suggested a cautious mood among traders: the asset hovered near the upper mid-range before dipping toward support levels, with the market registering a roughly four-percent decline in intraday trading. Data from market trackers captured a considerable liquidation footprint—more than $250 million in a four-hour window—underscoring how liquidity can ebb and flow in response to headlines even when traditional markets are less active.
The weekend narrative was further shaped by political signals. A video message from U.S. President Donald Trump contained a dual aim: to describe the operation’s objective as targeting nuclear infrastructure while urging Iranians to “take over your government.” The message added a layer of political risk to an already delicate market environment, illustrating how policy chatter can intersect with price dynamics in crypto markets that are increasingly sensitive to headline risk.
In market commentary, observers noted that crypto markets were effectively operating in isolation as TradFi trading hours were unsettled or paused. This was a period where BTC moved independently of equity futures and other traditional benchmarks, a pattern that some analysts attribute to the asset’s ongoing role as a non-sovereign store of value during times of geopolitical strain. Yet even with a certain degree of independence, BTC’s trajectory remained tethered to the broader macro narrative—specifically, how inflation data and risk sentiment evolve in the days ahead and whether the market can defend key technical fortresses near $60,000.
The historical angle remains salient. Some market watchers pointed to a prior Iran-related episode in 2025 that produced a pronounced risk-off response across crypto and traditional assets, illustrating how geopolitical shocks can imprint a multi-month pattern on price action. While this does not define a forecast, it provides context for current traders who monitor the interplay between headlines, liquidity, and the delicate balance between risk-on and risk-off dynamics at a time when the February close looms.
As the near-term narrative unfolds, the market context remains one of cautious navigation. The combination of geopolitical catalysts, inflation dynamics, and the fragility of intraday liquidity means investors are watching not just the immediate price moves but the persistence of support levels that have held in prior tests. The coming days will reveal whether BTC’s reaction to the weekend headlines translates into a broader shift in momentum or a temporary pause as traders reassess risk preferences ahead of the next macro and policy updates.

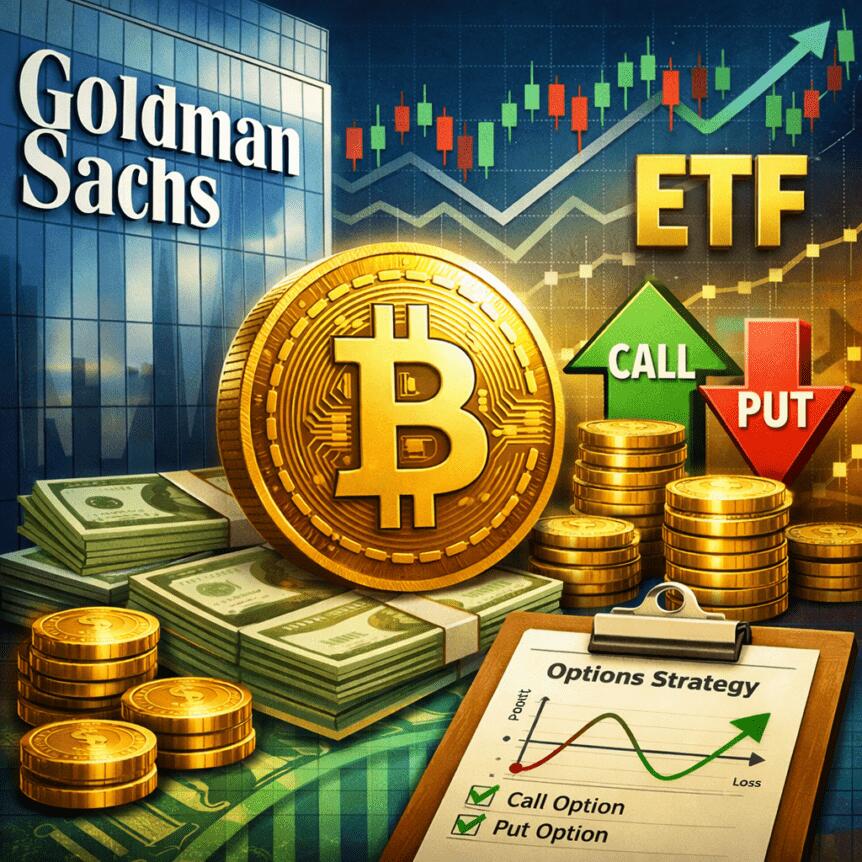
Goldman Sachs has filed with the U.S. Securities and Exchange Commission to launch a Bitcoin Premium Income ETF that aims to deliver current income while shielding investors from Bitcoin’s full volatility. The preliminary prospectus, dated April 14, outlines a vehicle that would invest primarily in spot Bitcoin exchange-traded products (ETPs) and related options rather than holding BTC directly.
According to the filing, the actively managed fund would generate yield by selling call options on Bitcoin-linked ETPs. This “overwrite” strategy can produce premium income but may cap upside in a strong rally. The fund would maintain at least 80% exposure to Bitcoin-linked assets and could allocate as much as 25% of its holdings through a Cayman Islands subsidiary, a structure commonly used to access commodities exposure under the U.S. Investment Company Act.
The prospectus indicates the fund will vary its overwrite policy between about 40% and 100% of its Bitcoin exposure depending on market conditions, and it may distribute a substantial portion of returns as income or a return of capital. Exposure would be gained through a mix of spot Bitcoin ETPs and derivatives, combining direct holdings with options-based positions. The strategy is described as potentially stronger in flat or moderately rising markets, but it could underperform during sharp rallies when upside is capped.
Bloomberg ETF analyst Eric Balchunas described the product as “Boomer Candy” in a post on X, suggesting the structure could attract investors seeking income and lower volatility relative to full upside exposure to BTC. Eric Balchunas noted the appeal lies in capturing yield while mitigating some of Bitcoin’s amplitude, a dynamic that may resonate with risk-managed portfolios.
Separately, Goldman Chair and CEO David Solomon told analysts that Goldman had recently closed its acquisition of Innovator Capital Management, an ETF issuer known for defined-outcome products. Solomon said the acquisition, which adds Innovator’s 170 ETFs to Goldman’s lineup, places the bank in the top 10 of global active ETF providers, a signal of the bank’s broader push into more sophisticated ETF strategies.
Cointelegraph’s coverage of related developments underscores a broader shift in the crypto ETF landscape—from passive price-tracking products to actively managed and outcome-oriented strategies. Bitcoin ETFs have drawn attention as asset managers experiment with yield-generating approaches and macro-linked allocations, reflecting demand for crypto exposure that blends returns with risk controls.
In a related trend report, Bitwise Asset Management in January launched an actively managed ETF designed to hedge against currency debasement, allocating across Bitcoin, precious metals, and mining equities. In March, T. Rowe Price amended its filing for a proposed actively managed crypto ETF that could hold directly in digital assets such as Bitcoin, Ethereum and Solana. Meanwhile, 21Shares has been expanding into more sophisticated active-management structures, including Europe-listed instruments tied to the firm’s Bitcoin-focused strategies. Duncan Moir, 21Shares President, frames these moves as a response to growing demand for active crypto products that can operate within diversified portfolios.
Morningstar and Goldman Sachs Asset Management published a March report examining why active ETFs are gaining momentum, noting that active ETFs globally held nearly $1.8 trillion in assets at the end of 2025, with flows significantly outpacing passive equivalents. The report highlighted a shift in investor appetite toward products that can adapt to changing market regimes, rather than simply tracking an index.
Key takeaways
- Goldman Sachs’ proposed Bitcoin Premium Income ETF would invest primarily in spot Bitcoin ETPs and related options, not hold Bitcoin directly, and would target at least 80% exposure to Bitcoin-linked assets with up to 25% via a Cayman Islands subsidiary.
- The fund would generate yield by selling call options on Bitcoin-linked ETPs, with an overwriting strategy that could range from 40% to 100% of Bitcoin exposure depending on market conditions, potentially distributing income or return of capital.
- The product represents a broader move toward active crypto ETFs, reflecting a demand for income-focused and risk-managed crypto exposure beyond simple price-tracking funds.
- Industry momentum behind active crypto strategies is supported by data showing growing assets in active ETFs (nearly $1.8 trillion globally by end-2025) and continued expansions from Bitwise, T. Rowe Price, and 21Shares, among others.
Active strategies expanding beyond price tracking
The Goldman filing sits within a wider pattern of asset managers exploring active and outcome-focused crypto funds. Bitwise Asset Management, for instance, debuted an actively managed ETF aimed at hedging against currency debasement, while T. Rowe Price has amended its filing to pursue direct crypto holdings in an actively managed format. 21Shares has pushed into more sophisticated strategies, including Europe-listed products tied to its Bitcoin-centric approach.
Industry participants say the shift toward active management reflects investors’ preference for instruments that can adapt to macro conditions and provide additional income streams. Duncan Moir of 21Shares noted that crypto assets are particularly well-suited to active management given their structural volatility and evolving use cases. A March Morningstar-Goldman Sachs Asset Management report reinforces the trend, showing high growth in active ETF assets and suggesting continued momentum for active products in digital-asset markets.
What this means for investors and the market
For investors, Goldman’s proposed Bitcoin Premium Income ETF could offer a familiar mechanism—income generation through option premiums—applied to the crypto frontier, with a measured exposure to BTC through a diversified mix of ETPs and derivatives. The upside is that the fund seeks to reduce some volatility by selling calls and by using a Cayman-domiciled subsidiary structure to access commodity-like exposure. However, the trade-off is a capped upside during strong upside runs, which may diminish the potential for dramatic crypto rallies.
Regulatory scrutiny will be a key factor going forward. The filing lays out a framework that, if approved, would give investors a new way to gain crypto exposure through an income-oriented vehicle rather than direct ownership. Market participants will watch how the SEC weighs such designs, and whether additional disclosure or structural tweaks emerge as the product path unfolds.
Beyond Goldman’s filing, the broader trend toward actively managed crypto ETFs points to a more sophisticated ecosystem where macro themes, volatility regimes, and income considerations intersect with digital-asset exposure. As Morningstar and Goldman Sachs Asset Management highlighted, active ETFs have grown to nearly $1.8 trillion in global assets by late 2025, underscoring a shift toward products designed for more nuanced risk/return profiles.
For traders and institutions, the era of crypto ETFs that blend yield generation with strategic exposure may offer new hedging tools and portfolio options. Yet, as with any new financial product, performance will hinge on market regimes, liquidity, and the SEC’s eventual stance on such structures. The ongoing evolution—driven by major banks and dedicated ETF issuers—suggests that 2026 could feature more active crypto wrappers that balance income, risk, and capital appreciation in innovative ways.
As readers monitor next steps, keep an eye on how regulatory clearances shape the rollout of these products and how performance compares with traditional crypto income vehicles. The coming quarters will reveal whether Goldman’s approach, and similar strategies, can deliver reliable income without sacrificing the upside that has powered Bitcoin’s long-run narrative.

In this photo illustration, Apps for online prediction market sites are shown on an electronic device on Feb. 25, 2026 in Chicago, Illinois.
Scott Olson | Getty Images
Prediction market volumes are booming in 2026, on pace to more than quadruple this year alone and reach an estimated $1 trillion in the next four years, according to Bernstein.
Volumes have already surged in the first few months of this year, the investment bank wrote in a report Tuesday, with Kalshi and Polymarket, the two largest platforms, seeing about $60 billion in market volume year-to-date — more than the $51 billion in total prediction market volume in all of 2025.
Growth rates for the platforms rival the artificial intelligence boom, according to Bank of America. Analyst Julie Hoover in a note last week called Kalshi one of the “fastest growing non-AI companies” in the U.S. Weekly trading volume on Kalshi — which controls more than 90% of the U.S. prediction market — has surged to more than $3 billion today from about $100 million a year ago, she wrote.
While prediction market volumes initially jumped in 2024 around the U.S. presidential election, they eventually surpassed those levels in 2025 as sports, cryptocurrency and macroeconomic contracts became popular.
$1 trillion by 2030
Bernstein analyst Gautam Chhugani now estimates that total market volumes in 2026 will reach $240 billion, a 370% increase compared to last year. At a compound annual growth rate of roughly 80% between 2025 and 2030, Chhugani sees prediction market trading volume of $1 trillion a year by the start of the next decade.
Chhugani expects increased regulatory clarity at the federal level will boost the potential market, and that blockchain tokenization and integration with cryptocurrencies is enabling more liquidity. The makeup of traded contracts is also likely to change, he said.
A Polymarket advertisement in a subway station in New York, US, on Thursday, Feb. 5, 2026.
Michael Nagle | Bloomberg | Getty Images
“We expect [the] institutional market to develop around economics, business and political contracts, as investors seek more direct and discrete exposure to events,” he wrote. While sports contracts make up more than 60% of trading volume today, he sees that being cut in half by 2030. “We also expect hedging demand from corporates, [and] insurance firms exposed to specific event risks.”
While Kalshi and Polymarket dominate the space, new names are building a presence. Robinhood, DraftKings and Underdog are all starting or have already launched their own prediction market verticals, Bank of America’s Hoover said.
Public proxies
Robinhood and Coinbase Global are the key public market proxies for the private prediction market companies, Chhugani said. Robinhood’s prediction markets hub is now a year old, generating $350 million in annual recurring revenue, and accounting for some 30% of Kalshi total volume. The market is the digital finance platform’s fastest-growing business, and could encourage Robinhood to develop its own exchange, the analyst said.
While Chhugani’s long-range estimates assume the resolution of long-term regulatory risk, in the near-term state and federal regulators and the prediction markets themselves are engaged in a pitched battle. “Legal action is now pending in 14 states, plus another 4 congressional bills [are] also pending amid concerns around insider trading,” Hoover wrote.
The Commodity Futures Trading Commission headquarters in Washington, D.C.
Ting Shen | Bloomberg | Getty Images
Some states have begun legal action against prediction markets, citing their authority to regulate sports betting, while the Commodity Futures Trading Commission is fighting states, claiming it has the only authority to regulate prediction markets.
Still, Chhugani has faith that this won’t derail the multi-year outlook.
“Despite ongoing state-level legal challenges, we expect platforms like Kalshi, Polymarket, and public proxies (HOOD, COIN) to benefit from increasing regulatory clarity and growing alignment with federal regulators (SEC, CFTC) — a key driver of market legitimacy and mainstream adoption,” he wrote.
Disclosure: CNBC and Kalshi have a commercial relationship that includes a CNBC minority investment.
Markets shift and headlines fade, but the core principles of building long-term wealth remain constant. Join us for our third CNBC Pro LIVE, where investors of all backgrounds – from financial professionals to everyday individuals – come together to cut through the noise and gain actionable strategies for smarter, more disciplined investing. No matter where you’re starting from, you’ll leave with clearer thinking, stronger strategies. Enter your email here to get a discount code
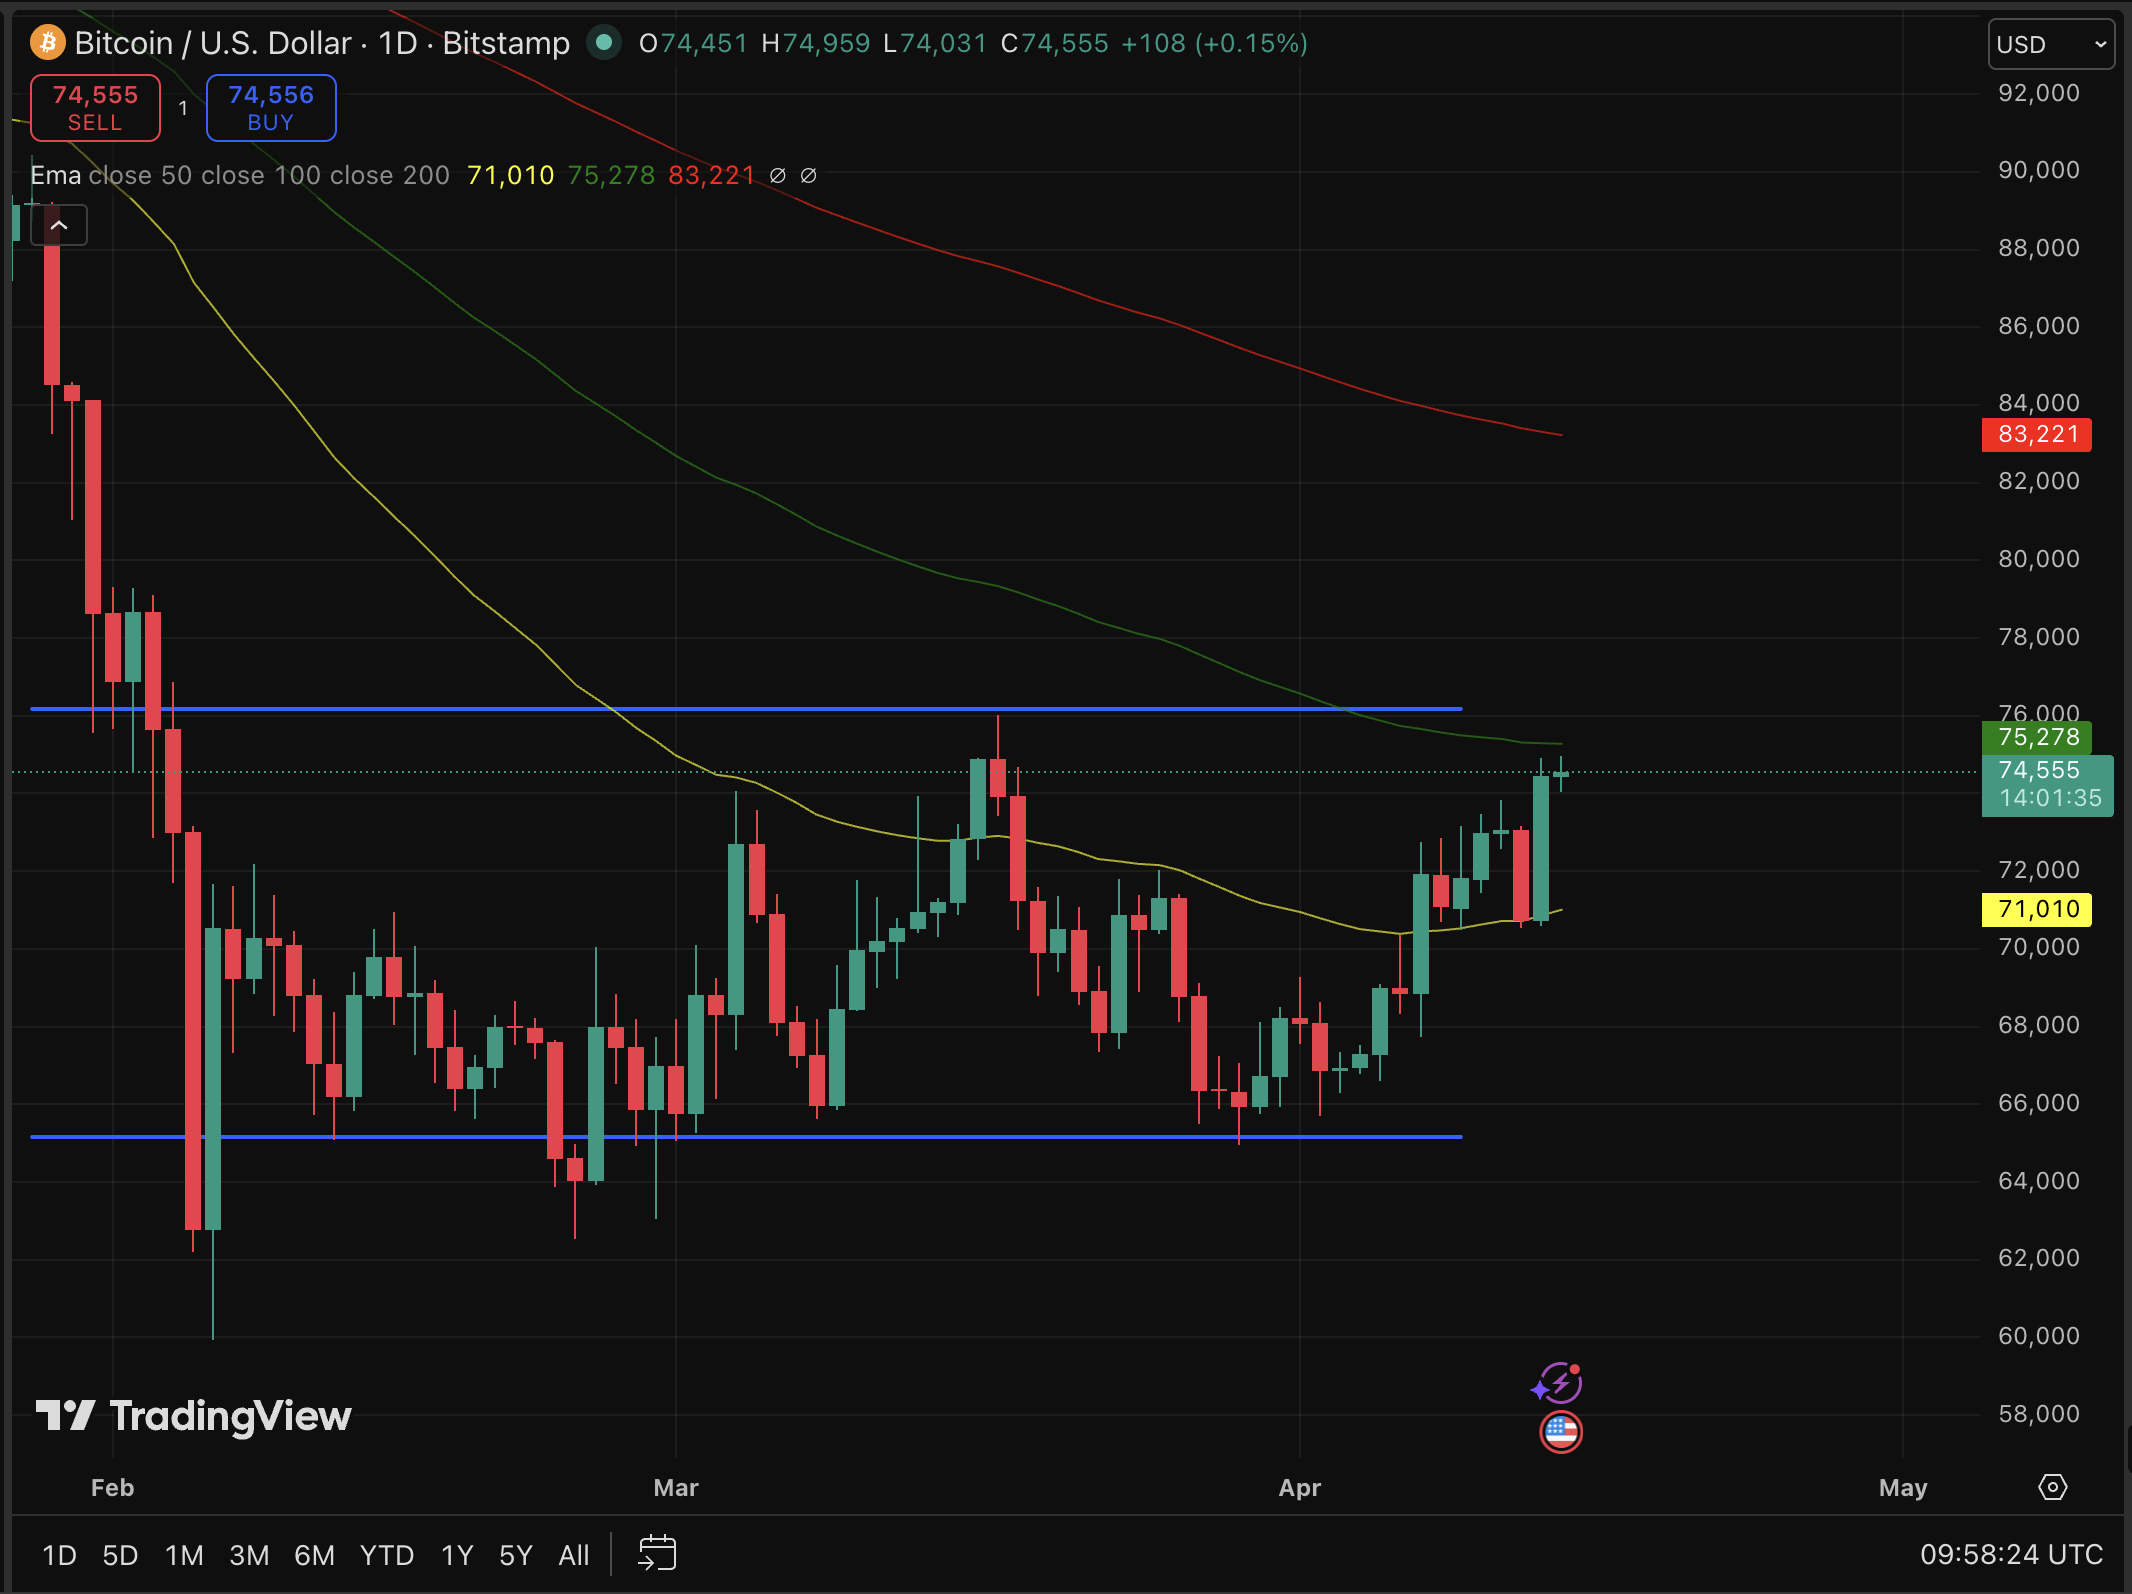
Bitcoin price is approaching $75,000 right now as the bears are running out of room, and our prediction model still says that the rally might not be over just yet. The move represents a sharp reversal from Sunday’s $70,000 capitulation low, a 6% swing in under 24 hours that caught overleveraged shorts badly offside.
The catalyst came at this AM. US President Donald Trump claims that Iran reached out for potential peace talks, even as a naval blockade of the Strait of Hormuz remained active. Risk assets rallied hard on the news, Asian equities climbed, oil expectations eased, and Bitcoin led the charge.
“Bitcoin is following the rally in broader risk assets,” said Damien Loh, chief investment officer at Ericsenz Capital, adding that BTC “continues to trade better than broader risk assets.” Ethereum joined the move, up 5.5% to over $2,370.
Bitcoin has now outperformed significantly since the US-Iran conflict began in late February, up more than 10%, while gold has shed nearly 10% and the S&P 500 sits roughly flat. The macro setup is shifting.
Discover: The best crypto to diversify your portfolio with
Bitcoin Price Prediction: $80,000 in the Picture
Bitcoin is at $74,600, still the strongest bounce in a month. The 24-hour structure shows conviction: analysts had identified roughly $6 billion in leveraged shorts clustered between $72,200 and $73,500, and the move through that band likely triggered a cascade of forced buying.
We flag $80,000 as the defining resistance test for the next major leg. Above that sits the 200-day moving average, just above $83,000. The technical line separates the downtrend from confirmed recovery.
Current price sits just 10% below the $80K level and 15% below the 200-DMA. Prior attempts at $80K have stalled under selling pressure, making a clean break structurally significant.

If Geopolitical de-escalation holds, shorts might continue to get squeezed, and BTC could clear $80K and target $83,000–$94,000. Standard Chartered and Bernstein both target $150,000 by year-end.
The next seven days appear decisive. Macro conditions remain fragile, and a “significant move higher” may not materialize until the US passes the Clarity Act regulatory framework. Price could move fast in either direction.
Discover: The best pre-launch token sales
Bitcoin Hyper With Early-Mover Upside Potential as BTC Breaks Resistance
Bitcoin at $74,000+ sounds bullish, until you price in the math and look at your capital size. A return to the $126K all-time high from here still requires a 69% move.
Institutional capital chasing that return at the current market cap faces diminishing leverage. Early-stage exposure to Bitcoin’s infrastructure layer is where asymmetric upside has historically lived.
Bitcoin Hyper ($HYPER) is positioning directly inside that infrastructure gap. It claims the title of the first-ever Bitcoin Layer 2 with Solana Virtual Machine (SVM) integration, targeting the core limitations that have held Bitcoin back: slow transactions, high fees, and near-zero programmability.
The pitch is sub-Solana latency on a Bitcoin-secured network, with a decentralized canonical bridge handling BTC transfers natively.
The presale numbers are concrete. $HYPER is currently priced at $0.0136, with $32 million raised to date. Staking is live with a high 36% APY bonus. The project has sustained momentum through Bitcoin’s recent volatility as a signal worth watching.
For traders monitoring Bitcoin’s $80K test, research Bitcoin Hyper here before the next price stage activates.
The post Bitcoin Price Prediction: $80K Coming to Wreck Bears appeared first on Cryptonews.

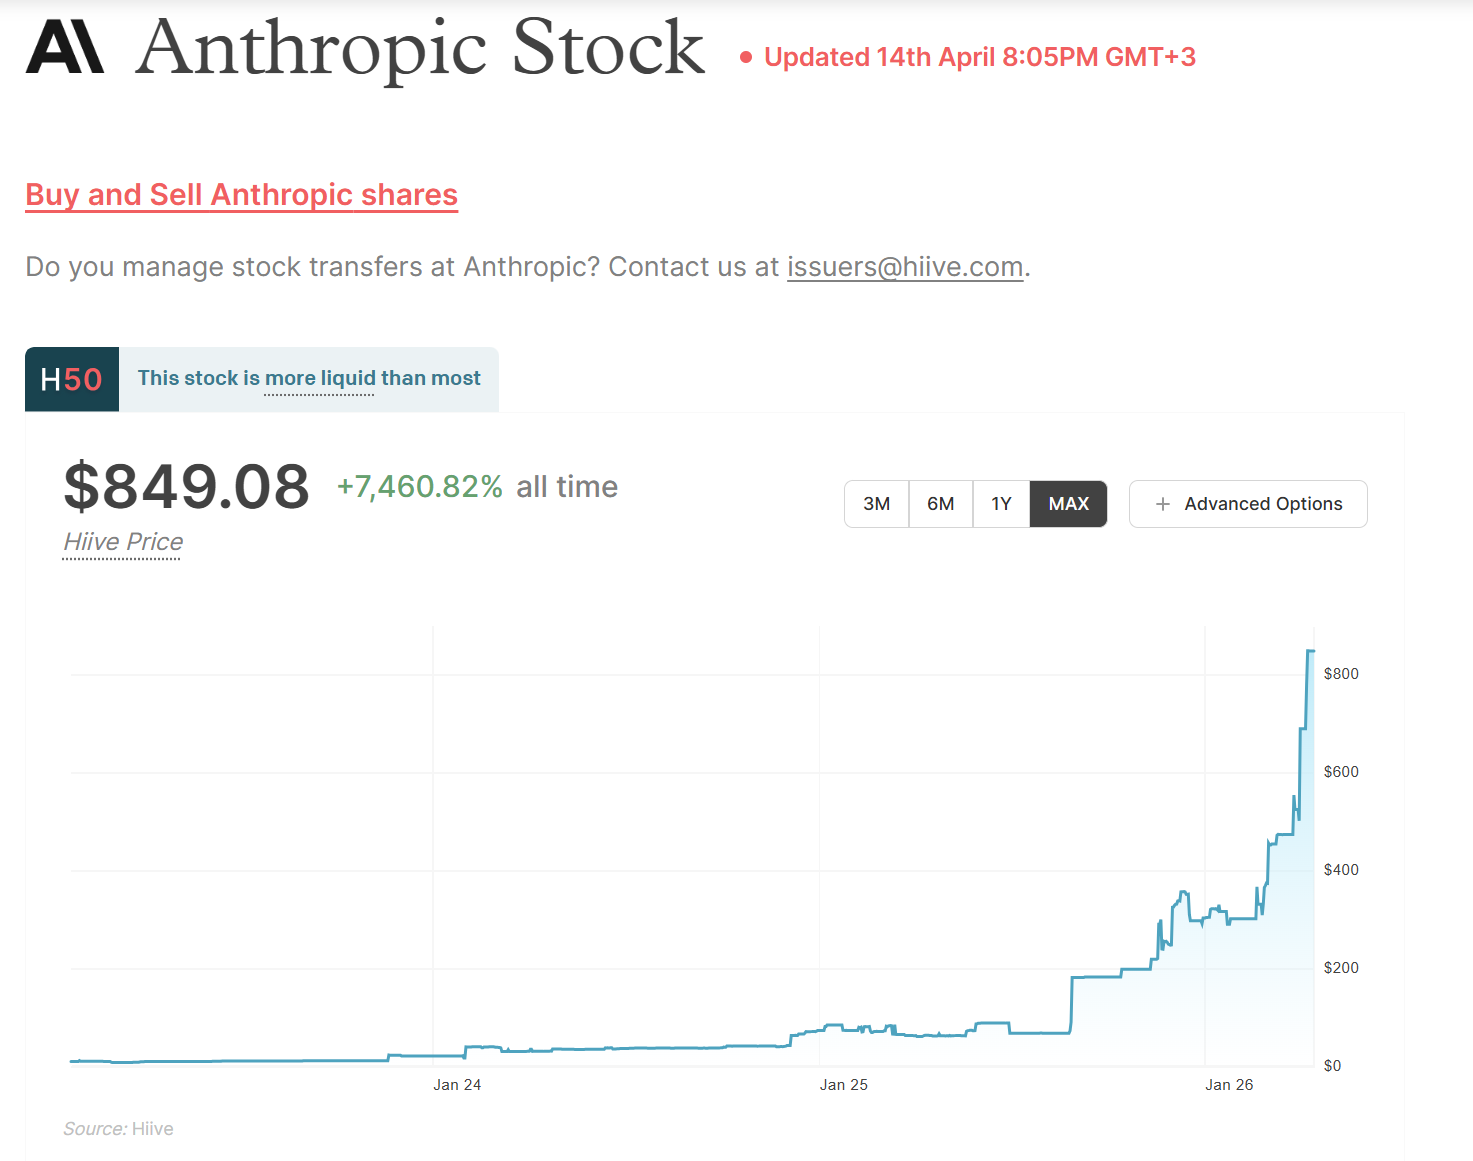
Tokenized pre-IPO Anthropic shares trading on Jupiter now imply a market capitalization of $851 billion, more than double the company’s last official funding valuation.
The synthetic tokens, launched via PreStocks on the Solana-based DEX aggregator, climbed from roughly $122 per share in October 2025 to approximately $900 by April 14, 2026.
Secondary Markets Price Anthropic Far Above Its Last Funding Round
Anthropic closed a $30 billion Series G round in February 2026 at a $380 billion post-money valuation. The gap between that figure and the $851 billion implied on Jupiter reflects aggressive investor positioning ahead of a potential IPO.
Traditional secondary platforms echo the trend. Shares on Hiive, a major pre-IPO marketplace, traded above $849 on April 14, closely matching the on-chain price.
Follow us on X to get the latest news as it happens
The PreStocks tokens are structured instruments backed 1:1 by SPV exposure to actual Anthropic shares.
Holders gain price exposure but receive no voting rights, dividends, or legal ownership in the company, much like how it happens for Bitget is doing with SpaceX pre-IPO.
AI IPO Wave Looms Over Public Markets
Anthropic is reportedly in discussions for a Q4 2026 listing that could raise over $60 billion. Goldman Sachs and JPMorgan Chase are among the banks competing for underwriting roles.
It is not the only AI giant approaching public markets. SpaceX filed confidentially with the SEC in early April, targeting a valuation above $1.7 trillion. OpenAI is also preparing a listing at roughly $1 trillion.
Combined, these three debuts could introduce more than $3 trillion in new market capitalization, a volume that would dwarf total US IPO proceeds over the past decade.
The post Anthropic’s Tokenized Shares on Jupiter Imply $850 Billion Valuation appeared first on BeInCrypto.
Crypto World
TAO Token of Bittensor Tumbles by 20% Post Governance Conflict Triggers Sell-Off in Market
Key Insights
- The TAO token of Bittensor falls over 20% post-exit of Covenant AI, citing governance issues.
- Fears of centralization impact the sentiment of the crypto market negatively.
- Currently, TAO is testing the $250-$263 support level, which requires a recovery above $280.
Price Plunge for TAO Due to Governance Issues
The native coin of Bittensor named TAO fell dramatically by more than 20% to reach approximately $273. This dramatic price plunge came as a rude shock to many traders after witnessing steady gains by the token.
The reason behind this selloff could be the unexpected departure of Covenant AI from the Bittensor network. Although departures happen all the time in blockchain projects, the reason why this departure became noteworthy was due to the substantial reputation that Covenant AI holds in the ecosystem.
Changes in Market Sentiment Happen Quickly
The news about Covenant AI being accused spread quickly throughout cryptocurrency circles, leading to a swift change in market sentiments. Investors who used to consider Bittensor a potential decentralized AI platform started rethinking the possible dangers related to governance transparency and sustainability in the long run.
Apart from damaging the reputation of the project, the departure of Covenant AI also led to negative changes in terms of finances. The organization is said to have liquidated a significant number of TAOs, putting additional pressure on the already falling price of the asset. Moreover, as soon as traders saw how Covenant AI sold its tokens, they rushed to do the same to avoid losses.
Thus, the market sentiment worsened quickly. The governance mechanism of Bittensor was accused of centralization and failing to distribute governance among many members of the network.
Liquidity Puts Downward Pressure on TAO Price
This led to massive selling by leveraged investors whose trades depended on further increases in the price. Their exits accelerated the downward trend. In other words, forced liquidations added further pressure on the TAO price as new sell orders entered the market after the positions were liquidated.
In addition, breaking below $300 was particularly important as it showed how strong bullish sentiment had been before the breakdown. Notably, just a few days earlier, the price was above $340.
Critical Support Zone Comes Into Focus
TAO is now attempting to stabilize in the mid-$260 range, an area that aligns with previous support levels and technical retracements. The immediate support zone between $250 and $263 has become crucial for short-term price action.
If this range holds, the market could enter a consolidation phase, allowing buyers to regain confidence and potentially rebuild momentum. A move back above $280 would be an early signal of recovery and renewed bullish interest.
However, risks remain elevated. If TAO fails to maintain support above $250, the next downside target could emerge around $233. This scenario would likely confirm continued bearish pressure and prolonged uncertainty.
Prognosis Is Still Unclear
Recent developments in relation to Bittensor show how the issue of governance can affect investor sentiment and confidence, particularly within decentralized networks.
Although the project may still have good prospects for success within the realm of AI-blockchain applications, investor sentiment currently remains highly volatile.
In the meantime, investors will be paying close attention to how the price develops, along with any progress within the network itself. The position taken by the Bittensor development team regarding any governance problems may become critical in determining future moves.
For the moment, however, caution appears to prevail.
Goldman Sachs filed with the SEC on April 14 to launch a Bitcoin Premium Income ETF, the bank’s first proprietary Bitcoin (BTC) fund product.
The filing adds Goldman to a growing list of Wall Street banks building dedicated BTC investment vehicles. Morgan Stanley debuted its own spot Bitcoin ETF just days ago.
How the Goldman Sachs Bitcoin ETF Works
The fund will invest at least 80% of net assets in instruments providing Bitcoin exposure. These include spot Bitcoin exchange-traded products and options on Bitcoin ETP indices.
Goldman’s core strategy relies on a dynamic options overwrite. The fund holds long positions in spot Bitcoin ETPs while selling call options against them, collecting premiums as monthly income.
The overwrite level ranges from 40% to 100% of BTC exposure, adjusted based on market conditions.
It does not hold BTC directly. A wholly owned Cayman Islands subsidiary can hold up to 25% of assets, helping the fund meet regulatory requirements for holding commodities under the Investment Company Act of 1940.
In flat or mildly volatile markets, option premiums may help the fund outperform plain spot Bitcoin ETFs. During strong rallies, the sold calls cap upside participation.
ETF analyst Eric Balchunas noted Goldman may be responding to client demand for lower-volatility BTC exposure.
“Goldman may sense opp to leap frog them and/or is prob hearing from their clients they want bitcoin but with less vol and happy to give up some upside for lower downside and income,” he wrote.
Wall Street’s Bitcoin Product Race Heats Up
Goldman has been steadily expanding its crypto footprint. Its most recent 13F filing showed roughly $1.1 billion in Bitcoin ETF holdings and more than $2.36 billion in total crypto ETF exposure.
The bank also recently acquired Innovator Capital Management, which issues Bitcoin-linked structured products.
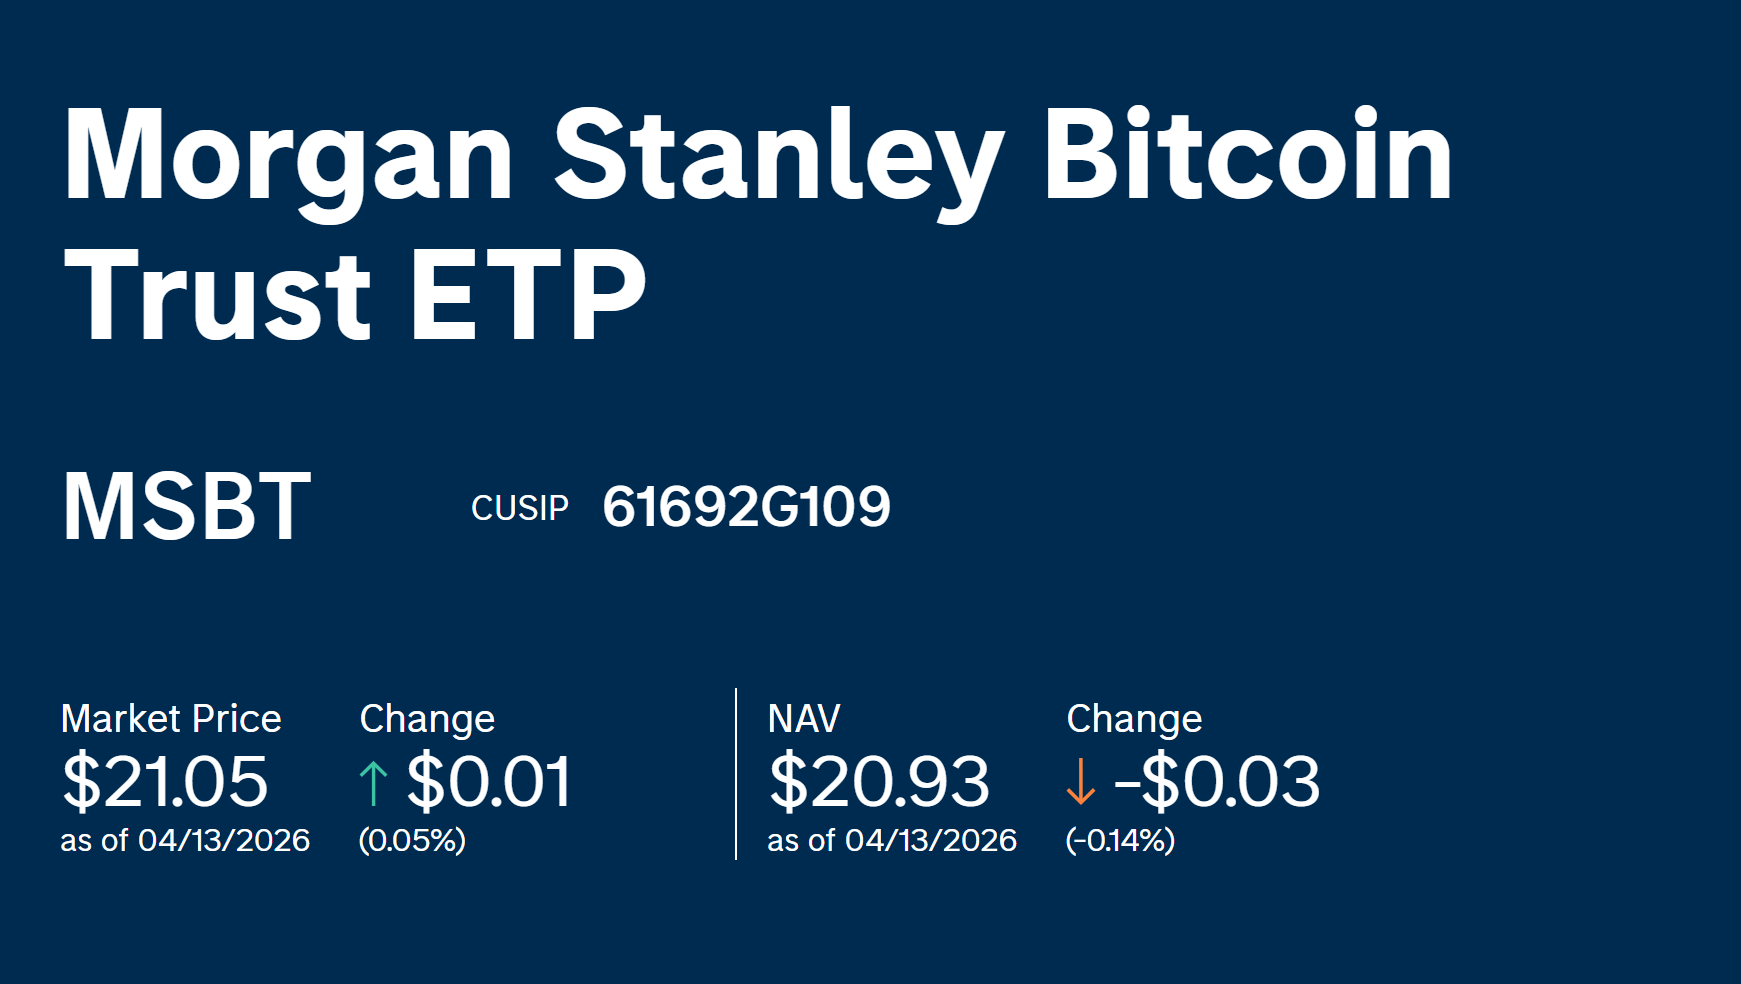
The filing comes less than a week after Morgan Stanley launched the Morgan Stanley Bitcoin Trust (MSBT) on NYSE Arca.

“Seeing a global giant like Morgan Stanley highlighting crypto on their homepage like this is such a positive sign…This is how it goes mainstream. TradFi isn’t on the sidelines of crypto anymore. It is actively prioritising and scaling it as a core asset class. Next stop: every large wealth platform in the world treating crypto like just another asset class,” commented Summit Gupta.
That fund tracks BTC’s spot price at a 0.14% expense ratio, making it the cheapest spot Bitcoin ETF on the market. It drew $30.6 million in first-day inflows.
Goldman’s product targets a different audience. While MSBT appeals to investors seeking pure price exposure at low cost, the Premium Income ETF is designed for those willing to trade upside for regular distributions.
Grayscale launched its own Bitcoin Premium Income ETF (BPI) in April 2025 with a 0.66% expense ratio. BlackRock has a similar product at an advanced stage of development. Goldman’s fees have not yet been disclosed.
The filing is a post-effective amendment. The fund could launch roughly 75 days after the April 14 filing date, pending SEC review. A ticker has not yet been assigned.
For traditional portfolio allocators, the entry of a $3.5 trillion asset manager packaging BTC volatility as yield further narrows the gap between crypto and conventional income investing.
The post Goldman Sachs Targets BTC Yield With New Bitcoin Income ETF appeared first on BeInCrypto.

Kevin Warsh, President Trump’s nominee to chair the Federal Reserve, filed his 69-page financial disclosure with the U.S. Office of Government Ethics, clearing the last bureaucratic hurdle before his confirmation hearing, now expected next week.
The filing reveals combined assets with his wife of at least $192 million — but it’s the crypto-specific holdings buried deep in the document that should interest this industry the most.
Warsh, through a web of venture fund structures, holds equity positions in more than a dozen blockchain and digital asset companies spanning DeFi lending, decentralized derivatives, Layer 1 and Layer 2 networks, prediction markets, and Bitcoin payments infrastructure. And he has pledged to divest the majority of them.
The man who will oversee stablecoin regulation, bank crypto custody policy, and any future central bank digital currency decisions has, until now, been personally invested across the crypto ecosystem, though the size of those holdings was unclear.
The Full Crypto Portfolio
CoinDesk reviewed the complete 69-page OGE Form 278e. Warsh’s crypto and blockchain-related holdings are concentrated in two fund structures: DCM Investments 10 LLC (through a vehicle called Abstract Holdings) and a series of funds labeled AVF I, AVF II, AVF III, and AVGF I and II. Here is every identifiable crypto and blockchain position:
DeFi and trading protocols:
- Compound — Algorithmic crypto money markets, one of the foundational DeFi lending protocols
- dYdX — Decentralized derivatives trading exchange
- Lighter — Decentralized exchange protocol
- Eulith — Crypto trading platform
Layer 1 and Layer 2 networks:
- Solana — High-performance Layer 1 blockchain
- Optimism — Ethereum scaling Layer 2
- Blast — Yield-generating Ethereum Layer 2
- Zero Gravity — Layer 2 AI blockchain platform
- DeSo — Social crypto network
Bitcoin-specific:
- Flashnet — Lightning Network Bitcoin trading platform
- Lightning Network — Off-chain Bitcoin payment network (a direct holding)
Crypto investment and financial infrastructure:
- Polychain — Crypto investment firm
- Scalar Capital — Blockchain investment firm
- Polymarket — Prediction market platform
- Lemon Cash — Crypto financial services platform
- Alpaca — Financial assets API infrastructure
- OnJuno — Crypto-enabled neobank
- OneSafe — DeFi data infrastructure
- Ridian — Crypto portfolio automation
- SkyLink — DeFi portfolio management
- Caliza — Global USD banking platform
- Kinetic — Digital asset exchange platform
Web3, NFTs, and crypto-adjacent:
- Crossmint — NFT developer tools
- CreatorDAO — Creator investment platform
- Friends With Benefits — Web3 community platform
- Dapper Labs — Consumer digital assets (NBA Top Shot)
- Tenderly — Ethereum developer platform
- Vana — Incentivized data collection platform
- Structure (Zaibatsu Heavy Industries) — Blockchain retail trading
- Metatheory — Web3 gaming (held separately as a direct SPV)
In addition, Warsh previously invested in Bitwise Asset Management, the firm behind one of the spot bitcoin ETFs, though that position does not appear on the current disclosure.
What he has to sell — and what that means
Most of these crypto positions sit within fund vehicles whose individual line items are reported without dollar values, which, under OGE rules, means each is worth less than $1,000. In other words, they’re small venture bets, not concentrated positions.
But there are bigger pots that almost certainly contain crypto exposure. Warsh holds over $100 million in Juggernaut Fund LP, whose underlying assets are shielded by confidentiality agreements. He also holds dozens of positions in THSDFS LLC, some valued at $1–$5 million individually, all similarly opaque. Both will require full divestiture.
OGE certifying official Heather Jones flagged these in her review, noting that Warsh will be in compliance with the Ethics in Government Act once he completes the divestitures. The open question is how that divestiture plays out for illiquid venture stakes. Selling a position in Compound or dYdX token holdings is straightforward; unwinding LP stakes in Polychain or Bessemer Venture Associates funds is not.
The conflict question
Even after selling, Warsh will face a complicated recusal landscape. Federal ethics rules generally require a one-year cooling-off period for matters directly affecting recent financial interests. That could be relevant as the Fed weighs in on:
- Stablecoin legislation: Congress is actively debating stablecoin frameworks that would define which institutions can issue and custody stablecoins — directly impacting DeFi protocols and crypto neobanks like those in Warsh’s portfolio.
- Bank crypto custody guidance: The Fed’s supervisory stance on whether banks can custody digital assets has been one of the most contested policy questions in crypto since 2022.
- Tokenized deposits and securities: The Fed has a direct role in approving or discouraging bank experimentation with tokenized deposits, an area adjacent to several Warsh holdings.
- CBDC research: Though political support for a U.S. CBDC has cooled, the Fed’s ongoing research intersects with the payment network infrastructure represented by Lightning Network and Solana holdings.
The Bigger Picture
What’s striking is less the size of the crypto bets — most are small — but more that they exist at all. This is not a nominee who passively held bitcoin through a brokerage account. Warsh deliberately sought exposure to the specific protocols, networks, and infrastructure companies that the Fed’s regulatory and monetary policy decisions most directly affect.
His broader financial profile underscores the point. Warsh earned $10.2 million in consulting fees from Duquesne Family Office, the investment arm of Stanley Druckenmiller, one of crypto’s most prominent macro investors. He collected $1.55 million from GoldenTree Asset Management, $750,000 from Cerberus Capital Management, and another $750,000 in honoraria from Brevan Howard — all firms with significant digital asset trading operations.
His speaking fee circuit in the first half of 2025 alone totaled over $780,000 from firms including TPG, Warburg Pincus, State Street, Eli Lilly, and Centerview Partners.
Combined with spouse Jane Lauder’s estimated $1.9 billion net worth, Warsh would be among the wealthiest Fed chairs in modern history.
What comes next
Senate Banking Committee chair Tim Scott (R-S.C.) said Tuesday that a confirmation hearing will be held next week. But Sen. Thom Tillis (R-N.C.) continues to block any final vote until the Justice Department drops its criminal investigation of current Fed Chair Jerome Powell, whose term expires May 15.
The crypto holdings will almost certainly come up in questioning. Senators on both sides have grown more focused on financial conflicts at the Fed, and Warsh’s portfolio gives them specific, named companies to ask about.
For the crypto industry, the Warsh disclosure is a double-edged signal. On one hand, a Fed chair with personal venture exposure to DeFi and blockchain infrastructure may have more nuanced views on the technology than predecessors who had none. On the other hand, the mandatory divestiture and recusal obligations could constrain his ability to act on whatever sympathies those investments imply — at least in the first year.


ECB chief economist Philip Lane warned the central bank could still raise interest rates if inflation’s impact lasts longer than expected, keeping tightening risks alive even after March’s pause.
Summary
- ECB’s Philip Lane says rates could rise if inflation’s impact lasts longer.ecb.
- Comments reinforce data‑dependent stance after March decision to hold rates.ecb.
- Markets already pricing in up to three hikes this year amid energy risks.
European Central Bank chief economist Philip Lane has warned that interest rates may yet rise if inflation in the euro area proves more persistent than policymakers currently expect, keeping the door open to further tightening even after the ECB held borrowing costs steady in March.
According to Jinshi’s summary of Lane’s latest remarks, the Governing Council member said that “if the impact of inflation lasts for a longer period, the European Central Bank will consider raising interest rates,” underlining that the fight against above‑target price growth is not over.
His comments echo recent guidance from ECB President Christine Lagarde, who told the Financial Times that “if we expect inflation to deviate significantly and persistently from target, the response must be appropriately forceful or persistent,” signalling that rate hikes remain on the table if price pressures re‑accelerate.
In its March policy decision, the ECB left its three key interest rates unchanged and reiterated that it is “determined to ensure that inflation stabilises at the 2% target in the medium term,” while acknowledging that the conflict in the Middle East has created upside risks for inflation via higher energy costs.
The central bank’s latest projections see headline inflation averaging 2.6% in 2026 and hovering around 2% in 2027 and 2028, but officials including Lane have flagged that wage dynamics and firms’ price‑setting plans will be watched closely at “every meeting” to judge whether those forecasts remain credible.
Lagarde has also stressed that “self‑reinforcing mechanisms” could take hold if inflation expectations drift away from the target, warning that the risk of de‑anchoring would “become acute” without a sufficiently firm response, a stance that has kept markets wary of declaring the hiking cycle definitively over.
Traders in money markets currently price in two to three ECB rate increases by year‑end, which would lift the main policy rate toward a range of roughly 2.50% to 2.75%, with the timing seen as highly sensitive to incoming inflation prints and developments in energy markets.
For crypto investors, Lane’s signal that rates could still rise if inflation lingers adds another macro variable to watch alongside the European inflation data and central bank communications that crypto.news has tracked in previous coverage of ECB decisions and their spillover into Bitcoin and Ethereum markets.


Binance founder Changpeng Zhao (CZ) dedicated a considerable portion of his autobiography, Freedom of Money, to talking about somebody called Wei Zhou.
Indeed, Zhao is this fifth most mentioned person in the book, tied with Sam Bankman-Fried (SBF) with 23 mentions. But who is he?
Zhao joined Binance from Goldman Sachs in 2018 as its first chief financial officer (CFO).
He’d previously shepherded two companies through NYSE and NASDAQ IPOs, and in Binance’s eyes, he brought institutional credibility that the then-one-year-old crypto exchange desperately needed.
Zhou is now CEO of Coins.ph, a Philippines-based crypto wallet and exchange that he acquired from Indonesian super-app Gojek in 2022 for roughly $200 million.
He also advises Old Fashion Research, a blockchain fund run by former Binance executives, as well as serving as vice chairman of the gay dating app Grindr.
Wei Zhou : From CZ’s first CFO to his nemesis
CZ used Freedom of Money, written largely during his time in prison and published on April 8, to paint Zhao as an unreliable subordinate-turned-antagonist.
Specifically, it frames his tenure around two grievances.
The first involves Zhao’s role in Binance’s FTX investment.
FTX launched in May 2019 and within months, SBF approached Binance for investment. Zhao championed the deal, yet CZ claims that he initially declined.
However, by late 2019, FTX lowered its valuation and sweetened the offer with a Binance Coin (BNB) for FTX token (FTT) token swap. Binance agreed, taking a 20% stake in SBF’s company that would implode three years later.
Fortunately for CZ, Binance was able to sell its FTX equity, before FTX went bankrupt.
Fintech Alliance Philippines and Binance
CZ also complained about Zhao’s role in Binance’s Philippine expansion.
In September 2022, Zhao wrote to the chairman of Fintech Alliance Philippines, questioning a blockchain education partnership between the Alliance and Binance.
The letter, which a Philippine crypto publication published in full, called Binance an unregistered virtual asset service provider.
Zhao claimed that Coins.ph was “astounded” by the Binance-Alliance collaboration, an assertion that CZ frames as an underhanded attempt to block Binance from the Philippine market.
Unsurprisingly, Zhao denied the framing and told reporters, “We did not block Binance from joining. We asked to be involved in blockchain education initiatives of Fintech Alliance Philippines.”
Partial financials for his CFO
Basically, CZ’s memoir casts Zhou as a disloyal insider. However, other reports tell a different story about who kept whom in the dark.
Reuters reported in December 2022 that Zhao never had access to Binance’s full financial accounts during his tenure as CFO of nearly three years. Reuters says that two former colleagues confirmed that claim.
It also claimed the world’s largest crypto exchange ran its finances as a “black box” obscured from even its own CFO.
Zhao wasn’t the only executive to discover CZ’s centralized grip over Binance.
Binance.US, launched in 2019 while Zhao still served as global CFO, was meant to operate independently.
However, its first CEO, Catherine Coley, was replaced without explanation. Her successor, former US Comptroller of the Currency Brian Brooks, lasted less than four months.
Brooks later testified concerningly that he realized CZ ran the US entity, not him.
The SEC would eventually allege that Binance.US was a sham, controlled behind the scenes by CZ while publicly claiming independence.
Zhao left Binance in June 2021, the same summer Brooks walked out of Binance.US. Binance cited personal reasons for both departures.
Read more: How the battle between Binance and FTX went from bad to worse
Binance Avengers
After leaving, Zhao created a private group that CZ’s memoir called the “Binance Avengers.” It gathered disgruntled former employees to criticize the exchange.
CZ’s book claims some members later lost money after transferring assets to FTX.
The Binance supremo also places Zhao on an informal enemies list alongside SBF and OKX founder Star Xu. As Protos reported, the CZ-Xu grudge escalated to a $1 billion bet within days of the book’s release.
Got a tip? Send us an email securely via Protos Leaks. For more informed news, follow us on X, Bluesky, and Google News, or subscribe to our YouTube channel.

TLDR
- XRP rose to $1.37 after gaining 3.83% and ending a three-day decline.
- XRP Futures net inflows surged 294% to $46.15 million within 24 hours.
- Derivatives data showed steady inflows across 4-hour, eight-hour, and 12-hour timeframes.
- Short liquidations reached $1.59 million over 24 hours and made up 88% of total liquidations.
- Spot exchange data showed a $10.07 million net outflow as holders moved XRP off exchanges.
XRP climbed to $1.37 after posting a 3.83% intraday gain on Monday, reversing three days of declines. At the same time, derivatives data showed futures net inflows surged 294% to $46.15 million within 24 hours. The combined price recovery and leverage increase signaled renewed trader participation.
XRP Futures Record $46M Daily Inflows as Leverage Builds
XRP Futures activity accelerated as traders reopened leveraged positions across major exchanges. Data from Coinglass showed 24-hour net inflows reached $46.15 million, reflecting a 294.78% increase. Meanwhile, four-hour data recorded $71.16 million in inflows and a net increase of $753,280. Over eight hours, inflows totaled $111.03 million, while outflows hit $106.32 million, leaving a $4.71 million net gain.
In the 12-hour window, inflows reached $286.18 million against $277.18 million in outflows. This pattern confirmed steady positioning by derivatives traders. Rising participation often increases short-term volatility, and current figures showed active positioning across multiple timeframes. XRP traded at $1.37 at press time after Monday’s upward move.
Liquidations and Spot Outflows Shape Current XRP Structure
Liquidation data reflected pressure on bearish positions as prices moved higher. In the last 12 hours, total liquidations reached $328,110, including $70,870 from longs and $257,250 from shorts. Over 24 hours, total liquidations climbed to $1.79 million, with $1.59 million from short positions. Shorts accounted for 88% of total liquidations during that period.
At the same time, spot exchange flows showed net withdrawals. In the eight-hour timeframe, inflows stood at $27.34 million, while outflows reached $26.45 million, producing a $893,470 net inflow. However, in 12 hours, inflows totaled $62.99 million, and outflows climbed to $67.40 million, leaving a $4.42 million net outflow.
Across 24 hours, inflows reached $131.03 million, while outflows exceeded that at $141.10 million. This resulted in a $10.07 million net outflow and a -203.62% net change. Exchange withdrawals indicated that holders moved tokens off trading platforms during the rebound.
Market data showed that liquidations occurred alongside tightening exchange balances. The price structure shifted as short positions closed and futures inflows expanded. XRP continued to trade near $1.37 as derivatives and spot metrics reflected active market participation.

Structure Therapeutics names Matthew Lang as COO and counsel

Goldman Sachs Plans Bitcoin Income ETF Using Options Strategy

Goalies are under siege as the NHL save percentage dips to its lowest point in three decades


-

 Politics4 days ago
US brings back mandatory military draft registration
-
 Sports4 days ago
Man United discover Nico Schlotterbeck transfer fee as defender reaches Dortmund agreement
-

 Fashion4 days ago
Weekend Open Thread: Veronica Beard
-

 Tech7 days ago
How Long Can You Drive With Expired Registration? What Florida Law Says
-

 Politics5 days ago
Malcolm In The Middle OG Turned Down ‘Buckets Of Money’ To Appear In Reboot
-

 Politics2 days ago
World Cup exit makes Italy enter crisis mode
-

 Crypto World5 days ago
Canary Capital Files SEC Registration for PEPE ETF
-

 Business4 days ago
Tesla Model Y Tops China Auto Sales in March 2026 With 39,827 Registrations, Beating Cheaper EVs and Gas Cars
-

 Crypto World1 day ago
The SEC Conditionalises DeFi Platforms to Be Avoided for Broker Registration
-

 Crypto World22 hours ago
SEC Signals Exemption for Crypto Interfaces From Broker Registration
-

 Crypto World6 days ago
Bitcoin recovers as US and Iran Agree a Ceasefire Deal
-
 NewsBeat2 days ago
Pep Guardiola and Gary Neville agree over Arsenal title problem that benefits Man City
-

 Business4 days ago
OpenAI Halts Stargate UK Data Centre Project Over Energy Costs and Copyright Row
-

 Business3 days ago
Ireland Fuel Protests Enter Day 5 as Blockades Spark Shortages and Government Prepares Support Package
-

 Politics5 days ago
LBC Presenter Mocks Trump Over Iran War Failures
-

 Crypto World4 days ago
Federal judge blocks Arizona from bringing criminal charges against Kalshi
-
 NewsBeat3 days ago
JD Vance announces ‘no agreement’ with Iran over nuclear weapons fear
-

 Tech5 days ago
A version of Windows 10 released a decade ago is now eligible for additional security patches
-

 Business4 days ago
IMF retains floor for precautionary balances at SDR 20 billion
-

 Crypto World15 hours ago
SEC Proposes Certain Crypto Interfaces Don’t Need to Register as Brokers
You must be logged in to post a comment Login