
Crypto World
Cardano Price Reversal Failed As Whales Sold $540 Million Into It
The Cardano price flashed a textbook bullish divergence on the daily chart, surged 24%, then collapsed. On-chain data reveals a coordinated whale exit worth over $540 million into the rally — even as the Money Flow Index confirmed retail was actively buying the dip.
Here’s what happened, and what it means next.
Daily RSI Divergence Fired & MFI Confirmed the Move
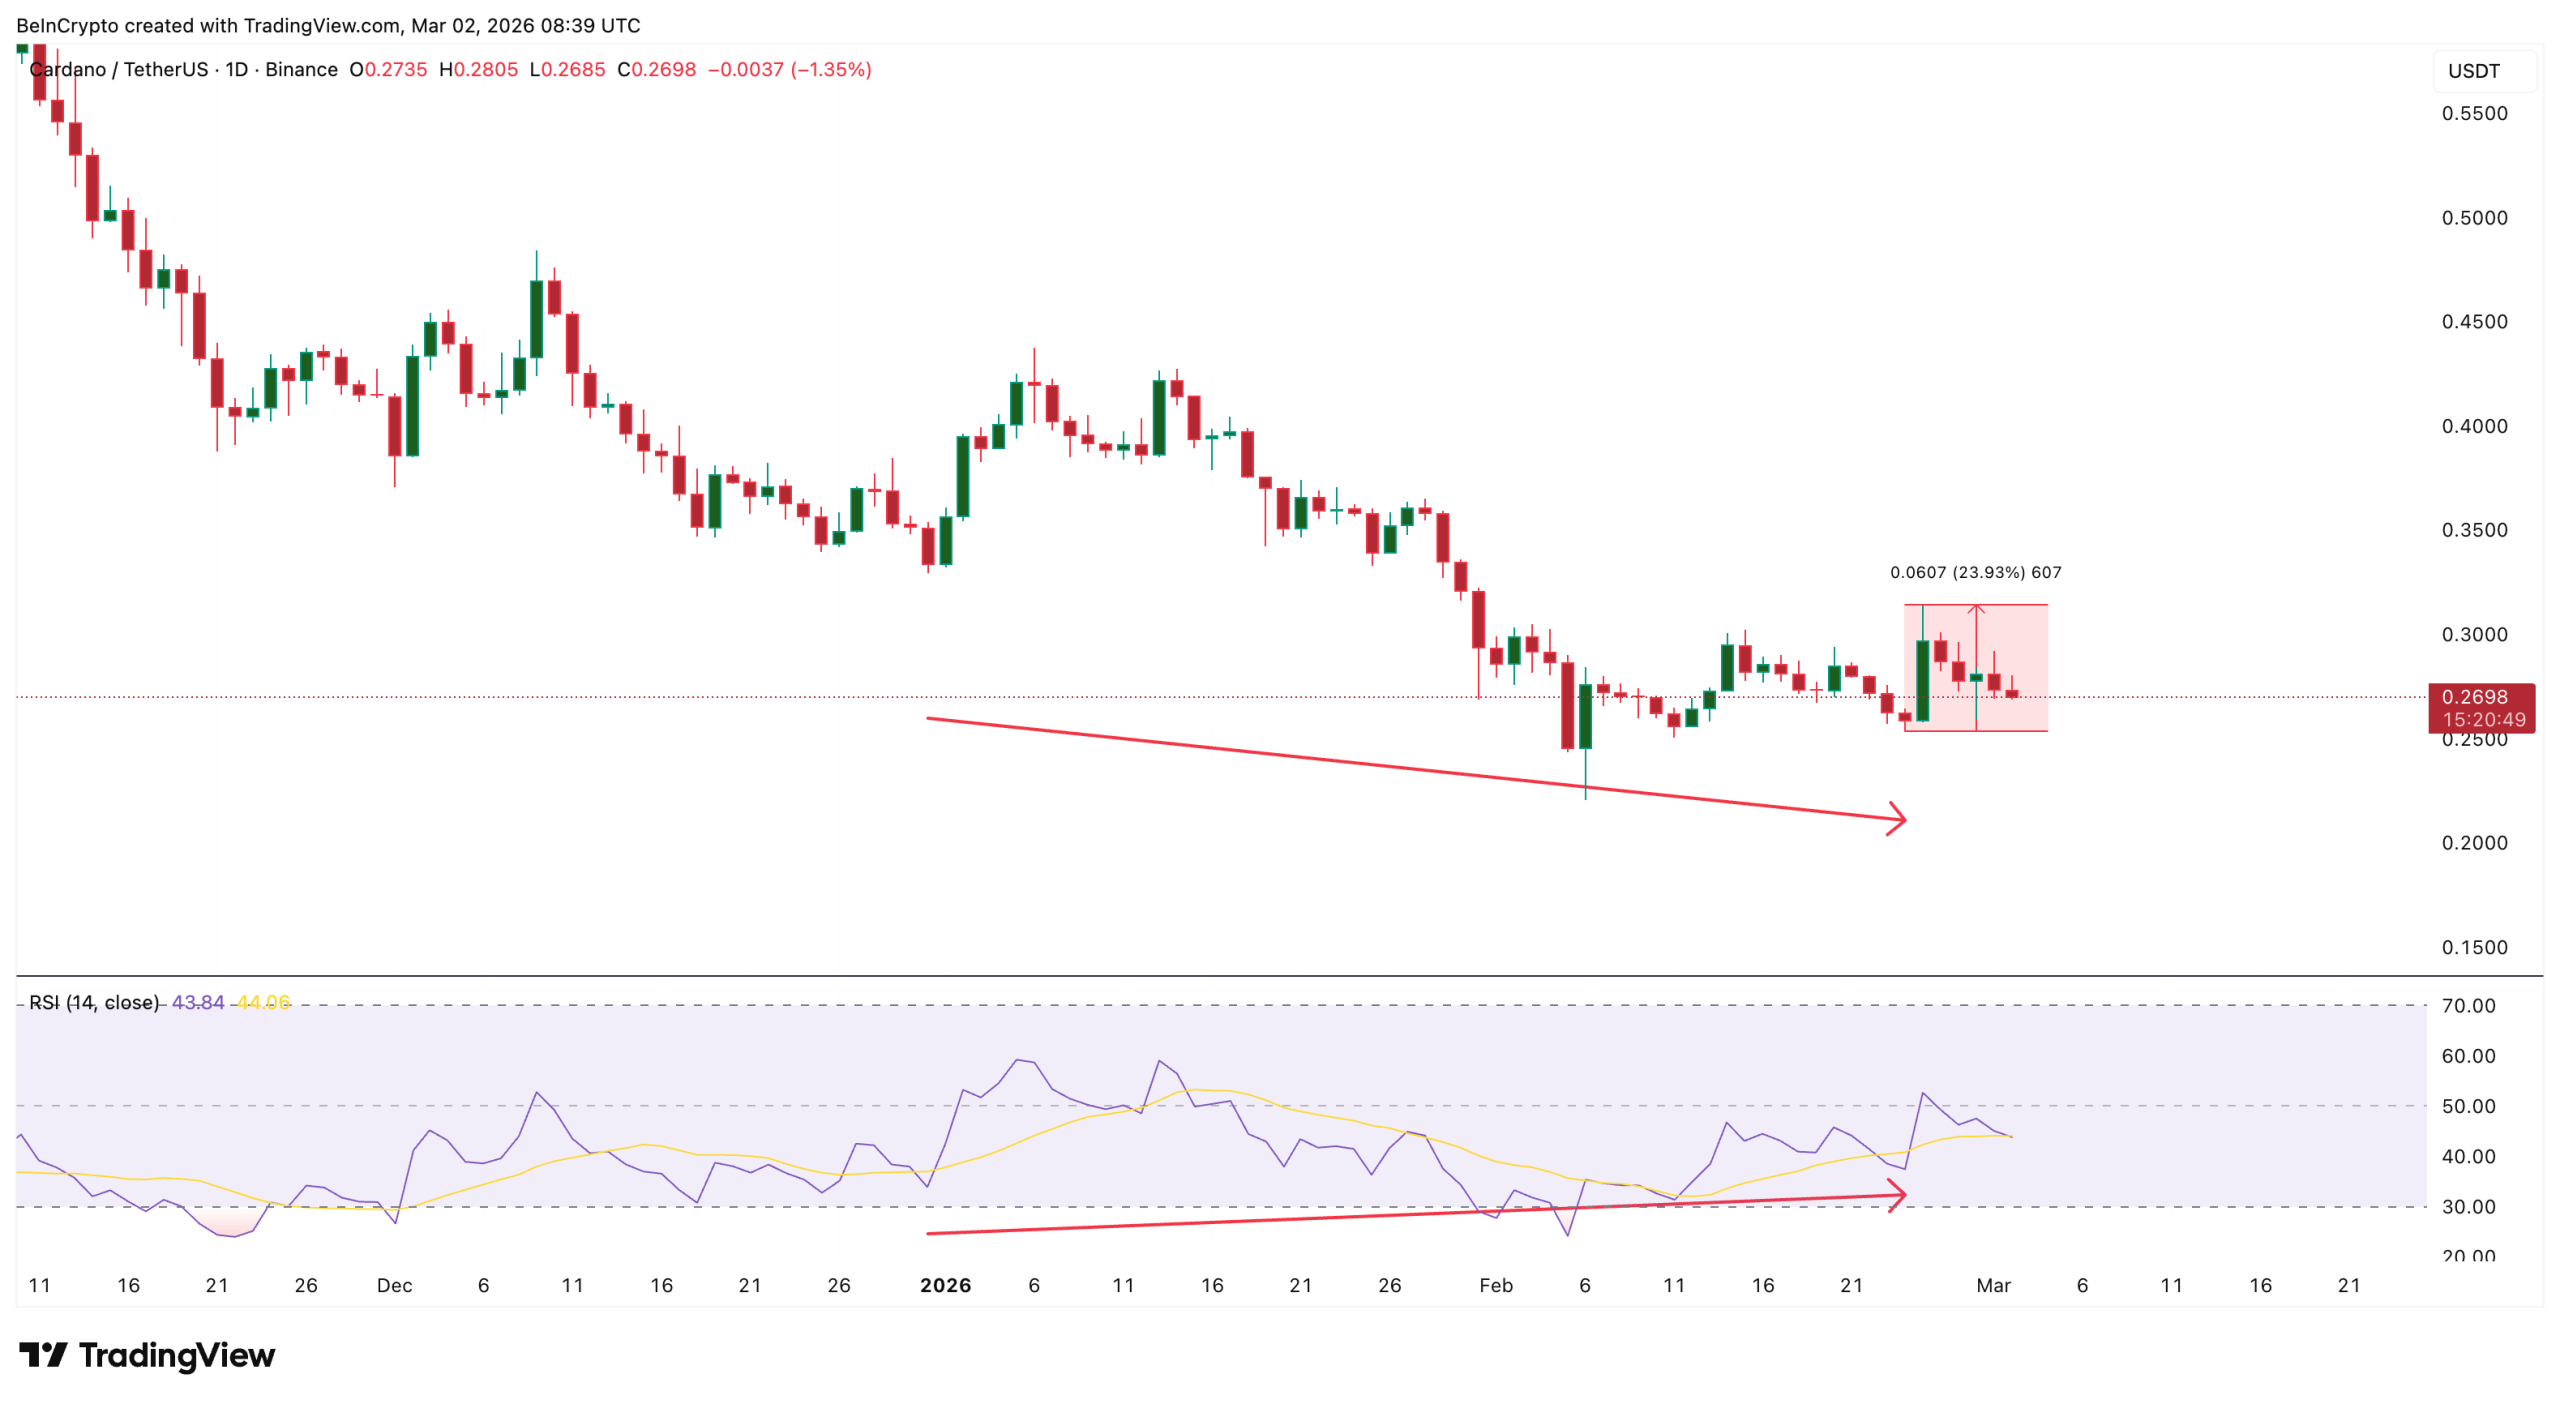
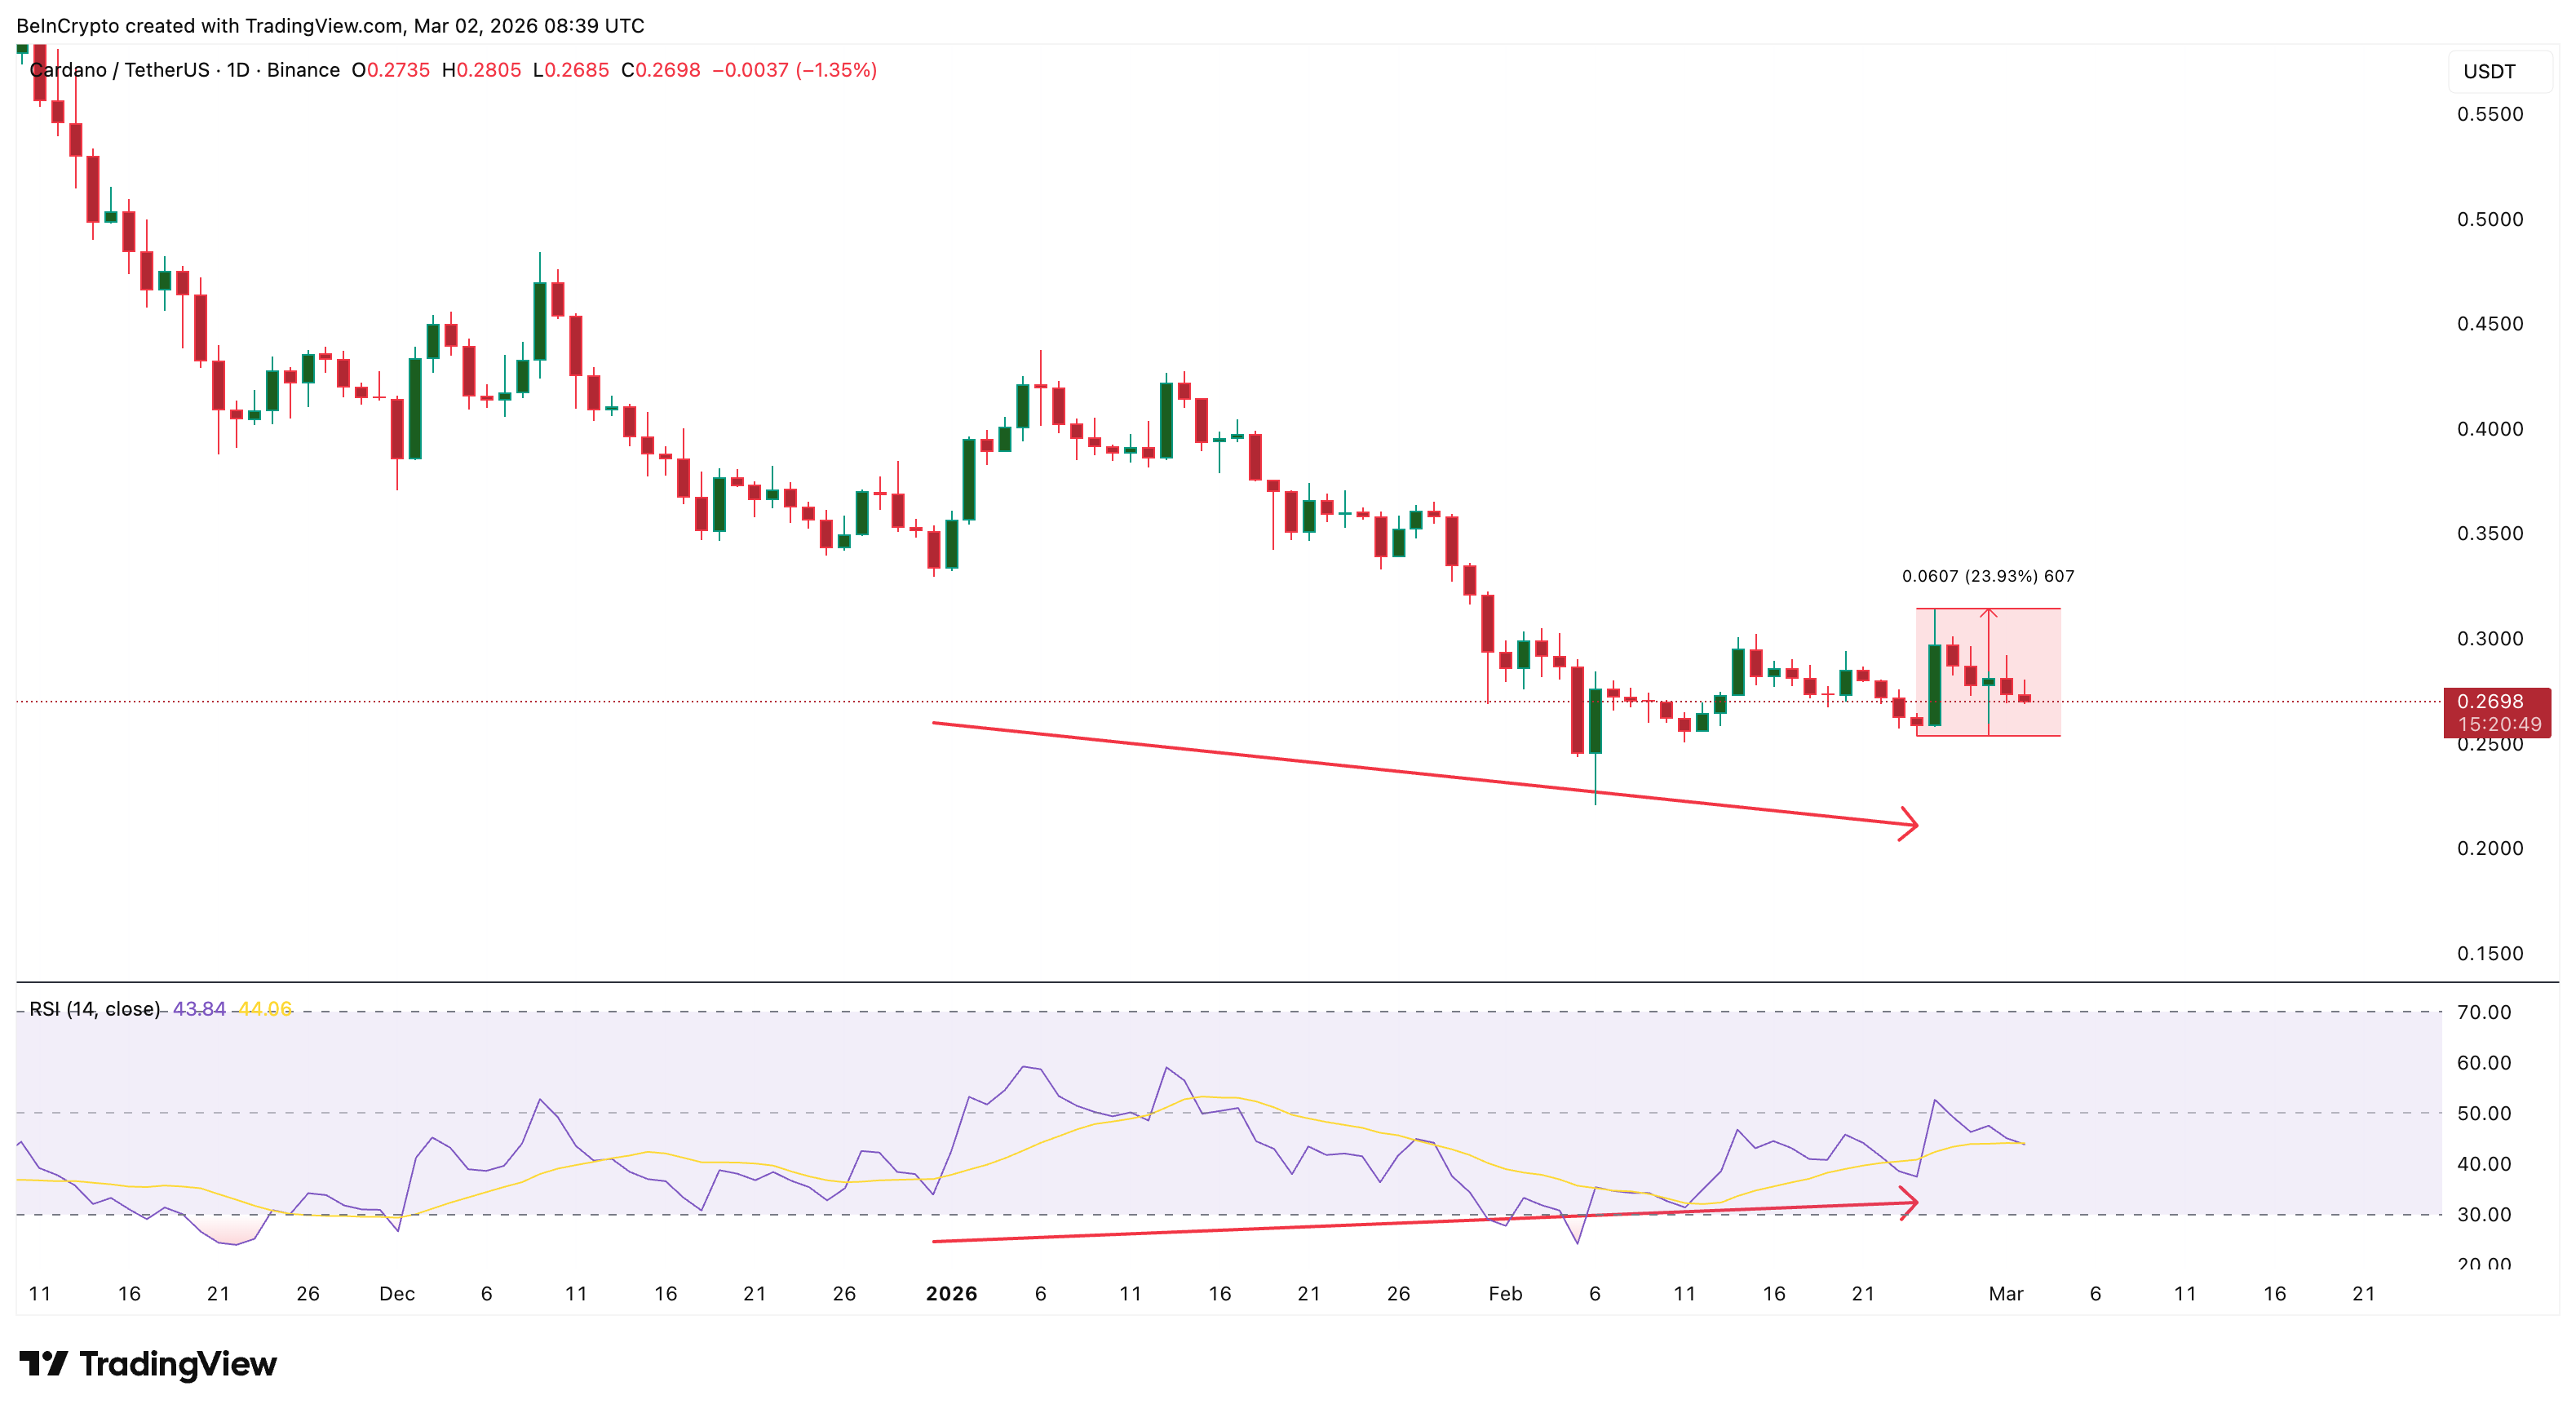
Between December 31, 2025, and February 24, 2026, ADA’s daily chart built a bullish divergence. The Cardano price printed a lower low, between the late-December range and the February 24 low. Meanwhile, the Relative Strength Index (RSI), a momentum oscillator, formed a higher low.
When price makes a lower low but RSI makes a higher low, it signals that bearish momentum is weakening even as price continues to fall.
The signal resolved on February 25 when ADA surged nearly 24%, briefly touching $0.31 before posting a long upper wick — a candlestick structure indicating aggressive selling into the highs.
Want more token insights like this? Sign up for Editor Harsh Notariya’s Daily Crypto Newsletter here.
What makes this setup more interesting is that the Money Flow Index backed it up. The MFI is a volume-weighted momentum indicator that combines both price and volume to measure buying and selling pressure, scored from 0 to 100. Unlike the RSI, which only considers price, MFI factors in trading volume — making it a more direct proxy for whether real capital is flowing into or out of an asset.
Between February 24 and 28, both price and MFI trended higher together. There was no bearish MFI divergence. This means the dips were being genuinely bought with volume conviction, not just price drifting upward on thin liquidity. Someone was actively absorbing sell pressure.
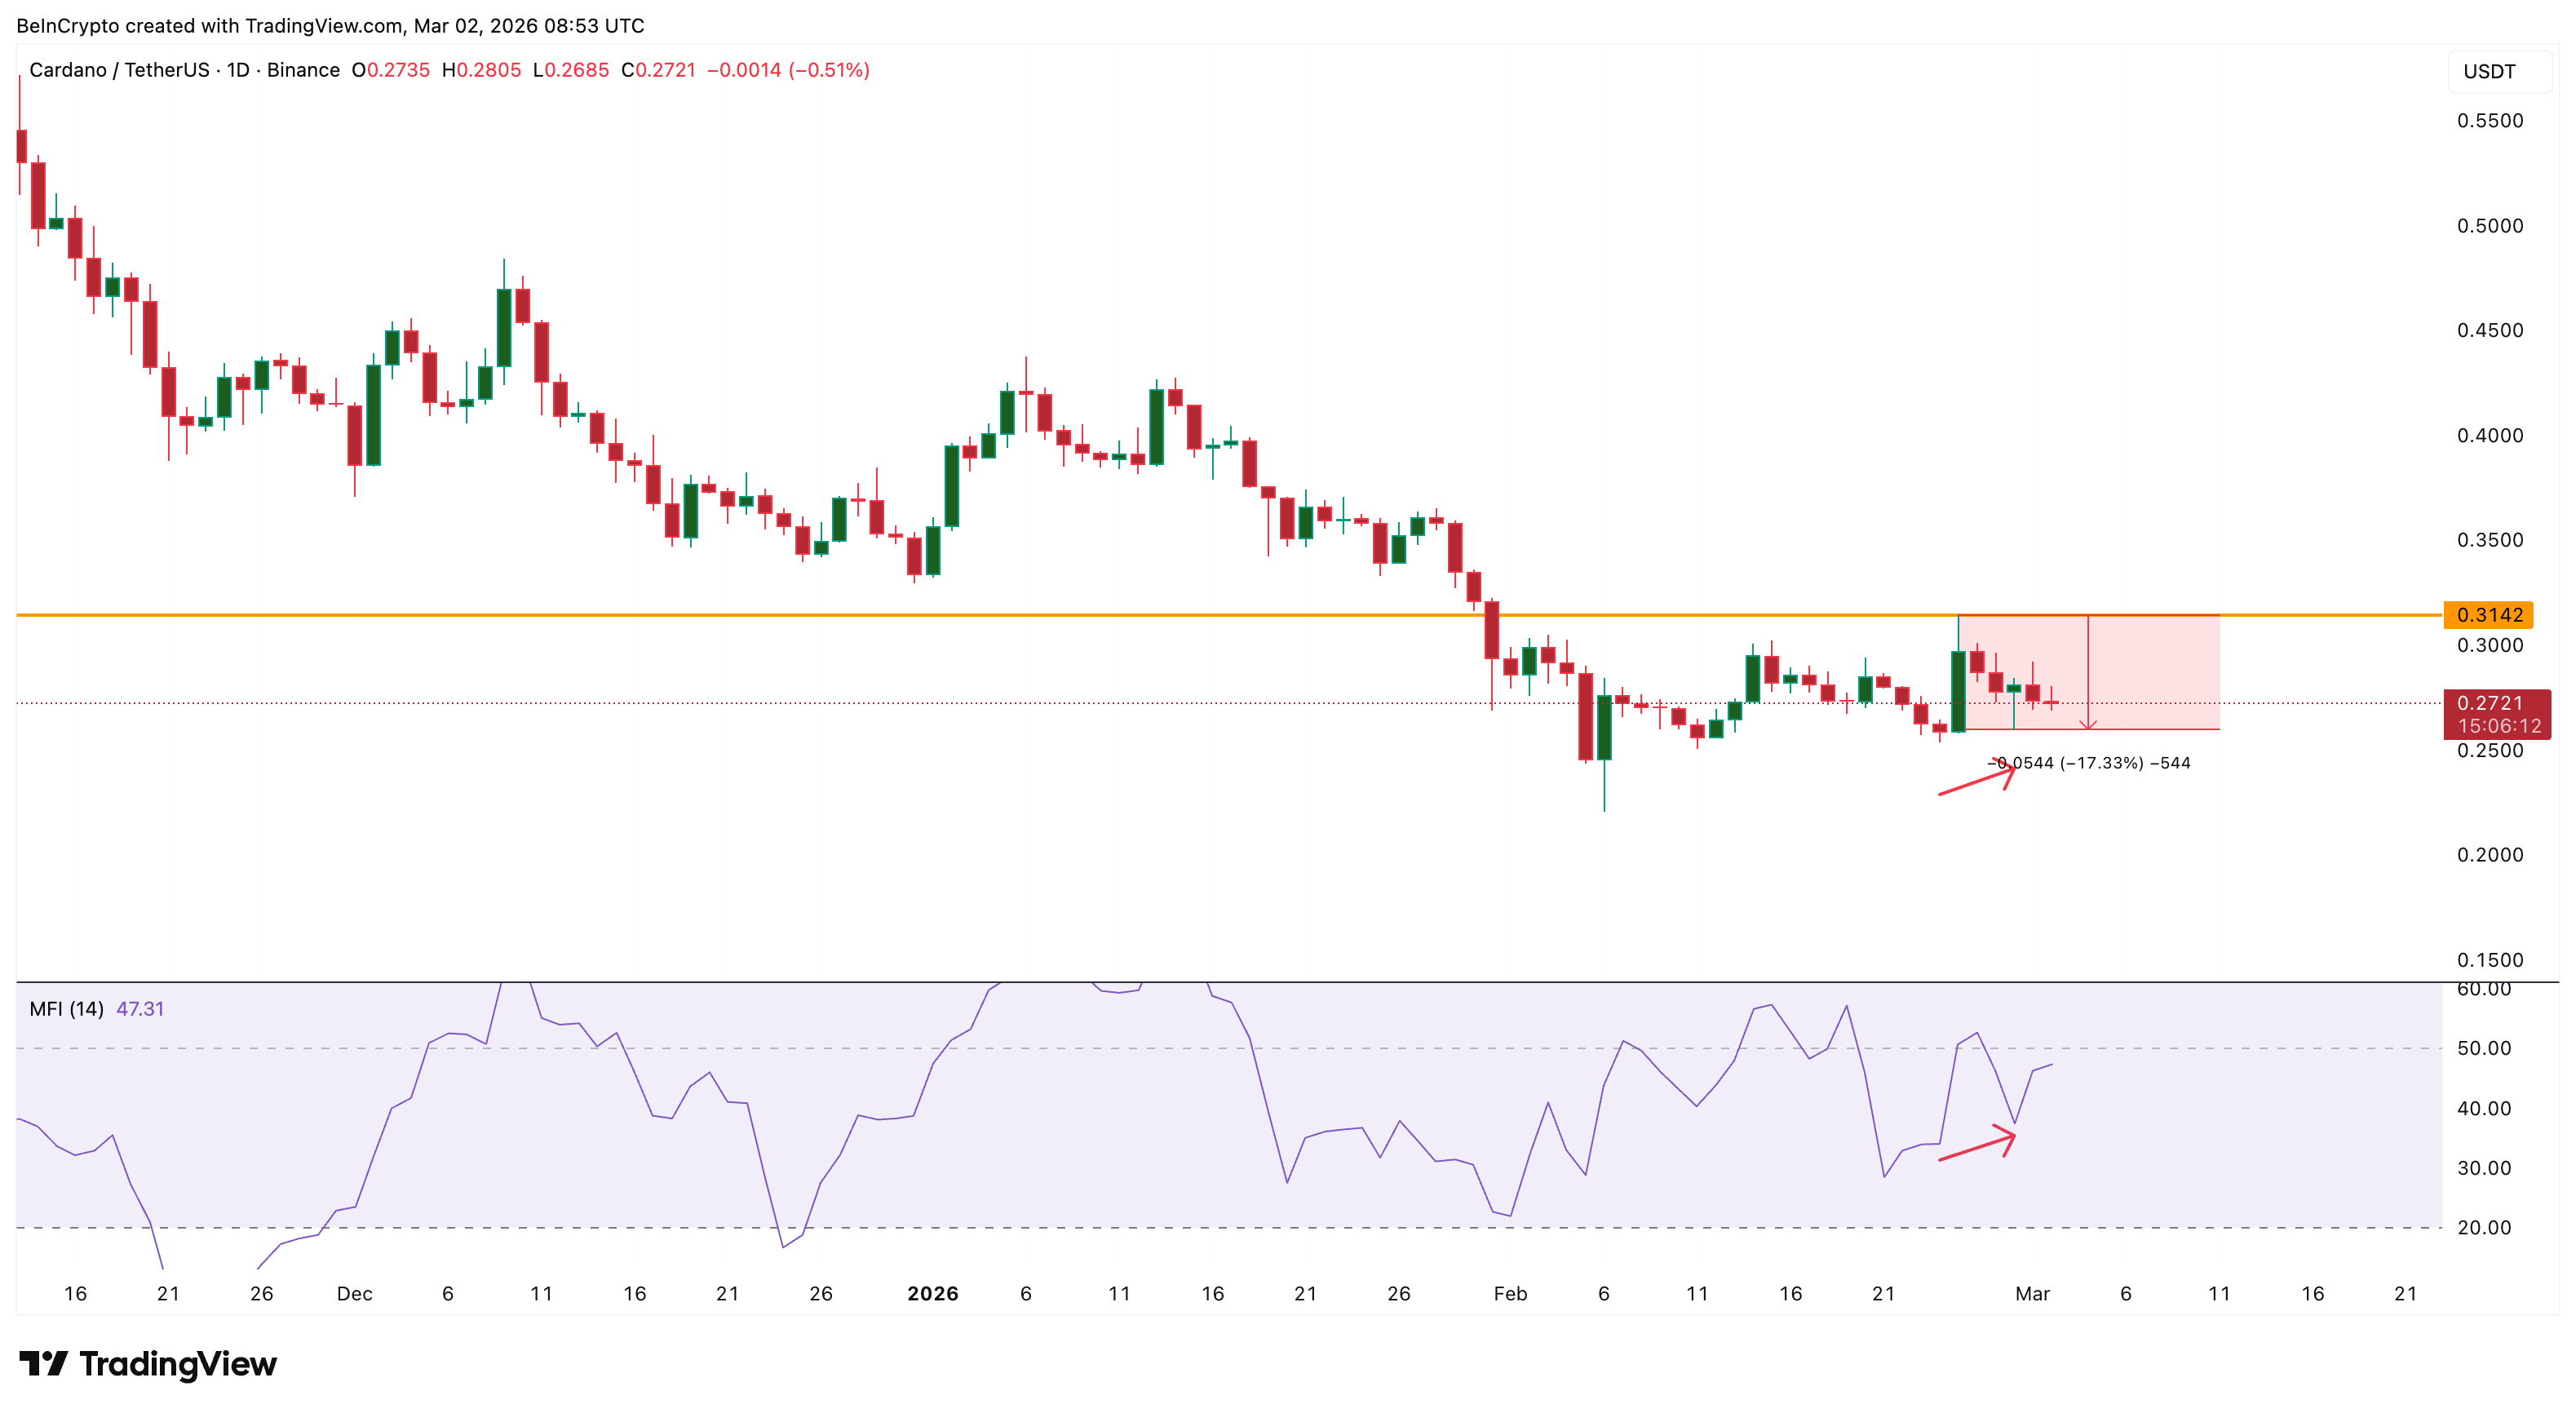
So the RSI divergence fired. MFI confirmed genuine buying support. ADA jumped 24%. And yet, from that February 25 peak, the price fell 17% within days. If the technical setup was valid and dip-buying was real, what killed the rally?
Over 2 Billion ADA Distributed in 3 Days: The Whales Were the Sellers
The answer is on-chain. Santiment’s supply distribution data reveals that between February 24 and 27, every major whale cohort reduced its holdings simultaneously.
The 1 billion-plus ADA cohort executed the largest single exit. It shed roughly 1.02 billion tokens in a single day between February 24 and 25 — dropping from 2.90 billion to 1.88 billion ADA.
The 100 million to 1 billion cohort initially picked up tokens on February 24, likely absorbing some of that initial sell, but then reversed aggressively by February 27, dropping from 3.47 billion to 2.61 billion ADA — a reduction of approximately 860 million tokens.
The 10 million to 100 million cohort shed around 220 million ADA over the same window, declining from 13.90 billion to 13.68 billion. Even the smallest whale tier, the 1 million to 10 million holders, reduced from 5.69 billion to 5.64 billion, offloading roughly 50 million tokens.
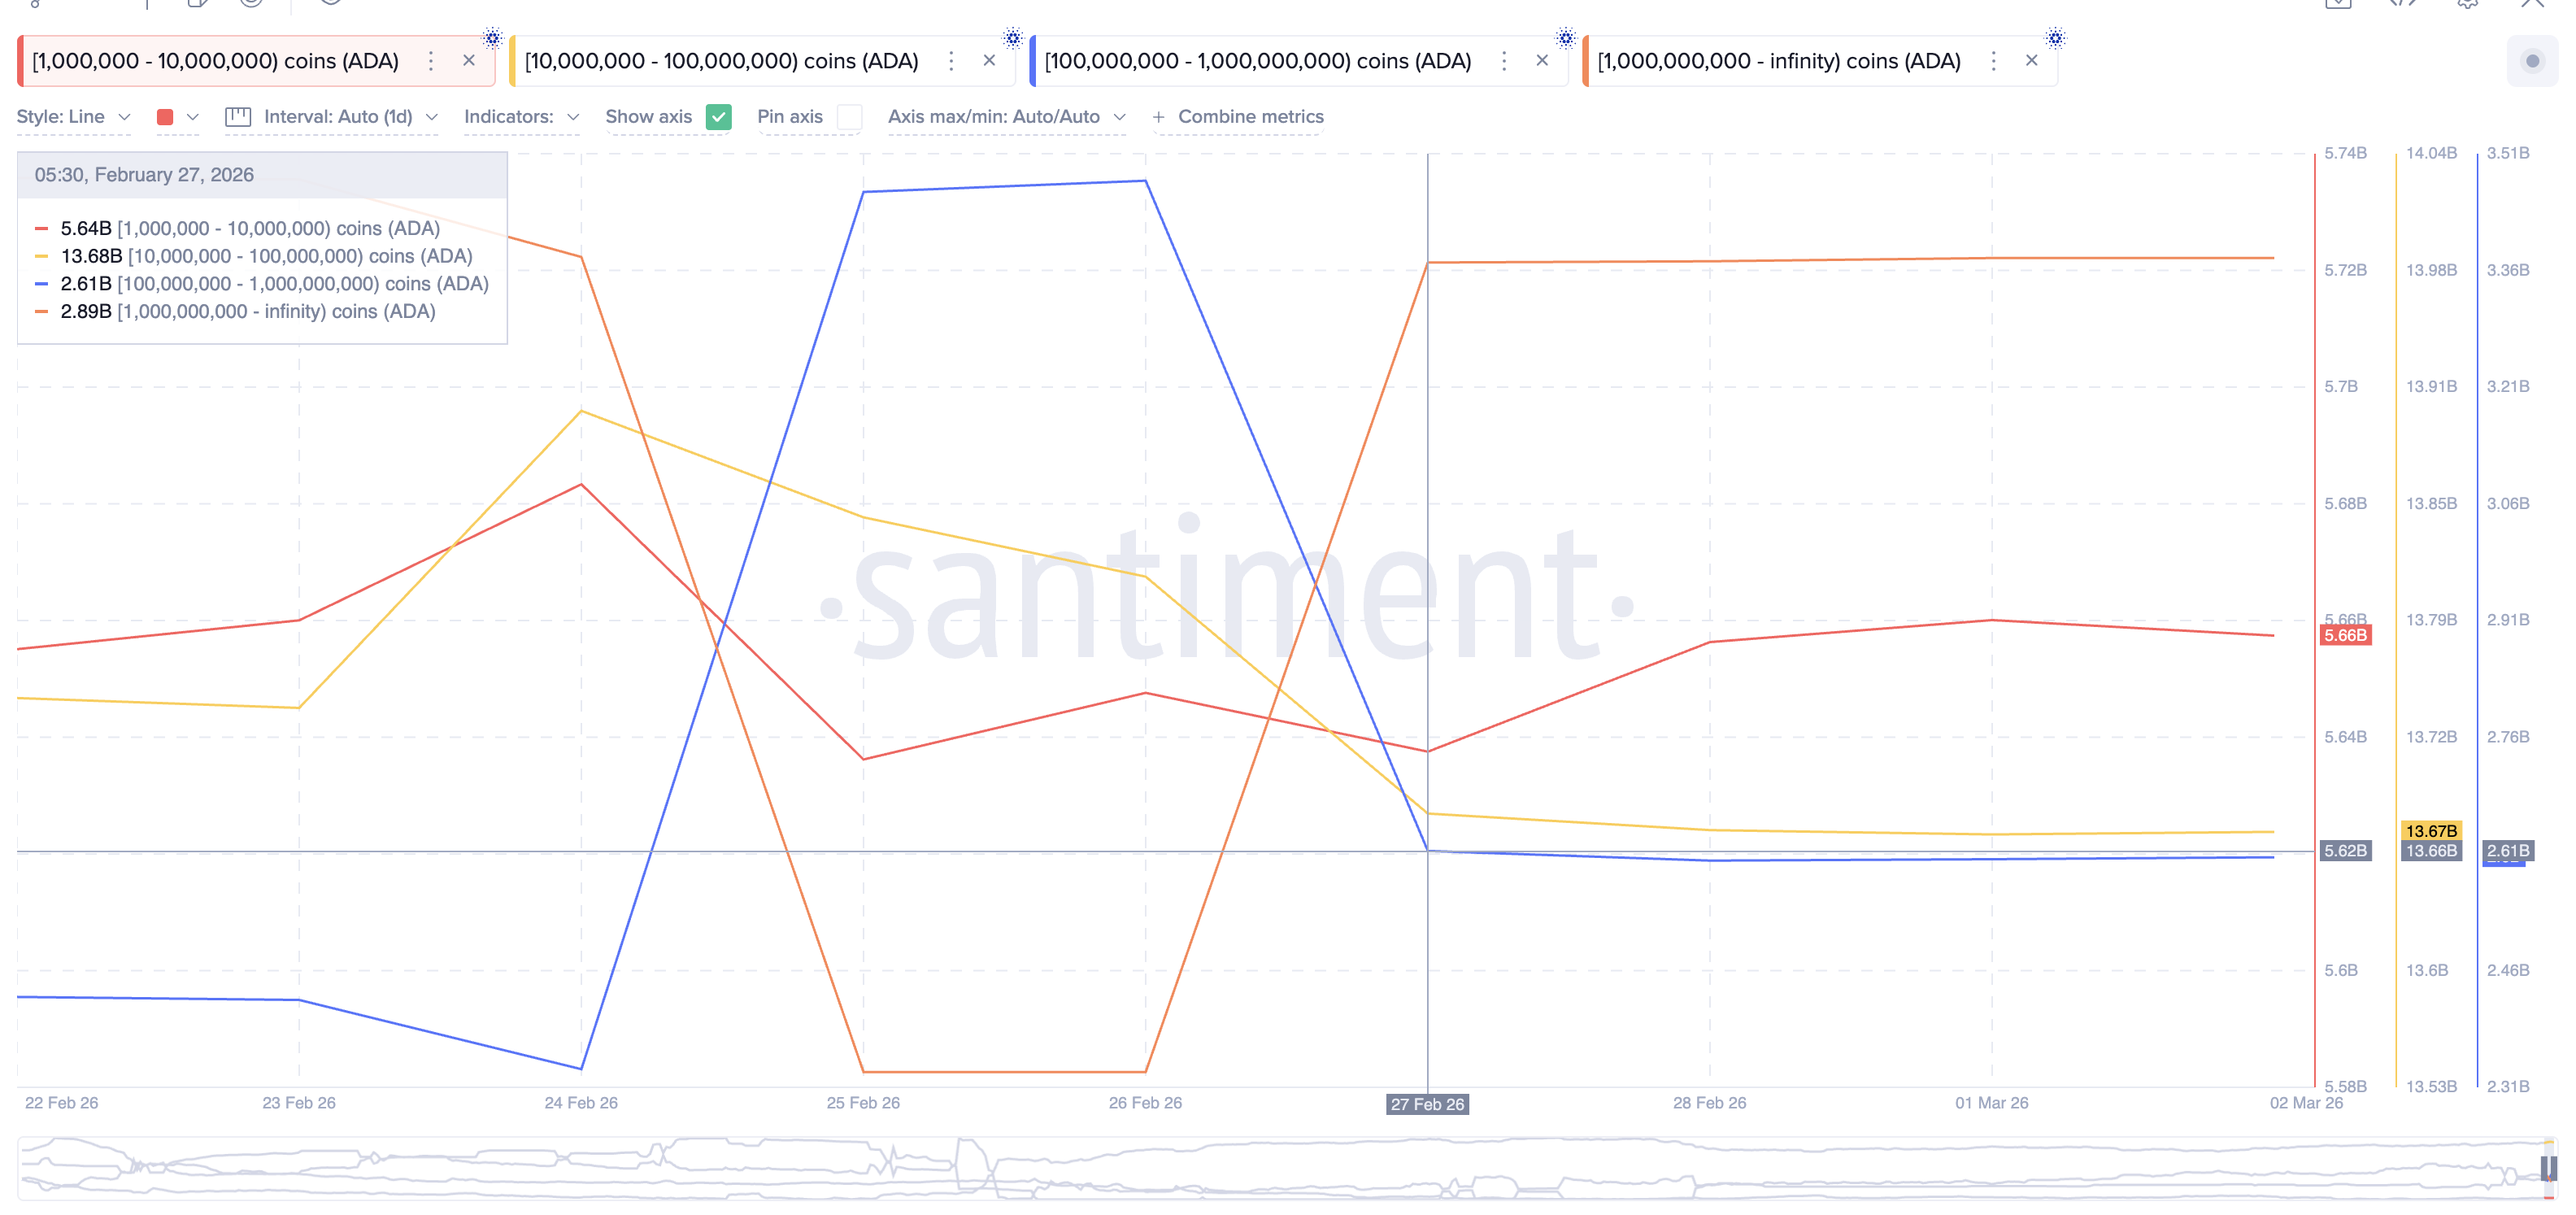
In total, approximately 2.15 billion ADA was distributed across all four cohorts within three days. At the average price of roughly $0.27 during this window, that amounts to approximately $540 million in concentrated sell pressure — all hitting the market during a rally that retail was actively buying into.
This is why the MFI data is so revealing. The MFI confirmed genuine buying support. The whale data confirms where the selling came from. Retail and mid-tier addresses were absorbing whale supply on the way up, but $540 million in distribution over 72 hours simply overwhelmed that demand.
Derivatives Data Adds Weight To ADA Breakdown
The derivatives market reinforces this picture. Cardano’s futures open interest had already collapsed from $1.95 billion September peak to below $450 million by mid-February. One of the lowest levels this year. This meant that leveraged retail had largely exited before the divergence even fired.
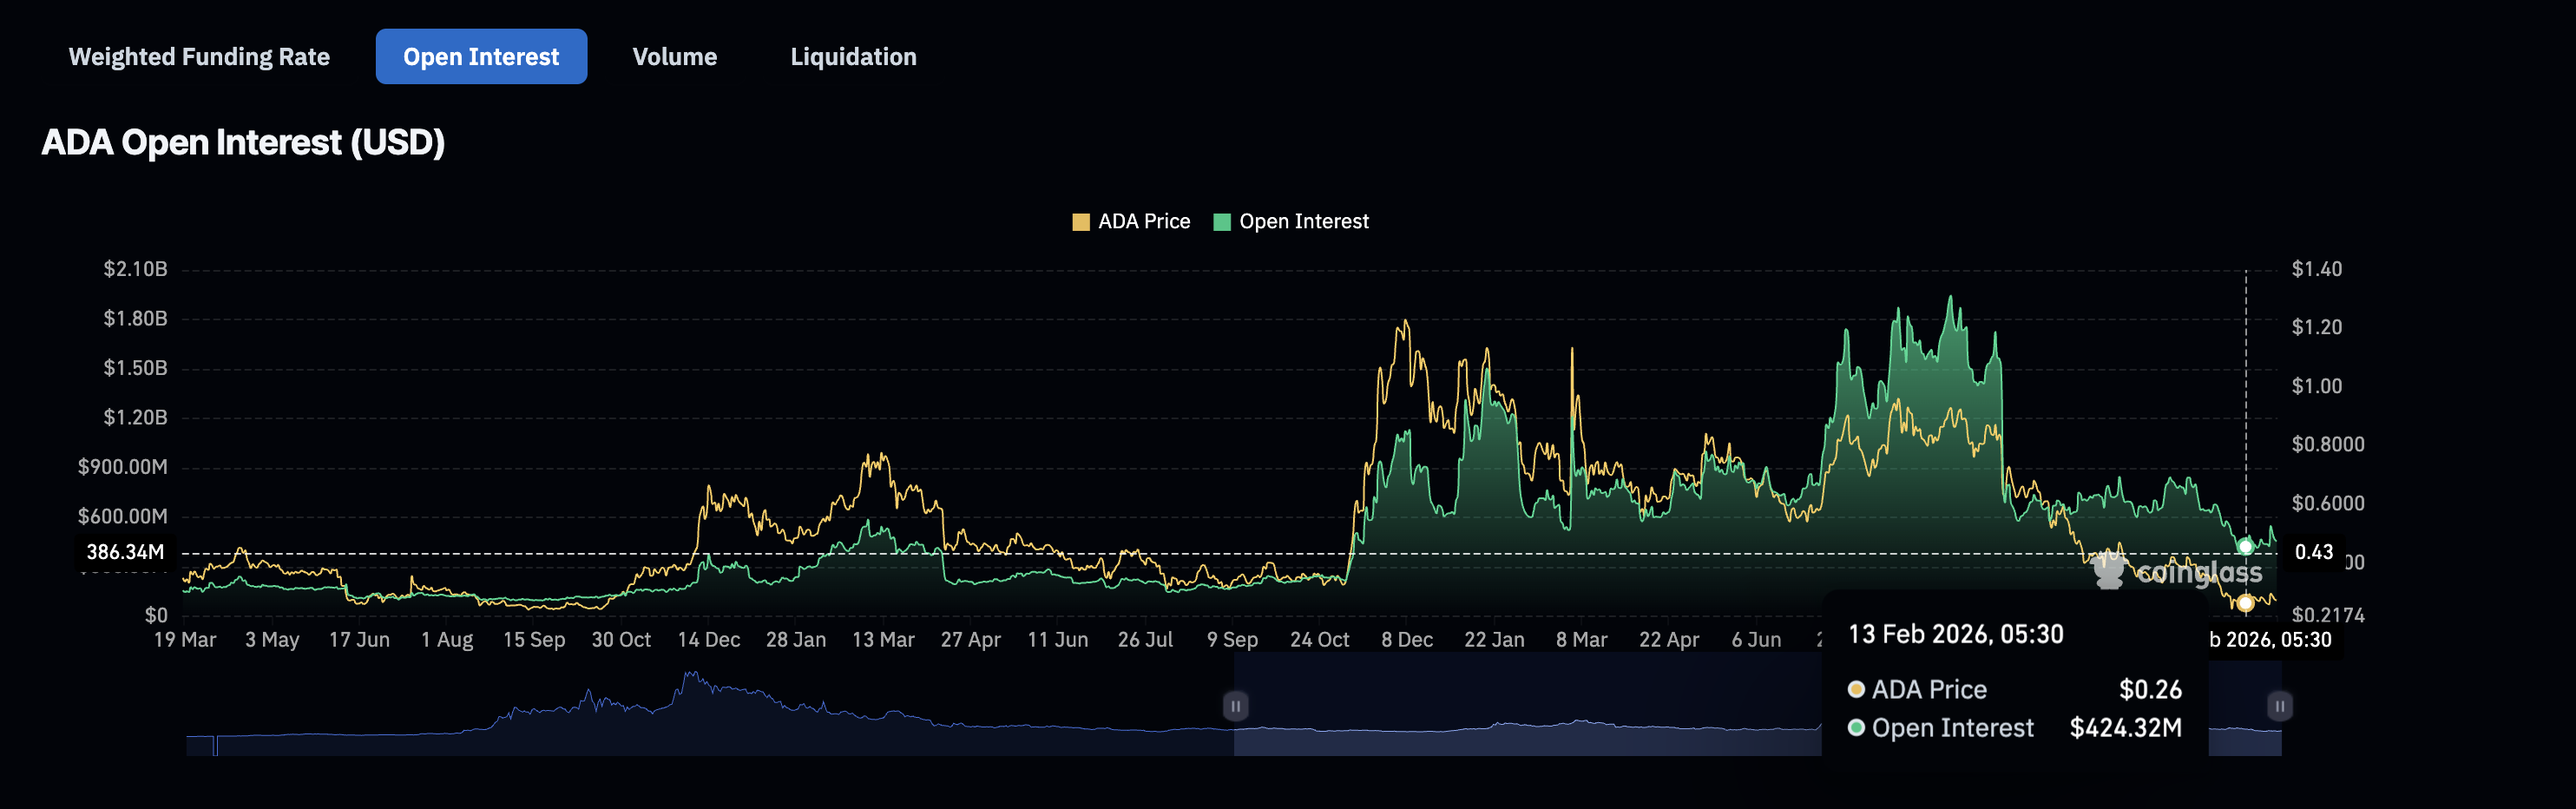
The buying MFI captured was therefore likely spot-driven: retail accumulating on the dip, using RSI divergence as conviction. But spot buying alone could not absorb the scale of whale distribution.
Cardano Price Action: Lower Lows Persist, Whale Re-Entry Becomes the Key Signal
ADA’s daily price structure remains lower as of March 2 (relative to late December), trading at $0.27, while the RSI continues to print higher lows (again relative to late December). This means the divergence framework is still technically alive, even after the late-February failure. A new swing low could trigger it again.
On the upside, $0.31 is the line in the sand. This was the exact rejection level on February 25. A daily close above this level would mark the first structural break in the downtrend, opening a path toward $0.37.
On the downside, a loss of $0.26 would confirm the weakness. Below that, the $0.23 and $0.21 levels become critical.
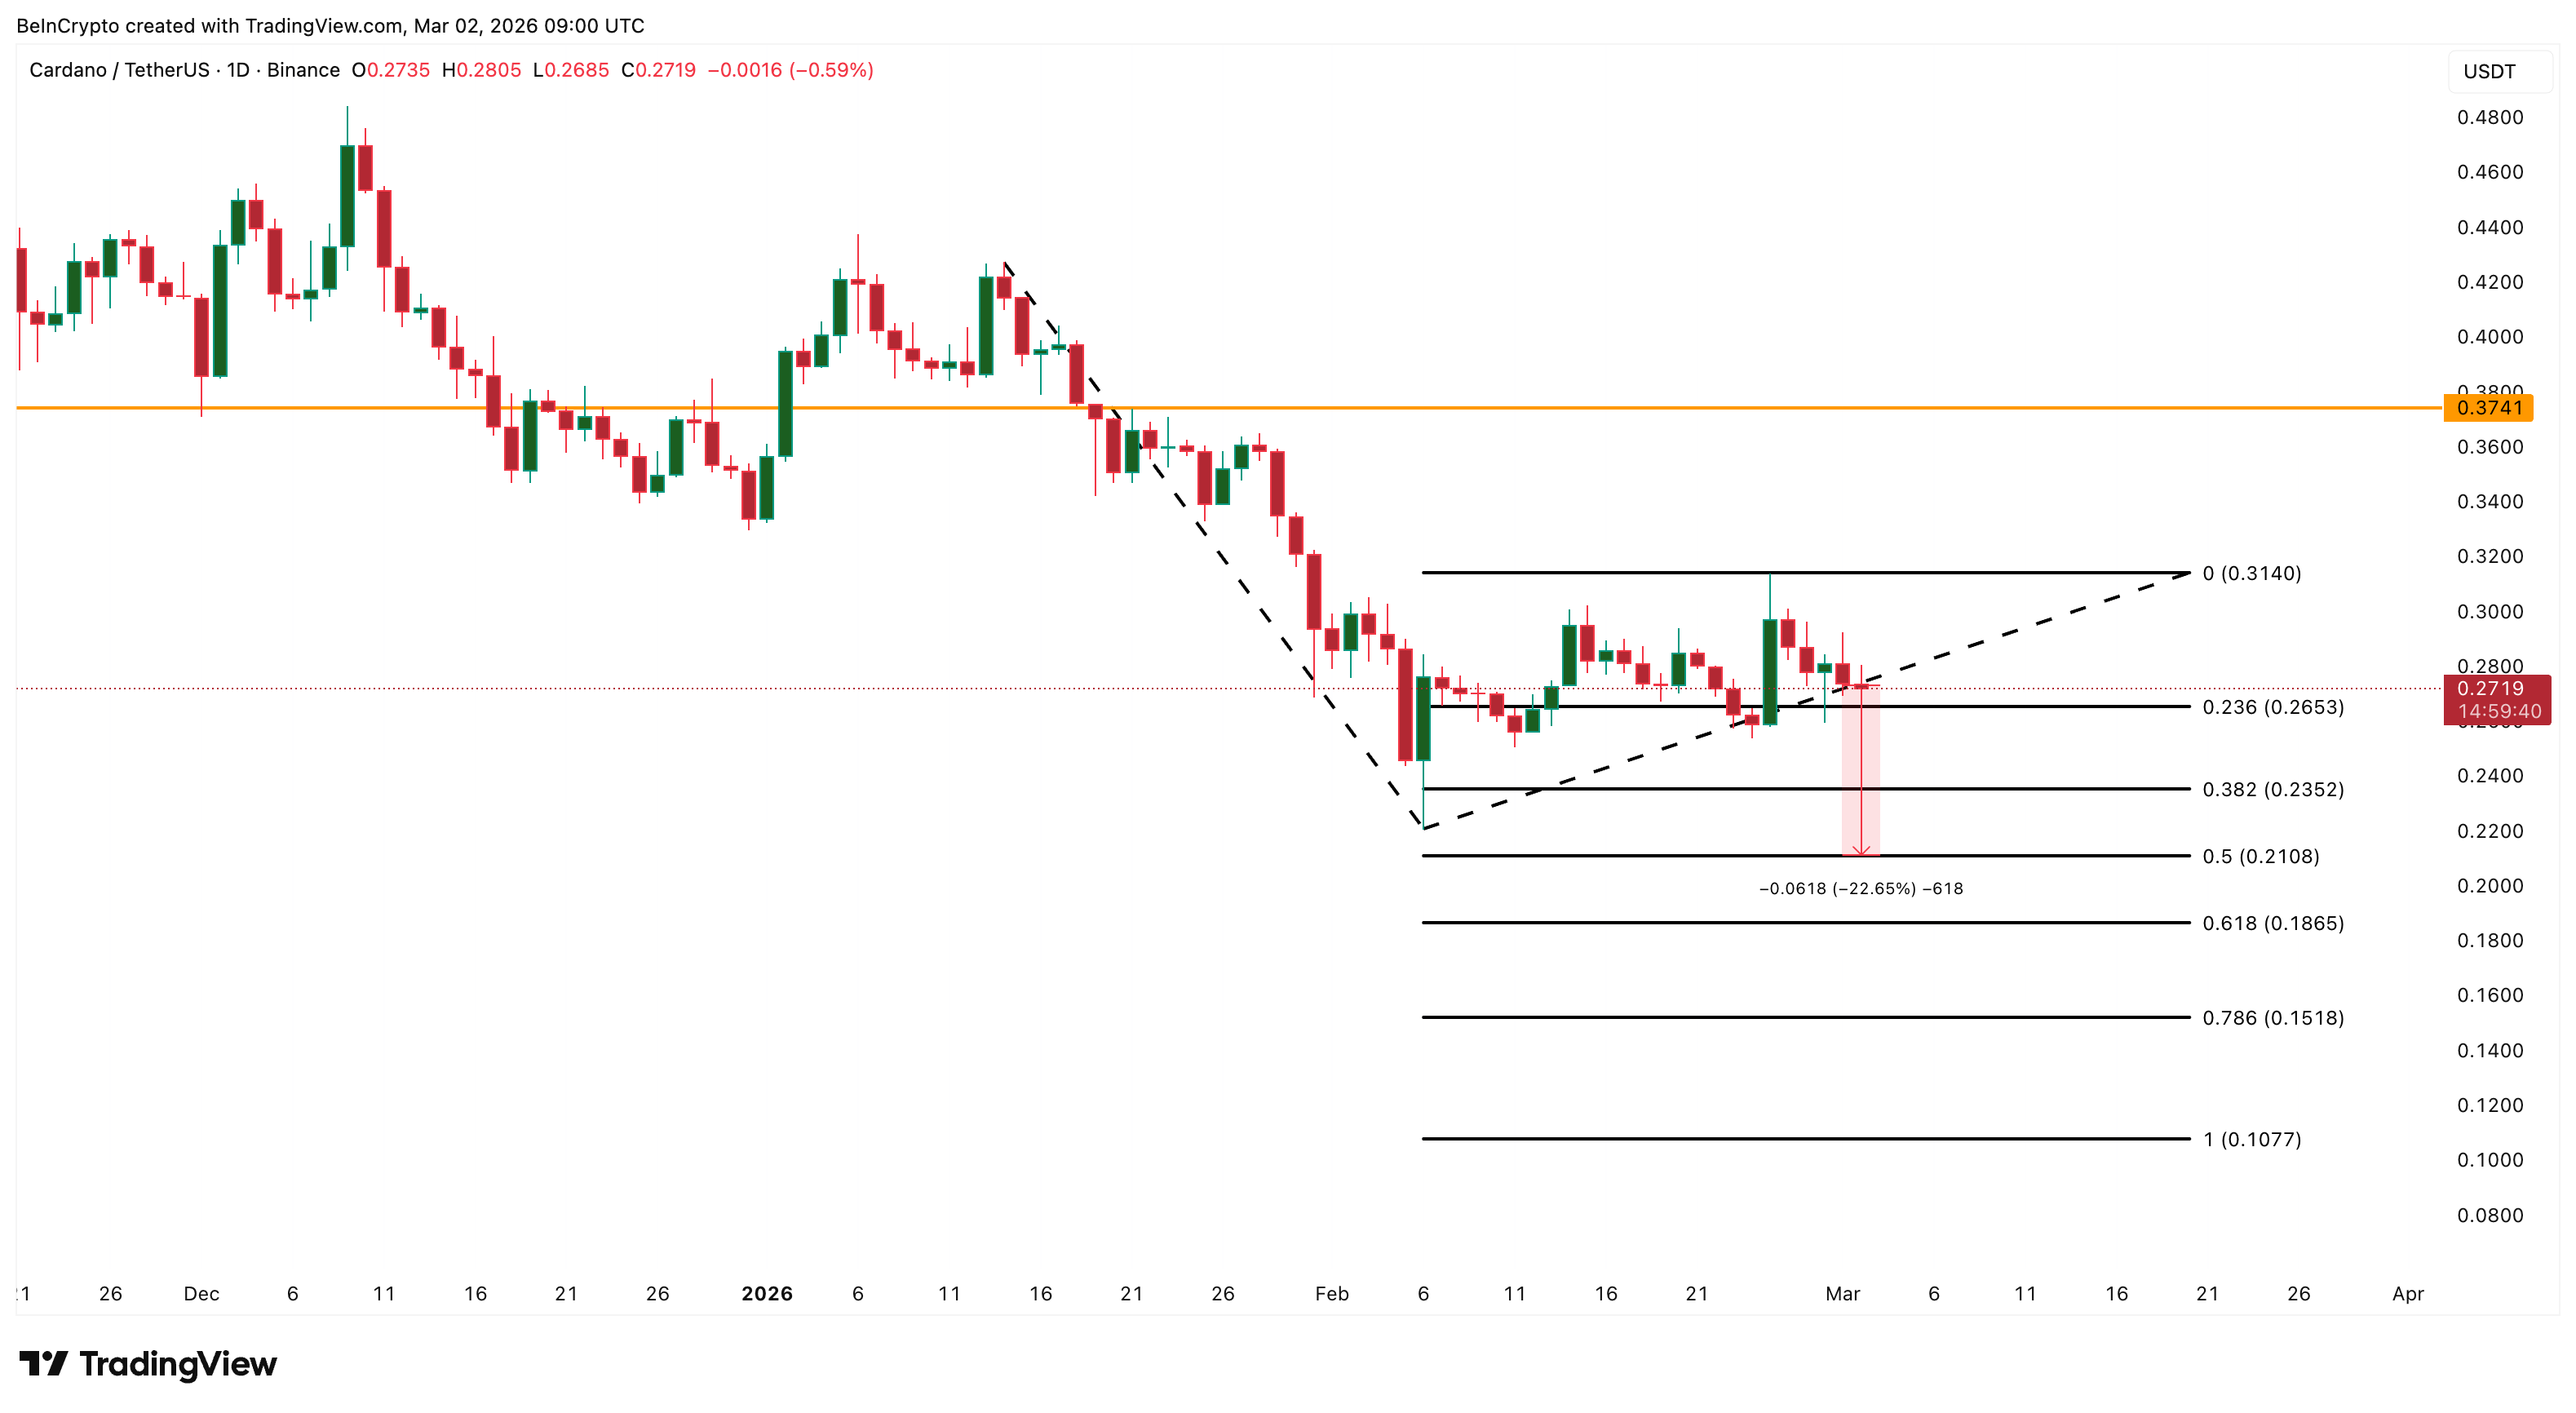
If $0.21 fails, deeper Fibonacci extensions at $0.18 (0.618) and $0.15 (0.786) come into play.
But the most important variable for Cardano’s next move is not a price level. It is whether the whales start buying again. As of March 2, Santiment data shows that major holders have not resumed significant accumulation.
If ADA declines toward $0.21 or lower and whale cohorts begin to re-accumulate, as they did earlier, it would represent a considerably stronger setup than February delivered. The moment whales resume buying can be treated as a potential local bottom signal.
For the next divergence to succeed, it needs whale participation as confirmation, not contradiction. Until that happens, the Cardano price structure could continue to point lower.


As bitcoin heads into this year’s flagship Bitcoin Conference in Las Vegas next week, traders will be watching for a familiar pattern, a potential “sell-the-news” event that has played out in previous years.
The largest cryptocurrency is trading around $75,000, recovering from a local bottom of around $60,000 in early February after collapsing more than 50% from its October all-time high.
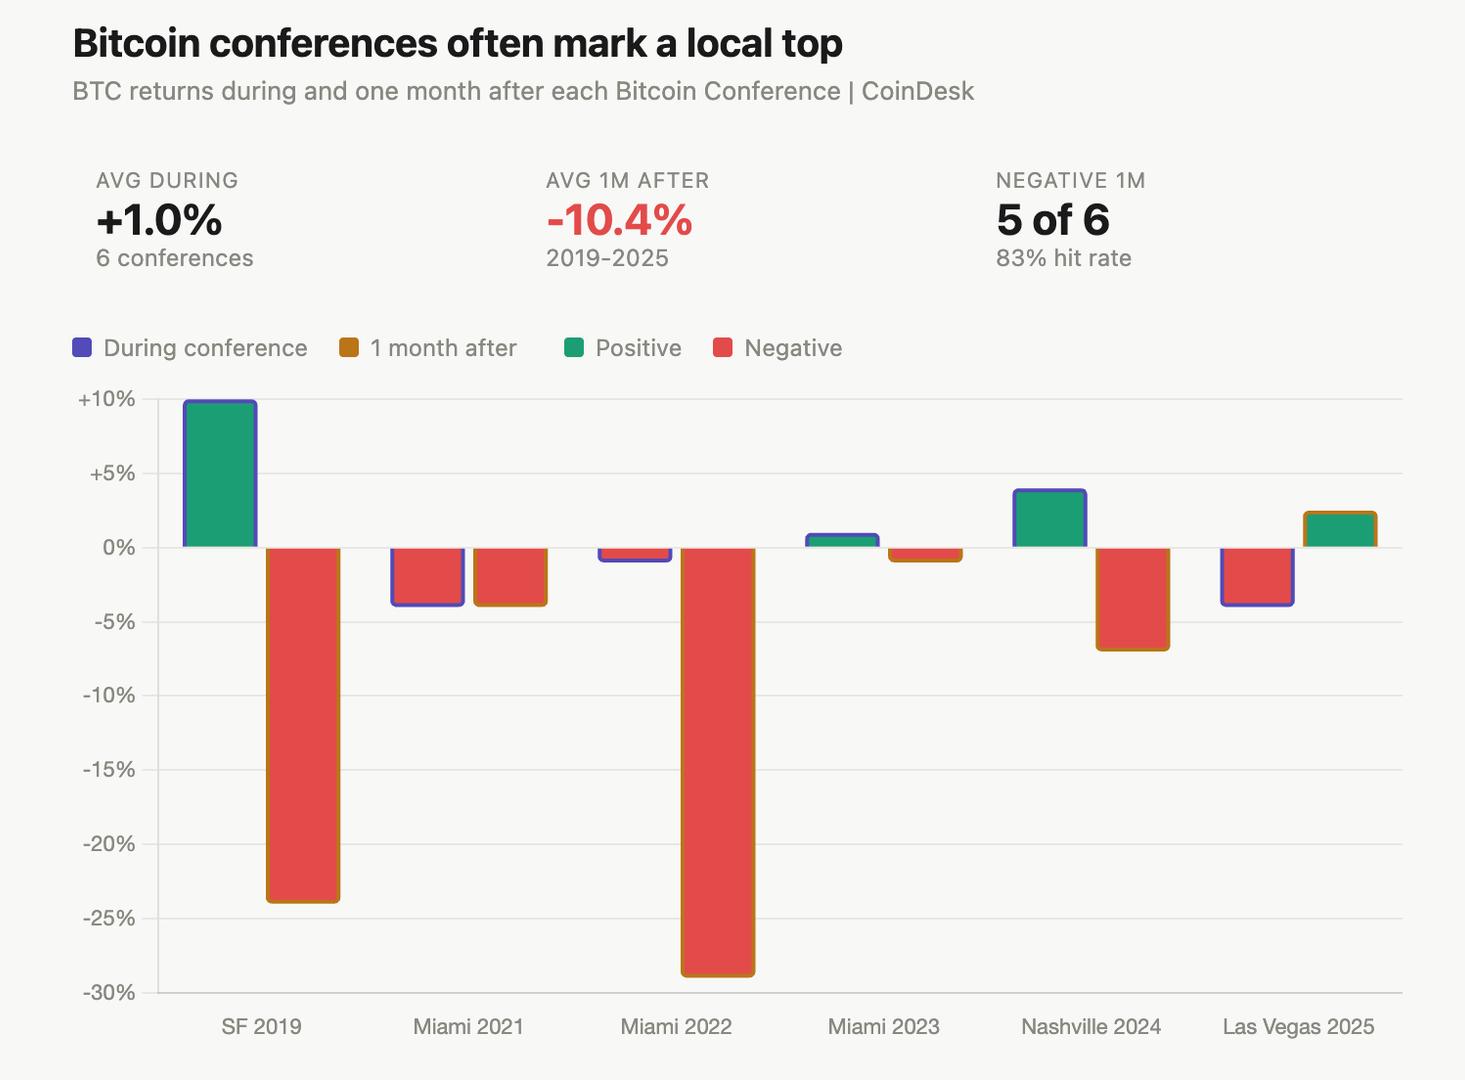
Data from Galaxy Research and Investing.com spanning 2019 to 2025 show the price of bitcoin tends to rise in the run-up to these conferences, delivers a mixed performance during the event and declines substantially afterward.
For instance, bitcoin gained about 3% in the 24 hours before the 2024 event in Nashville (featuring then-presidential candidate Donald Trump) and roughly 10% ahead of the 2019 conference in San Francisco, suggesting positioning builds into peak attention. Price action during the conference is typically subdued as the narrative fails to deliver, and the weakest performance occurs in the days and weeks that follow.
In the 2022 bear market, often compared to the current 2026 bear market environment, bitcoin fell just 1% during the Miami conference before sliding nearly 30% over several weeks. Similar post-conference weakness was seen in 2019, 2021 and 2023, where any momentum failed to hold.
Even in 2024, when Nashville hosted Trump to outline plans to position the U.S. as a bitcoin superpower, gains during the event were short-lived and marked a local top, just ahead of the yen carry-trade unwind in August that pushed bitcoin as low as $49,000.
Conferences tend to coincide with peaks in attention and liquidity as bullish narratives build up to the event, creating conditions for investors to unwind positions.
With sentiment still fragile and prices recovering from deep losses, the key question for 2026 is whether Bitcoin Vegas will once again act as an exit liquidity event.
The quantum divide between Bitcoin and Ethereum
Quantum computing has long been viewed as a distant, largely theoretical threat to blockchain systems. However, that perspective is now starting to change.
With major technology companies such as Google establishing timelines for post-quantum cryptography, and crypto researchers re-examining long-held assumptions, the discussion is shifting from abstract theory to concrete planning.
However, Bitcoin and Ethereum, two major blockchain networks, are addressing the quantum computing threat in different ways. Both networks depend on cryptographic systems that could, in principle, be compromised by sufficiently powerful quantum computers. However, their approaches to addressing this shared vulnerability are evolving in markedly different directions.
This divergence, often referred to as the “quantum gap,” has less to do with mathematics and more to do with how each network handles change, coordination and long-term security.
Did you know? Quantum computers do not need to break every wallet at once. They only need access to exposed public keys, which means older Bitcoin addresses that have already transacted could theoretically be more vulnerable than unused ones.
Why quantum computing matters for blockchains
Blockchains rely heavily on public-key cryptography, particularly elliptic curve cryptography (ECC). This framework allows users to derive a public address from a private key, enabling secure transactions while keeping sensitive information protected.
If quantum computers achieve sufficient scale and capability, they could fundamentally weaken this foundation. Algorithms such as Shor’s algorithm could, in theory, allow quantum systems to compute private keys directly from public keys, thereby jeopardizing wallet ownership and overall transaction security.
The consensus among most researchers is that cryptographically relevant quantum computers are still years or even decades away. Nevertheless, blockchain platforms present a distinct challenge. They cannot be updated instantaneously. Any substantial migration requires extensive coordination, rigorous testing and broad adoption over multiple years.
This situation highlights a key paradox: Although the threat is not pressing in the near term, preparation needs to begin well in advance.
External pressure is accelerating the debate
The discussion has moved well beyond crypto-native communities. In March 2026, Google announced a target timeline to transition its systems to post-quantum cryptography by 2029. It cautioned that quantum computers pose a significant threat to existing encryption and digital signatures.
This development is particularly relevant for blockchain systems because digital signatures play a fundamental role in verifying ownership. While encryption is vulnerable to “store-now, decrypt-later” attacks, digital signatures face a distinct risk. If compromised, they could increase the risk of unauthorized asset transfers.
As major institutions begin preparing for quantum resilience, blockchain networks face growing pressure to outline their own mitigation strategies. This is where the differences between Bitcoin and Ethereum become more apparent.
Did you know? The term “post-quantum cryptography” does not refer to quantum technology itself. It refers to classical algorithms designed to resist quantum attacks, allowing existing computers to defend against future quantum capabilities without requiring quantum hardware.
Bitcoin’s approach: Conservative and incremental
Bitcoin’s approach to quantum risk is guided by its core philosophy: minimize changes, maintain stability and avoid introducing unnecessary complexity at the base layer.
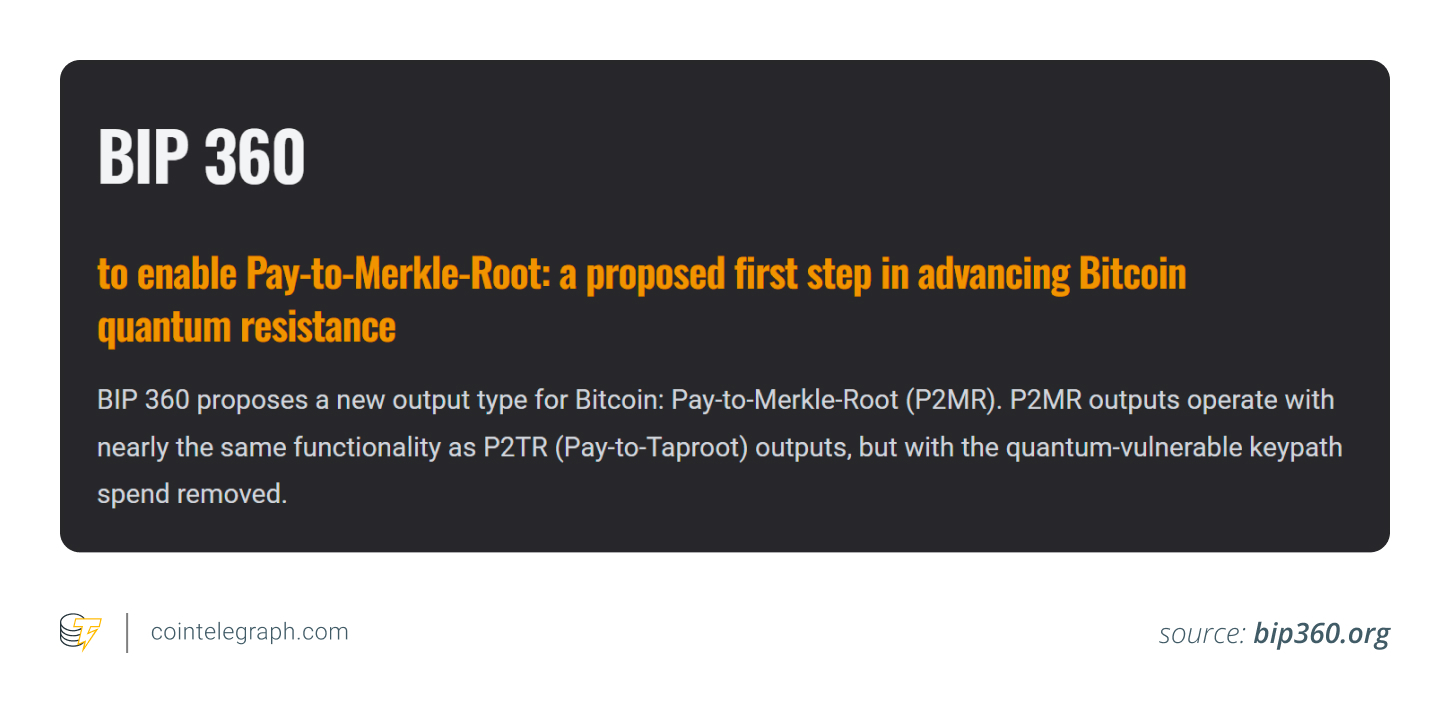
One of the most widely discussed proposals in this context is Bitcoin Improvement Proposal 360 (BIP-360), which introduces the concept of Pay-to-Merkle-Root (P2MR). Instead of fundamentally altering Bitcoin’s cryptographic foundations, the proposal seeks to limit exposure by changing the structure of certain transaction outputs.

The objective is not to achieve full quantum resistance for Bitcoin in a single move. Rather, it aims to create a pathway for adopting more secure transaction types while preserving backward compatibility with the existing system.
This approach mirrors the broader mindset within the Bitcoin community. Discussions often reflect extended time horizons, ranging from five years to several decades. The community is focused on ensuring that any changes do not undermine Bitcoin’s core principles: decentralization and predictability.
Nevertheless, this strategy has attracted criticism. Some argue that delaying more comprehensive measures could leave the network vulnerable if quantum advances arrive faster than expected. Others contend that making hasty changes could introduce avoidable risks into a system designed for long-term resilience.
Ethereum’s approach: Roadmap-driven and adaptive
Ethereum, by contrast, is pursuing a more proactive and structured strategy. The Ethereum ecosystem has begun formalizing a post-quantum roadmap that treats the challenge as a multi-layered system upgrade rather than a single technical adjustment.
A key element in Ethereum’s approach is “cryptographic agility,” which refers to the ability to replace core cryptographic primitives without undermining the stability of the network. This aligns with Ethereum’s broader design philosophy, which emphasizes flexibility and continuous iterative improvement.
The roadmap covers multiple layers:
-
Execution layer: Investigating account abstraction and alternative signature schemes that can support post-quantum cryptography.
-
Consensus layer: Assessing replacements for validator signature mechanisms, including hash-based options.
-
Data layer: Modifying data availability structures to ensure security in a post-quantum setting.
Ethereum developers have positioned post-quantum security as a long-term strategic priority, with timelines extending toward the end of the decade.
In contrast to Bitcoin’s incremental proposals, Ethereum’s approach resembles a staged migration plan. The goal is not immediate rollout but gradual preparation, allowing the network to transition when the threat becomes more concrete.

Why Bitcoin and Ethereum are taking different approaches to the quantum threat
The divergent approaches of Bitcoin and Ethereum are not a coincidence. They arise from fundamental differences in architecture, governance and philosophy.
Bitcoin’s base layer design emphasizes robustness and predictability, fostering a cautious attitude toward significant upgrades. Any change must meet a high bar for consensus and, even then, is usually limited in scope.
Ethereum, by contrast, has a track record of coordinated upgrades and protocol evolution. From the shift to proof-of-stake to ongoing scaling improvements, the network has demonstrated a willingness to execute complex changes when needed.
This distinction shapes how each network views the quantum threat. Bitcoin generally sees it as a remote risk that warrants careful, minimal intervention. Ethereum treats it as a systems-level issue that requires early planning and architectural adaptability.
In this context, the “quantum gap” is less about disagreement over the nature of the threat and more about how each ecosystem defines responsible preparation.
Did you know? Some early Bitcoin transactions reused addresses multiple times, unintentionally increasing their exposure. Modern wallet practices discourage address reuse partly because of long-term risks such as quantum attacks, even though the threat is not immediate.
An unresolved challenge for both Bitcoin and Ethereum
Despite their differing strategies, neither Bitcoin nor Ethereum has fully resolved the quantum threat.
Bitcoin continues to examine various proposals and weigh trade-offs, yet no clear migration path has been formally adopted. Ethereum, although more advanced in its planning, still faces substantial technical and coordination hurdles before its roadmap can be fully implemented.
Several open questions remain relevant to both ecosystems:
-
How to migrate existing assets protected by vulnerable cryptography
-
How to coordinate upgrades within decentralized communities
-
How to balance backward compatibility and forward security
These difficulties underscore the complexity of the issue. Post-quantum security represents more than a technical upgrade. It is also a test of long-term adaptability, governance and coordination.
Could security posture influence market narratives?
As institutional interest in quantum risk continues to grow, differences in preparedness could eventually shape how markets assess blockchain networks.
The reasoning is simple: A network that demonstrates greater adaptability to threats may be viewed as more resilient over the long term.
However, this idea remains largely speculative. Because quantum threats are still seen as a long-term concern, any near-term market effects are more likely to stem from narrative than from concrete technical developments.
Nevertheless, the fact that the discussion is now entering institutional research and broader public discourse suggests that it could become a more prominent consideration in the future.

Michael Saylor signaled on social media that Strategy is on the verge of announcing another Bitcoin purchase, posting a chart of the company’s full BTC buying history with noticeably larger circles marking recent acquisitions.
The timing matters: Strategy already executed a record single-day buy exceeding $1 billion in BTC just before the tease, and with $2.25 billion in cash reserved, the scale of what comes next is the only open question.
Simultaneously, the company, formerly MicroStrategy and now the largest corporate Bitcoin holder on the planet, floated a proposal to convert its STRC preferred stock from monthly to semi-monthly dividend payments, a structural capital markets refinement that analysts say could significantly broaden institutional demand for the instrument.
Discover: The best crypto to diversify your portfolio with
- Purchase incoming: Saylor shared a chart of Strategy’s BTC buying history with larger recent circles, signaling acceleration – another buy announcement is imminent.
- Dividend proposal: Strategy is floating semi-monthly payments for its STRC preferred stock, with shareholder voting closing June 8, 2026; first record date June 30, first payment July 15.
- STRC mechanics: Annualized yield stays fixed at 11.5%; switching to twice-monthly payments targets halved ex-dividend drawdowns, tighter liquidity patterns, and better collateral utility.
- Market signal: With BTC above $76,000 and $2.25 billion in cash reserved, Strategy’s dual move – more BTC plus refined shareholder returns – is a compounding demand signal for the spot market.
What Saylor Dual Signal Actually Means for Strategy’s Bitcoin Capital Stack
The STRC preferred series – branded “Stretch” – launched in mid-2024 at an 11.5% annualized yield, initially paying monthly dividends funded in part by Bitcoin treasury yields.
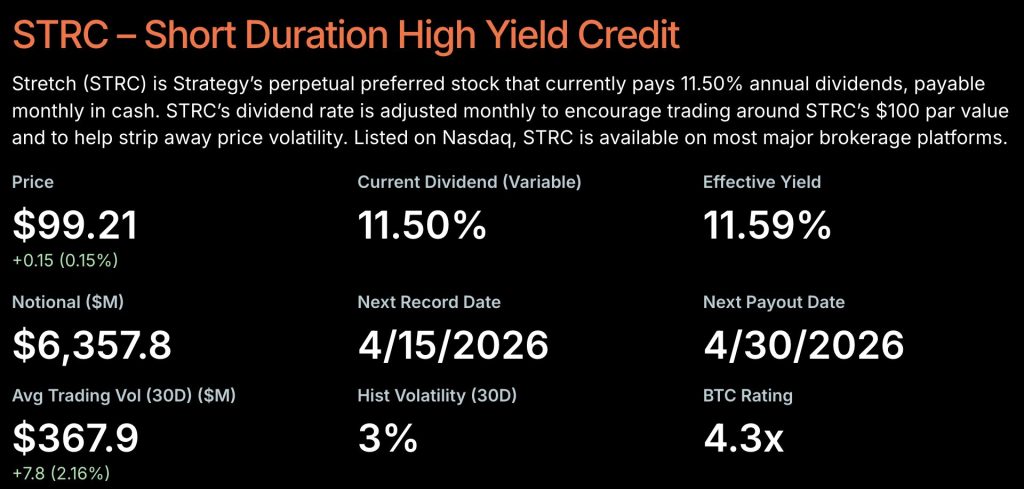
Volatility on the instrument has collapsed from 13% in its first eight months to 2.1% over the past two months, a compression driven by surging institutional demand that has pushed outstanding notional value to $6.4 billion.
The semi-monthly proposal doesn’t change the yield – 11.5% annualized remains fixed – but splits payment cadence to record dates on the 15th and last day of each month, pending Nasdaq compliance review and dual approval from both STRC holders and MSTR common shareholders.
Saylor’s stated rationale: “The proposed changes are intended to stabilize price, dampen cyclicality, drive liquidity, and grow demand.” He added the team views semi-monthly as “twice as good” as monthly for the instrument.
If approved, STRC would be the only preferred security or equity globally paying dividends twice monthly , a structural differentiator that improves collateral utility for borrowing and tightens haircuts for institutional holders using it as leverage collateral.
That’s not a minor footnote. Better collateral terms mean more institutional capital can rotate into STRC without consuming as much balance sheet, which expands the buyer pool at the exact moment Saylor is telegraphing another large BTC purchase. The feedback loop here is deliberate: more demand for STRC funds more capital raises, which fund more BTC accumulation, which backstops the yield instrument.
Discover: The best pre-launch token sales
The post Michael Saylor Hints at Bigger Bitcoin Buys After Floating Semi-Monthly Dividends appeared first on Cryptonews.

The Bank for International Settlements (BIS) general manager, Pablo Hernández de Cos, called for tighter global coordination on stablecoins Monday, warning that US dollar-denominated tokens could have “material consequences” for financial stability and economic policy if they grow large enough to rival traditional money.
Speaking at a Bank of Japan seminar in Tokyo, he said current stablecoin arrangements fall short of what is needed for a widely used means of payment, even if they offer faster cross-border transfers and integration with smart contracts.
De Cos said the largest US dollar stablecoins, such as USDt (USDT) and USDC (USDC), share characteristics with investment products rather than cash-like money, pointing to fees and conditions on primary market redemptions and episodes where their prices diverge from par in secondary markets.
In his view, these features make the tokens behave more like exchange-traded funds (ETFs), while still creating run and contagion risks because issuers hold short-term government debt and bank deposits as reserve assets. In a stress episode, he warned, rapid outflows from stablecoins could force sales of those reserves into already strained markets or transmit funding pressure to banks.
The warning comes as policymakers globally debate how to regulate fast-growing stablecoins and other tokenized money-like instruments.

He added that the use of public, permissionless blockchains and unhosted wallets means a significant share of activity sits outside conventional Anti-Money Laundering and Counter-Terrorism Financing controls, making stablecoins attractive for illicit use unless bespoke safeguards are implemented at on- and off-ramps.
Europe sharpens its stablecoin stance
The speech comes as European policymakers push for tighter control of non-euro stablecoins and other tokenized money-like instruments.
Earlier this month, Bank of France First Deputy Governor Denis Beau urged the European Union to go beyond the original Markets in Crypto Assets Regulation text by limiting the use of non-euro-denominated stablecoins in everyday payments, tightening rules on issuing the same coin inside and outside the bloc to reduce regulatory arbitrage in times of stress.
Related: EU central bank backs plan for crypto supervision under EU markets watchdog
In parallel, the European Central Bank has contrasted euro stablecoins with tokenized money market funds, noting that both perform liquidity transformation and are exposed to run risk, but operate under different transparency, liquidity management and regulatory regimes that can shape how stress feeds into funding markets.
Other major jurisdictions are also recalibrating their approaches. In the United Kingdom, members of the House of Lords questioned Coinbase in March over whether stablecoins could drain commercial bank deposits, trigger Silicon Valley Bank-style runs and facilitate crime, as the government finalizes a bespoke regime for fiat-backed tokens.
In Switzerland, UBS and several domestic peers launched a franc-denominated stablecoin pilot in a sandbox environment on April 8, in an effort to explore blockchain-based franc payments while keeping the instruments firmly anchored in the regulated financial system.
Bitcoin options worth roughly $7.9 billion are set to expire on Deribit this Friday, with positioning data pointing to $62,000 and $75,000 as key levels to watch out for.
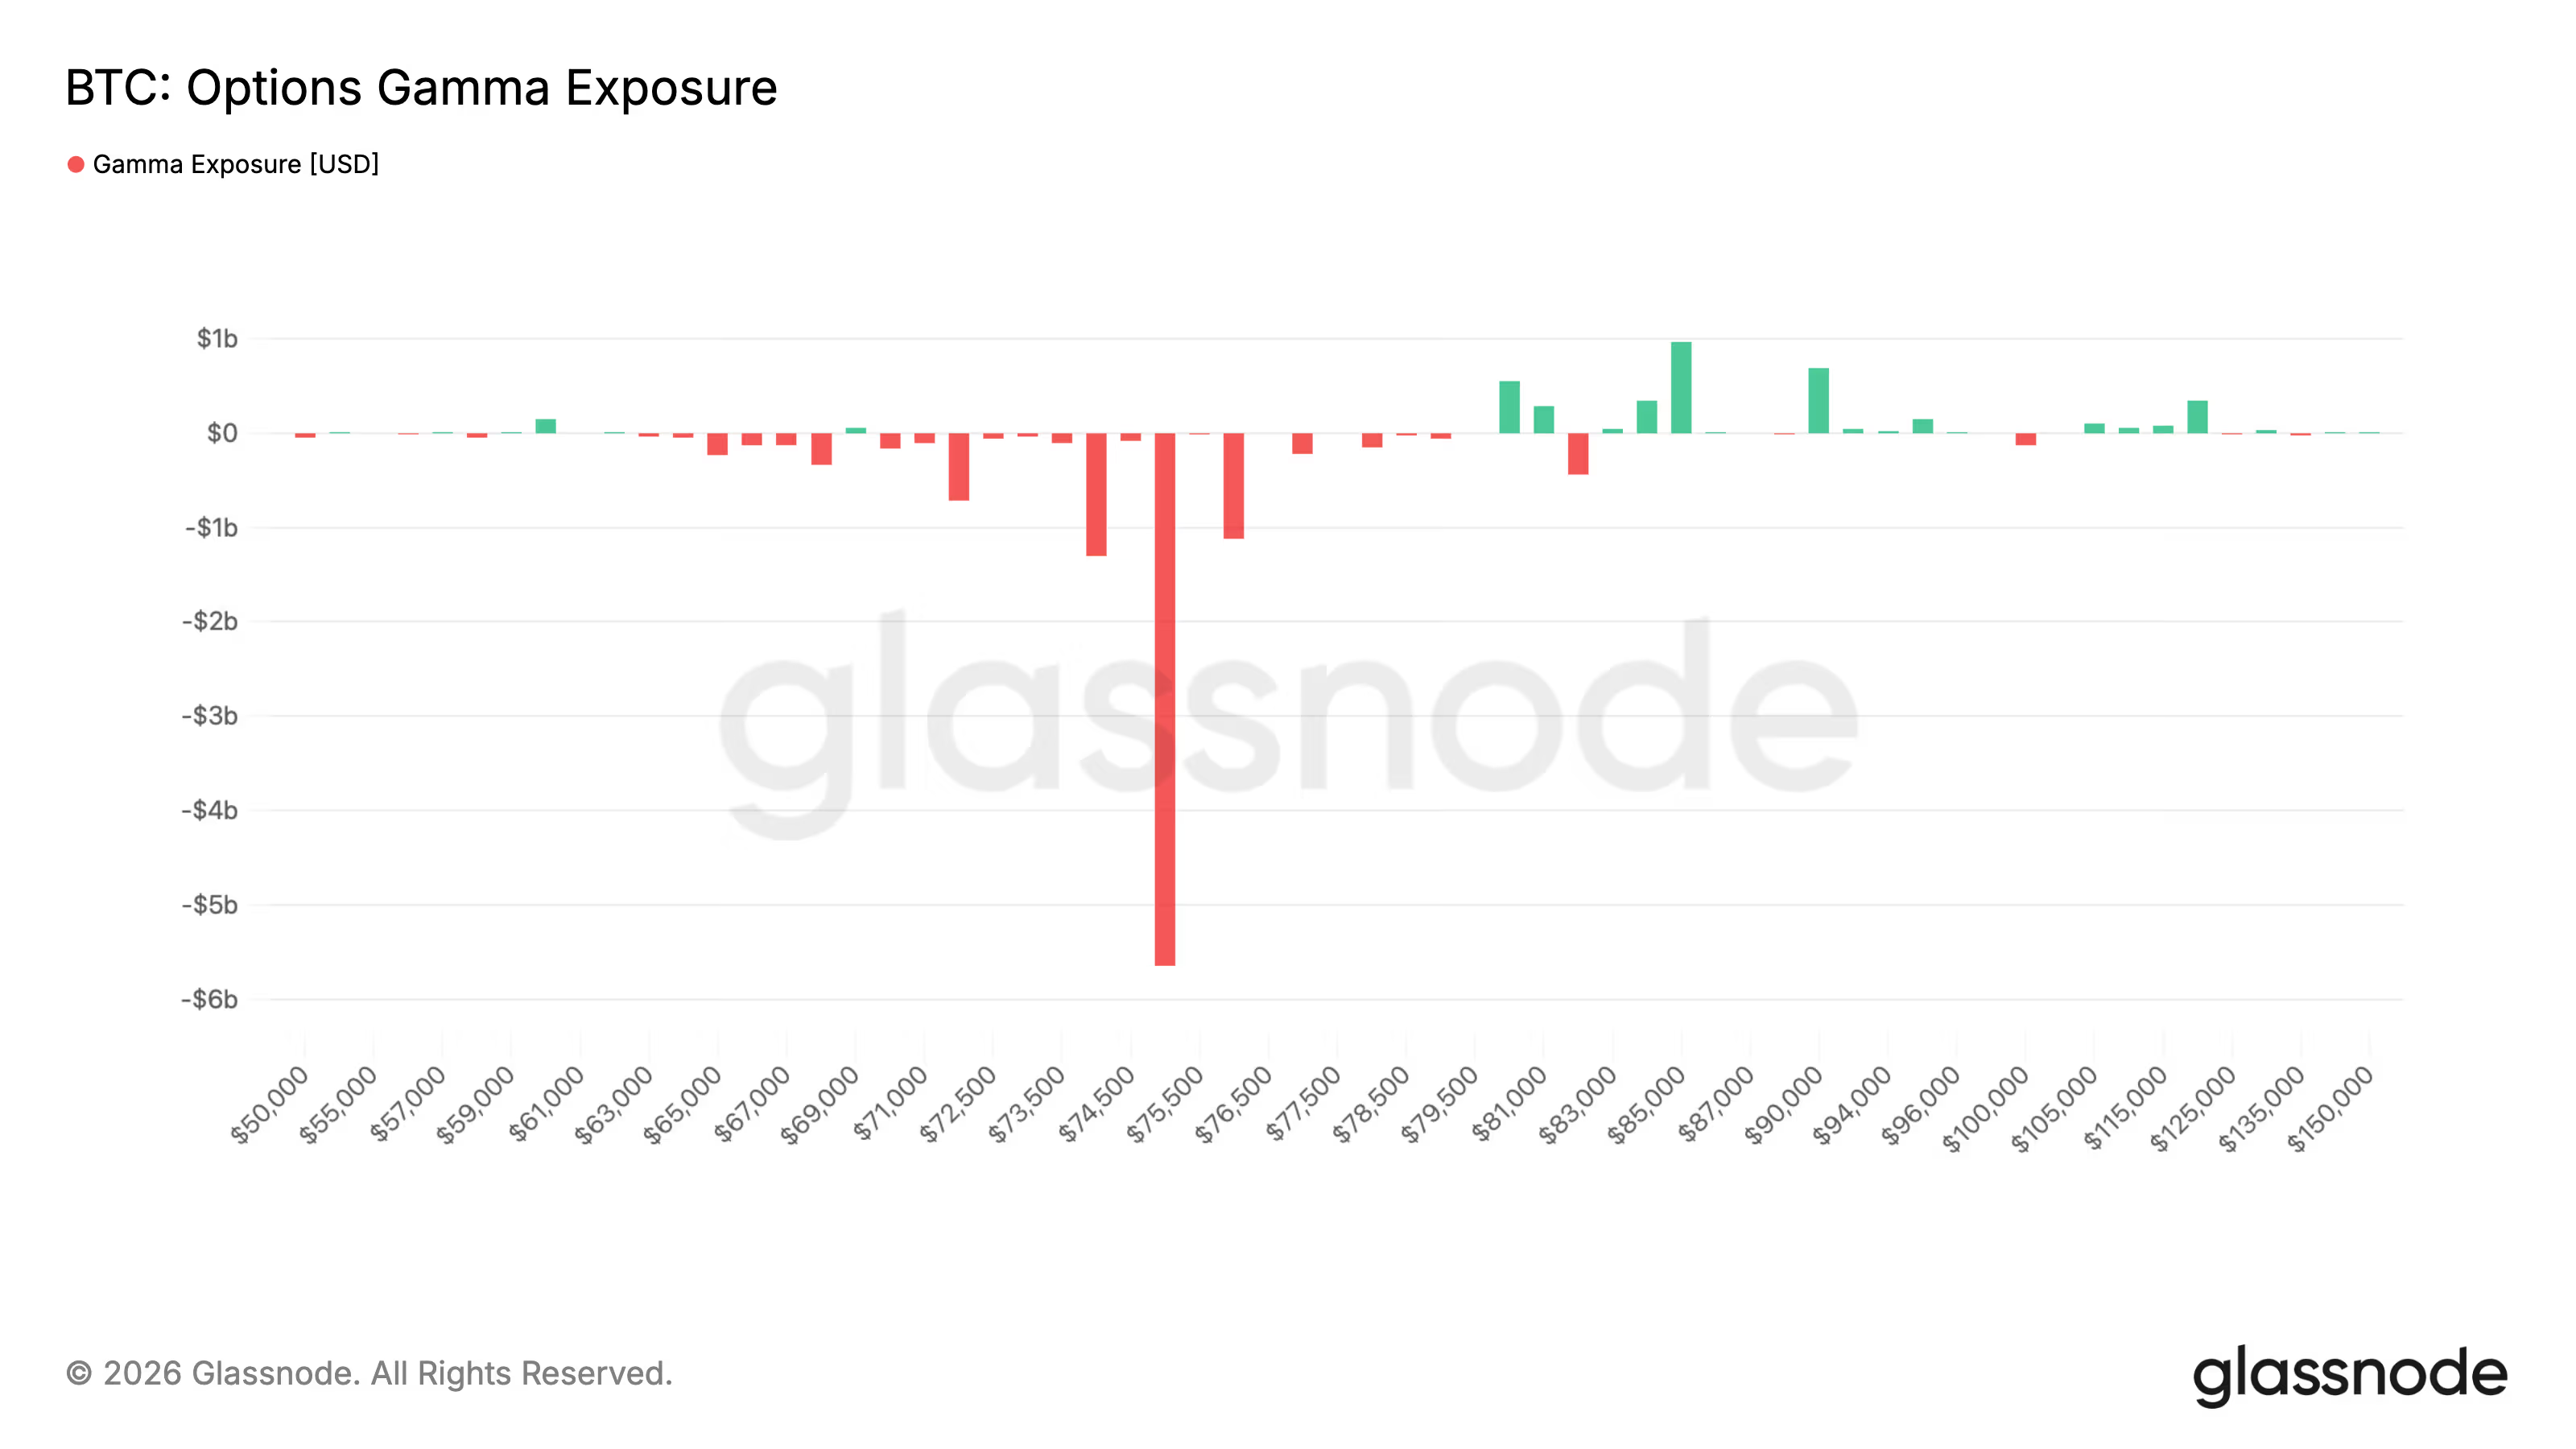
The $75,000 level is where most trading in call options, which represent bullish bets, has happened, according to data source Glassnode. Around $395 million in call open interest is concentrated at the $75,000 strike as of writing. That figure represents the dollar value of the number of active call options contracts today.
More importantly, “gamma exposure” is deeply negative at the 75,000 strike – it means dealers’ hedging flows are likely to amplify price movements around this level. As the price rises, they may need to buy more, and as it falls, sell more, reinforcing the direction of the move.
As a result, the 75,000 level can act as a zone of heightened volatility, where price swings become sharper rather than stabilizing.
Options are derivative contracts that give the buyer the right to buy or sell the underlying asset, in this case, BTC, at a predetermined price at a later date. A call option gives the right to buy and a put option gives the right to sell.
It’s like paying a booking fee to reserve a right to transact a house at today’s price – you have the right to buy or sell it later at that price, but you’re not obligated to go through with the transaction if the market price moves against you.

On the downside, the largest concentration of put open interest sits at $62,000, with roughly $330 million in contracts, marking the main zone of downside protection.
Between the two, there’s this max pain level of $71,000, which can act as a magnate heading into the expiry. The “max pain” point is the price level at which the largest number of options contracts are expected to expire worthless on the settlement date, though this level can shift as prices and open interest change leading up to expiry.
All in all, the options market is effectively sitting between $62,000 and $75,000, with $71,000 acting as a midpoint. Unlike March, when bitcoin traded below max pain, the market is now sitting above it, to test whether bitcoin can hold onto its gains.
Potential short squeeze higher
Funding rates in perpetual futures have remained negative, indicating a build-up of short positions that could fuel a squeeze if prices hold higher. Bears could square off their bearish bets if prices remain resilient above $75,000, which could add to the upward momentum.
While data from Checkonchain shows Deribit now holds around $31 billion in open interest, the largest across options markets, surpassing even BlackRock’s IBIT, which stands near $28 billion.
The Kelp restaking exploit underscores a broader vulnerability in DeFi: non-isolated lending and tightly integrated protocols can create rapid, cross-platform contagion. Industry insiders say the incident serves as a stress test for how risk can cascade beyond a single smart contract when assets and incentives are interconnected across multiple chains and products.
According to Michael Egorov, founder of Curve Finance, allowing lending frameworks to treat a wide array of collateral as interchangeable leverage exposes users to the risk of a single point of failure within the broader collateral ecosystem. In practical terms, a breach or misstep tied to one token can ripple through all assets backed by that same architecture, amplifying losses beyond the original target. Egorov’s observations align with a growing emphasis in DeFi risk management on collateral design and vault hygiene as the ecosystem grows more complex.
The Kelp project, which operates a restaking mechanism tied to the rsETH token, became the centerpiece of a weekend security incident when it was attacked, forcing a halt to Kelp’s smart contracts and triggering an urgent security review. Early estimates pegged misappropriated funds at around $293 million, with the platform moving quickly to investigate and mitigate the damage. The incident illustrates how nuanced DeFi constructs—restaking, liquidity provision, and cross-protocol guarantees—can present an expanded attack surface when combined with cross-chain functionality.
In the wake of the attack, Egorov urged DeFi teams to enhance asset vetting before accepting tokens as lending collateral, warning against single points of failure or exploitable surface areas within new digital assets. His guidance points to a broader industry push toward stronger due diligence on novel assets and more granular risk assessments for collateral acceptance on lending platforms.
The Kelp incident also spotlights the cross-chain dimension of the risk vector. Egorov cautioned that cross-chain frameworks and bridges, while enabling liquidity and interoperability, introduce significant attack surfaces. “Cross-chain is hard and potentially risky. Only use cross-chain infrastructure when absolutely necessary, and do it really carefully,” he said in an interview. The message arrives at a time when users increasingly depend on multi-chain strategies to access liquidity and yield opportunities, but security architectures have not always kept pace with rapid product innovation.
Crypto-security researchers framed the incident as a contagion event rather than a single-contract exploit. Cyvers, a blockchain security firm, described the Kelp attack as crossing protocol boundaries almost immediately. The incident affected at least nine DeFi protocols and platforms, including Aave, Fluid, Compound Finance, SparkLend, and Euler, all of which took steps to freeze rsETH markets or otherwise mitigate the fallout. The rapid cross-protocol response underscores how decentralized systems rely on a network of dependent components—lenders, oracles, bridges, and liquidity pools—to function. When one piece falters, others must quickly reconfigure risk controls to prevent broader losses.
“This was not just a protocol exploit. It immediately became a cross-protocol contagion event,” Cyvers CEO Deddy Lavid told Cointelegraph. The challenge is no longer just preventing exploits at the contract level, but understanding how fast they can cascade across integrated protocols.
The ripple effects from Kelp are not isolated to a handful of DeFi shops. The attack followed Drift Protocol’s about $280 million hack earlier in the month, and Cointelegraph notes that a string of other crypto platforms and DeFi exploits have marked a period of heightened risk activity for the sector. In total, losses from crypto hacks, code exploits, and scams in Q1 2026 were reported to be substantial, reinforcing the need for improved security, governance, and incident response across DeFi ecosystems.
Key takeaways
- Interconnected risk amplifies losses. Non-isolated lending means collateral attacks can spread through multiple tokens and protocols, increasing the potential scope of exploit losses beyond a single project.
- Cross-chain design as both enabler and hazard. Bridges and cross-chain liquidity foster innovation but also widen the attack surface, making careful, deliberate use essential.
- Contagion across nine protocols. The Kelp incident prompted immediate actions from Aave, Fluid, Compound Finance, SparkLend, Euler, and others to pause or mitigate rsETH exposure, illustrating real-time containment challenges in integrated DeFi networks.
- Asset vetting remains a priority. Industry voices emphasize rigorous evaluation of new collateral and the pursuit of resilient, multi-layer risk controls before broadening lending collateral acceptance.
- Sector context matters. The episode sits within a sequence of high-profile exploits, including Drift Protocol, signaling a broader imperative for stronger incident response and security architectures as DeFi grows more interconnected.
Kelp, rsETH, and the evolving DeFi security landscape
The Kelp incident is a concrete reminder that highly specialized DeFi constructs—such as restaking mechanisms—do not exist in a vacuum. The rsETH token, while offering potential yield and staking mechanics, also creates dependencies on the health of the restaking pipeline and the security of the tokens used as collateral. When a vulnerability emerges in one component, other protocols relying on the same token or the same cross-chain infrastructure can be pulled into the crisis, sometimes within hours or minutes of the initial breach.
From a risk-management perspective, the episode underscores several practical steps for builders and operators. First, strengthening the governance and vetting process for new assets used in lending markets is critical. Second, there is a clear case for tighter, more auditable cross-chain interaction patterns—reducing trust assumptions where possible and defaulting to more conservative bridge usage. Third, incident response playbooks must embrace rapid cross-protocol coordination, including predefined withdrawal or pause criteria that can be executed decisively to limit losses.
For investors and traders, the unfolding narrative reinforces a cautious stance toward complex DeFi products that rely on multi-layer architectures. While such products can unlock innovative yield opportunities, they also carry layered risk—asset design risk, cross-chain risk, and governance risk—that can compound quickly in fast-moving market environments. As the sector digests this latest episode, market participants will be watching not only for immediate recoveries and protocol updates but also for longer-term shifts in collateral standards and security best practices across DeFi lending.
Broader implications for DeFi stability and policy
Analysts suggest that the Kelp incident could influence how regulators and industry groups frame risk disclosures and capital adequacy for DeFi platforms. As ecosystems become more interconnected, there is a growing call for standardized risk reporting around cross-chain activities, collateral diversification, and incident response metrics. While regulatory approaches vary by jurisdiction, the shared industry objective remains clear: build resilient infrastructure capable of withstanding rapid, multi-protocol shocks without compromising user funds.
The road ahead will likely feature a combination of enhanced asset vetting, more cautious cross-chain deployment, and stronger protocol-to-protocol coordination. The lessons from Kelp are not just about recovering from a single attack; they are about reshaping the safety net for an increasingly interconnected DeFi landscape.
Watching the next set of protocol updates and audits will be essential. As developers and security researchers digest the Kelp fallout, the market will likely see renewed emphasis on collateral risk controls, faster detection of cross-chain anomalies, and tighter governance processes to prevent similar contagion events from reoccurring.
Readers should stay tuned for further disclosures from affected platforms as they publish findings from post-incident reviews, patch timelines, and any changes to rsETH-related risk parameters. The evolving response from the DeFi community will be a critical barometer for how quickly the sector can translate security lessons into practical safeguards for users, traders, and liquidity providers.
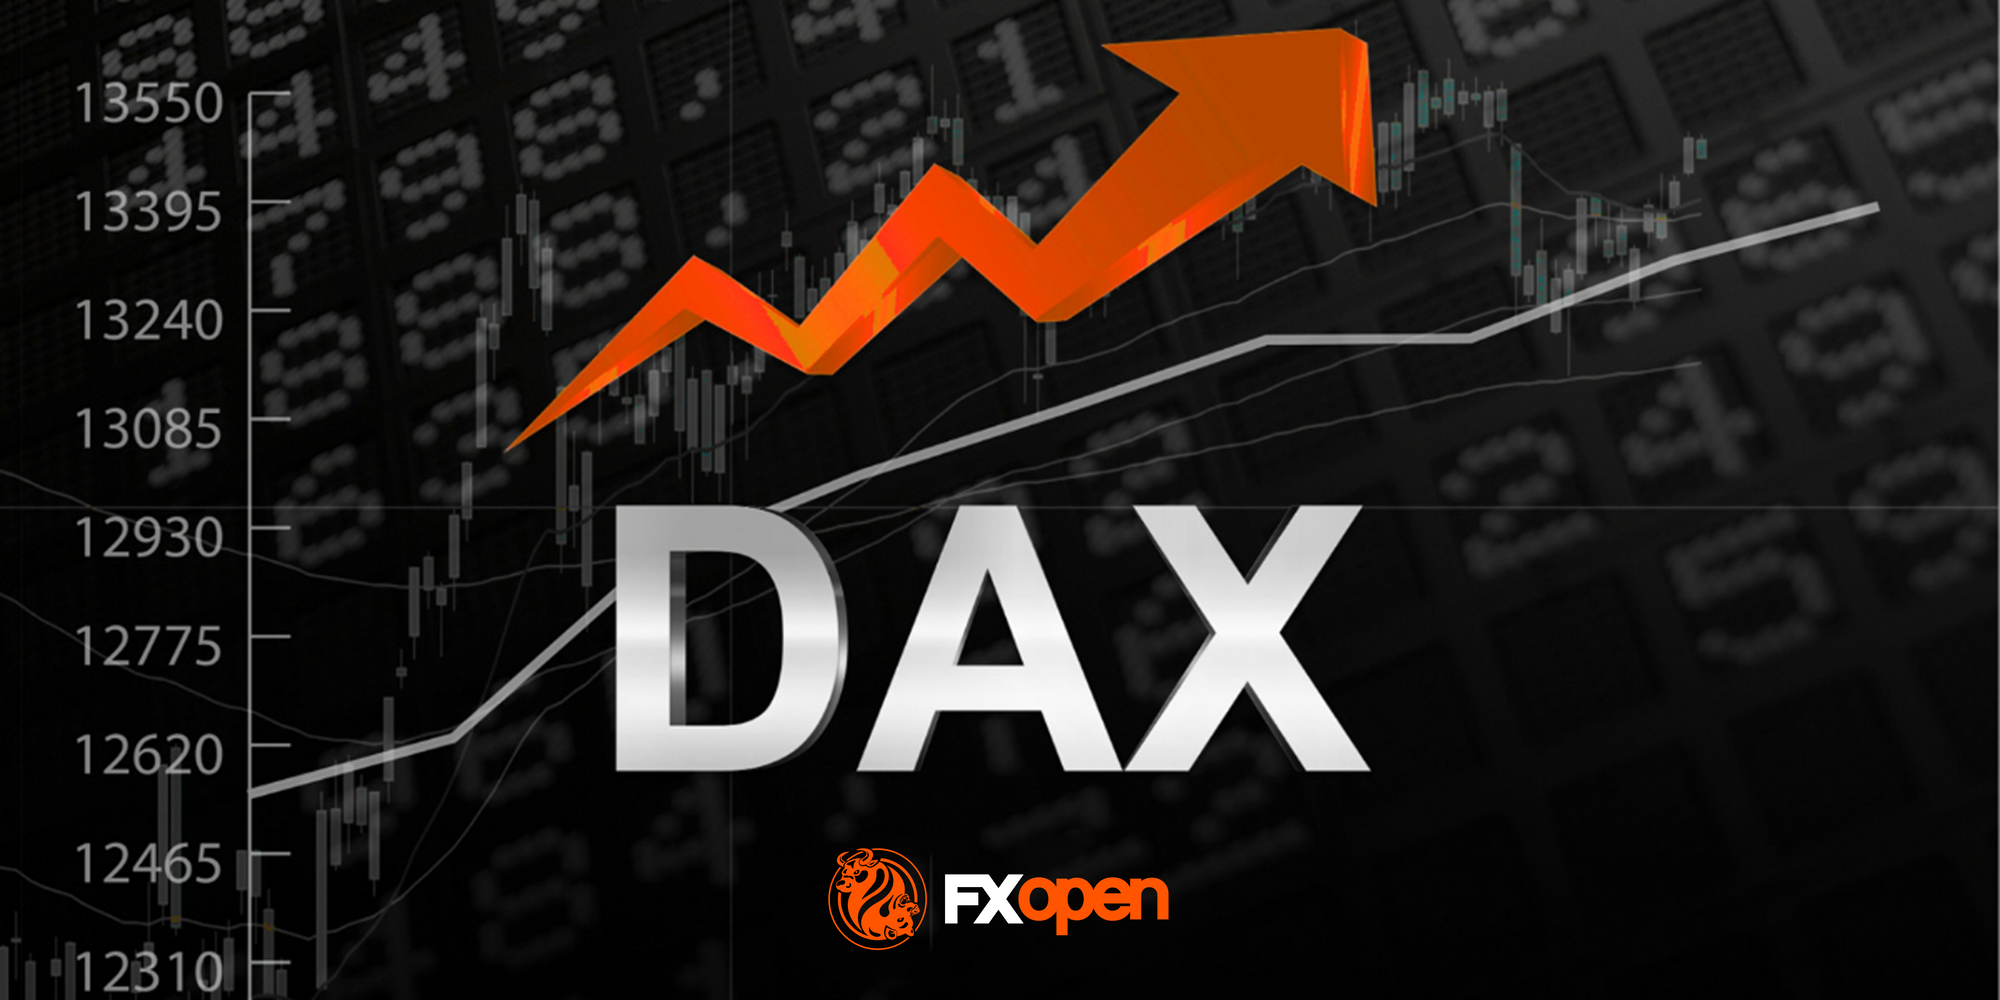

March proved to be one of the weakest months for the German index in recent years, though conditions stabilised by mid-April. At present, the DAX (Germany 40 mini on FXOpen) is showing a solid recovery, trading around 24,650. The rebound has been largely driven by gains in Rheinmetall and Infineon, highlighting investor preference for defence and technology stocks amid the current geopolitical backdrop.
The index remains highly sensitive to developments around the Strait of Hormuz. Ongoing reports of blockades and resumptions in shipping continue to fuel uncertainty in energy markets, directly affecting costs for German industry. At the same time, ECB policy remains a limiting factor: the central bank has kept rates at 2.0%, and despite inflation concerns, markets are not pricing in easing before the summer.
Technical picture
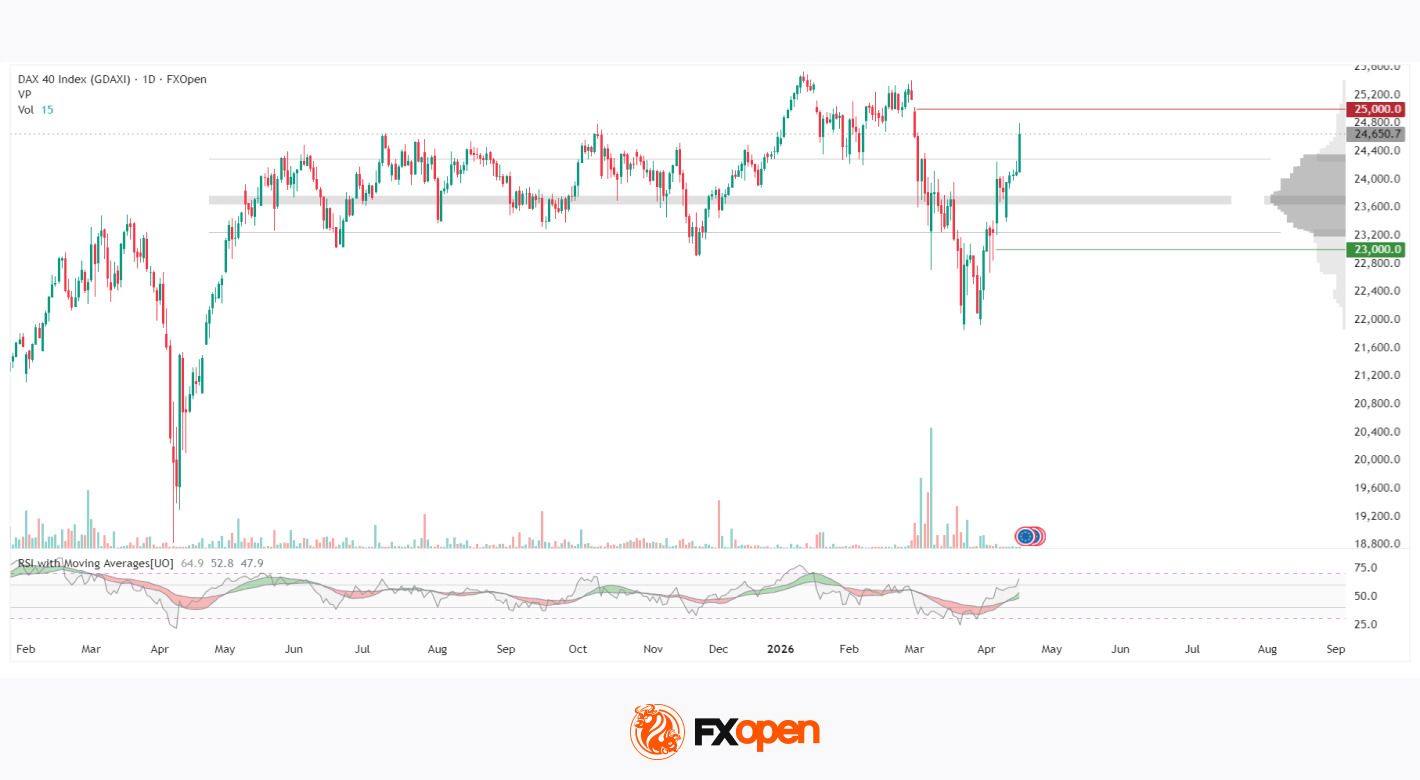
After reaching highs near 25,500 in January 2026, the index entered a sharp correction phase. A gap on 2 March signalled a shift in sentiment, prompting traders to close long positions. On 9 March, an extreme spike in vertical volume was recorded as the market attempted to break below 23,000. The index later tested strong support at 22,000, where heavy buying emerged and a base began to form.
Following the rebound, the price consolidated above the POC zone of 23,500–23,800, which has since turned into support. Volume levels have normalised after the March volatility, suggesting that panic selling has subsided. The RSI indicator confirms improving momentum, rising to 64.9 and holding above its moving averages, pointing to renewed bullish strength. The next key resistance for buyers stands at 25,000.
Summary
Holding above the POC zone has restored a bullish structure, returning control to buyers. The 23,000 level is now shaping up as a strong support area, while RSI with MA signals recovering demand. However, despite the current rebound, the broader fundamental backdrop remains mixed, with geopolitical risks and ECB policy expectations continuing to influence the index’s trajectory.
Crypto World
Bitcoin’s $126,200 Pierce Fades as Bearish Analyst Calls for Red May-June and $60K Target

TLDR:
- Bitcoin pierced $126,200 resistance on Friday and Saturday but failed to hold, signaling a likely pivot high.
- Analyst Aaron Dishner targets $60,000 first, followed by $49,000 and $38,555 if a full bear market unwinds.
- Weekly TBT bullish divergences on BTC and TOTALES are not being treated as confirmed trend-reversal signals yet.
- Ethereum, altcoins, and macro indicators including DXY and S&P futures add further weight to the bearish outlook.
Bitcoin analyst Aaron Dishner is warning of a significant pullback after price briefly pierced the $126,200 resistance level last week.
The move failed to hold, and Dishner, known on X as @MooninPapa, sees the reaction as a pivot high rather than a breakout.
With short-term support giving way across multiple indicators, he expects Bitcoin to move substantially lower through May and June, with firm downside targets already mapped out.
$126,200 Resistance Rejection Sets the Stage for Deeper Losses
Bitcoin pierced overhead resistance at $126,200 across Friday and Saturday but failed to sustain the move. The price reaction that followed has left Dishner unconvinced that bulls have retaken control.
He views the current structure as a pivot high, with the short-term support fan beginning to break down beneath it.
RSI has already completed its expected role within this price cycle, according to Dishner. Any bounce toward the $75,500 area, he noted, looks more like a retest than a recovery. He sees that level as a potential entry point for continued selling pressure rather than a base for renewed upside.
In a post on X, Dishner laid out his broader expectations for the months ahead. He is calling for red conditions through both May and June, with $60,000 as his first major downside target. From there, he sees $49,000 as a realistic follow-through level if selling pressure persists.
If a full bear market unwind plays out, Dishner places $38,555 as his deepest target. Weekly TBT bullish divergences have appeared on Bitcoin and TOTALES, but he is not treating them as trend-change signals.
He pointed out that similar readings have appeared before real bottoms formed in prior cycles, making them unreliable as standalone reversal signals.
Altcoins and Macro Risks Add Further Weight to the Bearish Outlook
Stablecoin dominance continues to support the bearish case heading into the anticipated pullback. The OTHERS index has already been rejected at the top of the cloud, reinforcing the view that broad market weakness remains intact.
Last week’s upper wick into the fast line on Bitcoin looked more like a warning than a confirmed breakout, Dishner noted.
Ethereum confirmed a weekly TBT bullish divergence but has not impressed with its price action. Dishner still sees a move toward $1,000 as a possibility for ETH, given how weak it has been relative to expectations.
The divergence alone, he argued, does not make a case for turning bullish during what he considers a bottom year.
On the macro side, the DXY still looks capable of closing the gap at 99.516, which could add pressure across risk assets.
S&P futures appear overly extended following a sharp reversal, while NK225 looks stretched at current levels. USDJPY remains a key risk factor if dollar strength returns.
Among altcoins, BNB is back at a fast line retest and AAVE may see a short reflex bounce after an exploit-driven flush. CFX and LDO still look like exhaustion rallies, while ZBCN looks heavy ahead of a support break.
Dishner is watching TAO but prefers to wait for Bitcoin to complete its pullback before taking any position.


RaveDAO’s RAVE token fell sharply over the past two days, dropping from $26 to below $1 and extending losses on Monday.
Summary
- RAVE plunged from $26 to under $1 after ZachXBT raised market manipulation concerns publicly Friday.
- ZachXBT said wallets linked to early distribution controlled about 95% of RAVE’s total supply.
- Binance, Bitget, and Gate.io acknowledged probe calls as RaveDAO denied involvement in price action.
Data cited in the report showed the token lost about 95% on Sunday before falling more than 60% again in the following 24 hours.
The decline followed public calls for an investigation by on-chain investigator ZachXBT. On April 18, he asked Binance, Bitget, and Gate.io to review suspected market manipulation tied to RAVE. He first offered a $10,000 bounty for information and later raised it to $25,000 the same day.
ZachXBT said he had contacted RaveDAO co-founder Yemu Xu on April 13 and April 14 about his concerns but did not receive a response before the token collapsed. He later shared findings that linked the project’s early token distribution to a small group of wallets.
According to his review, addresses tied to the initial distribution controlled about 95% of RAVE’s 1 billion token supply. He also flagged activity involving wallets connected to Bitget and Gate.io deposit addresses. ZachXBT said the scale of the sell-off looked unusual when compared with liquidation data across the market.
Meanwhile, Bitget publicly responded to the request for an investigation within hours. Binance and Gate.io also acknowledged the calls later in the day. At the same time, RaveDAO said it had no role in the recent price movement.
In a later update, ZachXBT said a multisig wallet linked to the initial distribution moved about 23 million RAVE, worth around $23 million, to two Bitget deposit addresses. After that transfer, the token’s price dropped below $0.60.
He also wrote that roughly $6 billion in market value was erased while 24-hour liquidations stood near $52 million, which he described as a sign of an unstable market structure.
RaveDAO denies involvement as wider scrutiny grows
RaveDAO issued a public response rejecting claims that it drove the price move. The team said it was ”not engaged in, nor responsible for, recent price action.” It also addressed claims about token control, though it did not confirm the figures mentioned by ZachXBT.
The team added that it aims to act ”sustainably and transparently” as it builds its platform. Meanwhile, ZachXBT said similar price patterns have appeared in other tokens, including SIREN, MYX, COAI, M, PIPPIN, and RIVER. He also said he held no trading position in RAVE and that the bounty for verified information remains open.
At the time of writing, RAVE traded at $0.64 with a 24-hour trading volume of $297.6 million. The token was down 46% over 24 hours, leaving it with a market capitalization of about $161.3 million.

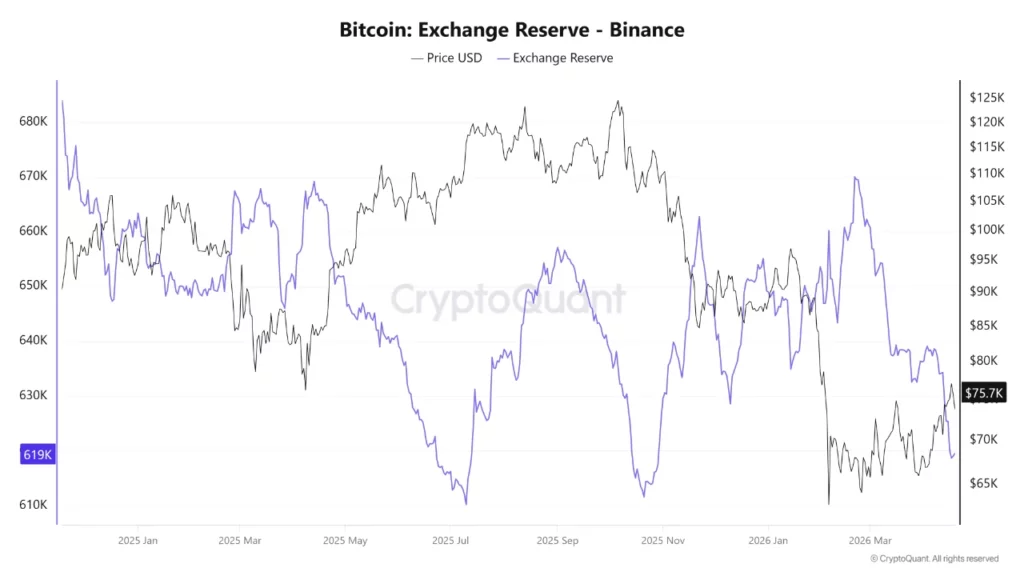
Bitcoin reserves on Binance have dropped to about 619,000 BTC, their lowest level since October 2025, according to CryptoQuant analyst Arab Chain.
Summary
- Binance Bitcoin reserves dropped to about 619,000 BTC, their lowest level since October 2025 this week.
- Spot Bitcoin ETFs added 25,600 BTC last week, lifting total holdings near five-month highs.
- Bitcoin stayed volatile near $74,800 as exchange outflows and ETF buying reshaped available market supply.
The decline points to continued Bitcoin outflows from the exchange after reserves climbed sharply earlier this year.
In February 2026, Binance’s Bitcoin reserves rose to nearly 670,000 BTC, their highest level since 2024. That increase came during a strong market rally and suggested that more investors were moving coins to exchanges, often to sell or lock in profits as prices moved higher.
Since the February peak, reserves have moved lower in a steady trend. The change suggests that investors have shifted from exchange deposits to withdrawals and off-exchange storage. This type of movement usually shows that holders are choosing to keep Bitcoin rather than sell it at current prices.
The decline in reserves has happened while Bitcoin has seen sharp price swings. Even with that volatility, fewer coins remain on Binance. The data points to stronger holding behavior as traders move assets into cold storage or other long-term custody options.
At the same time, spot Bitcoin ETFs posted strong accumulation last week. Data showed ETF holdings rose from 1.3141 million BTC on Monday to 1.3397 million BTC by Friday. That means the funds added 25,600 BTC over five trading days.
The latest increase brought ETF balances close to levels last seen in November. It also marked one of the strongest weekly additions in recent months. The combined trend of lower Binance reserves and rising ETF balances suggests that Bitcoin supply is moving away from exchanges and into longer-term investment vehicles.
Bitcoin price stays volatile amid geopolitical pressure
Bitcoin price action remained unstable over the weekend. The asset rose above $78,300 late Friday, its highest level since early February, before falling back to the $75,000 to $76,000 range. The retreat followed renewed tension tied to the US military seizure of an Iranian cargo ship and rising concern over oil routes in the Strait of Hormuz.
Late Sunday, Bitcoin briefly dropped below $74,000 as the market reacted to the latest developments between the US and Iran. The two-week ceasefire that had helped calm markets is due to end on Wednesday.
At press time, Bitcoin traded near $74,800, down slightly over 24 hours but still up 5% over the past week.
Disclosure: This article does not represent investment advice. The content and materials featured on this page are for educational purposes only.

Dodge & Cox Stock Fund Q1 2026 Commentary

BTC price faces sell-the-news risk after rebound
Jessi Draper Reacts to Marciano Brunette Romance Speculation


-

 Crypto World7 days ago
The SEC Conditionalises DeFi Platforms to Be Avoided for Broker Registration
-

 NewsBeat6 days ago
Trump and Pope Leo: Behind their disagreement over Iran war
-

 Fashion3 days ago
Weekend Open Thread: Theodora Dress
-

 Crypto World7 days ago
SEC Signals Exemption for Crypto Interfaces From Broker Registration
-

 News Videos5 days ago
Secure crypto trading starts with an FIU-registered
-

 Sports3 days ago
NWFL Suspends Two Players Over Post-Match Clash in Ado-Ekiti
-

 Crypto World6 days ago
SEC Proposes Certain Crypto Interfaces Don’t Need to Register as Brokers
-

 Business20 hours ago
Powerball Result April 18, 2026: No Jackpot Winner in Powerball Draw: $75 Million Rolls Over
-

 Crypto World2 days ago
Russia Pushes Bill to Criminalize Unregistered Crypto Services
-

 Politics3 days ago
Palestine barred from entering Canada for FIFA Congress
-
 Business4 days ago
Creo Medical agree sale of its manufacturing operation
-

 Politics1 day ago
Zack Polanski demands ‘council homes not luxury flats for foreign investors’
-
 Entertainment6 days ago
Brand New Day’ Footage Reveals the Devastating Impact of ‘Now Way Home’
-

 Tech5 days ago
Microsoft adds Windows protections for malicious Remote Desktop files
-
 Entertainment6 days ago
Karol G’s ‘Ultra Raunchy’ Coachella Set Gave ‘Satanic Vibes’
-

 Sports7 days ago
Aaron Judge says Yankees need to ‘simplify’ approach amid offensive slump
-

 Entertainment7 days ago
How Babylon 5 Turned Brief Side Story Into Emotional Masterpiece
-

 Tech6 days ago
What was the first ransomware attack to demand payment in Bitcoin?
-

 Tech4 days ago
‘Avatar: Aang, The Last Airbender’ Leaked Online. Some Fans Say Paramount Deserves the Fallout
-

 Crypto World3 days ago
Russia Introduces Bill To Criminalize Unregistered Crypto Services
You must be logged in to post a comment Login