
Business
F&O Talk: Mid, smallcaps to continue outperformance as Q1 begins, says Sudeep Shah; outlines Kalyan Jewellers, TCS strategy


The Sensex jumped 828 points to close at 77,569, while the Nifty 50 advanced over 244 points to end the session at 24,206, extending gains for the second consecutive session. Meanwhile, India VIX, which measures market volatility, fell another 8% to 12.33.
Analyst Sudeep Shah, Vice President and Head of Technical & Derivatives Research at SBI Securities, interacted with ETMarkets regarding the outlook for the Nifty and IT, as well as an index strategy for the upcoming week. The following are the edited excerpts from his chat:
Nifty started the week on a strong note, but the resumption of the conflict erased those gains. How do the charts look now, and what are the key levels to watch?
For the fourth consecutive trading session, the benchmark index Nifty continued to exhibit signs of uncertainty. This indecisiveness is clearly reflected on the weekly chart, where the index has formed a small-bodied candle with shadows on both ends for the fourth straight week. Such a candle formation highlights the ongoing tug-of-war between bulls and bears, making this one of the most prolonged phases of indecision witnessed in recent months. But beneath this prolonged indecision, subtle shifts are beginning to emerge that could determine the market’s next meaningful move.
In sharp contrast to the benchmark index, the broader market continues to display remarkable resilience. Both the Nifty Midcap 100 and Nifty Smallcap 100 are significantly outperforming the frontline indices. The Nifty Midcap 100 scaled a fresh all-time high during the week, while the Nifty is still nearly 8% below its lifetime peak. Meanwhile, the Nifty Smallcap 100 is just a stone’s throw away from registering a new all-time high. We continue to believe that the broader market is well positioned to sustain its relative outperformance in the near term.
Coming back to the benchmark index, the Nifty continues to oscillate around its key moving averages, which have flattened due to the prolonged sideways movement. Momentum indicators and oscillators are also echoing the same view. Both the daily and weekly RSI remain range-bound, while the daily ADX has slipped to 12.05 and continues to trend lower, indicating the absence of meaningful strength in either direction.

Going ahead, the 24,500–24,550 zone is likely to act as an important hurdle for the index, while the 23,950–23,900 zone remains a crucial support area. A decisive breakout or breakdown beyond these levels could mark the beginning of the next directional move.
The Nifty IT index rallied sharply after TCS’ earnings. What do the technicals suggest for the sector going forward?
Despite the pullback from the 25,699 low recorded on July 1, the broader technical structure of the Nifty IT Index remains weak. The index continues to trade below its key moving averages on the weekly timeframe, indicating that the primary trend remains under pressure.
From a relative strength perspective, the index has moved from the Lagging quadrant to the Improving quadrant on the Relative Rotation Graph (RRG), suggesting that momentum is gradually building. However, it continues to lack relative strength, indicating that sustained outperformance is yet to emerge. Reinforcing the cautious outlook, the MACD remains below both the zero line and the signal line, highlighting the absence of meaningful bullish momentum.Historically, the 26,200–26,100 zone has acted as a strong demand area. Between June 2022 and April 2023, the index witnessed multiple rebounds from this region, making it a critical long-term support zone.
While intermittent pullbacks and short-covering rallies cannot be ruled out, a meaningful trend reversal is unlikely unless the index decisively reclaims the 29,000–29,100 zone, which also coincides with the previous swing high. Until then, the broader technical bias is expected to remain cautious, with any relief rally likely to face selling pressure at higher levels.
What is your technical view on TCS, Infosys and Kalyan Jewellers? What strategy would you recommend for traders?
TCS: The stock continues to trade below its key short- and long-term moving averages, indicating that the primary trend remains weak. The RSI is hovering in the 40–45 zone, reflecting subdued momentum, while the rising ADX suggests that the prevailing bearish trend is strengthening with no clear signs of a reversal yet. Additionally, the MACD remains well below the zero line, reinforcing the negative bias. As long as the stock trades below the Rs 2,170–2,180 zone, the bearish outlook is likely to persist. Traders should avoid aggressive long positions and wait for a decisive breakout above this resistance before turning constructive.
Infosys: The stock attempted to move above its 20-day EMA on three occasions during the week but failed to sustain higher levels, closing lower each time. The stock continues to trade below its key short- and long-term moving averages on both the daily and weekly timeframes, highlighting the prevailing weakness. The weekly RSI remains below the 40 mark, indicating weak momentum and the absence of strong buying interest. As long as the stock remains below the Rs 1,110–1,120 zone, the bearish bias is likely to continue. Traders should maintain a cautious stance until the stock reclaims this resistance zone convincingly.
Kalyan Jewellers: Shares have registered a fresh consolidation breakout on the weekly chart, backed by a sharp rise in trading volumes, lending credibility to the breakout. The RSI has climbed above the 60 mark, signalling strengthening bullish momentum. The stock has also closed above the upper Bollinger Band, a characteristic often observed during strong trending moves. As long as the stock sustains above the Rs 425–430 zone, the bullish bias is likely to remain intact. Traders may consider buying on dips while maintaining a stop-loss below this support zone.
With the earnings season gaining momentum, should traders focus more on index F&O or stock-specific opportunities? How should they approach the next few weeks?
With the earnings season gaining momentum, we believe traders should focus more on stock-specific opportunities rather than index-based trades over the next few weeks. Over the last couple of months, the broader market has consistently outperformed the frontline indices, with several midcap and smallcap stocks witnessing strong momentum and delivering meaningful breakouts. In contrast, benchmark indices such as Nifty and Sensex continue to trade in a sideways range, reflecting a lack of clear directional conviction.
As earnings announcements gather pace, stock-specific volatility is likely to increase, creating opportunities driven by earnings surprises, management commentary, and sector-specific developments. Therefore, traders should adopt a selective approach and focus on stocks exhibiting strong relative strength, positive price structures, and favorable earnings prospects, as they are likely to offer better risk-reward opportunities than taking directional bets on range-bound indices.
What is the India VIX signalling about market volatility and sentiment for the coming week?
India VIX continues to trade below its key short- and long-term moving averages, indicating that overall market volatility remains under control. Although the volatility index surged nearly 26% on 8th July, when the Nifty plunged over 500 points and triggered a brief wave of panic, it has gradually cooled off over the past two sessions, coinciding with the recovery in the benchmark index.
Since peaking at 28.90 on 30th March 2026 amid heightened geopolitical tensions between the U.S. and Iran, India VIX has been forming a pattern of lower highs and lower lows, reflecting a steady decline in fear and uncertainty. This easing in volatility has provided significant support to the broader market.
Technically, the 10.00–10.30 zone is a crucial support for India VIX. A sustained move below this range would indicate further moderation in volatility and could help the equity markets remain stable. On the upside, the 15.30–15.50 zone is expected to act as the immediate resistance.
Overall, the current trend in India VIX suggests that market sentiment remains constructive, and the broader market is likely to stay steady in the coming week, provided there are no adverse developments that trigger a fresh bout of risk aversion or a short-term knee-jerk reaction.
Which stocks are looking technically strong for next week, and why?
Technically, Godrej Properties, DLF, Prestige Estates, Chennai Petroleum, PNB Housing Finance, and Indian Hotels are looking strong for the coming week. These stocks are exhibiting positive price structures, strong relative strength, and bullish momentum, making them well placed to outperform the broader market in the near term.
(Disclaimer: Recommendations, suggestions, views and opinions given by the experts are their own. These do not represent the views of The Economic Times)



Investment in new products and seasonal promotions expected to boost sales.

Ingersoll Rand Q2: Profitability Took A Hit, But There Are Ways It Can Come Back

In theory, the inquiry should be impartial and informative – a learning process focused solely on improving passenger safety. But in the case of AI171, the information revealed by the investigation so far has triggered a major backlash from safety campaigners, pilots’ groups and lawyers acting for the bereaved relatives.
A key factor in this has been the preliminary report issued by the AAIB a month after the accident. The 15-page document did not draw any conclusions about the causes of the crash, or make any recommendations.
Nonetheless, just two short paragraphs generated a great deal of controversy.
First, it was noted that according to the aircraft’s flight data recorder, the two fuel cutoff switches – normally used when starting the engines before a flight and shutting them down afterwards – transitioned from the run to the cutoff position seconds after take-off. This would have deprived the engines of fuel, causing them to lose thrust rapidly.
The report then says: “In the cockpit voice recording, one of the pilots is heard asking the other why did he cutoff. The other pilot responded that he did not do so.”
This brief statement, provided without a transcript or any indication of who was speaking, sparked intense speculation about the actions of the pilots. Newsweek, for example, focused on the “troubling possibility: that a seasoned captain may have deliberately doomed his jet – and nearly 250 lives”. Former NTSB chairman Robert Sumwalt told CBS News the report showed “this was not a problem with the airplane or the engines. Instead…somebody in the cockpit shut the fuel off to those engines.”
A few days later, The Wall Street Journal weighed in. Citing people familiar with the matter, it claimed that recordings of dialogue between the pilots suggested it was the Captain, Sumeet Sabharwal, who had flipped the fuel switches.
It is important to note that this was merely a preliminary report, and within days, the AAIB issued a statement condemning “selective and unverified reporting” in the international press as “irresponsible”. It urged the public and the media to “refrain from spreading premature narratives that risk undermining the integrity of the investigative process.”
By then, arguably, the damage had already been done.
“When a pilot is alive he can defend himself” says Capt. CS Randhawa, president of the Federation of Indian Pilots (FIP). “When the pilot is dead, all the agencies can collude – and they put the blame on the pilot, to save the manufacturer. And this is seen the world over. It’s not the first time”.
His organisation, which represents around 6,000 pilots, condemned the preliminary report as “irrevocably compromised”. Together with Sumeet Sabharwal’s 91-year-old father, Pushkar Raj Sabharwal, they took their concerns to India’s Supreme Court, demanding a judicial investigation into the crash.
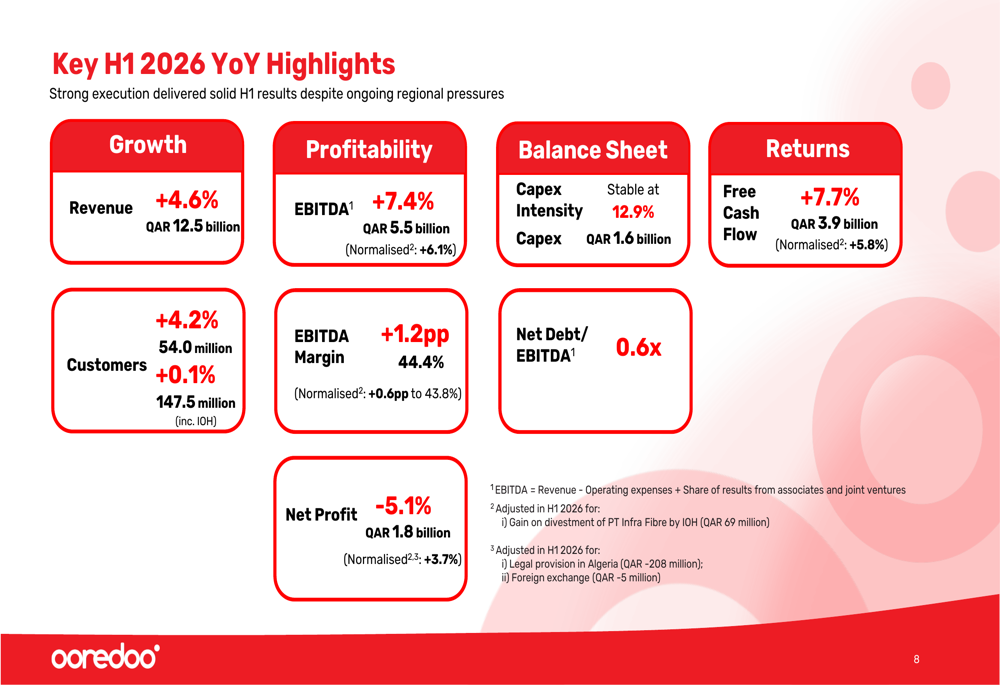
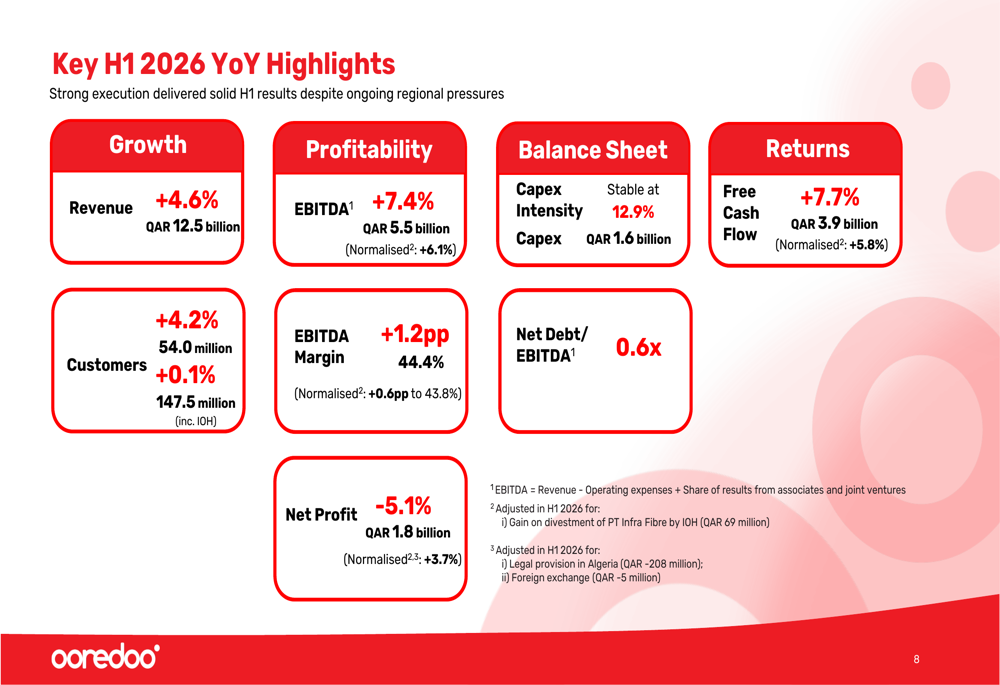
Ooredoo H1 2026 slides: margin expansion, strategic gains offset Q2 miss

Yes. Corporate subscriptions are available for teams and organisations, with discounted rates as user numbers increase. Pricing starts from $1,625 + GST per user.
Get in touch
to discuss the right option for your organisation.
Business News subscriptions are used by executives, investors, consultants and professionals who need to stay informed and make better decisions about the WA market. When you subscribe you’ll get
- Unlimited access to WA’s most trusted business journalism
- Data & Insights — detailed profiles of WA companies, people, projects and deals
- MyBN — a personalised feed based on the companies, people and sectors you follow
- Special publications and industry reports
- Daily and weekly email newsletters
Data & Insights is a research tool built specifically for the WA market. It draws on more than 30 years of Business News reporting, updated regularly to reflect what’s happening now. Use it to:
- Look up detailed profiles of WA companies, including financials, directors and ownership
- Find decision-makers and track their career movements
- Research live and completed projects across WA industries
- Monitor deals, appointments and market activity
- Access industry rankings and league tables
Data & Insights is updated daily by our dedicated research team, which uses the latest announcements, ASX filings and editorial coverage to keep our person, company, list and project records up to date.
Business News welcome all opportunities to make our dataset accurate, complete and current, so if you have an update request, please email the team at
general@businessnews.com.au, and we’d be happy to assist.
MyBN
is part of every subscription. It’s your personalised view of Business News. You can follow the companies, people, sectors and projects that matter to you, and get a news feed and alerts tailored to your interests. You can save articles to read later and retain only what you need.
Only subscribers have full access to all content on the Business News website.
If staying informed about the WA economy is part of your job, and/or you’re looking for networking opportunities in WA, Business News is built for you.
Business News subscribers are:
- Executives and directors tracking competitors, clients and market movements
- Investors and advisers researching companies, deals and industry trends
- Consultants and professionals staying across sectors relevant to their clients
- Business owners looking for leads, context and market intelligence
Most Business News publications cover national or global markets. Business News is focused entirely on Western Australia, which means the journalism, the data and the intelligence are all built around WA companies, people and projects — not adapted from a national feed. Data & Insights, included with every subscription, combines more than 30 years of WA-specific editorial research with live business data. There’s no comparable product for the WA market.
The Morning Digest Email provides a comprehensive wrap of the major headlines, relevant to WA business, and includes with a snapshot of the overnight news covering oil, gold and ASX-listed companies.
The Afternoon Wrap Email focuses on the news covered by our team of journalists during the course of the working day, including exclusive stories and analysis, all of which relates to WA business and the local economy.
The BN Weekender Email contains a wrap of the Business News from the week that was, highlighting the top stories in each area of WA business.
Sign up for free.
We’re happy to help.
Get in touch
and our team will come back to you.

ZoomInfo: Cheap On Earnings, Expensive On Enterprise Value
Business
Jio Financial Services shares rise 2% after firm sets record date for dividend. What to expect?

Jio Financial Services shares rose to Rs 262.65 apiece on Monday, extending a more than 10% jump in a week. The company paid a dividend of Rs 0.5 per share to its shareholders last year. After announcing the latest dividend in April this year, the stock currently has a dividend yield of 0.19%, according to data on Trendlyne.
Fixing the record date as August 10 means that only shareholders who own the company’s shares in their demat accounts as of August 10 (next Monday) will be eligible to receive the dividend, subject to shareholder approval at the upcoming Annual General Meeting (AGM).
Earlier this month, Jio Financial Services reported 155% year-on-year (YoY) jump in its consolidated net profit at Rs 830 crore in the first quarter of FY27, while revenue from operations increased 227% YoY to Rs 2,004 crore during the quarter under review.
Consolidated total income rose 141% YoY to Rs 1,496 crore from Rs 619 crore. It was up 47% from Rs 1,020 crore in the March quarter. Interest income grew 165% YoY to Rs 962 crore, while fees and commission income surged to Rs 325 crore from Rs 54 crore.
Also read | Jio Financial Services sets record date for dividend. Check details
Jio Financial Services share price
Jio Financial Services shares had jumped nearly 4% to close at Rs 256 apiece on Friday. The stock gained more than 10.5% in a week and over 9% in a month. However, it is down nearly 12% in 2026 so far.
In the longer term, the shares of the company have fallen around 21% in a year. The company currently has a market capitalisation of more than Rs 1.73 lakh crore.Motilal Oswal has a Buy rating on Jio Financial Services with a target price of Rs 315 apiece. The brokerage said the company delivered a healthy quarter, driven by strong growth in Jio Credit, whose assets under management (AUM) crossed Rs 300 billion.
It also highlighted steady progress across the payments, insurance, and asset management businesses, although operating expenses remained elevated due to continued investments in incubating new businesses and expanding existing operations. Motilal Oswal cut its FY27 and FY28 EPS estimates by 4% and 6%, respectively, to account for higher operating costs, but expects consolidated PAT to grow at a 46% CAGR between FY26 and FY28.
Also read | For investors with some patience: 6 mid-cap stocks from different sectors with upside potential of up to 20%
(Disclaimer: Recommendations, suggestions, views and opinions given by the experts are their own. These do not represent the views of The Economic Times)


I am a self-taught individual investor and I have been investing in stocks for over 25 years. I focus on dividend growth investing with a long-term horizon since I believe in the compounding power of dividend growth investing. I generally look for undervalued stocks with sustainable dividend growth and capital appreciation potential. I try to provide a little more in depth analysis weighing the positives and negatives. I am now in the Top 2.0% out of 28,000+ financial bloggers (February 2024) as tracked by Tip Ranks for my SA articles.Blog: www.dividendpower.orgWork/ associated with the existing authors James Marino and Ferdis.
Analyst’s Disclosure: I/we have no stock, option or similar derivative position in any of the companies mentioned, and no plans to initiate any such positions within the next 72 hours. I wrote this article myself, and it expresses my own opinions. I am not receiving compensation for it (other than from Seeking Alpha). I have no business relationship with any company whose stock is mentioned in this article.
Seeking Alpha’s Disclosure: Past performance is no guarantee of future results. No recommendation or advice is being given as to whether any investment is suitable for a particular investor. Any views or opinions expressed above may not reflect those of Seeking Alpha as a whole. Seeking Alpha is not a licensed securities dealer, broker or US investment adviser or investment bank. Our analysts are third party authors that include both professional investors and individual investors who may not be licensed or certified by any institute or regulatory body.
Business
10 Things to Know About Warren Buffett’s Famous S&P 500 Advice Amid Today’s Rising Concentration Risk

Warren Buffett’s decades-old advice to put money into low-cost S&P 500 index funds remains one of the most widely followed pieces of investment guidance in the world. But as the index has grown increasingly dominated by a small handful of technology giants, analysts say the strategy today carries different risks than when Buffett first popularized it. Here are 10 things to know about the guidance and how it applies to today’s market.
1. The advice traces back to Buffett’s 2013 shareholder letter. In that letter, Buffett instructed the trustee overseeing a bequest to his wife to allocate 90% of the funds to a low-cost S&P 500 index fund, with the remaining 10% directed toward short-term U.S. government bonds. He recommended Vanguard specifically, though he did not name a particular fund or ticker.
2. VOO is widely seen as the closest match to Buffett’s description. Vanguard’s S&P 500 ETF, trading under the ticker VOO, carries an annual expense ratio of just 0.03%, among the lowest available for a fund tracking the index, and aligns closely with the kind of low-fee vehicle Buffett described in his original guidance.
3. Technology now dominates the index far more than it once did. According to recent index weighting data, technology stocks make up roughly 37% of the S&P 500. Just three companies, Apple, Nvidia and Microsoft, together account for roughly 20% of the entire index’s value, meaning a large share of any S&P 500 index fund’s performance now hinges on the fortunes of a small handful of mega-cap technology firms.
4. That concentration has grown dramatically since Buffett first gave the advice. Ten years ago, the S&P 500’s 10 largest stocks represented just 15.3% of the index’s total market capitalization. Five years after Buffett’s 2013 letter, that figure had risen to 27.2%. Today, according to MacroMicro data, the top 10 stocks account for roughly 37.5% of the index, down slightly from an all-time high near 43% reached earlier this year, but still among the highest concentration levels in the index’s history.
5. Artificial intelligence spending is now a major driver of index-wide earnings. Goldman Sachs has forecast that companies tied to artificial intelligence could contribute roughly half of the S&P 500’s overall earnings growth in 2026. That dependence means a slowdown in AI-related capital spending or disappointing earnings from a handful of mega-cap technology companies could weigh disproportionately on the entire index, a risk that did not exist to the same degree when Buffett first offered his recommendation.
6. Long-term return expectations for U.S. stocks have moderated. Vanguard’s broad U.S. equity return model now projects 10-year annualized returns of between 4.2% and 6.2%, down from an earlier forecast range of 4.9% to 6.9%, reflecting the impact of higher current valuations on expected future returns. By comparison, the iShares Core S&P 500 ETF, trading under the ticker IVV, posted an annualized gain of 15.47% over the 10 years ending in June, a pace analysts generally view as unlikely to be sustained indefinitely.
7. Current valuations remain a point of debate among analysts. According to FactSet data, the S&P 500 currently trades at a price-to-earnings ratio of 19.6, a level some analysts view as elevated relative to historical averages, though others argue current earnings growth, particularly among AI-linked companies, helps justify the higher multiple.
8. Money continues flowing into S&P 500 index funds at record levels. Vanguard’s VOO recently became the first exchange-traded fund in history to surpass $1 trillion in assets under management. According to data cited by Reuters, the fund has attracted roughly $69 billion in net inflows so far in 2026, following $118 billion in 2024 and $138 billion in 2025, with no other ETF attracting more investor money this year.
9. Experts generally still endorse the strategy despite the added concentration risk. Analysts writing for outlets including the Motley Fool and 24/7 Wall St. have said Buffett’s underlying advice remains sound in principle, since S&P 500 index funds continue to offer low costs and broad exposure to the U.S. economy. But those same analysts caution that investors should understand the fund no longer provides the same level of diversification it once did, given how heavily its performance now depends on a small group of dominant technology companies.
10. Buffett himself has continued monitoring risk within specific holdings tied to his broader philosophy. In more recent commentary, Buffett has reportedly cautioned about the risks tied to specific high-profile stocks, including SpaceX, following sharp declines in that company’s share price after its public listing, reflecting his continued attention to volatility and valuation risk even within widely held names.
Analysts broadly agree that Buffett’s core message, favoring low fees, broad diversification and long-term patience over active trading, remains valid advice for the average investor. But they emphasize that today’s S&P 500 looks meaningfully different from the one Buffett first pointed to in 2013, and that investors relying on the index for diversification should understand just how concentrated their exposure to a handful of technology giants has become, particularly if they are also invested in other tech-heavy benchmarks such as the Nasdaq Composite.

Boliden: Finding The Entry For 2026-2028

Farage turns down Rupert Lowe’s dodgy cooperation pact

Wild-card contenders Diamondbacks, Padres clash in desert

Kenny Barron Trio’s Brilliant 1995 Welsh Jazz Festival Performance Arrives on Elemental Music 2CD and 2LP Sets


-

 Business5 days ago
Why Trees Belong on the Risk Register
-

 Fashion3 days ago
Weekend Open Thread: Wit & Wisdom
-

 Politics3 days ago
Meta enters AI-training agreement with far-right ‘propaganda rag’ Newsmax
-
 Entertainment6 days ago
‘Stargate’ Creator’s New Sci-Fi Series Returns for Season 3 Tomorrow
-
 Crypto World2 days ago
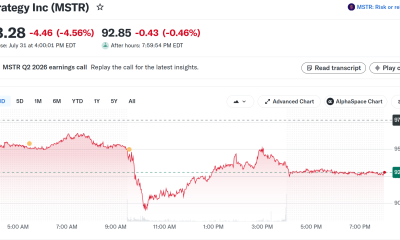
MicroStrategy Post-Earnings CLARITY Act Push Could Add New Catalyst for Its Stock
-

 Politics6 days ago
The Part of the Electric Transition Nobody Wants to Discuss
-

 Business5 days ago
Major shareholder moves on Canyon
-

 Crypto World2 days ago
XRP Ledger v3.3.0 brings five institutional features
-

 News Videos4 days ago
Bitcoin Enters the 3rd Stage of the Bear Market
-

 Crypto World6 days ago
Kraken Enables Retail Access to Jersey Mike’s IPO via Tokenized Shares
-

 Tech6 days ago
New macOS Sequoia & Sonoma security updates for older Macs
-

 Politics4 days ago
Luke Littler’s dominance sparks GOAT debate
-

 News Videos6 days ago
Claude: Build Financial Dashboards in Minutes (2026)
-

 Business6 days ago
Johnson & Johnson agrees to $5.5B settlement over talc cancer claims
-

 Sports4 days ago
Seema Kaliramna Wins Discus Throw Bronze, Takes India’s CWG Medals Tally To 17
-

 Crypto World1 day ago
Crypto PAC spending tops $2M in Michigan House race
-

 Business3 days ago
Trump Announces Hamas Disarmament Agreement as Iran Strikes Kuwait Air Base and US Attacks Pause Overnight
-

 Tech5 days ago
Gemini can now summarize the messiest comment threads in Google Docs
-

 Tech1 day ago
ESET tracks rise in malicious AI skills and adaptable malware
-

 NewsBeat4 days ago
Four people die trying to cross Channel in small boats
You must be logged in to post a comment Login