

Crypto World
15 Years Ago, Hal Finney Explained Why Bitcoin Could Not Simply Be Replaced


Fifteen years ago, one of Bitcoin’s earliest pioneers offered a warning that continues echoing through crypto markets.
Hal Finney argued that a monetary network cannot be rebooted without damaging the credibility of everything that follows.
The Debate Over a New Bitcoin
On May 30, 2011, Hal Finney and Jon Tobey entered a debate called “Early speculators’ reward.”
Basically, it was a discussion on Bitcointalk, where the OP raised a question that has followed Bitcoin since its very first days – was it fair that early adopters mined or acquired coins before most people knew the network existed?
Some participants argued that this early distribution amounted to a significant advantage – so large that the protocol itself should be relaunched. Finney rejected the premise with a response that was not just technical, but also rooted in economic logic.
“Any successful replacement of the Bitcoin block chain will forever undermine the credibility of any successor. […] How is an investor to know that it won’t happen again?”
The Problem of Credibility
Finney’s point seems simple now: if Bitcoin could be discarded because early users benefited, then any future replacement would inherit the same vulnerability, because there would be a new group of early adopters, a later group of users who resent them, and so forth – a vicious circle.
His argument also anticipated what later became a core principle of Bitcoin: monetary networks depend not only on code but also on confidence, continuity, and credible resistance to arbitrary change.
In simple words, Bitcoin’s staying power relies on itself – the Bitcoin staying power. The protocol has become so resistant to unnecessary change that it has brought forward a level of predictability that alternative economic systems cannot yet fathom.
The post 15 Years Ago, Hal Finney Explained Why Bitcoin Could Not Simply Be Replaced appeared first on CryptoPotato.


LUNC price forecast is getting more interesting amid stability in terms of technology and a number of developments within the ecosystem. Short-term dynamics are highly volatile, but market participants keep an eye on the possibility for upgrades and protocol launches to help form a rebound pattern.
Judging from the comments of the analyst terra_army on social media, LUNC is possibly reaching an important stage of its market cycle. The analysis of the weekly chart reveals a period of consolidation accompanied by a decrease in volatility and development of the price base.
Starting from 2022, the majority of the price moves of Terra Classic have occurred in a defined range without any breakdown during bearish trends. Support kept forming in the $0.00006-$0.00007 area, allowing for a long-term accumulation setup.
Technical Indicators Indicate Positive Change
There are a number of technical indicators that have started showing signs of improving conditions in higher time frames. Short-term moving averages have started to flatten out after a long period of decline, whereas momentum oscillators have moved from extremely bearish levels.
Furthermore, the Bollinger Bands, which had been quite tight for a longer duration, have started to widen. This usually indicates a return of volatility following a period of consolidation. It is being watched to see whether there will be any sign of strong directional movement. The overall technical picture remains positive despite a recent downtrend, and traders have their eyes set on a possible breakout in the coming days.
Short-Term Selling Pressure Is An Obstacle
Despite the positive long-term scenario, there was some short-term selling pressure seen in LUNC. The price was seen at $0.00006803 following a daily decline of over five percent. Market capitalization also decreased amid the session due to traders’ cautiousness.
From intraday charts, it could be observed that the asset formed a lower highs and lower lows formation. A couple of bounces were witnessed within the day as well; however, they all met selling pressure.
The drop was fueled further when support at $0.0000690 broke down, causing the asset to move towards $0.0000670 before it found a floor. Even though a slight bounce was seen, resistance zones still keep the upward momentum limited. There was also a decrease in trading activity, with daily volume declining over 20%.
Community Ecosystem Development Continues To Fuel Optimism
In addition to technical developments, developments in the ecosystem of Terra Classic continue to drive optimism among the members of the community. Among the highly anticipated events is the impending mainnet launch of the Juris Protocol, which could act as a catalyst for boosting network activity.
More efforts are being directed towards infrastructure improvements, including upgrades to the station platform in order to improve accessibility and user experience.
The Market Module 2 has also garnered a lot of attention in the community. It aims to link the various Terra Classic projects under one ecosystem while providing USTC staking abilities to the network.
On the other hand, the burning program of Binance is continuing to reduce the amount of supply in circulation. Investors have also cited increasing visibility from HTX and the likelihood of more exchanges joining in future burn programs.
The above developments by Terra Classic will see investors keep their eye on whether the growth of the ecosystem, supply reduction programs, and improved technical conditions can enhance the prospects of LUNC in the future.


Anthropic has reportedly finished training a more capable Mythos successor, according to AI watcher Andrew Curran. The company has not confirmed the model’s existence, name, or capabilities.
Curran said the system could ship as Mythos 5.1 or Mythos 6, or stay internal. His report came nine days after US export controls forced Anthropic to suspend Mythos 5 and Fable 5.
Mythos Successor Emerges from Training
Curran describes the supposed new system as stronger than Mythos 5. However, he stressed uncertainty over its name and whether Anthropic would release it at all.
“A new, more capable version of Mythos has emerged from training. I don’t know whether it will be called Mythos 5.1 or Mythos 6, or if Anthropic will keep it internal to accelerate further development…” Curran wrote.
Anthropic released Mythos 5 and Fable 5 on June 9 and lost them to the directive three days later. Several still expect an iterative upgrade, partly because the model suspension order limits today’s lineup.
Fable 5 ships with heavy safeguards for public use. Mythos 5 runs with fewer security restrictions through Project Glasswing, the firm’s vetted cybersecurity program.
Anthropic says about 50 partners have used early Mythos models to find more than 10,000 high- or critical-severity software flaws.
Why the Suspension Does Not Stop Development
Commerce Secretary Howard Lutnick sent the directive to Anthropic chief Dario Amodei on June 12, citing national security.
It barred every foreign national, including Anthropic’s own foreign-born staff, so the firm disabled both models worldwide.
The government flagged a method for bypassing Fable 5’s safeguards. Anthropic reviewed the demonstration, called it narrow, and warned the same standard would halt new model launches industrywide.
It is still working to reverse the export controls.
Subscribe to our YouTube channel to watch leaders and journalists provide expert insights
The order followed a reported Amazon warning to officials. Amazon has committed up to $25 billion to Anthropic.
Even so, it reportedly told the administration its researchers used Fable 5 to surface attack-ready information.
The clash later drew comments from Donald Trump and a public defense from Amodei.
Curran argued that halting deployment does little to slow progress and may even speed it up by freeing resources.
He pointed to open-weights rivals such as Z.ai’s GLM-5.2, which matches far larger closed models on coding tasks at a fraction of the cost.
The successor’s path stays uncertain. Anthropic shipping it publicly, restricting it to Glasswing, or keeping it internal could reshape the AI race.
The company continues to seek restored access for both suspended models and has not addressed latest developments publicly.
The post Anthropic Reportedly Finishes Training Successor to Suspended Mythos 5 Model appeared first on BeInCrypto.

TLDR:
- Bitcoin traders increasingly identify the $40K-$50K range as a preferred accumulation zone.
- Michaël van de Poppe warned that heavily crowded market expectations often fail to play out.
- Michael Saylor’s latest tracker post renewed attention on Strategy’s Bitcoin acquisition plans.
- Strategy reportedly holds 846,842 BTC, making it one of the largest corporate holders.
Bitcoin traders are increasingly focused on the possibility of a deeper market pullback, with many pointing to the $40,000 to $50,000 range as a preferred entry zone.
At the same time, fresh attention has turned to Strategy after Michael Saylor shared another update tied to the company’s Bitcoin holdings. The developments surfaced across crypto social media as investors weighed future market direction.
Together, they highlight the ongoing debate between waiting for lower prices and accumulating Bitcoin at current levels.
Bitcoin $40K-$50K Buy Zone Debate Gains Attention
Discussion around Bitcoin price expectations intensified after comments from crypto analyst Michaël van de Poppe circulated across social media. He argued that increasingly popular downside targets often fail to materialize once they become widely expected.
The $40,000-$50,000 range is an attractive area for traders to enter Bitcoin, according to Van de Poppe. He said that was similar to the times when investors were anticipating that Bitcoin would go back to $60,000, and it was trading at around $85,000.
The broader message centered on how crowded expectations can influence trader positioning.
Bitcoin’s recent market behavior has kept traders divided between waiting for a larger correction and maintaining exposure at current levels. The debate has become a recurring theme across crypto trading communities.
Social media discussions showed strong engagement around the proposed buy zone. The comments did not contain any predictions on prices, but they were about the psychology of the market.
A number of participants were interested in the possibility of widespread expectations lowering the chances of a substantial drop.
As market participants kept their eyes on macroeconomic trends and institutional movement, the conversation developed as they did. Bitcoin continues to be the biggest digital asset on the market by market cap and can influence the overall crypto trading market.
Michael Saylor Post Sparks Fresh Bitcoin Purchase Expectations
Attention also shifted to Strategy and its Bitcoin accumulation strategy. Michael Saylor posted a chart featuring the company’s Bitcoin tracker alongside the message that it looked better with more dots.
The post quickly attracted attention because similar tracker updates have often preceded announcements of new Bitcoin purchases. Crypto Patel highlighted the development while sharing updated figures related to Strategy’s holdings.
According to the data shared, Strategy currently holds approximately 846,842 Bitcoin. The position was reported to be worth roughly $54.3 billion based on current market values.
Crypto Patel stated that the company’s average acquisition price stands near $75,658 per Bitcoin. The reported total investment reached approximately $64.07 billion.
The figures indicate an unrealized loss of about $9.7 billion, or roughly 15%, based on the data provided. Despite that position, Strategy remains one of the largest corporate holders of Bitcoin globally.
The latest tracker update has renewed focus on the company’s accumulation strategy. Market participants now await any official disclosure regarding additional Bitcoin purchases.

Sumsub integrates Model Context Protocol to connect AI agents with compliance configuration
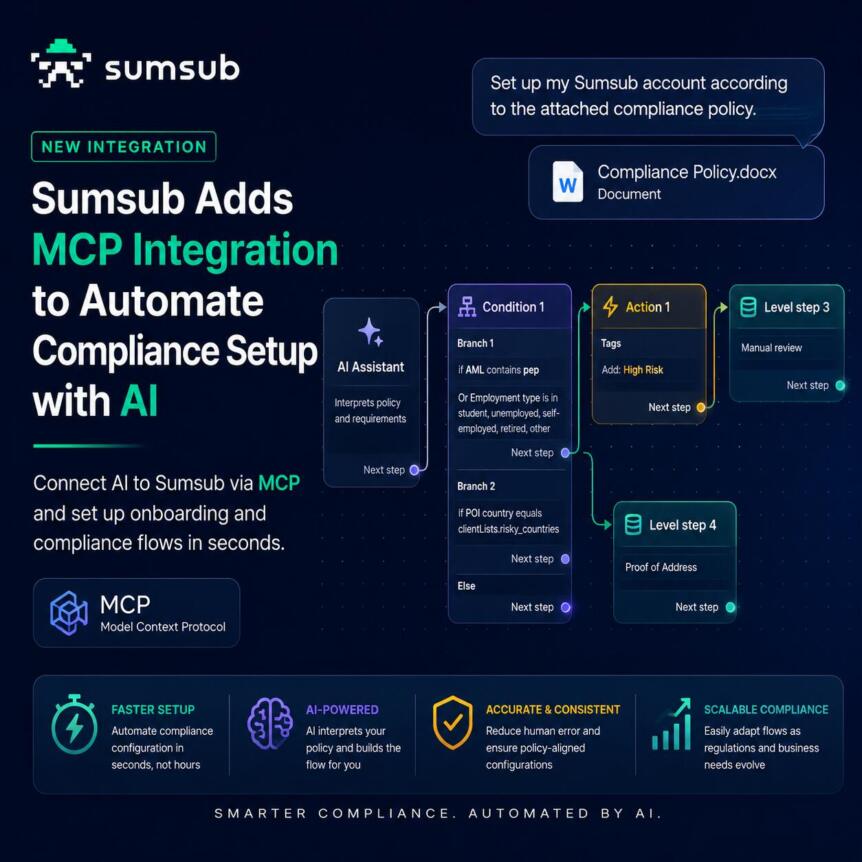
Sumsub, a verification and anti-fraud platform used by companies to support identity checks and compliance workflows, has launched a Model Context Protocol (MCP) integration and new AI agent skills. The announcement centers on a practical shift for regulated onboarding and fraud prevention teams, by allowing AI agents to help translate anti-money laundering (AML) policies and related compliance documents into configuration changes inside Sumsub.
In many compliance stacks, the work does not end at document review. Teams still need to configure verification levels, risk questionnaires, and onboarding or applicant routing workflows for each jurisdiction and product. Sumsub’s stated goal is to move part of that configuration effort from manual interpretation to a more automated “policy-to-setup” process, mediated by AI agents.
What the MCP integration changes
Model Context Protocol is designed to standardize how AI tools connect to external systems. According to Sumsub, its MCP integration is model-agnostic, intended to work with leading AI agents including ChatGPT and Claude. That is notable because compliance use cases often require consistent auditability and controlled access, even when the AI model behind the assistant varies.
From policy documents to live workflow settings
Sumsub says teams can upload AML policies or other compliance requirements and have an AI agent build a corresponding Sumsub environment. The configuration described includes verification levels, risk questionnaires, and onboarding workflows that can reflect jurisdiction-specific risk logic. Sumsub frames the change as reducing configuration timelines from days to minutes, though the company does not provide independent benchmarks in the material shared.
Handling operational tasks through agent skills
The launch also includes agent capabilities intended to support day-to-day compliance work. Sumsub lists use cases such as reviewing applicants, running analytics, generating verification links, and responding to regulatory changes. In practice, this approach positions AI agents not only as assistants for drafting or analysis, but as tools that can execute operational steps inside a compliance platform, subject to permissions.
Why this matters for identity verification and AML operations
Identity verification and AML compliance have become key layers of customer onboarding, especially in digital-first industries such as financial services, crypto platforms, and other regulated online businesses. Even when organizations have policy documents and internal compliance guidance, there is often a gap between text-based requirements and the configuration logic used by verification vendors.
That gap tends to create manual bottlenecks. Solution architects or compliance operations teams may need to interpret policy text, translate requirements into platform settings, and then rebuild or adjust workflows when regulations or internal risk tolerances change. If the “translation” step can be accelerated safely, it could reduce cycle time for onboarding updates and help teams respond faster to evolving compliance requirements.
At the same time, automating compliance configuration introduces governance questions. AML controls are not simply workflow automation, they are risk controls that must be aligned with regulations, internal policy, and operational evidence. Sumsub’s approach, as described in the announcement, emphasizes controlled execution rather than fully autonomous configuration.
Permissioning, sandboxing, and human approval
Sumsub says access to the MCP integration is restricted by separate permissions to allow granular control over what an AI agent can do. The company also states that sensitive actions are performed in isolated sandbox environments, and that configuration changes are reviewed and approved by humans.
This matters because agentic systems can increase throughput but also expand the potential surface area for mistakes. For compliance workflows, oversight and traceability are typically non-negotiable, particularly when configurations affect verification requirements, risk scoring, or customer onboarding outcomes.
Developer availability and integration pathway
Sumsub indicates the MCP integration is supported via an open-source set of agent skills published on GitHub, installable with a single terminal command. Documentation for the MCP server and for building with Sumsub’s AI features is described as publicly available via Sumsub’s developer resources.
Additionally, Sumsub says it is now officially listed on the ChatGPT Apps platform, and that discussions are ongoing with additional large language model providers. The practical implication is that teams building compliance or onboarding workflows may be able to access the integration through AI application ecosystems, rather than implementing everything from scratch.
Industry context: agentic AI meets regulated workflows
The compliance and identity verification market has been experimenting with AI for multiple years, including document analysis, fraud signals, and investigative assistance. However, the latest push in the industry is moving toward “agentic” workflows, where AI systems can take structured actions in software tools, not just generate text or summaries.
Agentic compliance workflows are attractive because they promise to reduce operational friction, particularly for tasks like policy interpretation and workflow setup. But adoption tends to depend on how well vendors manage governance, permissioning, and audit trails, as well as how reliably they can map policy language to operational controls.
Sumsub’s announcement suggests the company is targeting the configuration layer, positioning MCP integration as a way to standardize how AI agents interact with compliance platforms while keeping human review in the loop.
What to watch next
For teams evaluating this type of capability, several practical questions often determine whether it can move from pilots to production: how permissions are scoped across roles, what evidence is stored for configuration approvals, and how quickly organizations can validate that AI-generated setups match their compliance requirements.
Sumsub says the integration is available now, with additional documentation and agent skills provided for developers. The next phase will likely involve how quickly existing compliance operations teams can test policy-to-configuration accuracy and integrate the workflow into their onboarding processes without adding new governance overhead.
After Bitcoin’s decisive breakdown from a multi-month rising channel, the largest crypto is still under immense pressure. While buyers managed to defend the $60K support region and trigger a short-term rebound, the broader structure still favors the sellers unless BTC can reclaim several important resistance levels overhead.
Bitcoin Price Analysis: The Daily Chart
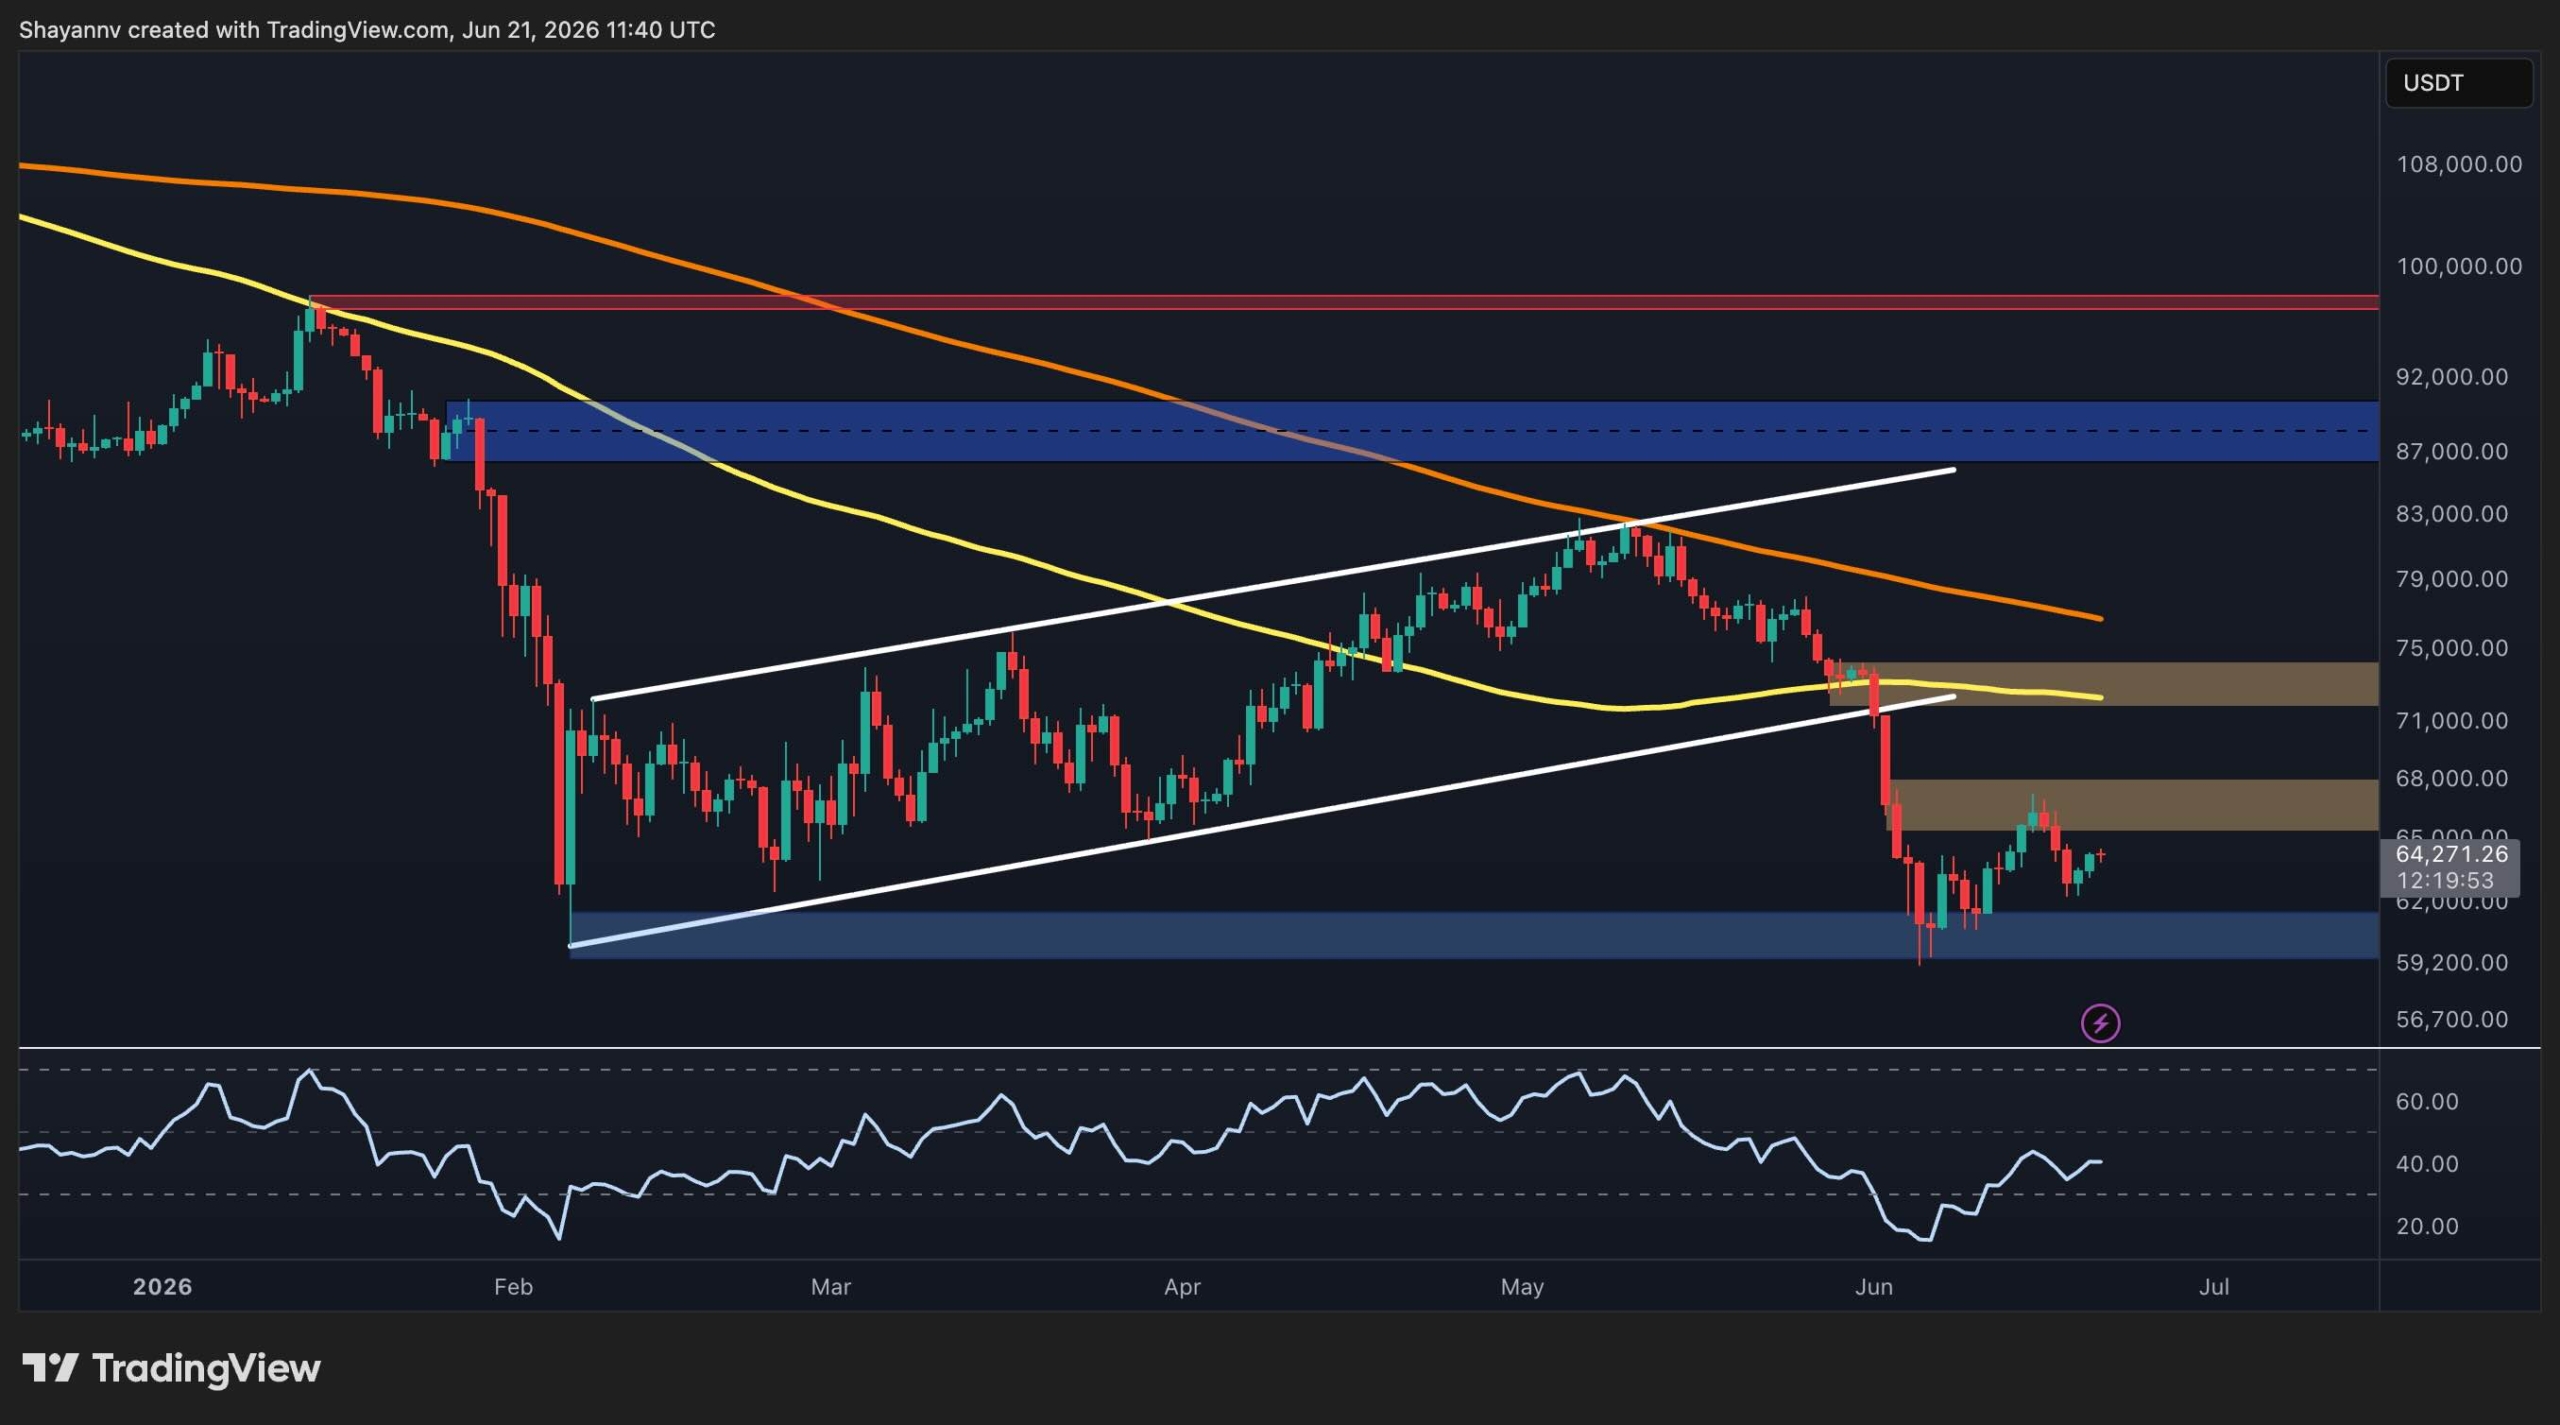
On the daily timeframe, BTC recently confirmed a bearish breakdown below a large ascending channel, accelerating selling pressure and pushing the asset toward the major support zone around $60K, where buyers stepped in and halted the downtrend.
The selloff also drove Bitcoin well below both the 100-day and 200-day moving averages. These MAs are currently positioned around $72K and $76K, respectively. The loss of the 100-day moving average, which was supposed to act as a dynamic support level, signals a significant deterioration in the broader market structure and suggests that sellers continue to control the trend.
Following the sharp decline, BTC found demand near $60K and staged a modest recovery toward the $64K region. However, the rebound remains relatively weak compared to the magnitude of the preceding drop.
The first major resistance now sits between $65K and $68K, where a previous support area has turned into supply. Above that, the more critical resistance zone is located around $72K to $75K, which coincides with the 100-day moving average and the lower boundary of the broken ascending channel. A successful reclaim of this area would be the first indication that the recent breakdown may have been a bear trap.
On the downside, the $60K region remains the most important support level. Losing this zone could expose Bitcoin to a deeper correction toward lower liquidity clusters and potentially trigger another wave of capitulation.
BTC/USDT 4-Hour Chart
The 4-hour timeframe provides a clearer view of the recent breakdown and subsequent consolidation phase. After losing the $72K to $74K support zone, BTC experienced an aggressive selloff toward the $60K demand area. Since then, the price has formed a short-term ascending channel, indicating a corrective recovery rather than a confirmed trend reversal.
However, the recent rejection from the upper boundary of this channel and the subsequent breakdown suggest that bullish momentum remains limited. Although BTC managed to stabilize and reclaim the mid-$64K area, it continues to trade beneath the key resistance block between $65K and $68K.
As long as the price remains below this supply zone, the current rebound appears corrective in nature. A successful breakout above $68K could open the door for a move toward the larger resistance cluster at $72K to $74K. Conversely, another rejection from current levels would increase the probability of a retest of the $60K support zone.
The RSI on the 4-hour chart has recovered into neutral territory, reflecting improving short-term momentum. However, it has not yet entered strongly bullish conditions, which supports the view that the ongoing move remains a relief rally within a broader bearish structure.

Sentiment Analysis
The funding rate chart offers an important insight into current derivatives positioning. Funding rates remained predominantly negative throughout much of the recent decline, indicating that short positions dominated the market during the selloff. This persistent negative funding reflected bearish sentiment and aggressive short exposure as BTC traded lower.
More recently, funding rates have shifted back into positive territory, currently hovering around 0.004. This transition suggests that market participants are gradually rebuilding long exposure following the bounce from the $60K support area.
From a contrarian perspective, the normalization of funding after an extended period of negative readings can be viewed as a constructive development. The market has already undergone a substantial deleveraging event, and the recovery in funding suggests improving confidence among futures traders.
However, the current funding levels remain far below the overheated conditions seen during previous bullish phases. This indicates that while sentiment is improving, leverage remains relatively contained and does not yet confirm the beginning of a sustained uptrend.
Overall, the derivatives data suggest that bearish pressure has eased following the recent liquidation event, but Bitcoin still needs to reclaim the $68K and $72K-$74K resistance zones before a broader bullish recovery can be confirmed. Until then, the rebound from $60K appears more consistent with a relief rally within a weakened market structure.

The post Bitcoin Price Analysis: Here’s BTC’s Most Likely Path This Week appeared first on CryptoPotato.
TLDR:
- The Humanity Protocol exploiter converted part of the stolen assets into USDC before exchange deposits.
- Blockchain data shows funds moved through multiple wallets, exchanges, and stablecoin conversions.
- Investigators linked the $36 million breach to malware delivered through a phishing email attack.
- The attacker gained admin access, moved 141 million H tokens, and minted additional assets.
The perpetrator of the Humanity Protocol exploit has started transferring some of the funds in the victim’s wallet around the crypto industry. The blockchain data indicates that some assets were converted to stablecoins before being sent to KuCoin.
The transactions come weeks after a major security breach that compromised administrative controls and led to significant token losses. Recent on-chain activity provides new insight into how the attacker is handling the stolen assets.
Humanity Protocol Exploiter Moves Crypto Through USDC and KuCoin
Lookonchain’s blockchain analytics service said wallets used by the Humanity Protocol exploiter recently switched a portion of the funds they had stolen into USDC. These money was then moved to KuCoin via public blockchain records.
The tracking data shows that the attacker had distributed assets in multiple wallets before transferring such. There were several ETH transactions that ranged from 10 ETHs to 50 ETHs in the transfers.
There was also a bigger move of around 500 ETH that has been seen in the wallet transfers.The transfers followed a pattern commonly observed after major crypto exploits.
Lookonchain noted that the exploiter conducted several token swaps before sending funds to the exchange. The transactions included conversions into USDC and USDT.
The movement of funds extended beyond direct wallet transfers. On-chain records showed activity involving decentralized exchanges such as Uniswap and PancakeSwap.
Those platforms allowed the attacker to exchange assets while retaining control of the funds. Routing transactions through multiple addresses also made blockchain tracking more complex.
The latest transactions indicate that at least part of the stolen crypto has entered a more liquid form. Stablecoin conversions often play a key role in post-exploit fund movements.
Humanity Protocol Breach Traced to Phishing Attack
The Humanity Protocol exploit occurred on June 8. Reports indicate that a project director received a phishing email disguised as a message from a major South Korean crypto exchange.
The email contained a malicious attachment that installed malware on the recipient’s device. The software enabled the attacker to gain remote access and obtain sensitive credentials.
According to information surrounding the incident, the attacker extracted private keys and wallet data. That access opened a path to critical administrative accounts connected to Humanity Protocol.
After gaining control, the attacker upgraded smart contracts on Ethereum and moved approximately 141 million H tokens. The compromise also extended to a ProxyAdmin contract on BNB Smart Chain.
Control of that contract enabled unauthorized minting of additional H tokens. The newly created and stolen tokens were later sold through decentralized exchanges.
The selling activity increased pressure on the token market following the breach. Humanity Protocol subsequently froze its Ethereum contract and secured remaining assets through an unaffected multisignature wallet.
Recovery efforts remain focused on affected users and ecosystem participants. The BNB Smart Chain deployment continues to face challenges linked to the exploit.
Despite crypto’s volatility, XRP is still viewed by some investors as a long-term asset that could help them retire or protect their capital from inflation and currency devaluation.
But is there any math behind that argument? Some analysts have projected paths to $1 million by 2035, while others warn that XRP still faces extreme volatility and questions over its DeFi and institutional utility.

How Much XRP Would It Take to Retire by 2035?
XRP is the native token of the Ripple network, designed for fast, low-cost international transactions. Supporters highlight real-world adoption by financial institutions and positioning within ISO 20022 messaging standards, making it one of the few crypto assets directly tied to traditional banking infrastructure currently in use.
Follow us on X to get the latest news as it happens.
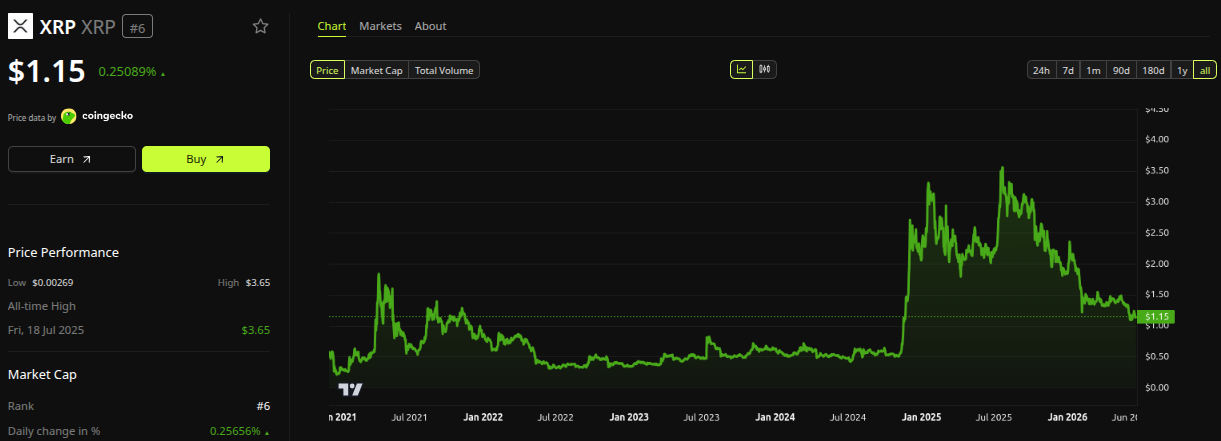
The retirement math depends entirely on the price scenario the investor assumes for the next decade. Some long-term prediction models describe paths to a $1 million portfolio by 2035 under three sets of price assumptions. The token currently trades near $1.34, and projections vary widely among analysts and time horizons.
The conservative scenario assumes XRP reaching around $3.13 by 2035. Under this projection, an investor would need approximately 319,000 tokens to hit the $1 million target.
The equivalent investment today would be around $428,000 in XRP, accumulated through purchases over time at current prices.

A more bullish range of $9 to $10 per XRP changes the math dramatically. Investors would need only between 100,000 and 105,000 tokens to reach the same target by 2035.
The required upfront capital drops significantly because each token contributes more to the final portfolio value.
The most aggressive scenario considers XRP reaching $20 to $40 per token. Under these assumptions, just 25,000 XRP (currently valued at around $33,000) could grow into a retirement nest egg.
The asymmetric upside is what attracts speculative investors to the token despite mainstream advisor warnings.
“You understand Bitcoin’s scarcity and have watched it become the best performing asset of the last 15 years. You understand XRP’s utility and why many believe it could become significantly more valuable if adoption continues to grow. The question is, does your retirement account reflect that conviction?,” Bri Teresi said on X.
Why Mainstream Analysts Warn Against XRP as a Core Holding
Mainstream financial voices urge caution about treating XRP as a primary retirement vehicle. Motley Fool analysts note that the token has experienced multiple drawdowns greater than 50% throughout its trading history. For investors nearing retirement, this volatility could permanently impair capital just when liquidity matters most.
The recommended exposure level is significantly lower than what enthusiastic community members suggest. Most professional advisors recommend limiting any kind of crypto allocation to 5%-10% of a diversified portfolio.
The core holdings should remain in index funds, bonds, and other lower-volatility instruments designed for steady long-term compounding.
Read more: Retiring With Bitcoin by 2030: Hoax or Real Financial Strategy?
The risk profile suits investors with long time horizons and a high tolerance for swings. Younger savers with 20 or 30 years until retirement can withstand major drawdowns without compromising their financial future.
Older investors with less than a decade left should treat XRP as a small satellite position only.
Executive actions that open 401(k) plans to alternative assets create new pathways for crypto in retirement accounts in 2026. The shift could legitimize XRP exposure within traditional retirement vehicles, but does not eliminate the underlying volatility risk for individual portfolios.
What Could Go Wrong: The Risks XRP Community Must Accept
Beyond price volatility, treating XRP as a retirement asset requires honest acknowledgment of structural risks. Investors who entered at previous peaks waited years before recovering principal, a timeline incompatible with anyone needing liquidity within the next decade.
Regulatory uncertainty persists despite recent clarity milestones in the United States. Future administrations could reverse current frameworks, or new global treaties could restrict cross-border crypto flows.
Stablecoins backed by major institutions and emerging central bank digital currencies (CBDCs) also compete directly for the same payment use cases that justify the bull case.
Custody adds another layer of risk, often underestimated by new investors. Exchange hacks have wiped out years of accumulated savings overnight throughout crypto history.
Self-custody via hardware wallets is essential but introduces operational complexity that retirees particularly need to master before committing significant capital.
Subscribe to our YouTube channel to watch leaders and journalists provide expert insights.
The post The Great XRP Retirement: Testing the Math Behind the Hoax appeared first on BeInCrypto.
Crypto World
Bitcoin and Oil Markets Brace for Possible Black Monday After US-Iran Talks Fracture in Switzerland
Crypto and energy markets are bracing for a possible Black Monday selloff. US-Iran negotiations in Switzerland collapsed over the weekend, reviving fears of an oil shock and a risk-off move into Monday.
Iran’s delegation walked out of the talks in protest over fresh threats from President Donald Trump. Based on this, analysts and traders alike anticipate stocks and crypto could open sharply lower.
Switzerland Walkout Revives Oil and Hormuz Fears
The breakdown came at the Bürgenstock resort in Switzerland. The US, Iran, Pakistan, and Qatar had met there to extend a June 17 truce.
Iran’s team refused a group photo and walked out, state media reported.
Trump had warned he would strike Iran again over its proxies in Lebanon. He also told Iranian officials they would not make it home if Tehran closed the Strait of Hormuz.
That threat carries weight because of the cargo. About 20 million barrels of oil cross the strait each day, near 20% of global consumption, the EIA reports.
Still, the waterway has stayed open through past standoffs. Iran threatened closures in 2011 and 2019 but never followed through.
Brent crude had eased to near $80 a barrel last week as crude oil slipped below the same threshold when tankers resumed transit. However, the walkout now clouds that fragile recovery.
When Trump declared a ceasefire earlier this month, stocks and oil reacted while crypto barely moved.
Bitcoin Holds Steady as Black Monday Calls Spread
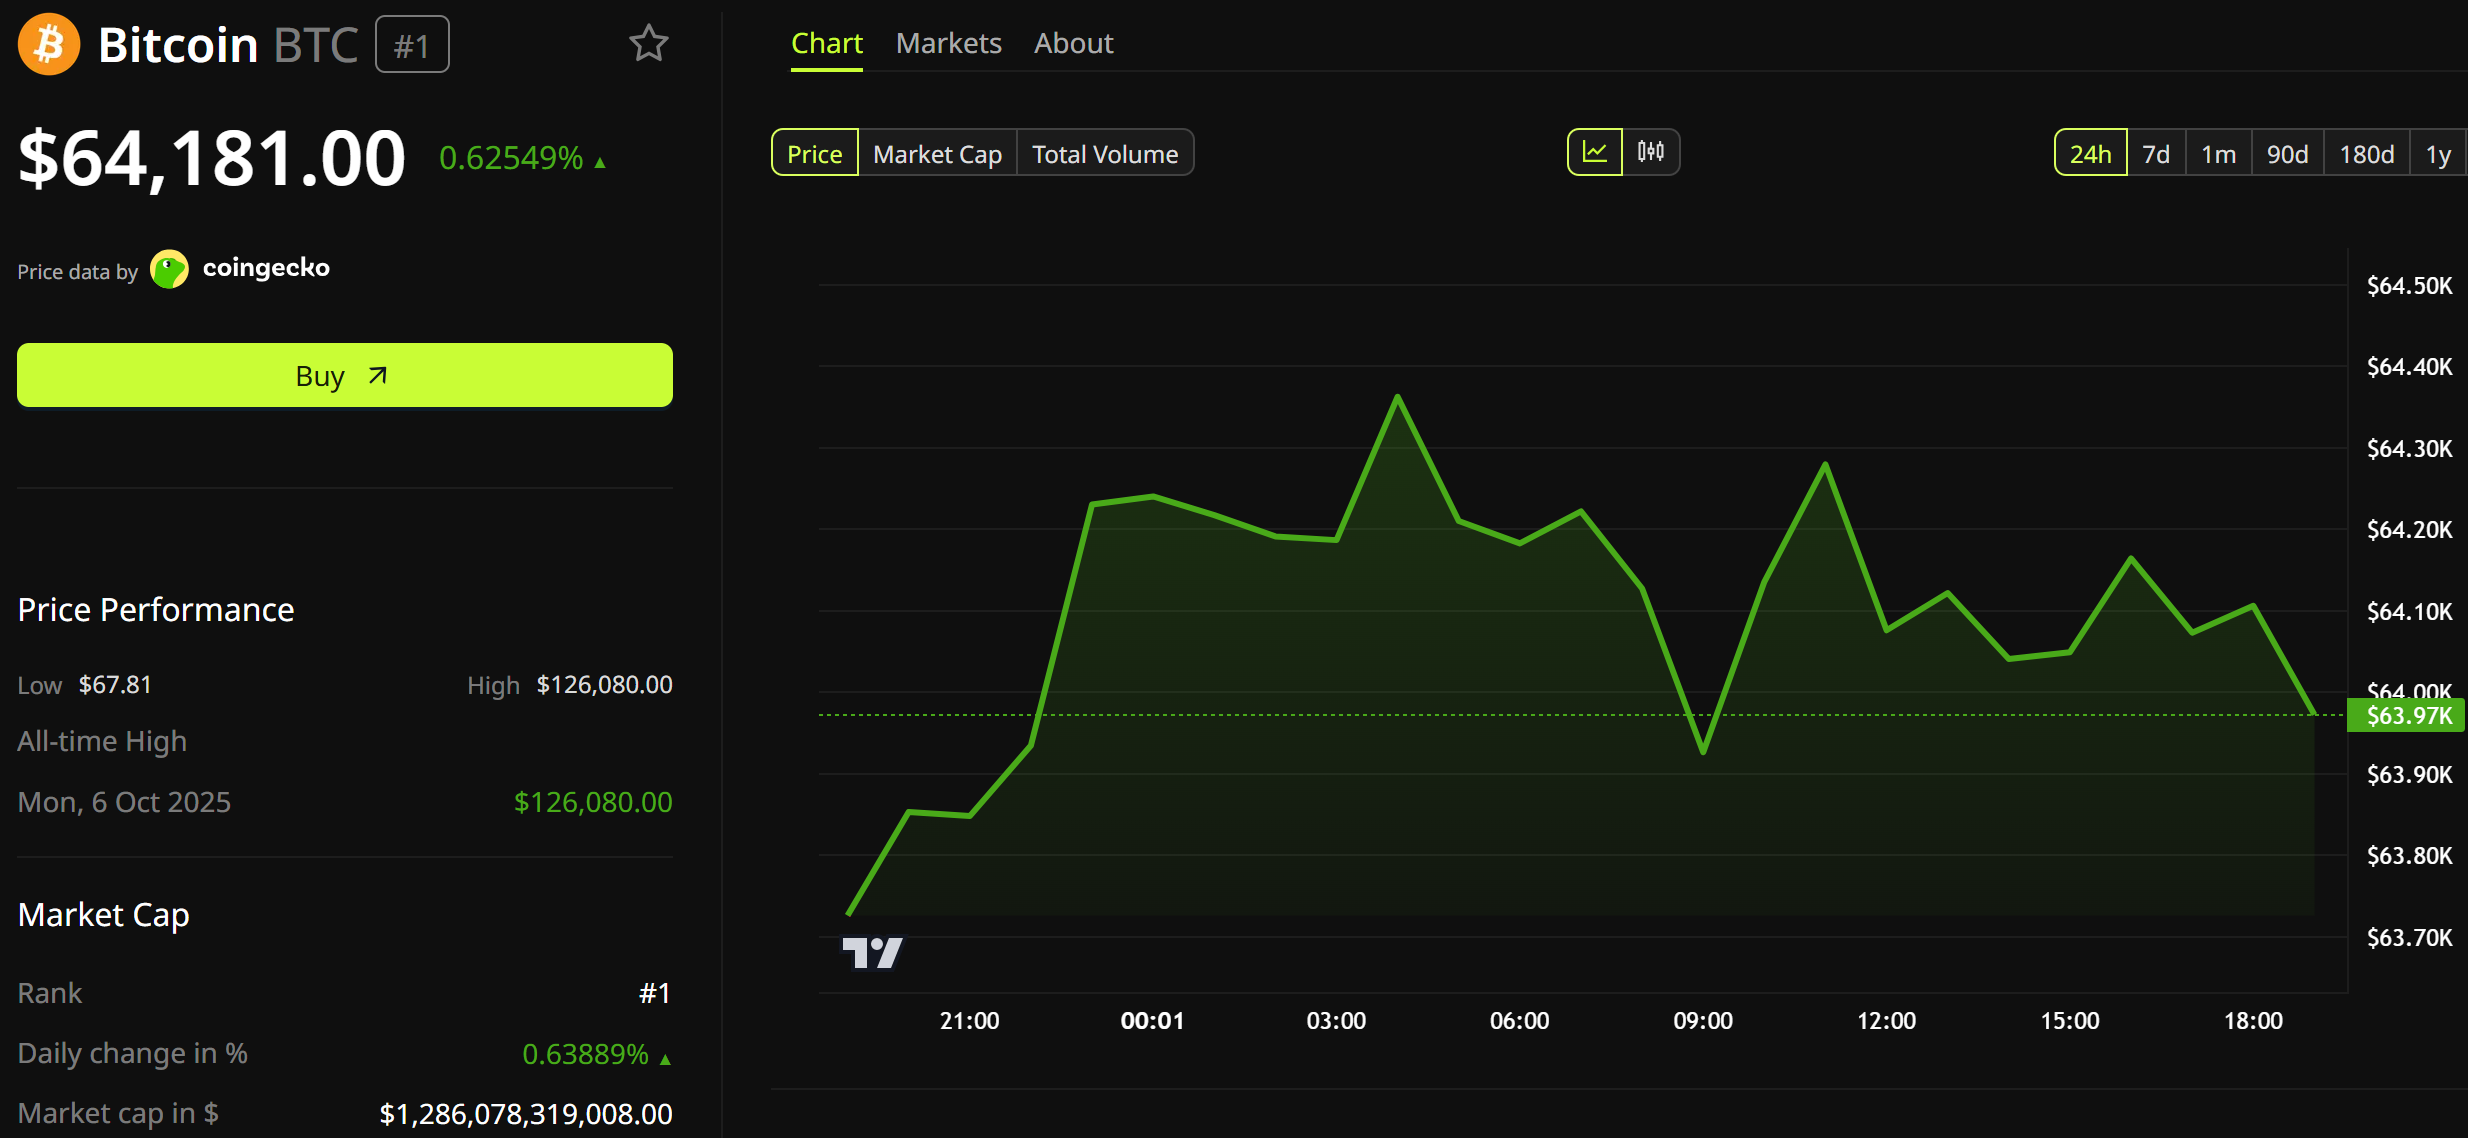
So far, crypto has not played along. The Bitcoin (BTC) spot price held near $64,181 on Sunday, a touch higher on the day.

Ethereum (ETH) traded near $1,730. Because crypto runs around the clock, that weekend calm is a live signal, not a closed-market guess.
Crypto also has no brakes. US stocks halt automatically if the S&P 500 falls 7%, 13%, or 20% in a day. Those safeguards were built for exactly this kind of panic.
Crypto carries no such circuit breakers. A Monday slide there would run without a pause. Still, weekend sentiment soured.
“If there isn’t a massive Black Monday Crash tomorrow, I will delete my account,” one user remarked.
The phrase he borrowed carries history. On Black Monday in 1987, the Dow fell 22.6% in one session, still its worst day on record.
However, markets clawed back most of those losses within months.
Trader Ted Pillows made a similar case, calling the risk and reward of buying stocks now poor.
Even so, similar weekend warnings have misfired before, and this one could too, with Qatar and Pakistan are still mediating, and both sides have reasons to step back.
The risk is not hypothetical. Bitcoin has repeatedly sold off with risk assets rather than acting as a haven.
When Israel struck Iran this month, more than $1 billion in leveraged crypto bets were wiped out in a day. Analysts have since mapped a sharp Bitcoin drop if the war reignites.
Monday’s futures open will be the first real test. A return to fighting could trigger a broad risk-off move across crypto.
A quick path back to talks could calm nerves just as fast. For now, traders are watching oil, the strait, and the next signal from Tehran or Washington.
The post Bitcoin and Oil Markets Brace for Possible Black Monday After US-Iran Talks Fracture in Switzerland appeared first on BeInCrypto.


Charles Hoskinson is making a stronger case for artificial intelligence as work on Midnight City progresses. The Cardano founder now treats agents as the backbone of how the network communicates and scales.
Below is a breakdown of his recent remarks, plus a closer look at what Midnight City is actually trying to prove.
How Hoskinson Frames AI’s Role in Cardano’s Next Phase
AI agents act autonomously, trading, posting, and coordinating without a human behind the keyboard. Hoskinson is leaning into that definition after fielding pushback over recent experiments tied to Cardano’s official channels.
The complaints centered on a synthetic influencer that surfaced on the Input Output account. Followers were not impressed.
However, Hoskinson defended the move as a transparent trial-and-error, arguing that the team is showing what these tools can do rather than hiding behind polished output.
He also pointed to OpenClaw, an open-source agent project he sees gaining traction at a remarkable speed. For Hoskinson, that growth is a signal. The future of crypto communication will not be carried by a handful of community managers tweeting in real time.
“We’re going to need agents and AI to be able to organize and sort all that out and broadcast on a regular basis what’s going on in Midnight City,” Hoskinson said. As a result, AI is now treated as core infrastructure for the entire Cardano ecosystem.
Follow us on X to get the latest news as it happens.
His reasoning is structural. A blockchain community that grows from thousands to millions cannot be supported by linear hiring. As a result, automation has to take over the routine layer of reporting, moderation, and outreach across every channel that matters.
Hoskinson sketched out what comes next in stronger terms. He talked about AI chief marketing officers, broadcasting tools that feel lifelike, and a long bet on integrating every emerging standard. The shift, in his view, will redefine how protocols introduce themselves to new users.
Why Midnight City Is Becoming the Showcase for That Vision
Midnight City is a live demonstration of what Hoskinson describes. Running on the Midnight Network, it is a digital environment populated by autonomous characters that transact, talk, and behave according to the memory and personality assigned to each.
Visitors can switch the lens they look through. The default view shows only what is committed openly to the chain. An auditor’s view, by contrast, reveals selective information to anyone with the right cryptographic clearance, mirroring how compliance might work in practice.
A third layer, sometimes called God mode, lifts the curtain on each agent’s internal state. Users can see goals, memory, and history that would normally stay private. The point is to teach observers how selective disclosure actually behaves, not just describe it in a white paper.
“It’s why it’s one of our most important projects and we’re leaning into it and integrating every single AI standard,” Hoskinson said. The Cardano founder added that the team will keep experimenting with how the technology evolves across the coming quarters.
The infrastructure underneath is built for volume. Shielded transactions are first wrapped in zero-knowledge proofs. Furthermore, batches are run in Trusted Execution Environments before being anchored back to the base layer via cryptographic checks.
Hoskinson sees real growth potential beyond the demo. Agentic trading and affiliate-style relationships, he argues, could pull millions of fresh users into Midnight as the simulation evolves. That is why he describes the project as one of the most important on Cardano’s plate.
The wider context also explains the urgency. Crypto is moving on two fronts at once: privacy-preserving computation and the rise of on-chain agents that coordinate economic activity.
Subscribe to our YouTube channel to watch leaders and journalists provide expert insights.
The post Cardano’s Hoskinson Bets Big on AI as Midnight City Development Pushes Forward appeared first on BeInCrypto.
TLDR:
- A ¥21.3 billion Japanese pension fund plans its first crypto allocation during fiscal year 2026.
- The fund spent nearly six years researching digital assets before approving the investment.
- Portfolio changes will reduce yen exposure while adding crypto, gold, and global currencies.
- Japanese institutions continue exploring crypto products amid evolving regulatory discussions.
A Japanese pension fund is preparing to enter the cryptocurrency market through a dedicated portfolio allocation in fiscal year 2026. The move marks one of the first known crypto investments by a pension fund in the country.
The decision follows several years of internal research and a broader review of diversification strategies. It also arrives as Japan’s financial sector explores new digital asset products and regulatory changes.
Japanese Pension Fund Adopts Crypto Allocation Strategy
The Nationwide Business Corporate Pension Fund plans to allocate approximately 1% of its assets to cryptocurrency next year. According to reports from Nikkei, the fund manages roughly ¥21.3 billion, equivalent to about $130 million.
The pension fund serves around 1,200 small and medium-sized businesses across Japan. Rather than purchasing individual digital assets directly, it intends to invest through a passive fund managed by a large hedge fund.
The selected investment vehicle holds multiple cryptocurrencies. The approach allows exposure to the broader crypto market rather than relying on a single asset.
Diversification sits at the center of the strategy. Information shared by Sui Intern and details reported by Japanese media indicate the fund aims to reduce its dependence on traditional currency exposure.
Currently, around 80% of assets are linked to the Japanese yen. Another 15% is tied to the U.S. dollar, while the remaining 5% covers other currencies.
Beginning in fiscal 2026, the fund plans to reduce yen exposure to 70%. It will also introduce allocations to developed market currencies, emerging market currencies, gold, and cryptocurrencies.
According to fund executive director Ayumi Kiguchi, the organization views digital assets as a potential diversification tool due to their lower correlation with some traditional currency holdings.
Crypto Adoption Gains Ground Across Japan’s Financial Sector
The decision follows nearly six years of research into cryptocurrency markets. During that period, the fund monitored industry development, investor participation, and market maturity before proceeding.
Pension fund involvement in crypto remains uncommon in Japan. While some institutions have explored the sector, direct allocations have remained limited.
The fund is also studying additional crypto-related opportunities. Reports indicate it is examining arbitrage-focused investment strategies that seek to capitalize on price differences across digital assets.
Broader industry developments are unfolding at the same time. Japanese regulators continue reviewing rules that could expand access to crypto investment products.
The Osaka Exchange is reportedly considering the introduction of Bitcoin futures contracts in 2028. Exchange officials have linked those discussions to future regulatory developments.
Major securities firms are also evaluating crypto-related offerings. Reports have named SBI Securities and Rakuten Securities among companies considering new digital asset products.
Other financial institutions, including Nomura Securities and Daiwa Securities, are also reviewing future opportunities tied to cryptocurrency markets. These developments coincide with a gradual increase in institutional participation across Japan’s digital asset sector.

Self-powering shaking capsule shows the future of safe drinking water in the palm of our hands

Woman, 45, ‘given weeks to live’ after contracting flu on dream holiday in Turkey

Celebrity Chef Gordon Ramsay’s Family Guide Includes 6 Kids


-
Crypto World7 days ago
Zimbabwe Requires Crypto Businesses to Register Annually Under New FIU Regulations
-

 Fashion2 days ago
Weekend Open Thread: Miami – Corporette.com
-
 Crypto World7 days ago
Crude Oil Plunges Over 4% as US-Iran Agreement Reopens Hormuz Strait
-
 Business2 days ago
Wall Street Week Ahead: Investors see Micron earnings as pulse check of AI rally momentum
-
 Crypto World2 days ago
HIVE shares jump as $220M AI deal speeds Bitcoin mining pivot
-

 Tech7 days ago
Over 400 Arch Linux packages compromised to push rootkit, infostealer
-
 Tech5 days ago
The Adder At The Heart Of Intel’s 8087 FPU
-
 Tech7 days ago
Microsoft Updates Six Windows’ Apps. ‘Photos’ Gets Watermarks for Copilot Images (Off by Default)
-

 Sports3 days ago
FIFA World Cup 2026: Canada beat 9-men Qatar 6-0 to register first ever win | FIFA World Cup 2026
-

 Business24 hours ago
Soccer-U.S. defends Iran World Cup travel restrictions, says discussions ongoing
-

 Tech7 days ago
Etzioni on AI: Backlash against AI-generated text mirrors the anti-GMO movement
-

 Tech7 days ago
Today’s NYT Connections Hints, Answers for June 15 #1100
-
 Tech7 days ago
Chinese AI models are learning to detect safety tests and adjust their behaviour accordingly
-

 Business3 days ago
Brexit cost 6% of UK economy, Bank of England company data suggests
-

 Crypto World1 day ago
Jake Chervinsky accuses CME of protecting derivatives monopoly
-

 Tech4 days ago
Weeks Of In-The-Field Testing And A Verdict
-

 Crypto World4 days ago
Anthropic’s Dario Amodei Urged AI Unity at G7, Even as US Banned His Models
-

 Tech3 days ago
Adobe adds its AI assistant to Premiere, Illustrator and InDesign
-

 Entertainment24 hours ago
Renter of Home in Anne Heche Crash Denies Settlement With Son
-
Crypto World7 days ago
Ethereum Users Can Now Add Quantum-Resistant Account Protection for Just $0.07, Researchers Say
You must be logged in to post a comment Login