
Crypto World
$1M Loss as Trader Approves Phishing Token After Wallet Signature

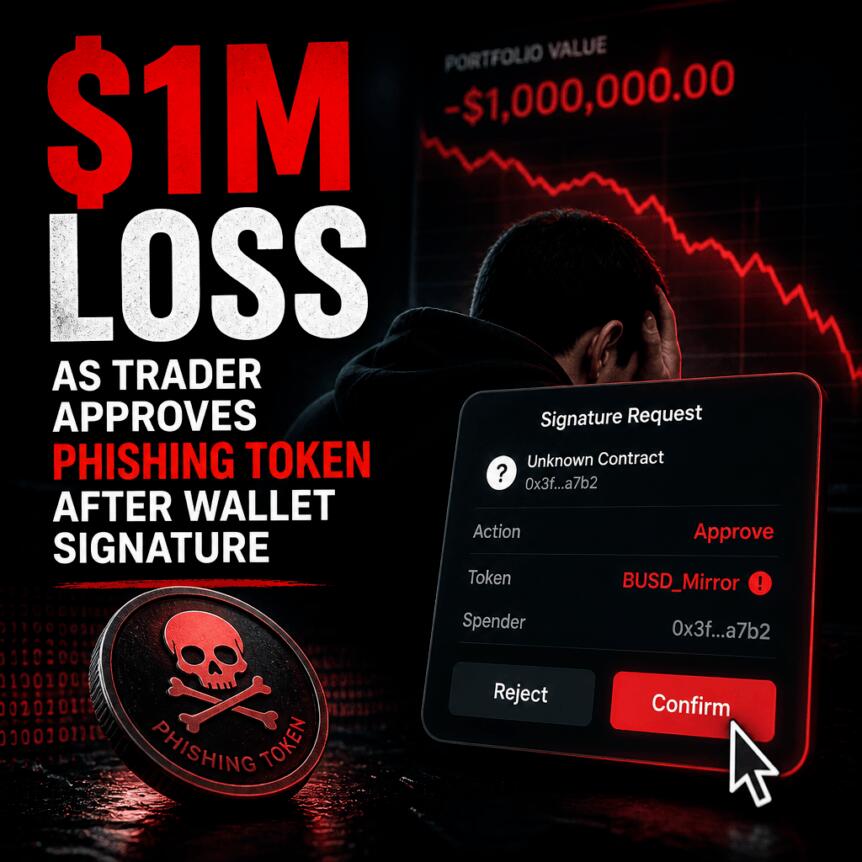
A crypto user lost nearly $1 million after approving a malicious token permission on Ethereum, according to onchain tracking shared by Scam Sniffer. The incident highlights how phishing “token approvals” continue to evolve from one-off scams into repeatable theft workflows.
Scam Sniffer reported that the victim’s loss was 999,999 USDT (USDT) linked to an Ethereum phishing approval. The attacker first attempted to drain funds through multicall requests but failed due to insufficient balance, then immediately succeeded seconds later by executing follow-up transfers that removed the remaining funds.
Key takeaways
- A single “approve” on an Ethereum token can grant an attacker sweeping power, allowing losses to be extracted quickly via automated transfers.
- Scam Sniffer’s report describes multi-step draining: an initial multicall attempt may fail, but subsequent transactions can still empty the wallet.
- Approval-phishing remains a widely used tactic within broader onchain scam ecosystems, including investment fraud.
- Researchers warn that scammers often reuse the same wallet patterns—meaning one uncovered incident can reveal a broader network of activity.
- Address poisoning still compounds the risk, and users should treat copied addresses and pasted contract or wallet data with extra caution.
A nearly $1 million theft triggered by a token approval
The phishing mechanism centers on token approvals that appear routine. In these scams, victims are tricked into signing a transaction that grants a malicious actor permission to spend tokens or route funds from the wallet. The approval itself may be presented as a small step—such as enabling a transfer, interaction, or “verification”—but it can instead grant broad or lasting access that the attacker immediately exploits.
In the reported case, Scam Sniffer said the script recalculated the victim’s remaining balance and then pulled the exact amount left after the first drain attempt. That meant the attacker did not need to guess the wallet’s contents—execution was adjusted in real time to maximize extraction.
On Etherscan, the scam’s activity is reflected across three transactions culminating in the extraction of 999,999 USDT. (See: Etherscan transaction.)
Why approval phishing keeps working
Approval phishing is a recurring pattern rather than a new trick. CertiK data cited in the coverage indicates that in 2025 phishing losses totaled $723 million across 248 incidents. The structure of these scams is consistent: social engineering prompts victims to click “approve,” but the approval hands over spending capability to an attacker-controlled contract.
CertiK’s figures are particularly important because they suggest the problem is not isolated. Approval phishing scales well for criminals: once a victim grants token permissions, the attacker can use that permission to drain balances without requiring ongoing interaction from the victim.
Industry-wide, the scale of phishing losses remains high. The article notes that the crypto sector recorded $366 million in phishing losses in the first half of the year, reinforcing that approval-based permission scams are part of a broader wave of onchain fraud rather than a niche threat.
Scammers reuse wallets and permission patterns
The broader risk is amplified when criminals reuse the same infrastructure and wallet targets. Earlier in the month, a separate incident was reported involving a victim losing $1.65 million after connecting to a fake exchange and signing a malicious contract. In that scenario, the approval gave attackers “unlimited access,” enabling an automated sweeper to drain funds, according to researcher Ryan Coleman.
Chainalysis previously reported that onchain scams pulled in at least $14 billion in 2025, with investment scams remaining a dominant category. In Chainalysis materials on approval phishing, the firm explains that approval-based tactics are one way investment fraud moves from social engineering into automated onchain theft.
Chainalysis also cautioned that criminals reuse the same wallets, leverage legitimate approval features from contracts, and employ consistent cash-out routes across victims. That reuse matters for investors and users because it changes what “one report” can mean: when investigators map recurring permission and withdrawal behaviors, it can expose a wider network of coordinated activity rather than a standalone attacker.
Chainalysis senior investigator Renato Bastos is quoted in the underlying coverage explaining that each uncovered report can reveal a broader network because scammers repeat wallet usage and operational paths. Readers should watch for whether similar approval signatures, contract patterns, or draining methods recur across incidents—those repetitions often indicate systematic campaigns.
Address poisoning adds another layer of risk
Phishing token approvals are not the only mechanism used to steal funds. The coverage also points to address poisoning, where scammers create wallet addresses that look similar to legitimate ones and then send small “dust” amounts to those near-matching addresses. When victims copy and paste the address, the dusted lookalike can cause users to send funds to the attacker rather than the intended recipient.
The risk is especially relevant on ecosystems where manual copy/paste workflows remain common. The article notes that MetaMask launched live address poisoning detection in June. That tool compares each pasted address with addresses the wallet has previously interacted with—designed to flag suspicious new or unexpected addresses that match known patterns for deception.
With both approval phishing and address poisoning in play, the common theme is user interaction: scams manipulate what people think they’re signing or sending. Defenses therefore require slowing down and verifying the exact permission or recipient address before proceeding.
What to watch next
Approval phishing incidents like the reported 999,999 USDT theft tend to spread quickly when criminals refine execution and reuse wallet patterns. Users should be alert to any signature request connected to token approvals, avoid rushing through prompts, and consider detection tools—while security teams and onchain analysts will likely continue tracking recurring draining scripts and shared infrastructure to identify campaigns before they expand further.



Crypto-friendly trading platform Robinhood (HOOD) is now registered to offer cryptocurrency services in the U.K.
Robinhood’s U.K. arm was added to the Financial Conduct Authority’s (FCA) list of registered cryptoasset companies as of July 31.
The company’s existing FCA registration means it meets the regulator’s requirements where it comes to anti-money laundering (AML). A regime for crypto firms has been in effect since 2020 and now numbers over 50 approved companies, including Ripple, Kraken and traditional finance (TradFi) giants like BlackRock and BNY.
Winning the regulator’s permission to offer crypto services has added significance ahead of the inception of the more comprehensive framework for crypto regulation in the U.K. The authorization process opens at the end of September and closes at the end of February next year, ahead of the full regime coming into force in October.
The relatively brief window for companies to register and obtain full regulatory approval means those firms already registered under the FCA’s existing regime may have done a lot of the heavy lifting in advance.
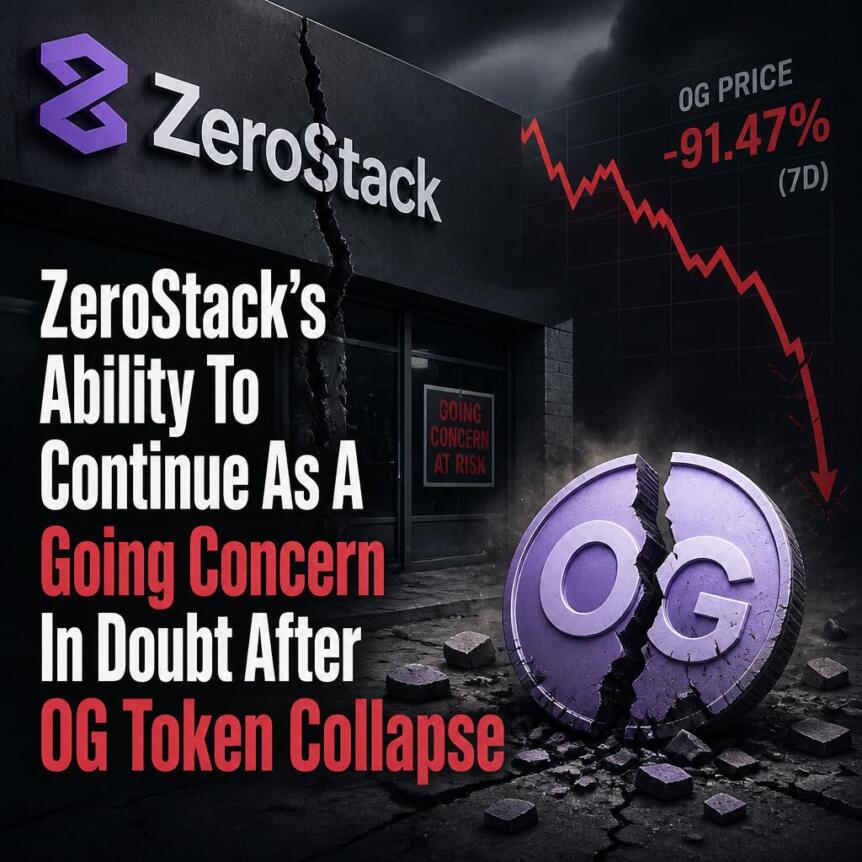
ZeroStack’s plan to fund operations through 0G token reward sales is in jeopardy after a sharp drop in the token’s value. The downturn has also cast doubt on the company’s ability to continue as a going concern.
ZeroStack ended June with a $61.3 million first-half loss, negative working capital, and $2.6 million in cash.
ZeroStack’s Form 10-Q Disclosure
According to its Form 10-Q disclosure for the quarter ending June 30, ZeroStack held $2.6 million in cash, negative working capital of $600,000, an accumulated deficit of $339.1 million, and a $61.3 million net loss. The company also reported an accounting loss of $82.5 million after re-measuring its assets at fair value.
ZeroStack held 75.1 million 0G tokens with a fair value of $15.17 million and a recorded cost of $163.33 million. It also held a small Bitcoin (BTC) position, taking the total fair value of ZeroStack’s holdings to $15.21 million and the total recorded value to $163.43 million.
The downturn in the value of ZeroStack’s 0G tokens represents a 90% decline and has cast serious doubts on the company’s financial stability and its ability to continue operations without securing additional funding.
Staking Reward Sales To Fund Operations
ZeroStack received 6.62 million 0G tokens through staking rewards in the first half of 2026, earning $3.78 million in revenue. The company sold 4.94 million 0G tokens for $2.4 million and used $2.47 million in cash for other operational activities. The company plans to monetize staking rewards and fund operations.
It may also sell some of its underlying holdings. ZeroStack stated in its disclosure that the staked tokens are held in company wallets and can be withdrawn when needed. The company also noted that staking rewards could decline or disappear entirely, and that any sale depended on prevailing market conditions and token value.
However, ZeroStack’s strategy could be at risk due to the significant decline in the 0G token’s value. The token is currently trading at $0.14, declining nearly 5% in the past 24 hours.
Investor Confidence Shaken
ZeroStack’s 0G bet and the subsequent decline in the token’s value significantly impact its investors. The downturn could result in further write-downs, affecting stock price and investor confidence.
Investors will closely monitor ZeroStack’s next steps. The company can raise funds through asset sales, a capital raise, or restructuring efforts. However, its current model could fail if the 0G token’s value continues declining.
ZeroStack’s July 20 acquisition of Texas Blocker increased its 0G token holding to 223.77 million, amplifying its exposure to the token’s downturn.
Disclaimer: This article is provided for informational purposes only. It is not offered or intended to be used as legal, tax, investment, financial, or other advice.


HashKey Exchange said it received approval to open client money accounts with JPMorgan, weeks after it launched customer fund accounts with DBS Bank.
The flaw allowing the exploit traces to a March 2021 firmware build that routed seed generation to a predictable software randomizer instead of the chip’s hardware one, leaving the resulting keys reproducible offline by anyone who works out the range. Coldcard manufacturer Coinkite released emergency firmware for every affected model and told users who had generated a seed on the flawed software to move funds to a wallet address made with a fresh one.
Thorn said he had no direct victim report and published his findings on pattern matching alone, choosing speed over confirmation to warn people while the transactions were still unconfirmed.
If it holds, however, the running total across four waves had reached about 1,816 bitcoin, near $114 million, from more than 5,200 addresses since July 30.

Thorn advised users to check funds, move anything off an affected device and bid the fee up.
The pattern covered blocks 960,778 to 960,792, with 218 transactions hitting 462 victim addresses at a rate of about 14 sweeps per block against 0.3 in a pre-incident control window, roughly 45 times normal.
Each of the spent coins that arrived after the Coldcard firmware boundary, and the destinations were fresh addresses with no prior history, one per victim rather than the shared collectors that made the first two waves easy to map.


Disclosure: This article does not represent investment advice. The content and materials featured on this page are for educational purposes only.
Learn how to choose the best crypto payment gateway for businesses by comparing settlement, compliance, integrations, automation, and fees in 2026.
Companies serving international customers, digital-first audiences, or markets with limited card and bank transfer coverage may use crypto payments to fill the gap. A crypto payment gateway allows a business to accept crypto payments without building blockchain infrastructure internally. The provider can generate addresses, monitor confirmations, convert assets, screen transactions, and route settlements. The key question in 2026 is which provider can support the required assets, jurisdictions, settlement model, compliance process, and volume.
What defines the best crypto payment gateway for businesses?
The best crypto payment gateway for businesses depends on how the payment flow is expected to work.
Supported cryptocurrencies determine which assets customers can use, while blockchain coverage determines the available networks. The same stablecoin may operate on several blockchains with different fees and confirmation times.
The next question is what happens after payment. Some businesses retain crypto, while others convert it into stablecoins or fiat. Settlement options and automatic conversion should therefore be reviewed together. Auto-conversion can reduce volatility exposure and manual exchange work, while fiat settlement can simplify accounting and treasury management. However, availability may depend on the provider, jurisdiction, banking partners, and compliance checks.
Businesses must also decide how the gateway will connect with existing systems through an API, hosted checkout, or payment links. An API provides greater control over checkout logic and transaction handling, while hosted checkout reduces development work. Payment links support invoices and direct sales that do not require a conventional online store. Webhooks complement these methods by sending updates when a transaction is confirmed, underpaid, expired, or refunded.
Security and compliance determine whether the gateway fits internal policies. Relevant controls include KYB onboarding, AML screening, access permissions, withdrawal allowlists, transaction monitoring, and audit records. Transaction histories, exports, and reconciliation reports also reduce manual interpretation of blockchain records.
Finally, businesses need to assess reliability and total cost. Uptime and support affect payment continuity, while a headline fee may exclude blockchain charges, conversion fees, payouts, or fiat withdrawals. Providers should therefore be compared across the complete payment and settlement flow.
Comparison of leading crypto payment gateways
| Provider | Best suited for | Supported crypto | API | Fiat settlement | Auto-conversion |
| PassimPay | International digital businesses requiring multi-chain payments, automation, and several collection or payout methods | 74+ | Yes | Yes | Yes |
| CoinGate | Merchants seeking an established checkout ecosystem, major assets, e-commerce plugins, and scheduled settlement | 10+ core assets | Yes | EUR, GBP, and USD | Yes |
| NOWPayments | Projects prioritizing broad asset coverage, flexible integrations, subscriptions, or mass payouts | 350+ | Yes | Available through fiat processing and withdrawal tools | Yes |
| CryptoProcessing by CoinsPaid | Larger organizations requiring managed payment infrastructure, permanent deposit addresses, exchanges, and batch payouts | 20+ | Yes | Crypto-to-fiat exchange and bank withdrawal | Yes |
The table reflects publicly available product information. Exact availability can vary by jurisdiction, asset, network, account type, and onboarding outcome.
PassimPay overview
PassimPay combines payment acceptance, fund management, conversion, and payout tools in one crypto payment solution. The platform supports more than 74 cryptocurrencies across over 18 blockchains and is available in 122 countries.
Businesses can integrate through a Payment API or use Hosted Checkout when a ready-made interface is more suitable. Payment Links support remote billing, while Static Deposit Wallets provide reusable addresses for account-based deposits. Webhooks connect transaction events with merchant systems.
Beyond incoming payments, Mass Payouts and Batch Transactions support transfers to multiple recipients. Auto Conversion can move received assets into another supported currency, while Fiat Settlement provides an off-ramp for companies that do not want to retain all revenue in crypto. The Merchant Portal includes Transaction History and Reports for tracking and reconciliation.
PassimPay also provides AML Screening, checkout customization, and payment monitoring. It has more than 530 merchants, over 750,000 monthly transactions, more than $4 billion processed, and 99.99% uptime. Fees start at 0.5%, although the final cost depends on the services and transaction flow used.
This feature set suits SaaS, gaming, AI, hosting, e-commerce, and other digital services that need multi-market payments, user deposits, automated updates, conversion, or recurring payouts.
When different providers may fit different business needs
CoinGate may fit companies that value an established merchant ecosystem, e-commerce integrations, core cryptocurrency support, and settlement in major fiat currencies. Its standard plan lists a 1% processing fee and weekly automatic settlement.
NOWPayments may suit projects that prioritize asset breadth. It supports more than 350 cryptocurrencies, API-based payments, subscriptions, payment buttons, custody options, mass payouts, and auto-conversion. Its published service fee is 0.5% for single-currency payments and 1% when conversion is required.
CryptoProcessing by CoinsPaid may fit enterprise-oriented operations that need permanent deposit addresses, payment links, internal exchanges, mass payouts, e-commerce plugins, and crypto-to-fiat withdrawal. Its documentation lists support for more than 20 cryptocurrencies.
PassimPay may fit companies that need multi-chain coverage together with hosted payments, static wallets, automated conversion, fiat settlement, reporting, and payout functions. The final decision depends on the assets, networks, countries, controls, and settlement routes required by the business model.
Conclusion
Selecting the best crypto payment gateway for businesses requires more than comparing supported coins. Companies need to assess integration depth, blockchain coverage, settlement currencies, compliance controls, reporting, uptime, support, and total processing costs.
CoinGate, NOWPayments, CryptoProcessing by CoinsPaid, and PassimPay address different operational priorities. PassimPay stands among the more functionally complete options in this group for international digital businesses requiring multi-chain acceptance, automated fund management, and both collection and payout tools. Still, the appropriate provider is the one that matches the company’s payment flow, risk policy, technical resources, and settlement requirements.
Disclosure: This content is provided by a third party. Neither crypto.news nor the author of this article endorses any product mentioned on this page. Users should conduct their own research before taking any action related to the company.


The Coldcard exploit is not a hack in the way most people understand the word. Nobody broke into anything. Nobody phished anyone. Nobody stole a seed phrase from a sticky note. The devices generated weak private keys for five years, and an attacker figured out how to guess them.
Summary
- Four coordinated attack waves have drained an estimated 1,816 BTC (approximately $118 million) from Coldcard hardware wallets since July 30, with Galaxy Research tracking 5,294 affected addresses and warning that every vulnerable device will eventually be emptied.
- The exploit stems from a firmware build error present since March 2021 that reduced seed entropy from 128 bits to approximately 40 bits on Mk3 devices and 72 bits on Mk4/Mk5/Q models, making private keys guessable through brute force.
- Unlike the FTX collapse, which drove bitcoin off exchanges into self-custody, the Coldcard crisis is producing the opposite flow: users are moving bitcoin back to regulated exchanges and institutional custodians they previously abandoned.
- The net transfer of bitcoin from self-custody wallets to exchange addresses has been positive every day since July 31 according to on-chain flow data, reversing a two-year trend that began after FTX.
- Treasury companies that hold bitcoin through institutional custody, including Strategy and prospective entrants like Evernorth, benefit from a narrative shift that frames self-custody as a risk rather than a solution.
That distinction matters because it strikes at the foundation of the self-custody argument. The pitch for hardware wallets has always been simple: your keys, your coins, no counterparty risk. Coldcard was the gold standard of that philosophy. Air-gapped, open-source, bitcoin-only, endorsed by security researchers and institutional custodians as the most trusted device in the ecosystem.
If the most trusted hardware wallet can ship a five-year entropy bug without detection, the question is no longer whether Coldcard failed. The question is whether any hardware wallet can be trusted as the sole custodial layer for significant bitcoin holdings. And the market is answering that question with its feet.
The exploit in four waves
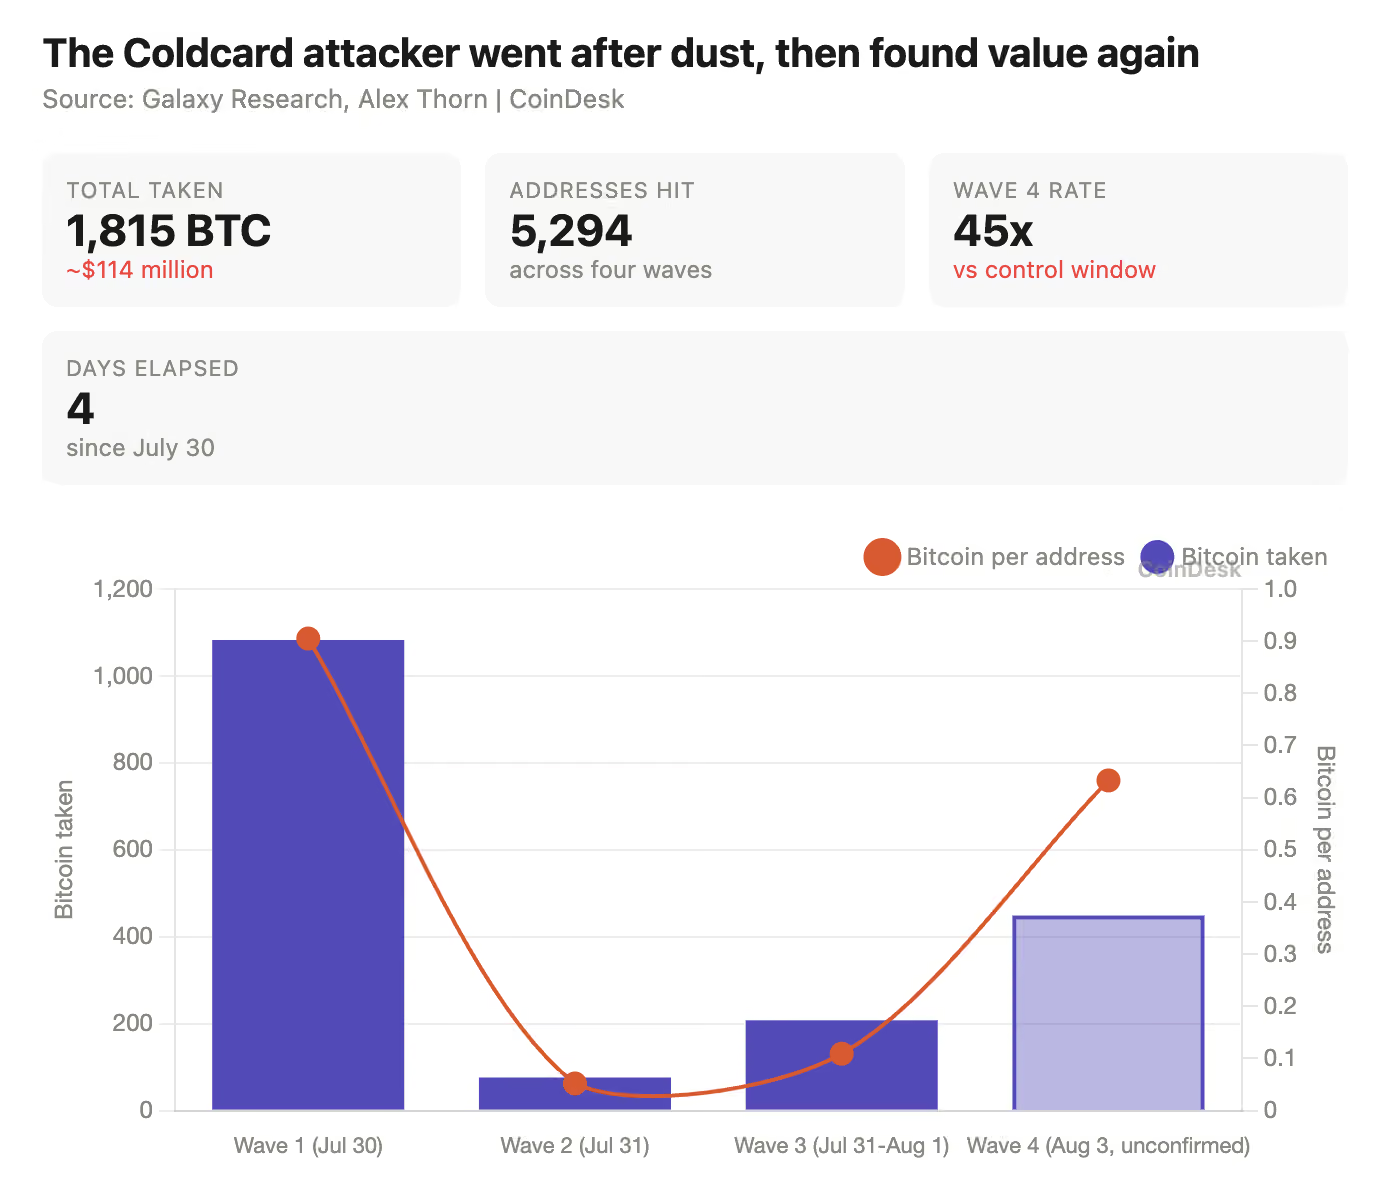
The first wave hit at 2:14 a.m. UTC on July 30. A single entity swept 594 BTC from approximately 500 wallets in 25 minutes. The second wave followed on August 1, draining 284.4 BTC from 2,889 addresses. The third wave hit later that day with 207.73 BTC across a separate address cluster. The fourth wave arrived on August 3, with Galaxy Research’s Alex Thorn identifying 448.7 BTC moving from 709 suspected victim addresses.
The combined estimate stands at approximately 1,816 BTC across 5,294 addresses. Galaxy measures 13.8 sweeps per block during active waves, roughly 45 times the baseline rate. Thorn described the pattern as “LIKELY Coldcard victims” based on unspent output characteristics and transaction behavior. The wording is precise because the attribution comes from blockchain analysis, not device records or law enforcement confirmation.
Coinkite, the Toronto-based manufacturer, traced the problem to a March 2021 firmware change. A preprocessor guard was supposed to select the hardware random-number generator during seed creation. The guard checked whether a configuration setting was defined, not whether its value was correct. The build system selected a deterministic MicroPython fallback instead. The firmware compiled without warnings. Seeds appeared normal. Addresses accepted deposits. Nothing indicated the entropy was catastrophically weak.
On Mk3 devices, the effective search space dropped to approximately 40 bits. A 128-bit seed has more possible combinations than atoms in the observable universe. A 40-bit seed has roughly one trillion combinations. That is within reach of commodity hardware. The Mk4, Mk5, and Q models include additional secure elements that mix their own entropy, producing seeds with approximately 72 bits. Better than 40, but still far below the 128-bit target.
The critical detail: updating the firmware does not repair an existing seed. Every Coldcard owner who generated a seed on affected firmware must create a new seed on patched hardware and migrate their funds. The key itself must be replaced.
The flow reversal: from exchanges to self-custody and back
After FTX collapsed in November 2022, the bitcoin community experienced its most dramatic shift in custodial philosophy. The phrase “not your keys, not your coins” became operational advice rather than a slogan. On-chain data showed a sustained, multi-month transfer of bitcoin from exchange addresses to self-custody wallets. The trend persisted for nearly two years.
The Coldcard exploit has reversed that flow. Net transfers from self-custody wallets to exchange addresses have been positive every day since July 31. The magnitude is not comparable to the post-FTX exodus, which involved hundreds of thousands of BTC over months. The current flow is smaller and more concentrated among users who specifically held Coldcard devices. But the direction of the flow is what matters for the narrative.
The users moving bitcoin to exchanges are not panicking retail investors. Many are technically sophisticated holders who chose Coldcard specifically because it was the most security-conscious option. They are making a rational calculation: the counterparty risk of an exchange is now quantifiable and insured, while the self-custody risk of a hardware wallet with a five-year entropy bug is neither.
That calculation is the narrative shift. Self-custody was supposed to eliminate counterparty risk entirely. The Coldcard exploit demonstrates that self-custody introduces its own category of risk: supply-chain risk, firmware risk, entropy risk, and the risk that the device you trust with your private keys is not doing what its manufacturer claims.
Who benefits: the treasury company model
The companies that hold bitcoin through institutional custody benefit directly from the narrative shift. Strategy, the largest corporate holder with over 550,000 BTC as of its latest disclosure, uses institutional custodians including Coinbase Custody and Fidelity Digital Assets. These custodians use multi-signature arrangements, hardware security modules, and geographic distribution that do not depend on any single device’s entropy quality.
The treasury company thesis is built on the argument that holding bitcoin through a publicly traded company is safer than holding it yourself, more liquid than holding it in a hardware wallet, and more capital-efficient because the company can borrow against its holdings. The Coldcard exploit strengthens the first claim in a way that no marketing campaign could.
Evernorth, the XRP treasury company preparing to list, faces a similar dynamic. Prospective investors who might have preferred self-custody of XRP now have a concrete example of what can go wrong with hardware wallet security. The listing calculus shifts when self-custody carries visible, quantifiable risk.
The broader pattern extends to every institutional custody provider. Coinbase Custody, BitGo, Fireblocks, and Anchorage reported inquiries surging after the first Coldcard wave. The product these companies sell is the elimination of exactly the risk that Coldcard exposed: the risk that a hardware implementation error, invisible for years, can make your private keys guessable.
The insurance gap and what it reveals
The Coldcard exploit has exposed an insurance gap that the industry has not addressed. Regulated exchanges and custodians carry insurance against theft, operational failure, and in some cases, hot-wallet compromise. The coverage limits vary, but the principle is established: if an exchange loses your bitcoin through its own failure, there is a claims process.
Self-custody has no equivalent. If a hardware wallet generates a weak key and an attacker drains the funds, the user has no insurance claim. Coinkite is a private company in Toronto. No product liability framework for hardware wallet entropy failures exists. The affected users can sue, but collecting meaningful damages from a hardware startup is a different proposition from filing a claim against an insured custodian.
The insurance gap is not a new observation, but the Coldcard exploit makes it concrete. A user who lost 10 BTC from a Coldcard has no recovery mechanism. A user who lost 10 BTC from Coinbase Custody would have a claim against the custodian’s insurance. The risk-adjusted comparison now favors institutional custody for any holding above the threshold where insurance matters.
The AI dimension and what it means for future exploits
Coinkite said the attacker used AI to discover the firmware flaw, and that Coinkite’s own AI audit of the same code weeks earlier found nothing. If that assessment is correct, it introduces a new variable into the self-custody risk model.
Hardware wallet security has historically rested on the assumption that open-source code is safer because more eyes can review it. The Coldcard firmware was public for five years. Thousands of developers could have inspected it. Nobody found the entropy bug. An AI model did.
The implication is that the advantage in firmware analysis has shifted from defenders to attackers. If AI can find subtle build-system errors that human reviewers miss, then every open-source hardware wallet is potentially vulnerable to the same methodology. The attacker does not need to find a new type of bug. They need to find a new instance of the same type of bug in a different codebase.
Block, Trezor, and Ledger have confirmed their products are unaffected by the specific Coldcard vulnerability. But “unaffected by this specific bug” is not the same as “provably secure against AI-assisted firmware analysis.” The assurance gap is structural, and the Coldcard exploit is the first public demonstration of it.
The self-custody argument is not dead, but it is wounded
The self-custody philosophy will survive the Coldcard exploit. Multi-signature arrangements that do not depend on any single device, hardware wallets from manufacturers with different codebases, and cold storage practices that incorporate dice rolls for entropy remain valid approaches. Coinkite itself noted that seeds created with at least 50 fair dice rolls are not considered exposed by this RNG issue.
What the exploit has damaged is the simplest version of the self-custody argument: buy a hardware wallet, generate a seed, store it safely, and never worry about counterparty risk again. That version assumed the hardware wallet worked as advertised. For five years, Coldcard did not.
The result is a more nuanced custody landscape. Self-custody for small amounts remains practical. Self-custody for significant holdings now requires either multi-signature setups, multiple hardware vendors, external entropy sources, or regular security audits that most individual holders cannot perform. For holders who cannot or will not take those steps, institutional custody has become the lower-risk option. And that is exactly the argument the treasury companies have been making all along.
What to watch
- Exchange inflow data. If the net transfer from self-custody to exchanges continues beyond the initial Coldcard panic, it signals a durable shift in custody preferences rather than a temporary reaction.
- Coinkite’s liability exposure. Any class-action filing against Coinkite will establish precedent for hardware wallet manufacturer liability. Watch for suits in US and Canadian courts.
- Institutional custodian onboarding numbers. Coinbase Custody, BitGo, and Fireblocks quarterly reports will show whether the Coldcard exploit translated into sustained new business.
- Strategy and Evernorth share price behavior. If treasury company stocks outperform bitcoin in August, the market is pricing the custody-narrative shift into equities.
- New firmware audit disclosures. If other hardware wallet manufacturers commission independent AI-assisted audits and publish results, it signals the industry is taking the supply-chain risk seriously.
Frequently asked questions
How much bitcoin has been stolen from Coldcard wallets?
Galaxy Research estimates approximately 1,816 BTC across four coordinated attack waves affecting 5,294 addresses since July 30. The figure is based on blockchain analysis and has not been confirmed by Coinkite or law enforcement.
Is the Coldcard exploit still ongoing?
Yes. Galaxy identified the fourth wave on August 3 and warned that vulnerable seeds will continue to be drained until affected users migrate to new wallets with fresh seeds on patched firmware.
Does updating Coldcard firmware fix the problem?
No. The firmware update fixes seed generation going forward, but it does not repair seeds already created on vulnerable firmware. Users must generate entirely new seeds and transfer their funds.
Are other hardware wallets affected?
Block, Trezor, and Ledger have confirmed their products are not affected by this specific vulnerability. However, the exploit demonstrates that firmware-level entropy bugs can persist undetected for years in any open-source codebase.
Why are people moving bitcoin to exchanges instead of other hardware wallets?
Regulated exchanges and custodians offer insurance, multi-signature security, and professional monitoring that individual hardware wallets do not. The Coldcard exploit made self-custody risk visible and quantifiable, changing the risk comparison.
Do treasury companies like Strategy use hardware wallets?
Strategy and other institutional holders use professional custodians like Coinbase Custody and Fidelity Digital Assets, which employ multi-signature arrangements and hardware security modules rather than single consumer hardware wallets.
Can affected users recover stolen bitcoin?
Recovery is extremely unlikely. The attacker controls the private keys. Bitcoin transactions are irreversible. Users with unconfirmed transactions may attempt Replace-by-Fee to redirect funds, but this window is narrow and not guaranteed.
Is self-custody still safe?
Self-custody remains viable with proper practices: multi-signature setups across multiple hardware vendors, external entropy from dice rolls, and regular security audits. Single-device, single-signature self-custody for significant holdings now carries documented risk.
Disclaimer: This article is for informational purposes only and does not constitute financial, investment, or legal advice. Loss estimates are based on third-party blockchain analysis and have not been confirmed by the manufacturer or law enforcement. Published August 3, 2026.
Bitcoin slipped below $63,000 on Monday, Aug. 3, even as falling oil prices and stronger U.S. stock futures created a more favorable backdrop for risk assets.
Summary
- Bitcoin fell below $63,000 while oil and Treasury yields declined on renewed Iran diplomacy hopes.
- Coldcard attack estimates now exceed 1,815 BTC across more than 5,000 suspected victim addresses overall.
- Spot Bitcoin ETFs lost $61.53 million last week, ending three consecutive weeks of net inflows.
- Strategy added Bitcoin’s 200 week average as prices hovered only modestly above the indicator Monday.
- A Senate delay left the CLARITY Act without scheduled floor action before the August recess.
BTC traded near $62,556, down 1.38% over 24 hours and 4.35% over seven days. It had reached a Sunday high near $63,650 before sellers regained control. Ether fell about 1.8% to $1,841, while XRP and Solana also declined.
The weakness came as investors assessed renewed U.S. talks with Iran, another suspected Coldcard attack wave, fresh spot Bitcoin ETF outflows and the absence of the CLARITY Act from Monday’s Senate schedule.
Bitcoin price fails to follow the broader relief trade
President Donald Trump canceled a planned military strike on Iran and said negotiations would seek to address Iran’s nuclear program and reopen the Strait of Hormuz. Brent crude fell to about $83.28 per barrel, while West Texas Intermediate dropped to $79.47.
Nasdaq futures rose about 0.8%, while S&P 500 futures gained 0.6%. Treasury prices also strengthened as lower oil reduced some of the inflation concerns created by disrupted energy supplies.
Bitcoin did not follow that move. The divergence does not prove that one crypto event caused the decline. However, it shows that lower oil and stronger equity futures were not enough to overcome the pressures already affecting digital assets.
The relative weakness is consistent with a possible rotation of speculative capital toward technology stocks. Price action alone cannot confirm that movement, but renewed activity in equities can reduce demand for crypto when traders have several competing sources of volatility.
Coldcard losses keep security fears in focus
Galaxy Research head Alex Thorn identified what he described as a “LIKELY” fourth organized wave affecting Coldcard generated addresses. His updated estimate covered 709 potential victim addresses and 448.7 BTC. Activity reached 13.8 sweeps per Bitcoin block, about 45 times the rate measured during an earlier control period.
Galaxy had previously mapped three suspected waves involving 1,367.05 BTC across 4,585 addresses. Adding the latest estimate produces a possible total of 1,815.75 BTC across 5,294 addresses, assuming the groups contain no overlap.
That total remains an onchain estimate. Coinkite, law enforcement agencies and individual wallet owners have not independently confirmed every address as a victim. Galaxy has also not established whether one attacker controlled all four waves.
The incident concerns seed generation in affected Coldcard firmware rather than a failure in Bitcoin’s network or transaction cryptography. Coinkite said some devices created seeds with less randomness than intended, allowing attackers to search a smaller range of possible keys.
Coinkite has released corrected firmware for each affected model. However, installing an update does not repair an existing vulnerable seed. Users must generate a new seed with corrected firmware and transfer their funds. The company said its investigation remains ongoing.
As crypto.news previously reported, Thorn also identified similar transactions waiting in the mempool. Some users may be able to replace an unconfirmed attacker transaction with a higher fee transfer, although success is “not guaranteed.”
ETF outflows and the CLARITY delay add pressure
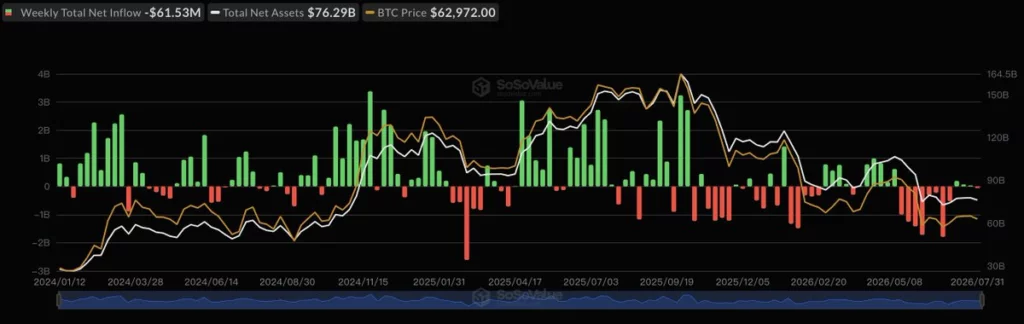
U.S. spot Bitcoin ETFs recorded about $61.5 million in net outflows from July 27 through July 31, based on SoSoValue data. The result ended three consecutive weeks of net inflows.
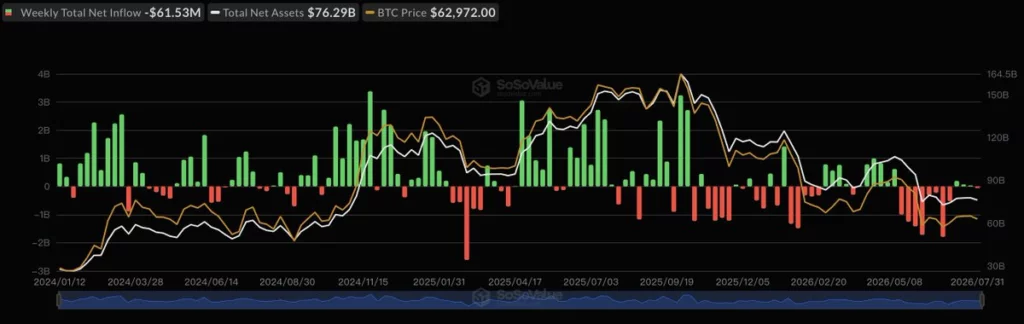
The final session caused most of the weekly reversal. Funds lost a combined $265.4 million on July 31. BlackRock’s IBIT recorded $122.7 million in withdrawals, while Fidelity’s FBTC lost $54.8 million and Grayscale’s GBTC posted $52.6 million in outflows.
The flows do not show whether investors expect further price declines. They do show that regulated fund demand weakened as Bitcoin moved closer to long term support.
Political uncertainty added another concern. Monday’s official Senate schedule included a vote on a spending measure but no action on the Digital Asset Market Clarity Act. The chamber’s published cloture records also showed no petition for the legislation.
As crypto.news reported, leaders would ordinarily need to file cloture by Wednesday, Aug. 5, to hold a possible Friday vote on proceeding to the bill. Such a vote would not constitute final passage.
The absence of scheduled action cannot be identified as the direct cause of Bitcoin’s decline. Still, it removes a possible near term policy catalyst while traders await a clearer Senate timetable.
Bitcoin price now faces a $60,000 support test
The supplied daily chart shows Bitcoin struggling below the $63,000 to $65,000 range. Momentum has weakened, with the relative strength index at 42.65 and below its moving average of 50.40.
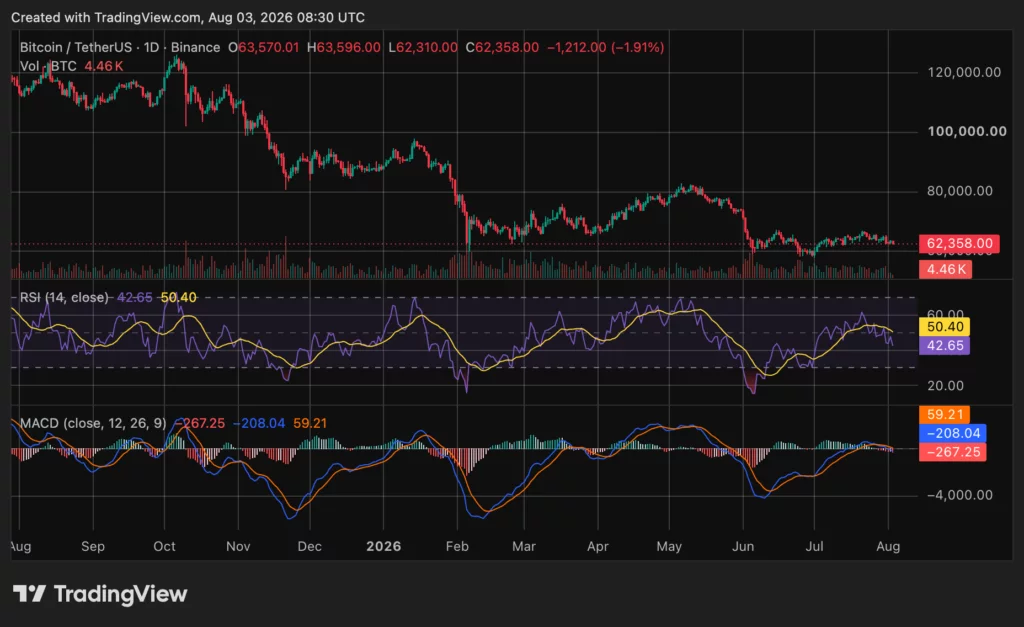
The MACD histogram has also turned negative. A sustained move below $60,000 would weaken the current structure, while a recovery above $65,000 to $66,000 would provide stronger evidence that buyers have regained control.
Strategy founder Michael Saylor said the company had begun tracking Bitcoin’s 200 week moving average and its premium to that level. He said Bitcoin had remained above the average 92% of the time since the indicator became available. The percentage reflects Strategy’s calculation rather than an independent market study.
The next checkpoints are Coldcard’s technical review, Monday’s ETF flows and any Senate filing before Wednesday. Until those pressures ease, lower oil prices and stronger stock futures may remain insufficient to produce a lasting Bitcoin rebound.
Disclosure: This article does not represent investment advice. The content and materials featured on this page are for educational purposes only.
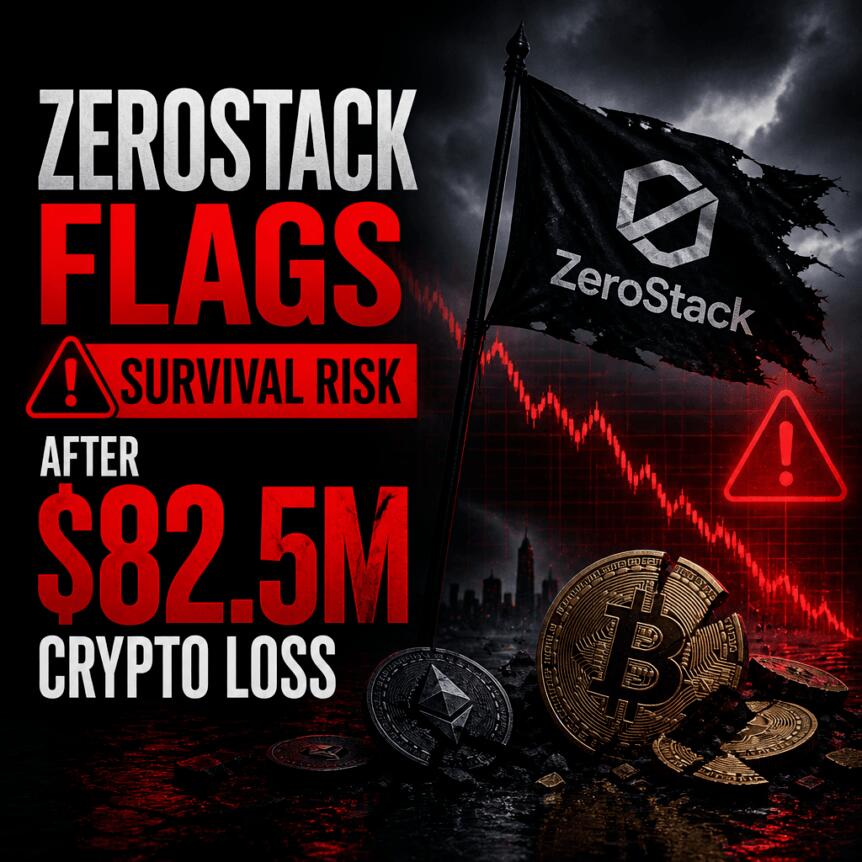
Nasdaq-listed crypto treasury company ZeroStack has raised serious questions about its financial runway, warning in a recent SEC filing that “substantial doubt” exists about whether it can keep operating for the next year. The assessment marks a sharp reversal from its view just a quarter earlier, highlighting how dependent the company’s plan is on staking income and the liquidity of its Zero Gravity (0G) token.
In a Form 10-Q filed with the U.S. Securities and Exchange Commission on Friday, ZeroStack reported $2.6 million in cash and negative working capital of $600,000 as of June 30, along with an accumulated deficit of $339.1 million. The filing also detailed a major unrealized drag from its token treasury: an $82.5 million fair value loss on digital assets and a net loss of $61.3 million for the first half of 2026.
Key takeaways
- ZeroStack now says there is substantial doubt it can continue operating over the next year, reversing its earlier “sufficient” outlook in a prior filing.
- As of June 30, the company held 75.1 million 0G tokens, valued at $15.2 million versus an aggregate cost of $163.3 million (about 91% below recorded cost).
- The company relies on staking rewards and sales of 0G tokens to fund operations, making its cash position sensitive to token price and trading liquidity.
- ZeroStack reported $3.8 million in staking revenue in the first half of 2026, but it also recorded significant losses and could not conclude that its planned funding steps fully remove going-concern risk.
SEC filing flags going-concern risk
ZeroStack’s latest filing is notable not just for its headline loss figures, but for the governance and risk signal it sends to investors. Management stated that it could not conclude its plans would be enough to eliminate doubts about whether the company can continue as a going concern over the next year.
The company’s balance sheet underscores the pressure behind that conclusion. With $2.6 million in cash and negative working capital of $600,000 at June 30, ZeroStack’s near-term flexibility appears limited. It also reported an accumulated deficit of $339.1 million, reflecting losses that have compounded over time.
Beyond liquidity, the filing shows the company is carrying a large unrealized impairment in its digital asset treasury. ZeroStack disclosed an $82.5 million fair value loss on digital assets during the period, alongside a net loss of $61.3 million for the first half of 2026.
A treasury strategy tied to 0G’s market
ZeroStack’s operating model depends heavily on 0G token performance and the token’s market depth. The company reported that it holds 75.1 million 0G tokens with an aggregate cost of $163.3 million and a fair value of $15.2 million as of June 30. Put differently, the holdings were valued about 91% below their recorded costs.
That gap matters for both accounting and funding. If the company intends to finance operations through token sales—especially during periods of weak liquidity—its ability to raise cash could be constrained even if balances appear large on paper. The company explicitly linked its funding capacity to both the 0G price and trading liquidity, according to the filing.
ZeroStack’s management also described reliance on staking rewards and token sales. In practice, staking income can provide periodic cash flow, but it may not be sufficient in periods when token markets are illiquid or when valuations fall further.
Staking revenue helps—yet the runway question remains
During the first half of 2026, ZeroStack reported $3.8 million in staking revenue. After validator commissions, the company said it earned about 6.6 million 0G tokens from staking activity.
To support expenses, ZeroStack sold nearly 4.9 million 0G tokens for $2.4 million over the same period. The filing indicates that these cash inflows—staking-related and sale-related—are central to its ability to pay forecast operating costs.
ZeroStack also said that, if needed, it could sell some of its treasury holdings. However, management’s conclusion did not fully reassure the markets: it said it could not determine that those actions would be enough to address going-concern doubts.
The tension here is straightforward. When a company’s main treasury assets have experienced steep valuation declines, the theoretical ability to raise cash by selling holdings can become less effective in the real world—particularly if market pricing and liquidity do not support the volume and proceeds management may be counting on.
Backtracking from earlier filings
Perhaps the most consequential element of the news is the reversal in ZeroStack’s assessment. In its first-quarter Form 10-Q filing, the company stated that its cash and staking rewards would be sufficient to meet its working capital requirements and obligations for at least another year.
In the most recent filing, it no longer reaches that conclusion and instead flags substantial doubt about continued operations over the next year. The shift suggests that circumstances changed—or that management’s confidence in the sustainability of its funding plan weakened as results and valuations evolved.
ZeroStack’s corporate background also provides context for how the company arrived at this point. The filing notes that the company was previously Flora Growth, a cannabis and CBD products firm. On Sept. 19, Flora announced $401 million in funding for a 0G treasury strategy, including $35 million in cash and equivalent commitments and more than $366 million in in-kind digital assets. The company later rebranded as ZeroStack and retained its Nasdaq listing.
Those details underline why investors are likely to focus on token treasury outcomes: the strategy is fundamentally designed to monetize staking and manage liquidity through sales. When 0G’s fair value diverges sharply from recorded cost, the difference can translate into both accounting losses and real constraints on financing flexibility.
What readers should watch next is whether ZeroStack provides further clarity on how it plans to balance staking, token sales, and liquidity needs—particularly given its much narrower margin for error after the “substantial doubt” disclosure. Investors will also likely track changes in 0G trading conditions, since the company’s own filings tie its funding outlook directly to token price and market liquidity.

Ripple has expanded its digital capital markets strategy. The company announced today investments in Zilo and Lucuido – two firms that are focused on developing infrastructure for tokenized funds and institutional asset trading.
The move builds on existing partnerships with both firms. Ripple did not disclose the size of either investment.
Speaking on the matter was Nigel Khakoo, SVP, Trading and Markets at Ripple, who said:
“… ZILO and Licuido provide core capabilities that are essential to further scaling this shift: regulated digital transfer agency infrastructure and liquidity for issuance and collateral mobility. This is just the beginning of the journey, and we see a substantial opportunity to bring huge efficiencies to the investment sector over the next decade.”
ZILO provides transfer agency and fund administration technology. Its systems give asset managers and custodians regulated digital records for tokenized share classes. Licuido, on the other hand, operates an FCA-regulated platform that supports the issuance, distribution, trading, and use of traditional assets as digital collateral.
Ripple plans to integrate these capabilities with its infrastructure on the XRP Ledger. The company wants institutions to issue tokenized assets, hold them in custody, move them between investors, and use them as collateral without relying on legacy systems.
Naturally, RLUSD will serve as the regulated cash component for delivery-versus-payment transactions. This structure is designed to allow the asset and payment sides of a trade to settle together on XRPL.
The investments also support Ripple’s recent push to build a broader institutional platform around tokenization, payments, stablecoins, and trading. Last month, the firm launched Ripple Mint and made an investment in compliance provider Notabene. This strengthens the infrastructure that’s available to institutions using RLUSD.
It’s also noteworthy that the company has worked with Aviva Investors, Franklin Templeton, and DBS on tokenized fund and collateral projects. Ripple said that ZILO and Licuido will help turn those individual partnerships into infrastructure that asset managers can use at scale.
The post Important Ripple (XRP) Announcement, New Investments: August 3 appeared first on CryptoPotato.


The crypto exchange stopped accepting new registrations from Japan residents and will begin progressively restricting existing accounts on Nov. 1.

Robinhood wins UK crypto registration ahead of new regulatory regime commencing

Burnham re-appoints former Israeli Supreme Court clerk as justice minister

Braves get RHP Tyler Mahle from Giants for RHP Anthony Molina


-

 Business5 days ago
Why Trees Belong on the Risk Register
-

 Fashion3 days ago
Weekend Open Thread: Wit & Wisdom
-

 Politics3 days ago
Meta enters AI-training agreement with far-right ‘propaganda rag’ Newsmax
-
 Entertainment6 days ago
‘Stargate’ Creator’s New Sci-Fi Series Returns for Season 3 Tomorrow
-

 Politics7 days ago
Luke Littler dismantles Gerwyn Price to retain title in Blackpool
-
 Crypto World2 days ago
MicroStrategy Post-Earnings CLARITY Act Push Could Add New Catalyst for Its Stock
-

 Politics6 days ago
The Part of the Electric Transition Nobody Wants to Discuss
-

 Business5 days ago
Major shareholder moves on Canyon
-

 Crypto World2 days ago
XRP Ledger v3.3.0 brings five institutional features
-

 News Videos4 days ago
Bitcoin Enters the 3rd Stage of the Bear Market
-

 Crypto World5 days ago
Kraken Enables Retail Access to Jersey Mike’s IPO via Tokenized Shares
-

 Tech6 days ago
New macOS Sequoia & Sonoma security updates for older Macs
-

 Politics4 days ago
Luke Littler’s dominance sparks GOAT debate
-

 News Videos6 days ago
Claude: Build Financial Dashboards in Minutes (2026)
-

 Business5 days ago
Johnson & Johnson agrees to $5.5B settlement over talc cancer claims
-

 Sports3 days ago
Seema Kaliramna Wins Discus Throw Bronze, Takes India’s CWG Medals Tally To 17
-

 Crypto World24 hours ago
Crypto PAC spending tops $2M in Michigan House race
-

 Business3 days ago
Trump Announces Hamas Disarmament Agreement as Iran Strikes Kuwait Air Base and US Attacks Pause Overnight
-

 Tech5 days ago
Gemini can now summarize the messiest comment threads in Google Docs
-

 Tech1 day ago
ESET tracks rise in malicious AI skills and adaptable malware
You must be logged in to post a comment Login